
Abstract
We presently have little information about how frequently police officers shoot citizens or are involved in any sort of interaction in which citizens die. Despite this, however, researchers persist in using the limited data available on fatal police violence in various sorts of analyses. The current article outlines the liabilities in available counts of fatal police action, describes some of the problems posed by using such data, discusses why counting citizens killed by police bullets is not a sound way to measure deadly force, and offers some ideas for improving measurement of the use of deadly force and other police actions that lead to the death of citizens.
That law enforcement officers carry firearms with the express legal authority to use them in the course of their duties gives the police a power over life and death that is unique in the American criminal justice system (Bittner, 1970; Fyfe, 1982; Geller & Scott, 1992). Recognizing this, the National Research Council’s Committee to Review Research on Police Policy and Practices recently stated that “[t]here is no more important piece of data regarding police behavior than that on the exercise of lethal force” (Skogan & Frydl, 2004, p. 157). Despite this, we know next to nothing about how often American police officers exercise their prerogative to use deadly force.
Studies from previous decades provided detailed information about shooting patterns in individual agencies (e.g., Fyfe’s 1978 examination of New York City Police firearms discharges and Geller and Karales’ (1982) similar work regarding the Chicago Police Department). Except for work of this sort, which extracts internal data kept by individual law enforcement agencies, we have no sound, empirically grounded, idea of how many people across the nation are shot at by police officers, how many are struck by police bullets, or how many of the individuals who are shot die from the wounds they suffer. While some national data sources on deaths at the hands of the police do exist, the counts they contain are notoriously inaccurate (Fyfe, 2002; Klinger, 2008; Loftin, Wiersema, McDowall, & Dobrin, 2003; Sherman & Langworthy, 1979; and below) and—by definition—provide absolutely no information about police firearm discharges that do not cause fatal injury.
Because we do not have sound national data on police shootings we are not able to answer simple empirical questions such as, “How often do American police officers discharge their firearms at citizens?” “How many citizens are struck by bullets fired by American police officers each year?” And, “How many citizens are killed by police bullets in the United States each year?” It also means that we cannot track how police use of deadly force varies at the national level from year-to-year (or any other temporal unit), comprehensively compare its use between jurisdictions (or any other spatial aggregate) across the nation, or seek to empirically identify the correlates and determinants of police shootings across time and space in the United States.
Despite the fact that sound national data do not exist, researchers have persisted in using “official” counts of fatalities at the hands of the police as a measure of deadly force by American police officers, including in studies that seek to explain variability in deadly force usage across time and space (e.g., Jacobs & Britt, 1979; Jacobs & O’Brien, 1998; Smith, 2003; 2004; Sorensen, Marquart, & Brock, 1993). 1 This later tradition of research is especially troubling because it produces findings about the correlates of deadly police violence that are of dubious validity. The remainder of this article is devoted to outlining the liabilities of “official” death counts as indicators of deadly force and other deadly police action across the United States, describing and demonstrating the problems inherent in using any count of citizens killed by the police to measure deadly force usage, and presenting some ideas about how to develop a data collection program that will provide valid and reliable nationwide information about police firearm usage and police-involved deaths of citizens in the United States.
“Official” Data on Deadly Police Action
There exist three sources of data with national reach that have some relevance to the construct “police use of deadly force.” The first data source is the National Center for Health Statistics’ (NCHS) National Vital Statistics System (NVSS), which keeps records on “deaths by legal intervention,” a mortality category that is intended to capture homicidal deaths caused by law enforcement personnel. Academics have long noted the weakness of the NVSS “deaths by legal intervention” data as an indicator of citizen death at the hands of police officers in the United States, however. Three decades ago Sherman and Langworthy (1979), in the first academic analysis of the adequacy of NVSS data, compared NVSS counts of police-caused deaths for a sample of states and counties with counts from other sources (e.g., data generated by law enforcement agencies) for the years 1970 to 1976 and found that the NVSS figures grossly underreported citizen deaths at the hands of police officers, perhaps by as much as 51% nationwide. Based on this finding, they concluded that the Vital Statistics data do not provide an “adequate basis for arriving at accurate national estimates of the number of citizens killed by police officers each year” (p. 34). Sherman and Langworthy also compared city-level police-caused homicide counts in the NVSS data with figures kept by a small number of individual police departments. This exercise likewise disclosed substantial discrepancies between the two data sources, which led the two researchers to conclude that NVSS data should not be used to “compare police homicide rates from one particular city to another” (p. 34).
Sherman and Langworthy (1979) briefly mentioned a second federal data source that includes counts of police-caused homicide in the United States: the Supplementary Homicide Report (SHR) program administered by the FBI’s Uniform Crime Reporting (UCR) section, which includes counts of “justifiable homicides” by law enforcement officers. They devoted little attention to SHR counts of killing by police officers, however, “because of the FBI’s reservations about the quality of th[e]se data” (p. 14).
In 2003, Loftin et al. presented the results of a comparative analysis they conducted of NVSS and SHR counts of police-caused homicides for the 23-year period 1976 to 1998. Among the key findings they reported were that (a) both the NVSS and SHR programs undercount the number of homicides committed by America’s police officers each year, (b) the NVSS reported fewer police-caused deaths each year than did the SHR (with a total of 1,974 fewer deaths—6,684 versus 8,658—over the years in question), and (c) while yearly national SHR counts were consistently higher than NVSS counts, in many states (more than half) the NVSS data counted more police-caused deaths than did the SHR system during the 23-year study period. 2 After noting these key points, Loftin et al. stated that “at present reliable estimates of the number of justifiable homicides committed by police officers in the United States do not exist” (p. 1121).
In 2003 the U.S. Bureau of Justice Statistics (BJS) started collecting information about deaths caused by police officers as part of a program designed to track citizen mortality while in state custody. Known as the Death in Custody Reporting Program (DCRP), this undertaking seeks to count every citizen death—no matter the cause—that occurs at any point in the criminal justice process, starting with police efforts to catch suspects. Suspect deaths caused by the actions of police officers are counted as a part of what the DCRP refers to as “Arrest-Related Deaths.” In 2007, BJS published a document that, among other things, reported the number of police-caused deaths that the DCRP had tabulated for the years 2003 to 2005 (Mumola, 2007).
One aspect of the discussion of this information was a comparison of the number of arrest-related deaths in the DCRP data with the number of justifiable homicides by police officers recorded in the FBI’s SHR for each of the 50 states and Washington, DC. There are remarkable differences between the two data sets across the majority of the 51 units of analysis. Take the nation’s most populous state, for example. California’s SHR figures count a total 352 justifiable homicides by police officers for the 3 years in question (i.e., 2003-2005), while the DCRP data show just 160. As Klinger (2008) concluded in a previous discussion of the data presented in Mumola’s (2007) report, the lack of correspondence between the DCRP and SHR figures indicates that the DCRP should not be viewed as a reliable indicator of deaths caused by police officers.
To summarize about previously published studies of national-level data on citizen deaths at the hands of U.S. police officers, the available evidence indicates that none of the three data collection systems provides counts of police-caused deaths that researchers should trust. Despite this, however, some researchers might be tempted to use one (or more) of these data sources to measure deaths caused by police action. Indeed, as noted above, some researchers persist in using the SHR data for this very purpose—despite all of the ink that has been previously spilt in attempts to dissuade scholars from doing so (e.g., Fyfe, 2002; Geller & Scott, 1992; Skogan & Frydl, 2004). In an attempt to drive a stake through the heart of the notion that available data on police caused deaths provide sound indicators of the construct “police-caused deaths,” the rest of this section presents data that further demonstrates the inadequacy of extant national level police-caused homicide statistics.
Since Mumola (2007) presented the SHR and DCRP counts of deaths at the hands of American police officers for the years 2003 to 2005, both BJS and NCHS have released their counts of deaths caused by American police officers for 2006 (i.e., the DCRP and NVSS statistics, respectively). Because the FBI’s SHR data on justifiable homicides by police officers is also available, 3 this provides an opportunity to examine a 4-year series of police-caused death counts (i.e., 2003-2006) across the three currently available “official” data sources. As shown in Table 1, none of the three data sources contain the same counts for any of 4 years in question. On the other hand, some of the counts for some of the years are quite close (particularly in 2004, when the high count was 372 and the low was 367) and the differences between the three data sources for all 4 years are not too substantial; the greatest being that the NVSS count (1,643) is 12% higher than the SHR count (1,468).
“Official” Counts of Police-Caused Deaths in United States, 2003-2006
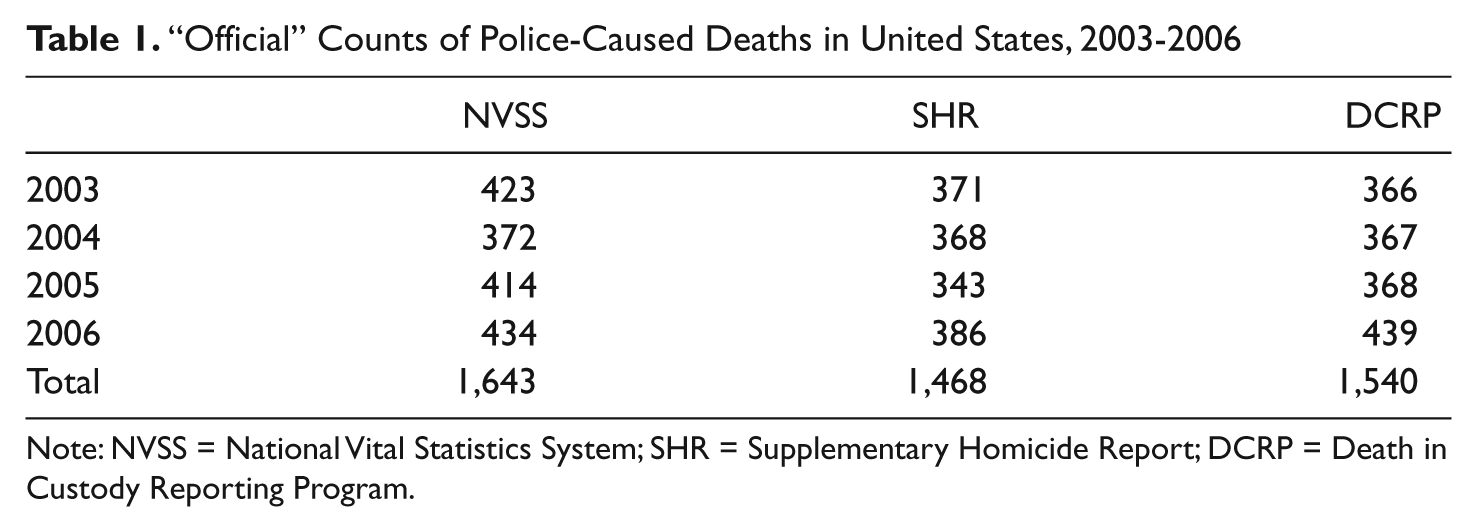
Note: NVSS = National Vital Statistics System; SHR = Supplementary Homicide Report; DCRP = Death in Custody Reporting Program.
While one might be tempted to take from this information the opinion that the observed similarities indicate that the three sources are providing at least somewhat sound measures of police-caused deaths across the nation, thorough consideration of the matter indicates that this is not the case. First, recall that Loftin et al. (2003) demonstrated that substantial differences at the state level between SHR and NVSS counts are masked in data that is aggregated at the national level. Second, recall that Klinger (2008) pointed out that the same phenomenon is operative where DCRP numbers go, with state-level DCRP numbers often varying wildly from those found in the SHR. A look at the numbers in the three data sources for the most populous state in the nation illustrates this problem.
Table 2 above presents NVSS, SHR, and DCRP numbers for California for the four years in question. Perhaps the most striking aspects of the table are the differences between DCRP and SHR death counts for the first 3 years, where each year the SHR numbers are more than 100% higher than the DCRP numbers and the total death count for the 3 years combined in the SHR are 120% higher than in the DCRP (352 vs. 160). Another striking aspect of the table is that the NVSS counts are consistently lower than the SHR counts, with the SHR count for the entire period in question being almost a third higher (31%; 476 vs. 363). A final aspect of the table worth noting is the substantial jump in DCRP recorded deaths for 2006 over previous years; from an annual average of just 53 for 2003 to 2005, to 114 in 2006.
“Official” Counts of Police-Caused Deaths in California, 2003-2006

Note: NVSS = National Vital Statistics System; SHR = Supplementary Homicide Report; DCRP = Death in Custody Reporting Program.
This massive jump is apparently due to the extensive outreach efforts that BJS personnel working on the DCRP made to individuals and agencies in California who are responsible for reporting information to BJS. BJS was well aware of the remarkable differences in DCRP and SHR death counts in California (and other states as well) for 2003 to 2005 and worked diligently to identify possible reasons for the discrepancies. Once they realized that a sizable portion of the problem resided in a lack of clarity among those responsible for reporting deaths in custody about precisely what sorts of incidents should be reported to BJS, DCRP personnel developed and executed a plan to clarify matters. 4 The sizable increase in the number of deaths counted in the DCRP from 2005 to 2006, along with the narrowing of the gap between SHR and DCRP death counts from 60 in 2005 to 10 in 2006, indicates that these efforts yielded substantial gains. While this narrowing of the gap is welcome, it is clear that the DCRP numbers still lag behind those found in the SHR.
Given that the SHR numbers typically provide the highest counts of death at the hands of the police, some might be tempted to view the SHR as providing the best and therefore an acceptable, count of police-caused deaths in our nation’s most populous state. This would be a mistake; for a quick look at some unpublished data shows that the SHR data provide grossly inaccurate counts of police-caused homicides in California.
As noted above, one way that previous research established the inaccuracies in official counts of deaths at the hands of the police is by comparing such counts with data on citizen deaths kept by local police agencies. A look at SHR figures and internal data kept by the two largest law enforcement agencies in California shows that the validity problem in “official” counts of police-caused deaths first identified by Sherman and Langworthy in 1979, and tracked by Loftin et al. (2003) through 1998, is still alive and well in the current century.
Table 3 displays data relevant to citizen deaths at the hands of Los Angeles city police officers (LAPD) and Los Angeles County sheriff’s deputies (LASD) for the years 1996 to 2008. The column titled “LAPD Internal” contains data from the LAPD’s Use of Force Section on the annual number of citizens shot dead by LAPD officers. The column titled “LASD Internal” contains data from the LASD’s Homicide Division on the number of citizens fatally shot in each of these years by LASD deputies. The columns titled “LAPD SHR” and “LASD SHR” contain data from the SHR program on the number of citizens who were reported to have died at the hands of LAPD officers and LASD deputies, respectively. 5
Comparison of LAPD and LASD Internal Counts of Citizens Killed by Officer/Deputy Gunfire and FBI (SHR) Counts of Justifiable Homicides, 1996-2008

Note: LAPD = Los Angeles Police Department; LASD = Los Angeles County Sheriff’s Department.
A quick glance at the “Totals” at the bottom of each column of Table 3 shows that the “official” SHR figures are substantially lower than those kept by each agency; 128 versus 193 for the LAPD (difference = 65; 34% lower) and 56 versus 147 for the LASD (difference = 91; 62% lower). A second notable aspect of the table is that the size of the gap between the internal and SHR figures varies wildly from year to year and across the two agencies. The largest single-year gap for the LASD was 16, which occurred in 1997 when agency records indicate that deputies fatally shot 18 people and the SHR records indicate that LASD deputies killed just 2 citizens. The smallest gap for the LASD occurred in 2007, when the SHR contains just one fewer death than does the LASD internal data. Where the LAPD is concerned, the largest gap is found in 2005, when internal records recorded 10 more deaths than did the SHR (11 vs. 1); the smallest differences occurred in 2000, 2007, and 2008, when the numbers were off by just one. Given the overall and year-by-year differences between “official” SHR and internal counts, it is clear that the SHR figures do not provide accurate counts of deaths at the hands of the police in the two largest law enforcement agencies in California (which also happen to be among the five largest in the United States).
Further consideration of the matter indicates that the problems with SHR data regarding the LAPD and LASD have substantial consequences beyond the bounds of Los Angeles. SHR data show a total of 1,427 justifiable homicides by police officers in the state of California during the years 1996 to 2008. We know from the internal records kept by the LAPD and LASD that this figure undercounts the number of citizens killed by California police officers by at least 156 during these years (i.e., 65 for LAPD plus 91 for LASD). Because internal numbers on fatal police shootings from the several hundred California law enforcement agencies besides the LAPD and LASD are not readily available, we have little notion of the full scope of the police-caused death undercount in the California SHR data; only that at minimum, it averages well over 10 per year.
Given the information presented in the preceding paragraphs, it should be clear that presently available “official” counts of deaths at the hands of American police remain deeply flawed. Before moving on, one final point on the utility of “official” counts of police homicides as indicators of deadly force usage by police officers is in order. It is a simple one: Citizens die at the hands of the police via means besides law enforcement gunfire; in incidents in which officers deploy TASERS, in situations in which officers strike citizens with batons, in altercations in which officers do nothing more than grapple with suspects, and so on (Ho et al., 2009). Because the previously discussed numbers supplied by the LAPD and LASD count the number of people fatally shot by members of the respective departments, the previously discussed undercounts likely underestimate the extent to which SHR data are off the mark in Los Angeles, in California, and the rest of the country as a count of citizens who expire as the result of interactions with police officers. Conversely, it is possible that the numbers recorded in “official” counts of police-caused homicides for some jurisdictions are limited to nongunfire deaths, or include some combination of deaths from both police gunfire and other causes. 6 Whatever the case might be on this point, it is clear that “official” counts of police-caused deaths do not provide a sound measure of citizens killed by police gunfire (or, for that matter, of citizen deaths caused by any sort of police action, including firearms discharges by officers).
What Fatal Gunshot Injuries Miss About the Use of Deadly Force by Police Officers
Even if we had sound counts of the number of citizens killed by police gunfire in the United States, we would still be missing a substantial aspect of the picture regarding the use of deadly force by American police officers; for most police bullets fired don’t kill anyone (e.g., Geller & Scott, 1992). First, in many instances when police officers discharge their weapons at suspects, all of their shots miss the intended target. Second, when officers’ bullets do find their mark, a sizable portion of people struck survive their wounds. As James Fyfe (1978) noted more than three decades ago in his groundbreaking dissertation on deadly force in policing, the critical question when studying police shootings is the pulling of the trigger, not the ultimate result of bullet(s) that are thus fired. As he put it,
Deadly force is physical force capable of or likely [emphasis in original] to kill; it does not always kill. The true frequency of police decisions to employ firearms as a means of deadly force, therefore, can best be determined by considering woundings and off-target shots as only fortuitous variations of fatal shootings. All are of a kind. (p. 32)
While (as one might by now suspect) there exists no sound information about how many times police officers in the United States fire their guns and hit no one, there is some—albeit limited—sound information on instances in which citizens suffer nonfatal gunshot wounds. Some police agencies keep internal records regarding police shootings that include both the number of citizens who die from police gunfire and the number who suffer nonfatal gunshot wounds. Data of this sort provide some sense of the scope and nature of that component of deadly force that is missed by counts of citizen fatalities from police gunfire. Consider the data in Tables 4 and 5 below, which present information about citizens struck by police bullets in our nation’s two most populous cities for the 35-year period 1974 to 2008. 7 If we put aside the fact that the tables do not contain any information about instances in which police fired and missed, a brief examination of the data on citizens killed and nonfatally wounded by New York and Los Angeles police gunfire in recent decades illustrates the weakness of using citizen deaths to measure police deadly force usage.
Citizens Struck by NYPD Gunfire, 1974-2008
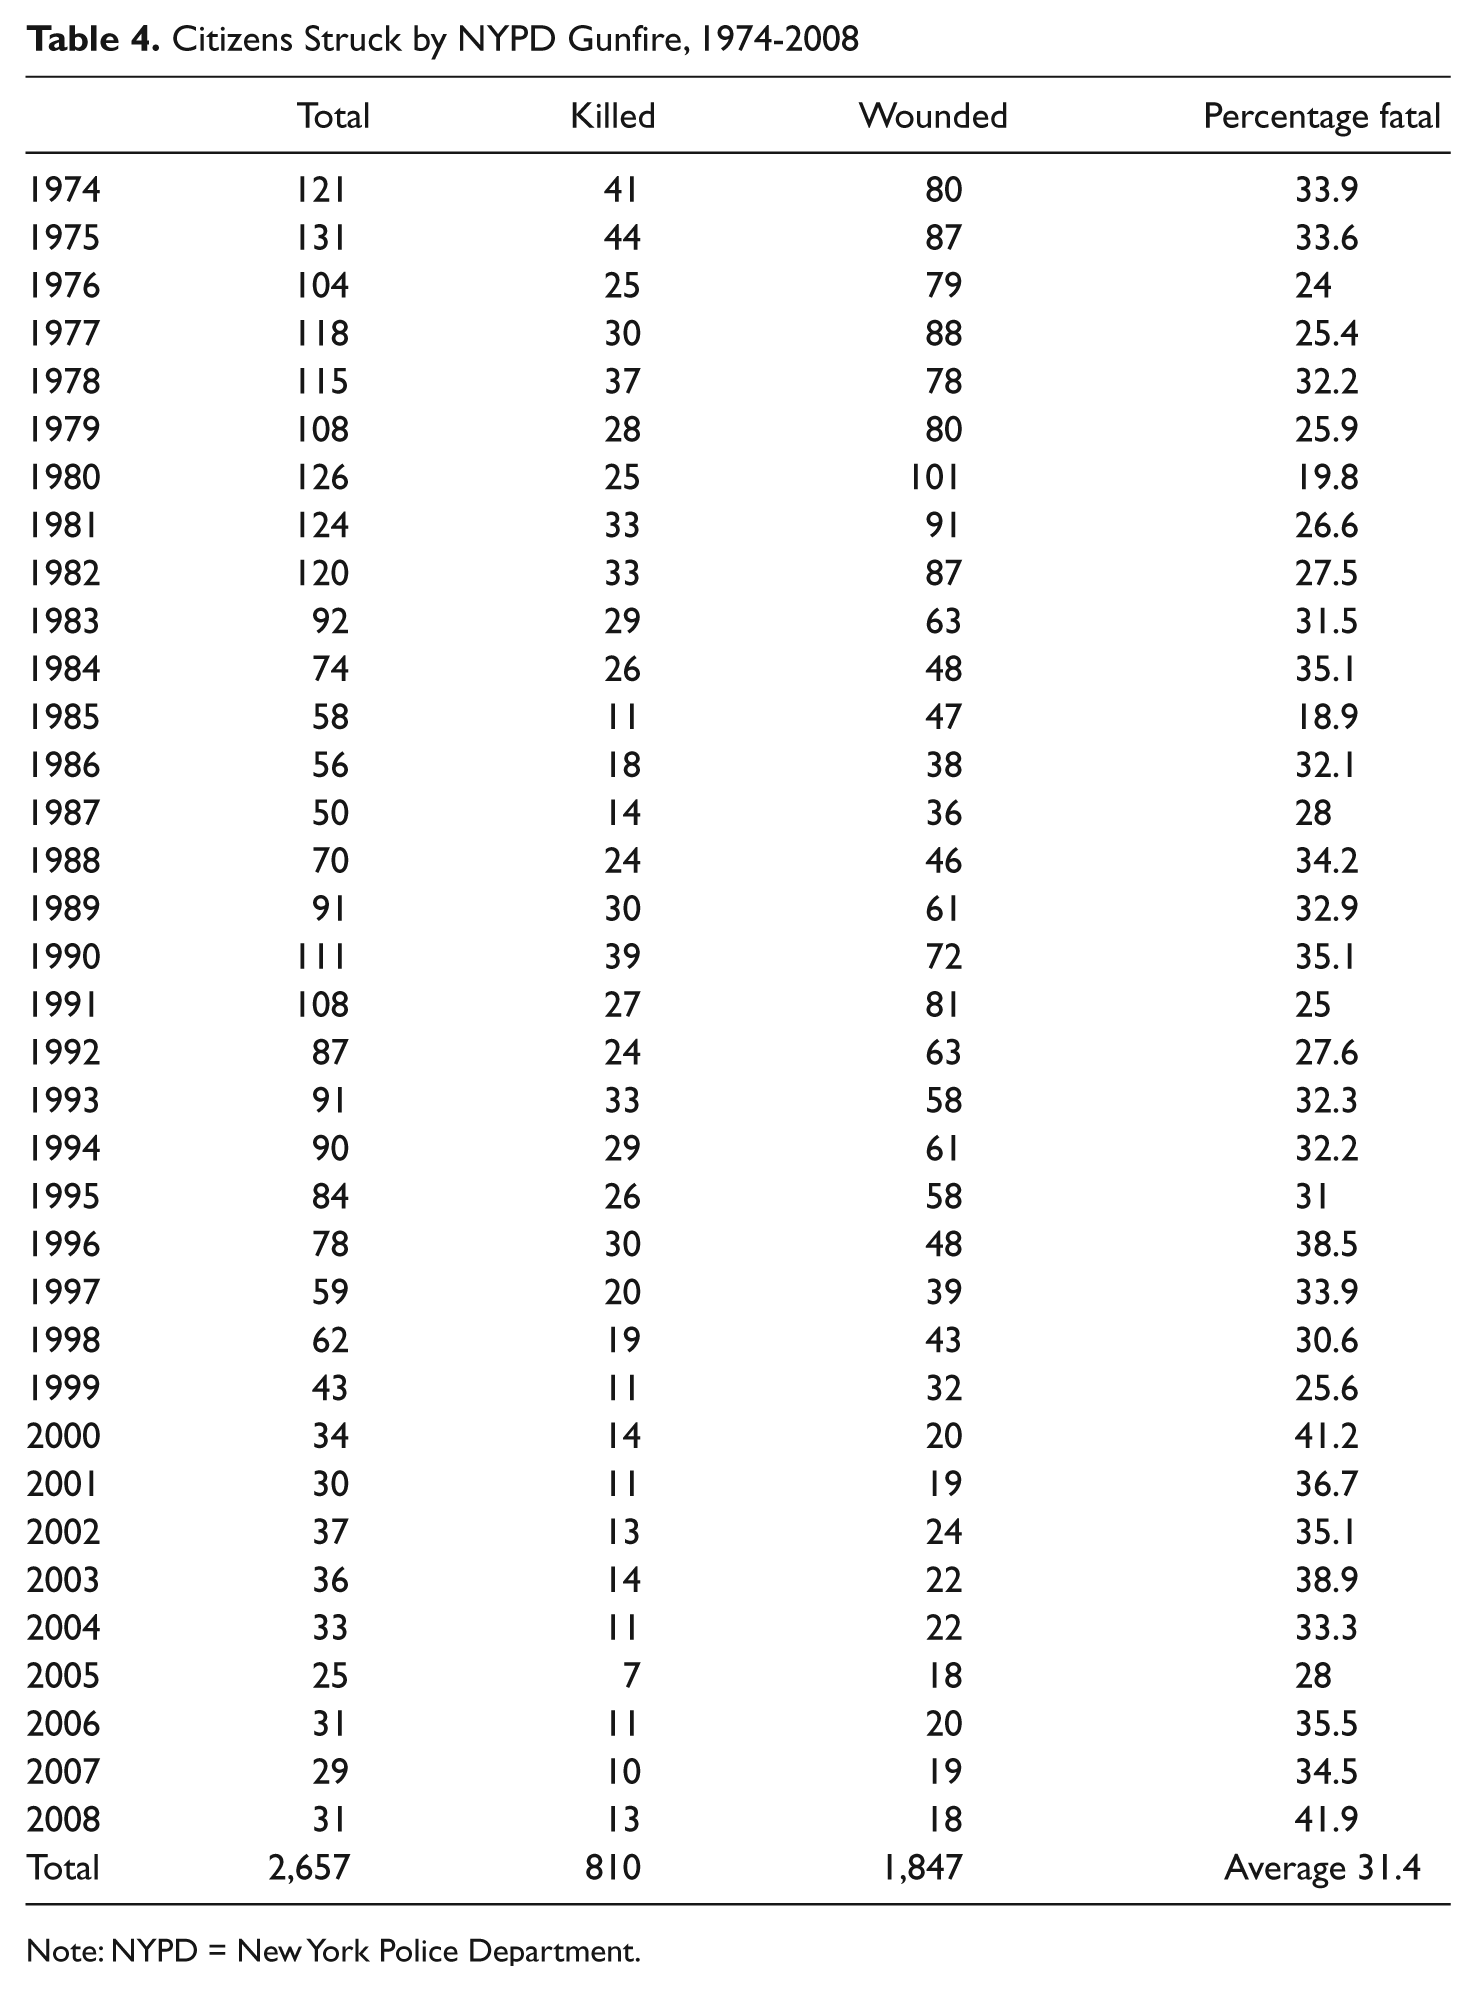
Note: NYPD = New York Police Department.
Citizens Struck by LAPD Gunfire 1974-2008
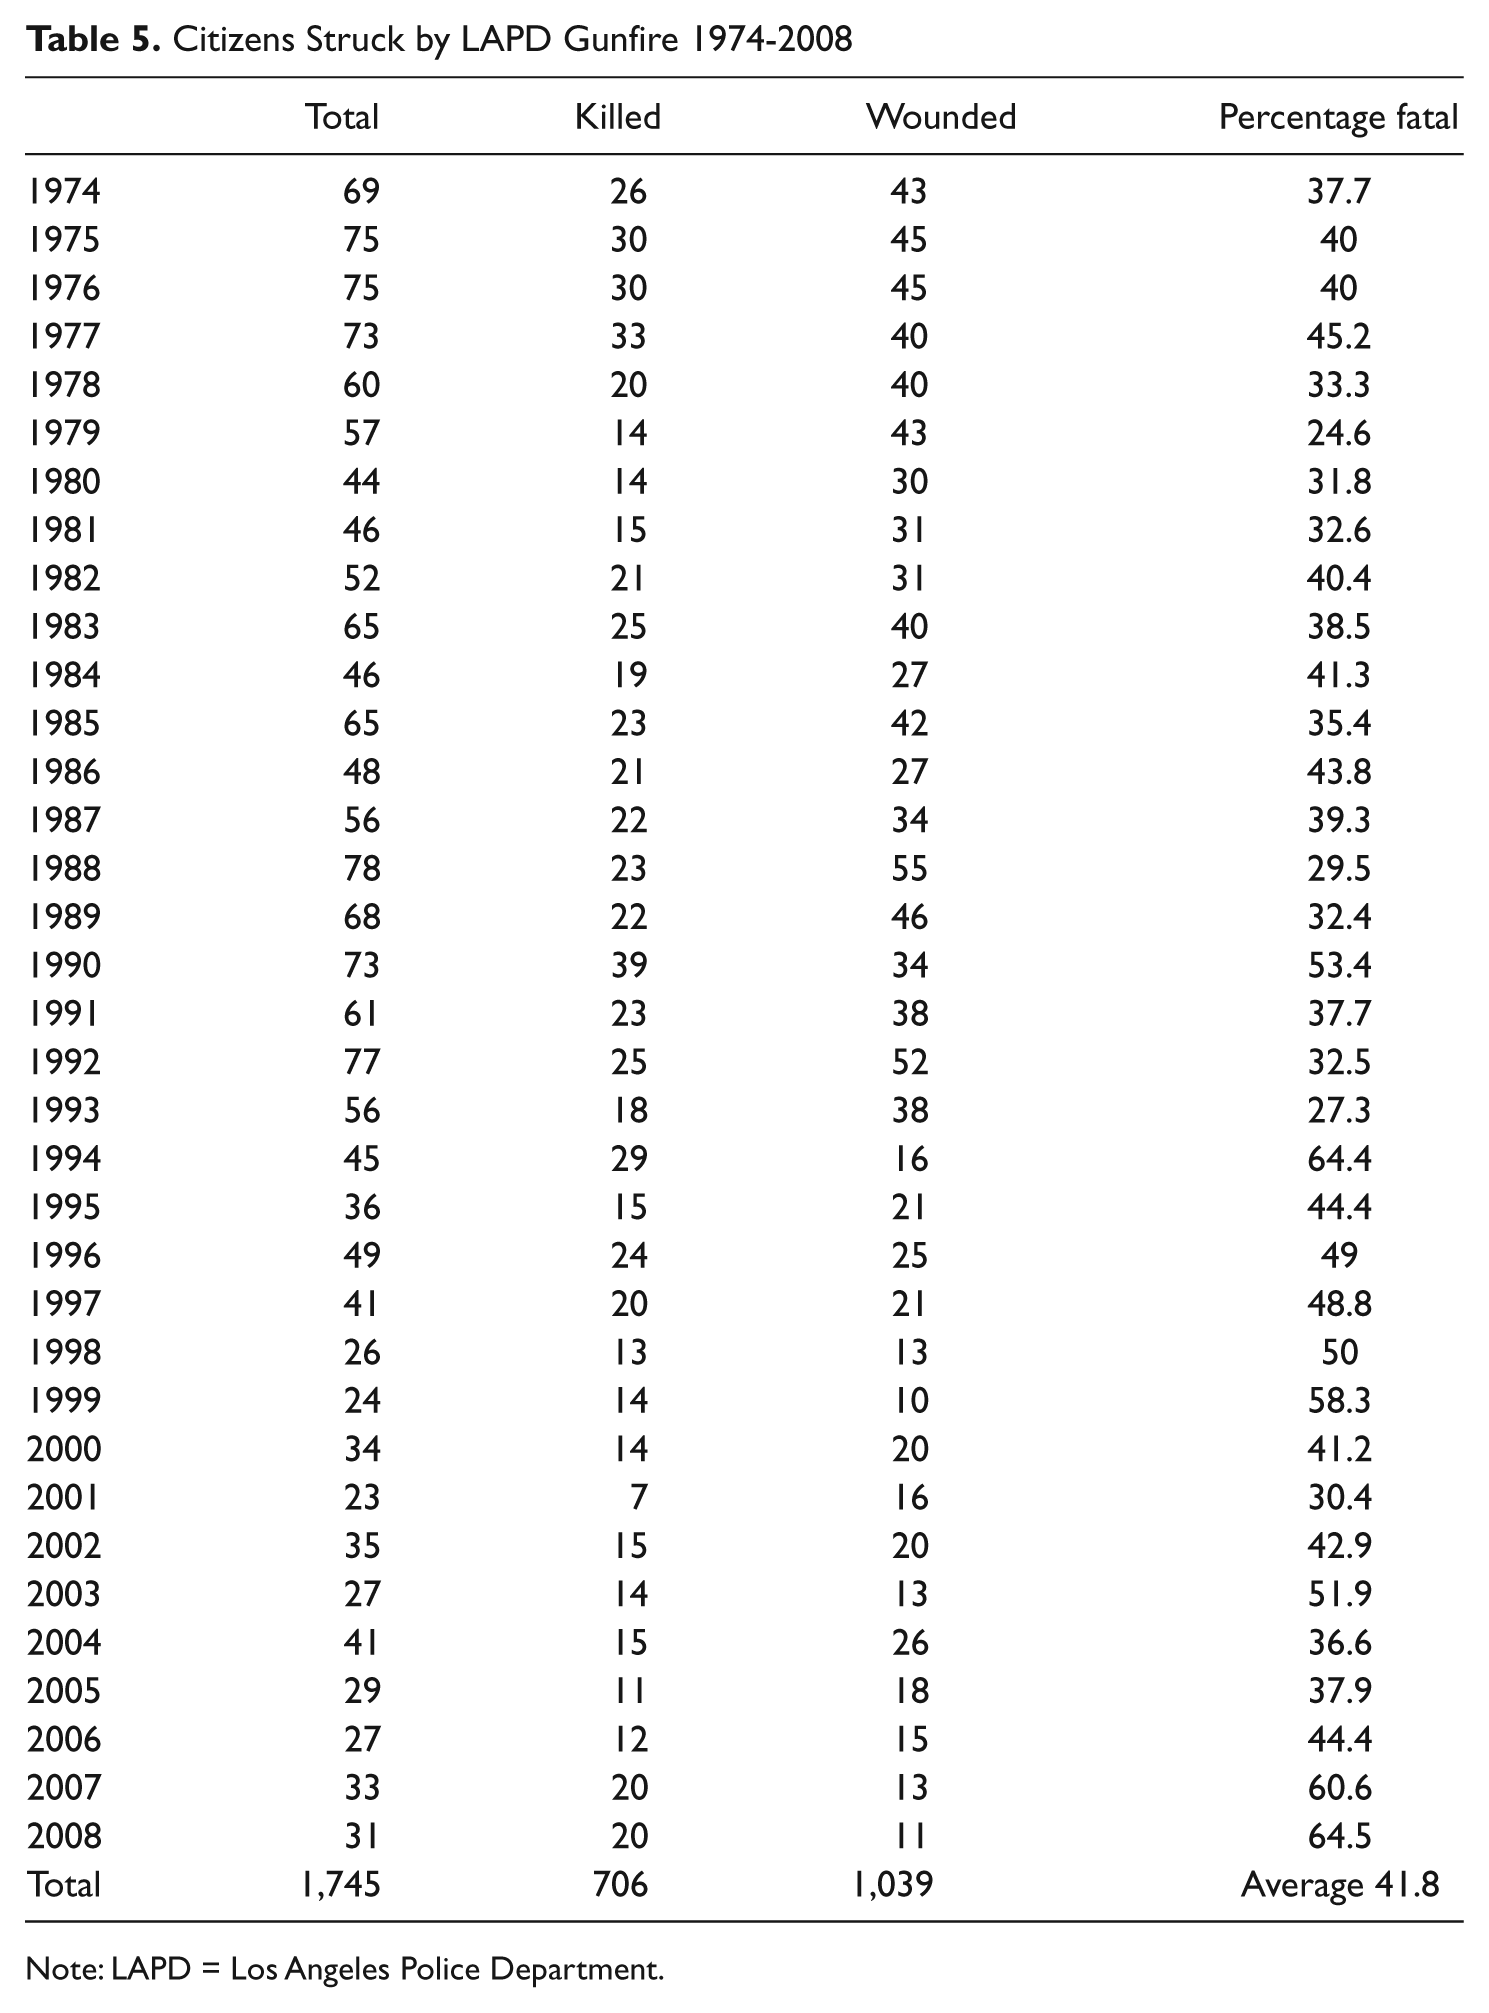
Note: LAPD = Los Angeles Police Department.
An initial point worthy of note in Tables 4 and 5 is that in both cities for the 35 years in question most of the citizens who were shot did not expire; 31.4% of citizens shot by NYPD officers died, while 41.8% of those shot by LAPD officers perished. 8 A second key point is that the proportion of citizens struck by police bullets who suffered fatal wounds varied substantially from year to year in each city. In Los Angeles, the fatality rate varied from a low of 24.6% (in 1979) to a high of 64.5% (in 2008), while in New York the rate ranged from 18.9% (in 1985) to 41.9% (in 2008). Figure 1 demonstrates in graphical fashion both the differences between the two cities and the variability in each city over time.
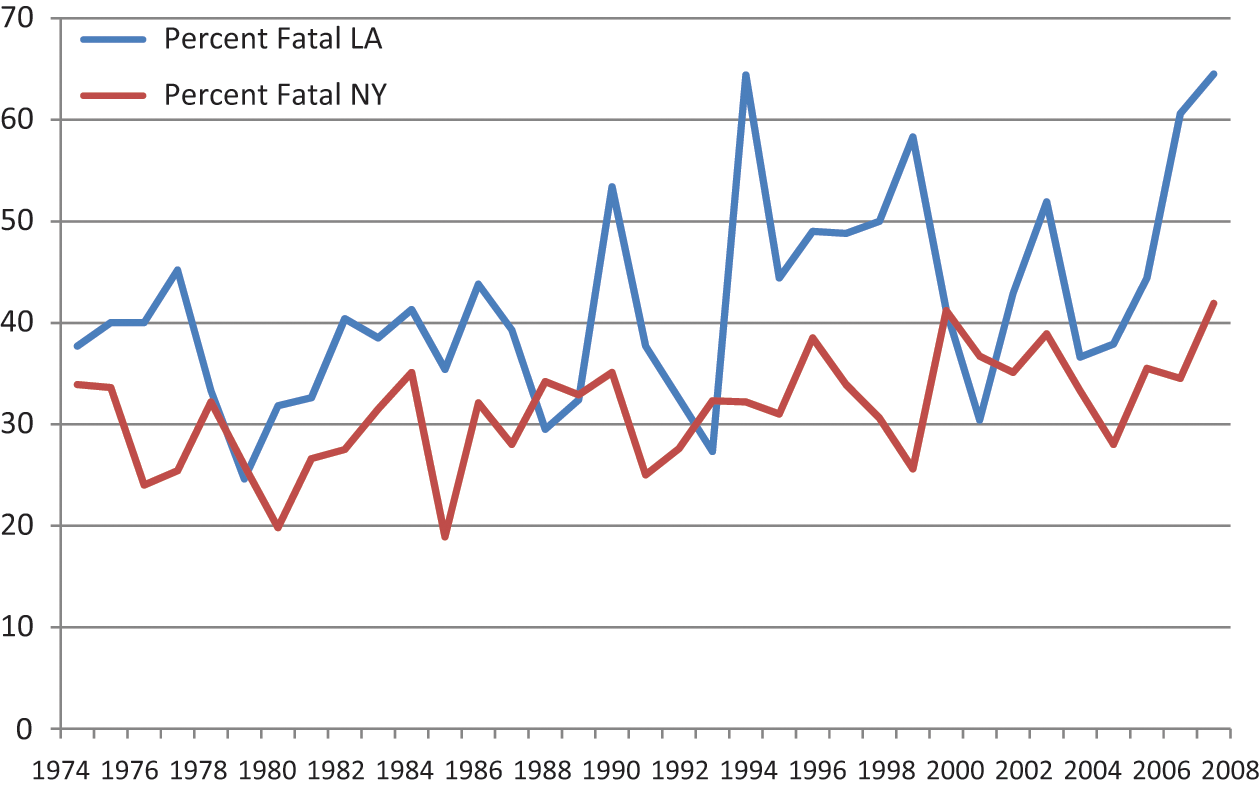
Percentage of persons struck by LAPD and NYPD gunfire who died, 1974 to 2008 (LAPD average 41.8%, NYPD average 31.4%)
The two key points noted above illustrate just how dicey it is to use the number of citizens killed by police bullets as an indicator of police gunfire. First, because the percentage of citizens shot who succumbed to their wounds during the 35 years in question is nearly one-third higher in Los Angeles, using the number of suspects killed by police bullets to compare police shootings in the two cities would present a misleading picture; one that would depict New York as having relatively fewer shootings in comparison to Los Angeles than is actually the case. 9 In a similar vein, the substantial year-to-year changes in the proportion of citizens shot who died in each city identify a serious problem with using citizen deaths to track changes in police gunfire usage across time. 10 With the proportion of persons struck by police gunfire who die in a given year varying by more than 100% in each city across the three-and-half decades in question (i.e. a high/low of 41.9%/18.9% in New York and 64.5%/24.6% in Los Angeles), it is clear that using deaths to chart temporal changes in the use of police firearms is not sound practice. That the average New York and Los Angeles fatality rates appear quite different (i.e., 31% vs. 42%) strongly suggests that the use of a citizen death measure in any analysis seeking to explain spatial variation in deadly force usage is likewise highly problematic.
Discussion
The problems that flow from using citizen deaths by police bullets to measure deadly force almost certainly extend beyond the borders of our nation’s two largest cities. This is so because the proportion of citizens shot who suffer fatal injuries from police bullets in jurisdictions besides New York and Los Angeles almost certainly varies substantially from one year to the next, as well as over longer periods of time (e.g., the last 35 years). Moreover, it would be dubious to assume that Los Angeles has the highest and New York the lowest police shooting “kill ratios” in the United States. Indeed, data from earlier decades found substantial variability in death rates within given agencies over time and identified agencies with kill ratios both lower than New York and higher than Los Angeles (Geller & Scott, 1992). 11
Thus, even if we did have sound counts of the number of citizens killed by police bullets in each U.S. law enforcement jurisdiction, comparative analyses using such data would run the risk of yielding results that are not reflective of the true relationships between police gunfire and other factors of interest (e.g., community violence, poverty levels, racial/ethnic composition, and so on). That is, when examining potential community-level predictors, we might well be misled into believing that some specific factor(s) are not associated with police shootings when analyses using the more comprehensive measure of all persons struck by police gunfire would indicate that they are. Conversely, it is also possible that the opposite would hold; that is, it could well be that some posited predictors would be significantly correlated with citizen deaths from police gunfire, while these factors would not be significantly associated with a measure of deadly force that includes all citizens struck by police bullets. Finally, it is also possible that any measured significant associations that are reflective of actual associations in the underlying relationships are stronger or weaker than those that actually obtain. In sum, the patterns evident in the New York and Los Angeles data presented above strongly suggest that even if sound counts of the number of citizens killed by police bullets were widely available, the results of any research that used such data to establish the determinants of variation in deadly force usage would be highly suspect. 12
The analysis of the Los Angeles and New York data does not shed any direct empirical light on whether James Fyfe’s (1978) contention about how to properly conceptualize and measure police shootings matters in the realms of comparative analysis and analyses seeking to identify the determinants of deadly force usage. Recall that he asserted that misses, woundings, and fatal injuries from police bullets are merely different outcomes of the same police decision to pull the trigger and that, therefore, deadly force in police work should be thought of and measured in terms of incidents in which officers discharged firearms, not whether police bullets wound or kill anyone. While the information needed to directly assess the empirical importance of Fyfe’s assertion using the Los Angeles and New York data sets (i.e., counts of shootings in which no citizens were hit over the 35 years in question) is not available, consideration of the available data in light of some other information indicates that Fyfe’s contention is indeed important.
Research from earlier decades found substantial variability both over time and across agencies in the portion of incidents in which police officers discharge their weapons that any police bullets strike citizens. Geller and Scott (1992) report, for example, that LAPD shooting hit rates dropped from 56% for the years 1974 to 1979 to 28% from 1980 to 1988 and that hit rates among big cities in 1991 varied from a low of 25% (Memphis) to a high of 100% (San Antonio and San Francisco). Given the notable differences in the portion of citizens struck by police bullets who died in New York and Los Angeles—both across time within each jurisdiction and between the two locales over the entire time series—there is every reason to believe that a measure of total shootings would likewise vary notably from one that simply counts dead citizens. Unless and until evidence comes to light showing that the numbers reported by Geller and Scott were incorrect, the patterns they reported, coupled with the findings from New York and Los Angeles, provide strong evidence that using citizen deaths by police bullets to measure police gunfire is indeed suboptimal for conducting analyses that seek to track changes in shooting patterns over time, to compare shooting rates across jurisdictions, or to assess the correlates of deadly force usage.
In a similar vein, the scrutiny of the three “official” counts of citizen deaths at the hands of the police shows that none are sound indicators of what they seek to measure. Quite simply, what the various analyses presented herein showed about the liabilities of the numbers kept by the National Vital Statistics System, the FBI’s Supplementary Homicide Report system, and the BJS’s Death in Custody Reporting Program demonstrates that none of these sources provide valid data on police-caused deaths. Particularly telling in this regard was what the numbers from the LAPD and LASD showed about the scope of error in SHR death counts; the “official” measure used most often in criminological research that addresses deaths at the hands of the police (e.g., Jacobs & O’Brien, 1998; Smith, 2003, 2004; Sorensen et al., 1993). It is worth noting that research of this ilk typically aggregates SHR death counts for several years (e.g., Jacobs & O’Brien used the 7-year period 1980-1986). In this regard, the LAPD and LASD data show that aggregation does not solve the measurement error problem; no matter what 7-year period one might use from 1996 to 2008, discrepancies between agency and SHR counts always abound.
In sum, independent of the matter of how to properly measure police firearms usage, evidence presented in this article demonstrates that what previous research (e.g., Fyfe, 2002; Loftin et al., 2003; Sherman & Langworthy, 1979) disclosed about liabilities in “official” counts of citizens killed by police action in the 1970s, 1980s, and 1990s holds true in the 21st century. That is, NVSS and SHR numbers remain grossly inaccurate and those in the new DCRP are no better.
With it clearly established that all three “official” counts of police-caused deaths contain substantial errors and that counting police deadly force usage by citizen deaths is highly problematic, “Where should we go from here?” The first thing we should do is recognize that the findings of research using NVSS, SHR, or DCRP data to measure fatal police violence are of dubious validity. Academics continue to uncritically cite studies that have used NVSS and SHR data as evidence of research that has established the determinants of police behavior. 13 This should stop. It is simply not sound practice to favorably cite studies that are rooted in data that have been repeatedly demonstrated to be deeply flawed. Instead, those who wish to cite such studies should note the limitations inherent in the work so that readers are aware of them. Second, researchers should no longer blindly use NVSS or SHR data as indicators of deadly police action in any sort of work that seeks to explain variation in violent police behavior, account for the effects of such behavior on some other factor(s), 14 or otherwise presuppose the validity of these measures. It is simply not sound practice to continue to conduct analyses with data that is known to be deeply flawed without carefully examining the weaknesses of the measures, considering the implications of the weaknesses, and alerting readers to both the weaknesses and their implications. Third, researchers should steer clear of the extant DCRP Arrest Related Deaths data. Due to the overwhelming evidence that counts of police-caused deaths in the DCRP are wildly inaccurate, it would be a mistake to start down any sort of inquisitorial path with DCRP figures as one’s indicator of lethal police action.
Conclusion
The foregoing is not intended as a call to stop conducting research on deadly police action and the use of deadly force by police officers. For, as the NRC report noted at the outset of this article stated, the use of deadly force by the police is a critical issue. Rather, the preceding critique is offered in the hope that the field might work to develop better nationwide measures of both deaths at the hands of the police and of police firearms usage.
One possible place to start such work might be to expand the scope of the DCRP to capture detailed information about all citizen deaths related to police action in the United States. The Arrest-Related Deaths component of the DCRP is intended to do this, and BJS is currently seeking to expand the resources devoted to this component of the DCRP to improve its scope and reach (BJS, 2010). This will likely be no simple matter, however, if the challenges that the DCRP program has faced thus far are any indicator. One of the reasons the aforementioned differences between SHR and DCRP police-caused death counts exist, for example, is that some states did not participate in the DCRP. Unless all states participate, future DRCP counts will—by definition—be lacking so far as having true national scope. Another challenge facing the DCRP is that participating states have based the numbers reported to BJS on different data sources; some, for example, used police agency counts and others used information from medical examiner or coroner offices. Ensuring that death counts from different sorts of public bureaucracies (with different orientations to the subject at hand) are valid and reliable will likely take a good deal of effort. In sum, expanding the DCRP to the point where it will yield sound data on police violence has multiple hurdles to overcome.
One important issue that could be addressed should BJS succeed in its efforts to develop detailed information about all citizen deaths related to encounters with the police is the nature of police involvement when citizens are fatally injured. Because, as previously noted, citizens die in a variety of sorts of encounters with police officers in which they are not shot (e.g., Ho et al., 2009), it would be helpful to know the sorts of circumstances in which citizens die so that we could begin to develop some sense of the prevalence of various sorts of police-involved citizen death. It may be, for example, that deaths from police actions that are not intended to seriously harm citizens occur more frequently than we currently suspect, that certain sorts of putatively nonlethal police actions are more likely to be involved in deaths than others (e.g., Tasings vs. baton strikes), and that different sorts of deaths are related to different exogenous factors. With better data, we might be able to get sound empirical handles on issues such as these.
An improved DCRP might also be able to provide detailed information about those arrest-related deaths that are caused by police bullets throughout our nation. As presently structured, the Arrest-Related Deaths component of the DCRP seeks minimal information about any weapons that police officers might have used in an incident that led to a citizen’s death, and asks only whether a “Handgun” or a “Rifle/shotgun” “caused the death.” A more robust DCRP data collection effort could seek a great deal more information about things such as the number of officers who fired their weapons, the number of rounds each officer discharged, the number of rounds that struck the deceased, the caliber of the rounds, and so on. Such information would permit researchers to develop insights into a variety of questions about the nature of incidents in which police bullets kill citizens across the nation.
Once a more detailed and refined data collection process of this sort is up and running, the DCRP could be expanded to include data collection on incidents in which officers shot citizens, but none died. While this would require a program modification so that police shootings are handled via a separate data collection stream with a different instrument, transitioning the data collection system to include nonfatal gunshot wounds suffered by citizens could well be a straightforward process. It would require only that law enforcement agencies (a) provide information on all incidents in which police bullets strike citizens and (b) specify whether the citizen(s) shot died from their wounds or survived. With detailed information on all incidents in which officers shot citizens, researchers could examine a plethora of questions about what might account for whether citizen shot by the police die or survive. It may be, for example, that citizens who are shot with particular sorts of police weapons tend to have differential mortality rates (e.g., rifles vs. handguns, different handgun calibers, etc.), that there is a strong correlation between the number of gunshot wounds suffered and the likelihood of death, that citizens shot in communities with better medical care are more likely to survive, and so on. Research in this tradition concerning citizen-on-citizen gun assaults has proven to be valuable for understanding the dynamics and outcomes of these criminal attacks (e.g., Braga, 2003). Similar research with data on police shootings might just yield similarly important information concerning the shooting of citizens by police officers. For example, such information might shed light on one question implicit in the above-reported data on differential “kill ratios” across police agencies. Where the differences between NYPD and LAPD ratios go, for example, it could be that officers in Los Angeles tend to fire more bullets per shooting incident, they tend to more often use shoulder weapons versus hand guns, and so on. 15 Whatever the case, fine-grained police shooting information might well be able to shed light on important questions such as this.
And a robust program that tracks detailed information about incidents in which citizens are shot by police officers could set the stage for the development of a system to collect data on all police shootings. Once police agencies throughout the United States become accustomed to providing detailed information on incidents in which their officers shoot citizens, it would be relatively easy for them to also report on shootings in which no police bullets struck anyone. With detailed information about all incidents across the country, researchers could then seek to identify factors that differentiate between misses, hits, and fatalities. Again, it may be, for example, that matters such as the types of weapons officers fire and the number of rounds they discharge are associated with variability in whether police bullets miss, hit, or kill citizens.
Moreover, a program to comprehensively measure all incidents in which police officers in the United States discharged their weapons at citizens would yield the gold standard indicator of deadly force that Fyfe (1978) identified over three decades ago. 16 With such a measure in hand, researchers could conduct sound studies of police deadly force usage that track trends over time, catalogue differences across various spatial aggregates (cities, states, regions, etc.), and seek to identify the determinants of variability in deadly force usage across space and over time. Information of this sort would go a long way toward developing sound understanding of the exercise of deadly force by police officers in the United States. Until the measures that would permit such analyses are available, however, researchers should keep in mind that the indicators that have been used to measure deadly force in the past contain substantial flaws and act accordingly. And this same admonition applies concerning police-involved citizen deaths not caused by gunfire. Because presently available national data that may have some relevancy to such deaths is riddled with error, researchers should proceed with extreme caution until sound counts of citizen death from interactions with the police become available.
Footnotes
Acknowledgements
The author thanks Janet Lauritsen, Rick Rosenfeld, Lee Slocum, and anonymous reviewers for their comments on earlier drafts of this manuscript.
The author(s) declared no potential conflicts of interest with respect to the research, authorship, and/or publication of this article.
The author(s) received no financial support for the research, authorship, and/or publication of this article.