
Abstract
Previous research has found reduced mortality from aggravated assaults, attributed to medical care improvements. However, aggravated assault has limitations as a longitudinal measure of injuries from violence. The National Crime Victimization Survey (NCVS) can address this by providing estimates of serious injuries from criminal victimization. Their lethality trend is not compatible with the previous finding across 1973 through 1999, remaining stable rather than falling. After 1999, both Uniform Crime Reports (UCR)-and NCVS-based measures indicate increases in lethality. The trend differences raise serious problems of data choice for the researcher.
Did 20th-century medical care reduce U.S. homicide rates? There is substantial evidence of reduced mortality from trauma, in general, that is tied to developments in medical treatment, the institution of emergency and trauma care, and the growth of ancillary services such as 9-1-1 call centers and emergency medical services (EMS) transport (Trunkey, 2000). Wolfgang (1958) long ago proposed a homicide-reducing effect of medical care. Doerner (1983) elaborated and tested the idea, finding some relationship between access to medical care and homicide rates among U.S. states, later replicating this using Florida counties (Doerner, 1988; Doerner & Speir, 1986). Others have found indications of medical effects on assault mortality in multistate, county comparisons (Long-Onnen & Cheatwood, 1992), within individual cities (Barlow & Barlow, 1988; Giacopassi, Sparger, & Stein, 1992), and among nations (Chon, 2010).
To go further, a major longitudinal study using data from the Federal Bureau of Investigation’s (FBI) Uniform Crime Reports (UCR) found evidence of profound declines in the percentage of aggravated assaults that led to death in the United States over the last four decades of the 20th century (Harris, Thomas, Fisher, & Hirsch, 2002). The first dedicated civilian trauma centers in the United States opened in 1966 (Trunkey, 2000), but the UCR data indicate that by 1999 the likelihood of dying from an aggravated assault had decreased by about two-thirds. Arithmetically, this was caused by persistent increases in the numbers of aggravated assaults across the period, in contrast with less pronounced, fluctuating changes in the numbers of homicides. The study’s authors argued that had the risk of dying from serious assaults remained unchanged after 1960, homicide counts would have reached unprecedented heights: between three and four times their actual 1990s levels, up to as many as 70,000 in a year (Harris et al., 2002). If true, late 20th-century homicide rate changes were the outcomes of a contest between vastly improving medical care on one hand and skyrocketing amounts of interpersonal violence on the other.
But was there such a long-term decrease in mortality from criminal violence? To deny it would seem to challenge medical science, but the conclusion is based principally on the record of UCR aggravated assaults, a slender reed for such a burden. Little criminological research has had available tabulations of crime-based injuries with which to test the thesis of declining lethality. As will be shown below, lethality trends based on serious injuries reported in the National Crime Victimization Survey (NCVS) do not support the conclusion. The trend differences raise serious problems of data choice for the researcher.
UCR Aggravated Assaults and Lethality
Harris et al. (2002) tracked the trend in deadliness of aggravated assaults via “percent lethality.” Introduced by Doerner and Speir (1986), the measure parallels medicine’s “case fatality rate” (CFR)—the proportion of victims of an injury or ailment who die from it—except that UCR aggravated assaults are used in place of nonlethal injuries. This is a practical strategy in the absence of reliable injury data, as large majorities of homicides involve incidents that—absent a death—would be categorized as assaults rather than crimes such as robbery or rape (e.g., Zimring & Hawkins, 1997). Lethality, or the CFR, is, therefore, the number of UCR homicides divided by the sum of homicides and aggravated assaults, interpreted as the proportion of aggravated assaults that end in death.

While there are consistently fewer UCR homicides than are found in National Center for Health Statistics (NCHS) vital statistics data, which are compiled from death certificates, trends of the two are highly correlated, and they are considered to be reasonably equivalent representations of the total numbers of killings in the United States (Cantor & Cohen, 1980; Rokaw, Mercy, & Smith, 1990). Aggravated assaults are another matter. They suffer a number of well-documented measurement issues, the most common being several types of missingness: (a) lack of reporting by agencies or states, which is addressed via simple imputation procedures and probably does not greatly skew national estimates (Maltz, 2007); (b) incidents unreported to the police, long found in surveys to be about half the total (Hart & Rennison, 2003; Langton, Berzofsky, Krebs, & Smiley-McDonald, 2012; President’s Commission on Law Enforcement and Administration of Justice, 1967); (c) the UCR’s “hierarchy rule” by which serious assaults in the commission of rapes and robberies are omitted from aggravated assault totals (e.g., Barnett-Ryan, 2007); and (d) incidents reported to police but for whatever reasons unrecorded.
Endemic underenumeration of crime was a major reason for the development of victimization surveys, to shine light on the “dark figure” of crime (Biderman & Reiss, 1967; Groves & Cork, 2009, chap. 2). In its first year, 1973, the NCVS (then called the “National Crime Survey”) estimated almost four times the number of aggravated assaults that appeared in UCR figures, almost five times as many if NCVS figures are adjusted to make them comparable with those gathered via a 1992 redesign (see below).
A related problem for use of aggravated assaults in longitudinal analyses, one that has raised some controversy, is patterned missingness caused by changes in police discretion about whether, first, to record an incident as an assault and, second, to categorize it as simple or aggravated. Blumstein (2006) has argued that the post-1960s rise in aggravated assaults was largely “artifactual,” reflecting increases in official reporting of incidents that once would have been “ignored or dealt with as simple assaults” (pp. 16-17). O’Brien (1996, 2003) and Rosenfeld (2007) concur and suggest that such factors as the development of 9-1-1 centers, computerized crime data entry, and the women’s movement have increased police “productivity” or “efficiency” in gathering and reporting crimes, particularly aggravated assault, which is an especially heterogeneous category of events. Rosenfeld contends that this would lead to increases mainly in non–gun aggravated assaults, a trend he documents. O’Brien argues that it would be manifested by a decreased time-series correlation between homicides and aggravated assaults (in contrast to the correlation between robberies and homicides), which he too finds. In a discussion of complexities in the determination of “violent” assaults, Reiss and Roth (1993, p. 407) note mandatory arrest laws for domestic assaults, which both remove police discretion about reporting and appear to lower the threshold for categorization as an aggravated assault. Jencks (1991) estimated that the percentage of assaults reported to police that were actually recorded almost doubled between 1973 and 1988. 1 The overall effect of these trends would be an artificial reduction in lethality, overstating true reduction or masking stability or increase.
A related characteristic of aggravated assault may be relevant when using it to study effects of medical care: Its counts do not bear a clear relationship to injuries. Except for homicides themselves, UCR data do not provide information on injuries sustained during criminal events, so the researcher cannot directly determine either the amount of medically serious violence or its accompanying mortality rate. The varying actions falling into the “aggravated assault” category are known to have markedly different degrees of deadliness (Zimring & Hawkins, 1997, pp. 70-71). Most such incidents do not result in injuries but rather represent threats with weapons or use of deadly weapons in failed attempts to cause bodily injury or death. This is not a negligible matter. Drawing on NCVS data, Simon, Mercy, and Perkins (2001) found no injuries in 71% of aggravated assaults across 1992 through 1998. Another 16% of victims suffered only minor injuries (e.g., bruises, black eyes, cuts, scratches, or swelling), leaving just 12% of victims with “serious” injuries (defined more fully below).
Using UCR aggravated assault for assessment of changes in mortality from violent crime, in sum, brings with it serious difficulties. There has, though, been only a single attempt to reexamine the lethality trend. Andresen (2007) replicated the main UCR findings using Canadian criminal data. However, when he substituted “more refined” measures of serious assault (e.g., attempted homicides) he found no reduction in Canadian lethality after 1980. He concluded that the decrease in lethality was “sensitive to data definitions” and that there was no “disparity” between aggravated assault and homicide trends. 2
One would be on firmer ground calculating lethality on the basis of the injuries resulting from criminal attacks themselves, but the ability to do this is limited by the lack of national-level, assaultive-injury, data series that match the longevity of the UCR. The NCVS, however, allows tracing of nonlethal criminal injuries in the United States across the past four decades. It has its own limitations but can provide a first look at U.S. criminal lethality from the standpoint of injuries rather than particular criminal incidents. 3
NCVS Serious Injuries
The NCVS is best known for its estimates of criminal victimizations, but it has always tallied injuries suffered by crime victims. It employs large national probability samples (40,974 households and 73,283 individuals aged 12 years and older in 2010; see Truman, 2011) of rotating panels of households, to produce estimates of crimes and injuries that do not require reporting to, or recording by, law enforcement agencies. It weights results by respondents’ demographic characteristics to correct for sample bias, and it periodically refines aspects of its methodology in consultation with bodies such as the National Research Council (Groves & Cork, 2008, 2009).
NCVS injuries are tabulated by asking respondents who report personal victimizations questions about the types of injuries they sustained, if any, and any treatment received. As shown in the appendix, the Bureau of Justice Statistics (BJS) classifies the following injuries to be serious: stab wounds, gunshot wounds (GSWs), broken bones/loss of teeth, internal injuries, having been knocked unconscious, and other injuries that led to at least 2 days of hospitalization. The process is straightforward with NCVS public-use data except for the years 1973 through 1978, for which one component of the measure must be imputed (see the appendix for details). That classification will be followed in this article. It is not as precise a measure as injury severity scores used in trauma research, which have known relationships with mortality (e.g., American College of Surgeons, 2013, Table 23, Figure 23; Baker, O’Neill, Haddon, & Long, 1974), but it is the only long-term national measure of serious criminal injuries, it includes injuries from various types of criminal victimizations, not aggravated assaults alone, and it excludes minor injuries that clearly do not bring with them elevated risks of death.
It should be noted that the NCVS assesses events that, while overlapping those of the UCR, are not identical. For example, it does not measure crimes against children younger than the age of 12, or commercial crimes. Samples are based on households and thus do not include people who are homeless or in temporary housing, who are institutionalized, or who reside in military barracks or on ships at sea (Addington, 2008). As with all surveys, respondents may report events that did not occur, or may fail to report actual events, though the designers take great pains to focus on specific attributes of crime events, avoid terms with legalistic overtones, help recall of easily forgotten crimes and events that do not fit popular stereotypes of crimes, bound events within defined time periods, and so forth (e.g., Groves & Cork, 2008; Rennison & Rand, 2007).
One issue of the NCVS is that while it has very high cooperation rates by sample survey standards it encounters problems of missingness caused by refusals to cooperate and by panel attrition (Catalano, 2007; Maltz, 2007). This has been most pronounced for population groups at high risk for criminal victimization, such as non-White youths, and it is a particular problem for firearm victimizations (Cook, 1985). Rand (2009, Table 2) finds that 38.6% of Black males aged 12 to 19 years failed to respond to the survey in 2005, and Cohen and Lynch (2007) report that in 1999, almost a third of Black men, aged 24 to 34 years, who were not the “reference” person in a household, failed to respond. The latter suggest this may account for a sizable proportion of “missing” NCVS emergency department (ED) admissions, in comparison with the numbers found via ED surveys.
It is therefore a reasonable hypothesis that, though the NCVS for years reported far more violent crimes than did the UCR, it underestimates serious crimes, especially firearm victimizations, and therefore probably serious injuries. Indeed, the authors of the UCR lethality study excluded NCVS data in part because of these missingness issues (Harris et al., 2002). However, whether or not that is the case, the more important question would be whether there were systematic changes in sampling or measurement that affected the survey’s trends, for which there is, for the most part, little evidence.
Although there have been a number of methodological changes in the survey over the years, most have not been thought, or intended, to affect reported rates (Rennison & Rand, 2007). The foremost exception was a major 1992 redesign that included an enhanced screening section and screening questions to stimulate recall of victimization, clarify the nature of victimizations, and reduce personal interpretations (Kindermann, Lynch, & Cantor, 1997). The effects were dramatic. Based on a comparison of results from parallel surveys undertaken in 1992 (one using the old protocol and the other using the enhanced protocol), the change led to increased estimates of several crimes, notably a 157% increase in estimates of rapes and a 57% increase in assaults (23% for aggravated assaults) though no increase for robberies (Kindermann et al., 1997). To employ affected variables in continuous series, BJS uses a ratio adjustment for counts of earlier years—for example, multiplying pre-1993 aggravated assault counts by 1.23. As Rand, Lynch, and Cantor (1997), discuss, this is not the only possible approach, but it works well, and there has been little question of its overall derived trends before the mid-to-late1990s.
Such an adjustment is not needed with NCVS serious injuries. Using data from the parallel 1992 surveys, one can directly contrast estimated serious injuries, and in short, there is no evidence of an artificial increase. The redesign serious injury estimate for 1992 is 371,300, compared with the older protocol estimate of 383,500, slightly (3.2%, n.s.) fewer serious injuries. Serious injuries therefore may be used as originally tabulated.
Changes in NCVS Nonresponse
One trend that could potentially affect NCVS victimization estimates, beginning in the mid-to-late 1990s, was an increase in nonresponse. This was accompanied by—partly, an effect of—serious funding issues, reduced sample sizes, moves toward completely computerized interviewing, and inclusion of data from preliminary “bounding” interviews in statistical tables (Addington, 2008; Catalano, 2007; Groves & Cork, 2009). Fully 96% of contacted households cooperated in 1993, which was consistent with surveys dating back to the 1970s, as did 93% of those living in those households. The proportions of each then began to decline, and outright refusals increased as a percentage of nonparticipation (Atrostic, Bates, Burt, Silberstein, & Winters, 1999; Perkins, Klaus, Bastian, & Cohen, 1996). By 2005, the proportion of nonparticipating households had doubled and that of nonparticipating persons within households had more than doubled before stabilizing, though still at high levels of cooperation: 91% and 84%, respectively (Groves & Cork, 2009). This coincided with sharp drops in victimization estimates (see below). At the end of the time period covered in this article, response rates rose again, respectively, to 92% and 88% (Truman, 2011). Some, though not all, researchers have expressed concern that the drop in cooperation might artificially lower crime rates (e.g., Catalano, 2007)—and, by extension, rates of injuries.
In 2006 there was a one-time jump in NCVS crime estimates that was “fundamentally different and incomparable” with 2005 rates and did not appear to represent actual increases in crime (Groves & Cork, 2009, p. 88; Rand, 2008; Rand & Catalano, 2007). It was largely attributed to the inclusion of a new sampling frame and new interviewers and did not extend to counties already in the sampling frame. BJS uses 2006 estimates in some reports but includes cautions about interpretation of the year’s findings. The same will be done here. It will be seen that inclusion of 2006 estimates has little overall effect on NCVS trends in lethality.
We have, in sum, two independent data series, each with its own limitations, with which to test the proposition that medical care decreased assaultive injury lethality in the late 20th century. There are two issues: First, how similar or different are the pictures they produce? Second, if differences are observed, what should one make of them?
Data and Analysis
Analysis consists principally of comparisons of CFR estimates, using single years or multiyear averages. It is therefore largely descriptive. Calculating standard errors of estimates from multistage samples with sampling weights is complex. For 1973 through 1993 data, NCVS codebooks provide parameters to be multiplied by estimates of victimizations to calculate standard errors. For later years, NCVS files include data on primary sampling units, strata, and sampling weights, which are used with statistical software (here: the STATA 12 Survey Data Analysis program) to derive standard errors.
CFR is a proportion. In the case of the UCR CFRu = Hu / (Hu + Au), where Hu is UCR homicides and Au is UCR aggravated assaults. UCR data do not have standard errors. The NCVS rate is CFRn = Hn / (Hn + In), where Hn is homicides of those aged 12 years and older, and In is the NCVS estimate of serious injuries. Because Hn has no standard error, the standard error of the NCVS CFR becomes SE(CFRn) = 1 / (Hn + In) × Square root (SQRT) [
All data are publicly accessible online. UCR crime counts are available via the “Crime in the United States” annual series and the “UCR Data Tool” (http://www.ucrdatatool.gov/). Annual NCVS serious injury estimates are calculated from data in public-use files available at the National Archive of Criminal Justice Data (NACJD; http://www.icpsr.umich.edu/icpsrweb/NACJD/). Data from the FBI’s Supplementary Homicide Reports (SHR), 1980 through present, are available via the “Easy Access to the FBI’s Supplementary Homicide Reports” (EZASHR) website, developed by the National Center for Juvenile Justice (Puzzanchera, Chamberlin, & Kang, 2012; http://ojjdp.gov/ojstatbb/ezashr/). Individual-level SHR data files and codebooks for 1973 through 1975, compiled by Margaret Zahn and Marc Riedel, and for 1976 and later years, compiled by James Alan Fox, are available at NACJD.
Homicide Data Adjustments
UCR homicides are used unless NCHS counts are specifically referenced. Because NCVS samples do not include children younger than 12 years, one must exclude homicides of such children when calculating NCVS lethality. The SHR provides victim ages with two qualifications: (a) the ages of a small proportion of homicide victims are not available and (b) the SHR typically includes data for only about 90% of UCR killings. To address these issues, (a) SHR totals are multiplied by ratio factors so that the totals sum to the number of actual UCR homicides (the EZASHR site does this automatically), (b) victims with unknown ages are distributed proportionately among the age categories, and (c) the derived number of victims younger than age 12 is deleted. Homicides of those 12 years and older consistently comprise 95% to 97% of all homicides across the series.
High-Frequency, Repeat Victimizations
NCVS results will follow BJS practices by excluding incidents that occurred outside the United States and high-frequency, repeat victimizations. The latter, also called “series incidents,” are multiple, similar incidents over a short time period that the respondent may be unable to differentiate or even recall the exact number. Treatment of these is complicated, and BJS policies for dealing with them have varied: The number of incidents demarking a series changed from three to six in 1986, and in 1992 the questions used to determine a series victimization changed somewhat (much of this is discussed in Lauritsen, Owens, Planty, Rand, & Truman, 2012). Respondents are asked the number of such incidents they experienced along with some background questions on each, but detailed information (e.g., about injuries or the presence of weapons) is gathered only about the most recent incident.
Series incidents were historically omitted from NCVS reports or tabulated as a single victimization because of these concerns about classifying and counting (see Lauritsen et al., 2012). Beginning with the 2010 Criminal Victimization report, series victimizations are included, up to a maximum of 10 incidents reported by a respondent (see Truman, 2011). Lauritsen et al. (2012, p. 1) state that crimes resulting in injuries are not easily forgotten, therefore unlikely to fall into the “series” category, and they find that the series counting rule has “limited statistical and substantive effects” on the proportion of victimizations resulting in injury (p. iii). To test this, NCVS-based CFRs for this project were calculated both including and excluding series crimes. Inclusion decreased lethality an average of 1.65 deaths per 1,000 injuries, a 2.8% average reduction, and had no substantive effects on any results to be reported. As consistency in reporting is paramount for this study, it will follow the policy of excluding series crimes.
Collection-Year Versus Data-Year Estimates
Because households in the NCVS sample are interviewed every 6 months, a year’s interviews include some victimizations that occurred the previous year and exclude some from the current year. It takes 18 months to collect a full “data-year” of records (covering the year incidents occurred). For many years in the series, one can elect to use figures from either the data year or “collection-year” (covering the year of the interview). The Criminal Victimization series originally presented data-year statistics in published reports but in the 1990s began publishing collection-year figures to facilitate more rapid reporting. UCR data, on the other hand, are always reported on a data-year basis. The NCVS injury estimates herein use year of incident through 2008, after which these become unavailable in NCVS public-use files. Collection-year estimates are presented for 2009 through 2010 to fill out the series, but one should recognize that there is an overlap between 2008 data-year and 2009 collection-year counts.
The study follows Harris et al. (2002) by using CFRs to trace changes in the likelihood of dying from criminal attacks across 1960 through 1999, contrasting results gained, respectively, via NCVS serious injuries and UCR aggravated assaults. It then extends coverage through 2010. As these measures of nonlethal violence encompass substantially different subsets of the universe of nonlethal victimizations, calculated lethality rates will vary dramatically, and relative trends will generally be more relevant than absolute differences. To differentiate absolute and relative lethality, annual CFRs will be expressed as deaths per 1,000 cases, whereas comparisons of CFRs will be discussed as “relative lethality” and expressed as percentages.
Findings
Table 1 shows UCR homicides and aggravated assaults, and estimates of NCVS serious injuries from all victimizations, not just aggravated assaults, 1960 through 2010. The table reflects the well-known rapid UCR-based crime increase during the 1960s and 1970s. By 1973, when the NCVS data become available, UCR criminal homicide counts had already doubled and UCR aggravated assault counts had increased by a factor of 2.7. Homicides fluctuated but rose to peak counts of more than 20,000 in the mid-1970s, again in the early 1980s, and yet again in the early 1990s. The peak year was 1993, when there were 2.7 times as many killings as in 1960 (25% more than in 1973), before receding to the current, much lower, counts. Aggravated assaults climbed much more aggressively, increasing 31 times in 33 years to its peak in 1993, 7.4 times the 1960 count (2.7 times as many as in 1973), before declining by about a third by 2010.
UCR Aggravated Assaults and NCVS Serious Injuries, 1960 through 2010.
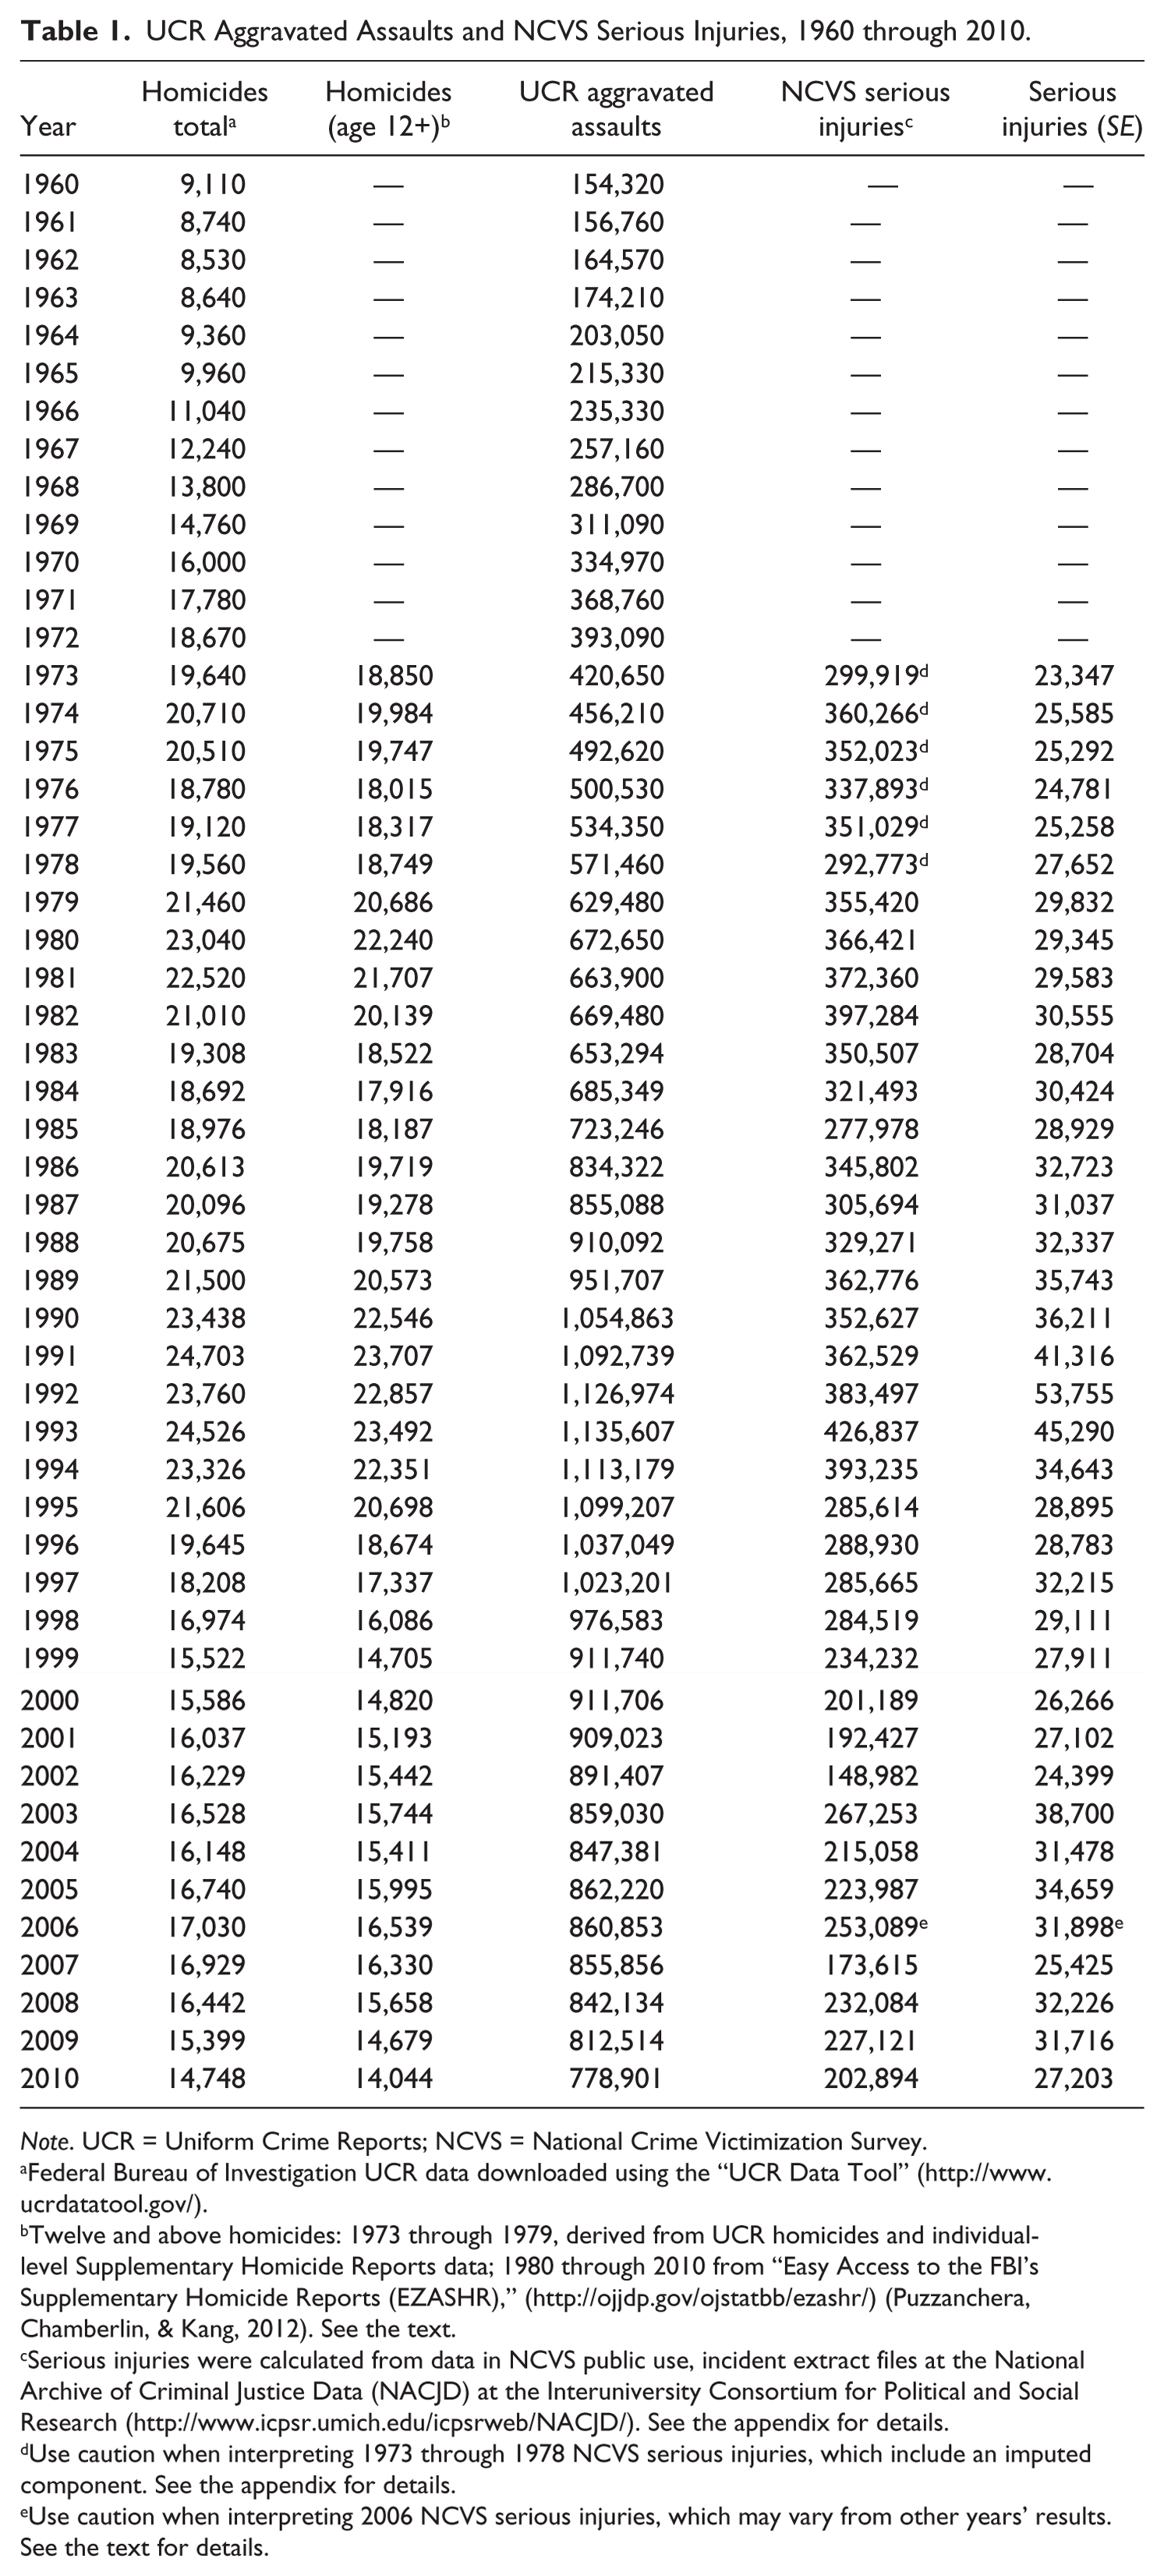
Note. UCR = Uniform Crime Reports; NCVS = National Crime Victimization Survey.
Federal Bureau of Investigation UCR data downloaded using the “UCR Data Tool” (http://www.ucrdatatool.gov/).
Twelve and above homicides: 1973 through 1979, derived from UCR homicides and individual-level Supplementary Homicide Reports data; 1980 through 2010 from “Easy Access to the FBI’s Supplementary Homicide Reports (EZASHR),” (http://ojjdp.gov/ojstatbb/ezashr/) (Puzzanchera, Chamberlin, & Kang, 2012). See the text.
Serious injuries were calculated from data in NCVS public use, incident extract files at the National Archive of Criminal Justice Data (NACJD) at the Interuniversity Consortium for Political and Social Research (http://www.icpsr.umich.edu/icpsrweb/NACJD/). See the appendix for details.
Use caution when interpreting 1973 through 1978 NCVS serious injuries, which include an imputed component. See the appendix for details.
Use caution when interpreting 2006 NCVS serious injuries, which may vary from other years’ results. See the text for details.
NCVS serious injuries grew much less aggressively. In the 20 years through 1993, the point estimate rose 12 times and dropped 8. The peak year was again 1993, with 42% more serious injuries than in 1973, after which it declined by two-thirds by 2002, and at the end of the series it fluctuated around half the 1993 total.
UCR Aggravated Assault-Based CFRs
The trend in lethality based on UCR aggravated assaults repeats previous findings through 1999. As Figure 1 shows, the highest CFR in the series was 1960, with 55.7 deaths per 1,000 incidents. There was a short-term decline, some stability from 1964 through the early 1970s, and then an almost uninterrupted decline to the lowest score in the series: 16.7 deaths per 1,000 incidents in 1999, a CFR 70% lower than in 1960 and 62% lower than in 1973. CFRs then rose into the new century, to 19.4 per 1,000 in 2006 and 2007, a relative increase of 16.2% above the low point, before receding to 18.6 in 2009 and 2010 (11.4% above the 1999 floor).
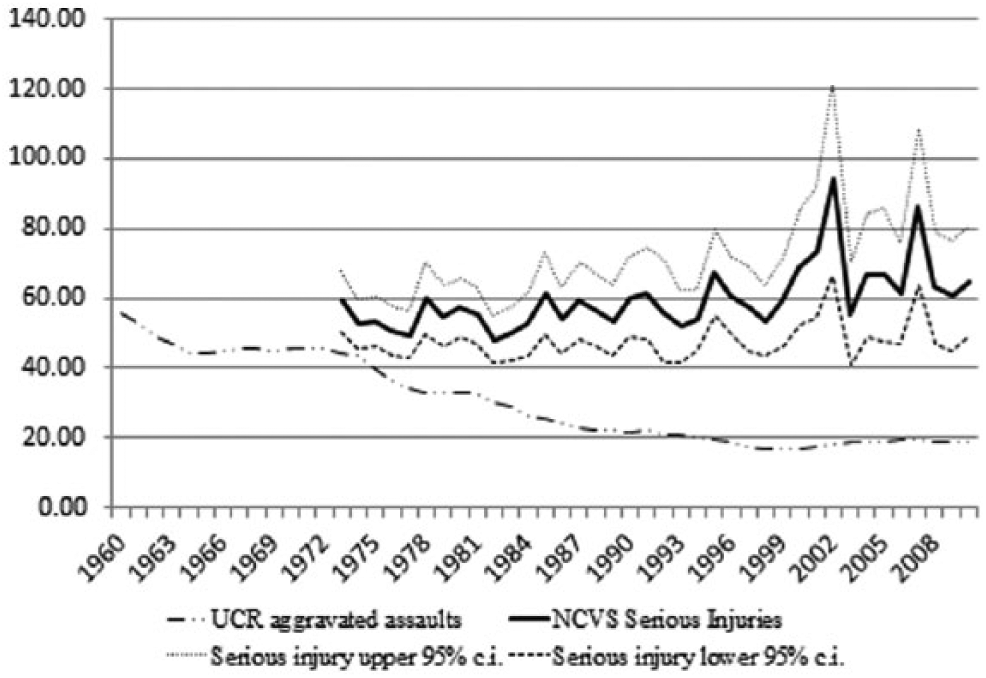
Case fatality rates based on UCR aggravated assaults and NCVS serious injuries, 1960 through 2010 (per 1,000 cases).
NCVS Serious Injury–Based CFRs
NCVS CFR trends are dramatically different. Through 1999 they follow a wave and trough pattern rather than rising or falling systematically. Estimates rise 12 times and drop 14 times. While year-to-year swings are much greater using NCVS than UCR data, because of sampling error and the fact that population serious injuries are extrapolated from injuries to survey respondents, the overall NCVS change from 1973 to 1999 is small. The lowest point estimates are in the middle years, 1977 and 1982, and the least squares trend line suggests a slight increase over time (.20 deaths per 1,000 serious injuries per year, n.s.), but the boundary years, 1973 and 1999, have virtually identical CFRs, 59 per 1,000.The divergence in CFRs to that point is caused principally by the UCR lethality decrease.
In the 21st century, the situation is quite different. NCVS-based CFRs rise dramatically. Peak years are 2002 (93.9) and 2007 (86.0). 2002 lethality is 59% higher than in 1999 (z = 2.26, p < .02). Such an increase is improbable. A point in its favor is that CFRs based on UCR aggravated assaults also increase during this period. It seems likely that the extraordinarily high 2002 and 2007 NCVS CFRs are outliers that represent decreased reliability caused principally by declining NCVS sample sizes and lower victimization rates. Arithmetically, they represent single-year drops in estimates of serious injuries. Indeed, as Figure 2 shows, while NCVS lethality fluctuates much more than does UCR lethality, this late period is characterized by particularly large proportionate, annual changes of both increase and decline in NCVS CFRs. Overall increases are more modest. The 2000 through 2010 NCVS average lethality (67.7) is only 14.7% higher than in 1999, not a significant difference (z = 1.21, n.s.), though it is significantly higher than the average CFR for 1990 through 1999 (z = 2.97, p < .01). In comparison, the average UCR lethality across 2000 through 2010 is 9.8% higher than in 1999.
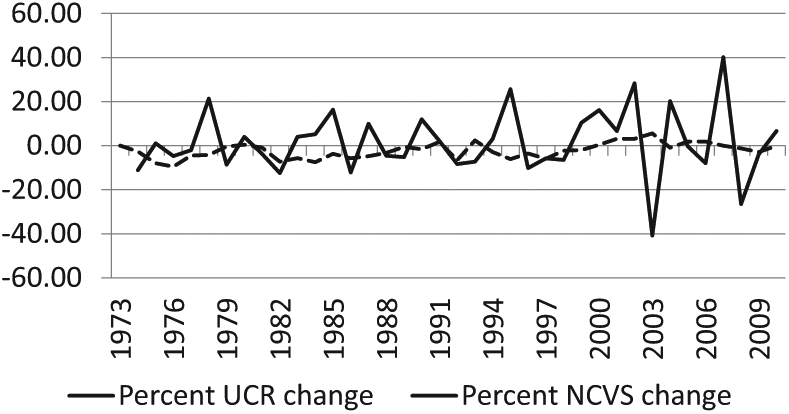
Percentage of annual changes in case fatality rates based on UCR aggravated assaults and NCVS serious injuries (point estimates), 1973 through 2010.
While, as Figure 1 showed, UCR CFRs have been below the NCVS lower 95% confidence limit in every year, Figure 3 indicates that divergence progressed across decades. Until the most recent period, this occurred because of decreases in average UCR lethality, which dropped in every decade, even—slightly—between 1990 through 1999 and 2000 through 2010. Average NCVS CFRs for the three decades before 2000 do not vary significantly (z = 0.24 to 1.54, n.s.), but the 2000 through 2010 average is significantly higher than for any other decade (z = 2.97 to 4.39, p < .01 in each comparison). Differences between NCVS and UCR CFRs increase significantly in each decade, from 16.8 deaths per 1,000 in the 1970s to 49.2 in the 2000s (z = 3.31 to 5.44, p < .01 in each new period). Proportionately, average NCVS CFR was 45% higher than UCR CFR in the 1970s, over double it in the 1980s, almost triple it in the 1990s, and just over 3.6 times the UCR CFR in the 2000s.
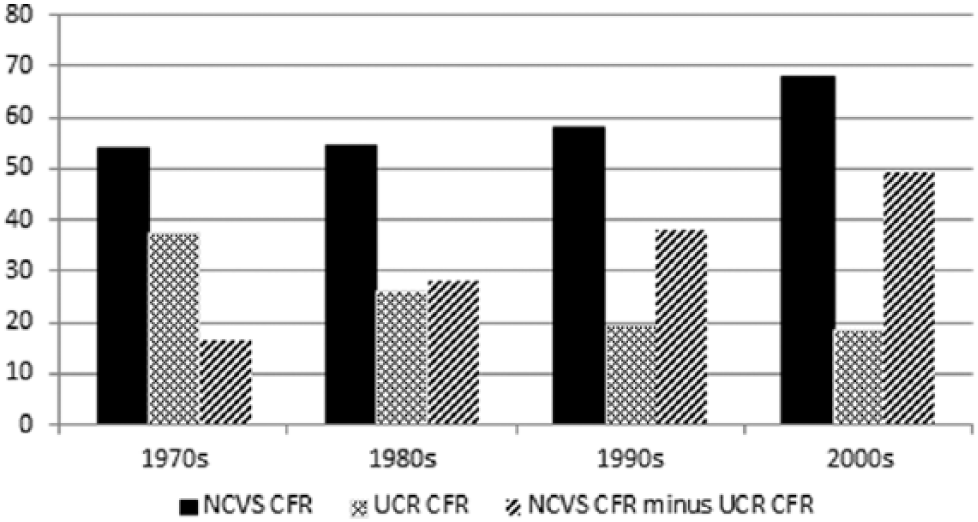
Average case fatality rates, and NCVS–UCR rate differences, by decade (deaths per 1,000).
Discussion
The fundamental issue is whether there has been a net reduction in the lethality of criminal attacks, as the UCR-based measure indicates. Clearly, NCVS-based CFRs provide a much different picture, at least through 1999: they show stability rather than reduction. What should one make of this? Scholars generally consider UCR and NCVS data to be complementary (e.g., McDowall & Loftin, 2007) and are often impatient with questions of “which is better” (Lynch & Addington, 2007b, p. 3). We face a problem, though, where the two data series produce such different patterns. One or the other may incorrectly represent underlying population trends. It is also conceivable that the trend differences largely result from dissimilarities in NCVS and UCR purposes, definitions, or procedures. Some differences are inevitable (Lynch & Addington, 2007a). The 1973 through 1999 lethality divergence, though, is sufficiently striking to merit further assessment. From one polar view, the long, downward trend in UCR aggravated assault CFR through 1999 reasonably represents trends in criminal lethality. That comes with the problems discussed above. The relationships of UCR aggravated assaults to actual assaultive violence and particularly to serious injuries are ill defined, and over the period in question recorded aggravated assaults have very likely incorporated substantially greater proportions of events that are minor in their medical consequences.
It is perhaps easier to support the opposite position: There was stability in mortality from criminal attacks from the early 1970s through 1999. One could easily doubt the post-1999 NCVS increase—coinciding as it did with a period of decreased survey participation rates—were it not that UCR lethality also increased after 1999. Rosenfeld (2007) has suggested that reporting of aggravated assaults in the UCR stabilized by the 1990s. If that is correct, they could have become a better proxy for underlying injuries. There is, though, another, larger obstacle facing this position, that of medical advances.
Is Medical Lethality Reduction an Illusion?
The NCVS-based lethality trend seems inconsistent with known improvements in medical care. Can it be credible? It is well established that dedicated trauma centers bring survival benefits to injury patients (Trunkey, 2000), and one must remember the evidence for cross-sectional and local effects of medical care on assault lethality—though the criminological findings have typically been small and vacillating (Doerner, 1983; Doerner & Speir, 1986; Giacopassi et al., 1992; Long-Onnen & Cheatwood, 1992). How can these fail to be reflected in CFRs from serious injuries at the national level? There are three factors that would seem to limit net reductions in lethality, two of which concern medical care in general—limitations in its overall mortality-reducing effects, and a crisis in trauma/emergency care that limits application of medical findings—and the third of which concerns an offsetting effect of changes in assault weaponry, namely, increases in firearm mortality. Together, they provide support to the NCVS-based CFR trend.
How Many Trauma Patients Can Be Saved?
Advances in medical care have mortality effects only for the subcategory of injury patients who would have died except for those advances. The proportion of victims who are saved can vary greatly depending on the base employed: all injuries, only the most severe injuries, only those who arrive alive at the ED, and so forth. A large proportionate decrease in “preventable deaths” may represent a small proportionate decrease in total deaths. For an example, Guss et al. (1989) found that development of a regionalized trauma system in San Diego reduced preventable trauma deaths by roughly 92% between 1979 and 1986. However, only 11.4% of trauma deaths from the first period were judged “preventable,” so total mortality reduction was about 10%. Research commonly finds overall reductions closer to the lower figure than the higher one.
While reviews have been critical of much research methodology (e.g., MacKenzie, 1999; MacKenzie, Steinwachs, Bone, Floccare, & Ramzy, 1992; Mann, Mullins, MacKenzie, Jurkovich, & Mock, 1999; Wilson, McElligott, & Fielding, 1992), there has been general consistency in findings, whether one uses retrospective studies or direct assessments of the outcomes of patients admitted to Level I trauma centers, either across time periods or versus non–Level I hospitals. One sometimes finds high relative mortality reduction, at least among the most seriously injured patients (e.g., Nathens et al., 2001; Papa et al., 2006), but the presence of major trauma centers is commonly associated with a 15% to 20% reduction in mortality (e.g., Demetriades et al., 2006; Durham et al., 2006; Glance, Osler, Mukamel, & Dick, 2012; MacKenzie et al., 2006; see reviews in Celso et al., 2006; Chiara, Cimbanassi, Pitidis, & Vesconi, 2006; Jurkovich & Mock, 1999; Mullins & Mann, 1999). Survival benefits may also improve over time in individual centers. However, one of the largest national studies using Fatality Analysis Reporting System data on motor vehicle deaths, factoring in the length of existence of regional trauma centers, documented only an 8% reduction in motor vehicle deaths that could be attributed to long-term maintenance of trauma systems (Nathens, Jurkovich, Cummings, Rivara, & Maier, 2000), and even this amount was disputed (Clark, 2003).
One must, further, seriously consider the effect of commonly excluding those dead at the scene or on arrival (DOS or DOA). The practice is necessary for assessing benefits of treatment for living patients, but it overstates total lethality reduction by excluding high proportions of trauma injuries and deaths, roughly half of all deaths. Some research has found a rising proportion of DOA deaths (e.g., Giacopassi et al., 1992), generally interpreted to indicate that rapid communication and transport allow increasing numbers of trauma victims to reach medical care alive, many of whom therefore survive. A recent review, though, finds a stable percentage of “immediate deaths” (DOS, DOA, or dying shortly after admission): in the range of 50% to 60% of decedents across 10 major studies covering the years 1974 through 2010 (Sobrino & Shafi, 2013).
While recent improvements in transportation may help patients in rural areas, who face long delays between event and transport (Carr, Caplan, Pryor, & Branas, 2006; K. E. Stewart, Cowan, Thompson, Sacra, & Albrecht, 2011), and among whom large majorities of decedents succumb before reaching a hospital (Grossman, Hart, Rivara, Maier, & Rosenblatt, 1995; Grossman et al., 1997; Rogers et al., 1997), this is not as clear within metropolitan areas. Research finds little mortality-reducing effect of EMS treatment beyond basic life support (Isenberg & Bissell, 2005; Smith & Conn, 2009), or of air versus ground-based transport (Cocanour, Fischer, & Ursic, 1997; Delgado et al., 2013), or—surprisingly—of EMS versus private or police transport to the ED (Branas, Sing, & Davidson, 1995; Cornwell et al., 2000; Demetriades et al., 1996).
Increased proportions of patients, though, now arrive “moribund.” Perhaps a quarter of those declared dead at the hospital are actually DOA (Van Haren et al., 2012), and of those who die at the hospital, about a third expire within 15 minutes of admission (Acosta et al., 1998). In all, emergency transport within metro areas may have reached a plateau in terms of the ability to deliver salvageable patients, and some authorities argue that few early deaths are preventable (e.g., Gunst et al., 2010; Meislin, Conroy, Conn, & Parks, 1999; R. M. Stewart et al., 2003).
What applies to trauma in general applies to criminal homicide. According to NCHS data, 58% of U.S. firearm homicide victims in 1992 through 1995 died before receiving medical care, a figure that rose to 70% among those murdered via head wounds (Beaman, Annest, Mercy, Kresnow, & Pollock, 2000). These authors argue that most died of wounds too severe to be survived.
The Crisis in Trauma Care
Potential mortality reduction from medical advances developed in research centers is diminished by long-standing and progressive problems facing everyday emergency and trauma care, namely overcrowding, delays, and difficulty obtaining skilled care. In the medical literature, one commonly finds the word “crisis” applied to the problems (American College of Surgeons, 2006; American Hospital Association, 2002; Flynn, 2007, 2013; Green, 2009; Kellermann, 2006; National Foundation for Trauma Care, 2004; Schwab, 2006; Trunkey, 2007). Articles on them date to the early 1990s (Andrulis, Kellermann, Hintz, Hackman, & Weslowski, 1991; Gallagher & Lynn, 1990; General Accounting Office, 1993; Richardson, Asplin, & Lowe, 2002), and an American College of Emergency Physicians (2008) report dates the first statewide conference on “sustained and unsolvable problems with crowding” to 1987.
Causes include extraordinarily high costs of maintaining trauma centers (Goldfarb, Bazzoli, & Coffey, 1996), such that a survey of hospitals that had ended trauma service blamed “uncompensated care, inadequate reimbursement, high operating costs, and lack of physician support” (Dailey, Teter, Cowley, & Mathias, 1992, p. 539). The manifestations are substantial increases in the numbers of ED patients, decreases in the actual number of EDs, greater numbers of “high acuity” patients (those requiring the most immediate care), forced diversions of ambulances to alternative hospitals, and shortages of physicians, including specialized surgeons, both able and willing to offer emergency and trauma care (American College of Emergency Physicians, 2006; American College of Surgeons, 2006; Cohn et al., 2007; Kellermann, 2006; Schafermeyer & Asplin, 2003; Trunkey, 2007).
A 1998 through 1999 survey of EDs found that 91% reported overcrowding (96% of EDs in large cities), defined as extended periods with patients in hallways, all ED beds occupied, full waiting rooms, emergency physicians feeling “rushed,” and acutely ill patients waiting over 60 min to see a physician (Derlet, Richards, & Kravitz, 2001). About 39% reported this to be a “daily” occurrence. Overcrowding increased across the 1990s: 30% reported that it had “always” been a problem (meaning: existing more than 3 years), 52% said it had developed within the previous 3 years, and 18% said it had developed in the previous year. Pitts, Pines, Handrigan, and Kellermann (2012) report that ED overcrowding continued to intensify at least through 2008.
ED closures are a fundamental part of the problem. From 1990 through 2009, the number of non-rural EDs in the United States declined by 27%, mainly among “safety-net” hospitals that served high-poverty populations (Hsia, Kellermann, & Shen, 2011). In one study, closures were partly offset by an increase in ED stations within hospitals, but the number of acute ED cases grew four times as fast as the number of stations (Lambe et al., 2002).
The net effect of ED closures per se is unsettled. There is, on one hand, evidence that concentrating trauma patients in a smaller number of “high volume” centers improves survival likelihoods (Nathens et al., 2001). However, Shen and Hsia (2012) found an increase in myocardial infarction mortality that was related to the extra length of travel to the hospital, though the effect appeared to mitigate over time. Another research team found an epidemiological reversal in a long-term trend of declining mortality among motor vehicle crash victims following a period of net ED closures (Waxman, Izfar, & Grotts, 2012).
Multiple reviews have concluded that patient mortality rises during times of ED overcrowding (Bernstein et al., 2009; Hoot & Aronsky, 2008; Johnson & Winkelman, 2011). In recent research, Guttman, Schull, Vermeulen, and Stukel (2011) found substantial increases in the relative likelihood of death of both high and low acuity patients, between shifts with waiting periods below 1 hr and more than 6 hr (odds ratios = 1.79 and 1.71, respectively). Sun et al. (2013) found a 5% to 9% increase in relative odds of death during periods of crowding, depending on the measure used. In sum, while medical research makes possible improved patient survival, the economic and social contexts of organized practice have worked against clear implementation of the improvements and in some cases may have undercut them.
Firearms and Mortality
Finally, in the case of criminal victimization, increasing firearm mortality has likely countered effects of medical care improvement. Indeed, the lethality of gunshot attacks has commonly been characterized not by reduction but by increase. Although GSWs have long accounted for most killings (e.g., Brearley, 1932; Riedel, Zahn, & Mock, 1985), in the 1980s and early 1990s, firearm homicides increased whereas those by other means were stable or dropped. Consequently, in vital statistics data, gunshot homicides grew from 60% to 72% of the total between 1985 and 1994, and the early 1990s homicide wave was driven by GSWs (Centers for Disease Control and Prevention [CDC], 1994, 1996, 1999; Cummings, LeMier, & Keck, 1998). Medical research reported reversals in previous downward trends in trauma mortality, caused largely by thoracic and head GSWs, the latter of which was called “alarming” (e.g., Stone, Lichtor, Fitzgerald, Barrett, & Reyes, 1995; Webster, Champion, Gainer, & Sykes, 1992). In a study from Philadelphia, lethality of semiautomatic pistol injuries increased dramatically across 1985 through 1990 despite the addition of six new trauma centers (McGonigal et al., 1993).
The central issue is the high lethality of GSWs in comparison with other injuries from violence. It is well established that firearm crimes bring with them elevated risks of death. Zimring and Hawkins (1997) found that in 1992, New York City (NYC) had a 10% death rate from firearm incidents, 8 times the rate from stabbing incidents and 13 times the rate from other modes of assault. CDC reports from the period that drew on ED admissions for firearm injuries, and NCHS firearm homicides, estimated assaultive firearm death rates above 20% (Beaman et al., 2000; CDC, 1999; Gotsch, Annest, Mercy, & Ryan, 2001), about double the NYC incident percent.
Beginning with 2001, both nonfatal ED admissions and NCHS homicides are available from the CDC’s Web-Based Injury Statistics Query and Reporting System “WISQARS” site, allowing one to calculate estimates of assaultive injuries by weapon. In Table 2, the 2001 through 2010 assaultive gunshot CFR was 202 deaths per 1,000 injuries that ended in either a death or a nonfatal ED admission. Stabbing lethality was 16.5 deaths per 1,000. Excluding the 9/11 terrorism deaths and injuries/deaths from unknown or unspecified causes, all other assault modalities produced 1.5 deaths per 1,000. A GSW, then, incurred approximately 12 times the risk of death of a stab wound and 135 times the risk of an “other” assault injury (cf. Felson & Messner, 1996, p. 535). Consequently, growth in the proportion of GSW injuries would disproportionately increase net lethality.
Lethality of Assaults by Firearms, Knives, and Other Means, 2001 Through 2010 (WISQARS Data).

Source. Centers for Disease Control and Prevention (CDC) “Web-Based Injury Statistics Query and Reporting System,” (WISQARS) (http://www.cdc.gov/injury/wisqars/index.html).
Note. ED = emergency department.
“Other-plus” includes nongunshot, noncutting wounds plus all injuries or deaths for which mechanisms are unspecified or unknown.
Several researchers have proposed that firearm lethality has increased in part by shifts toward semiautomatic pistols and higher caliber/higher velocity weapons that can cause more severe or greater numbers of bullet injuries (Carr, Schwab, Branas, Killen, & Wiebe, 2008; Caruso, Jara, & Swan, 1999; Koper, 1997; McGonigal et al., 1993; Webster et al., 1992; Zawitz, 1995; for a review, see Zimring & Hawkins, 1997; for different views on effects of numbers of wounds, see Cripps, Ereso, Sadjadi, Harken, & Victorino, 2009; Reedy & Koper, 2003). The particular upward trend in nonsurvivable head wounds suggests as well an increase in targeting to maximize deadliness, that is, changes in lethal intent that are associated with firearm use (e.g., Felson & Messner, 1996).
Although rates of both firearm assaults and deaths began to drop after 1991 (Cherry, Annest, Mercy, Kresnow, & Pollock, 1998), CFRs from firearm attacks appear to have risen through the mid-1990s. Data from a CDC report indicates that assaultive GSW lethality rose from 198 to 231 deaths per 1,000 incidents from 1993 to 1996 before dropping to 209 in 1998 (calculated from data in Gotsch et al., 2001, Table 2; see also CDC, 1999). Lethality may have grown into the early 2000s. WISQARS data indicate that it was 241 per 1,000 in 2002 (see Planty & Truman, 2013, Appendix Tables 1 and 20). Large standard errors in WISQARS estimates make this uncertain. The multiyear, 2001 through 2006 firearm CFR estimate is 212 per 1,000, similar to that in the mid-1990s. Across 2007 through 2011 the rate is lower, averaging 184 and dropping. 4
Lauritsen, Gorislavsky, and Heimer (2013, Figure 4.2) find that rates of gun violence and homicide largely paralleled one another through 2005 and that after the mid-1980s homicide rates grew faster than gun violence rates and fell more slowly, indicating increased lethality (see also Cook & Ludwig, 2006). Lauritsen et al. further find that the relationship of gun violence to homicide was largely limited to males, implying differences in lethal intent by victim gender. Research from trauma centers found increases in observed gunshot lethality in the early years of the century, especially of “nonsurvivable” wounds. A study from the Johns Hopkins Medical Center found that relative lethality of GSWs (including DOAs) grew by 43% from 2000 to 2005, an effect driven almost completely by wounds to the head or chest (Efron et al., 2006).
In sum, the two medical factors suggest some limits to overall mortality reduction in trauma cases. Changes in firearm use and gunshot lethality suggest a further deterioration of mortality reduction in the specific case of trauma from criminal violence. Indeed, the findings of stable or increased mortality from GSWs are more compatible with NCVS-based than UCR-based trends.
Conclusion
After 1999, CFR trends based on NCVS serious injuries and on UCR aggravated assaults, while not identical, both point toward increased lethality of criminal attacks. From 1973 to 1999, however, they increasingly diverged. According to NCVS trends, there was no decline in the lethality of serious criminal injuries across the period. Contrariwise, according to UCR trends, late 20th-century lethality plummeted. These data do not allow definitive conclusions about pre-2000 CFR change. The divergence could be largely explained by the widely suspected artificial increases in UCR aggravated assaults—that is, increasing proportions of aggravated assaults that included minor injuries or no injuries. At least toward the latter years it might, alternatively, be explained by the decline in NCVS cooperation rates, especially among high-risk groups, though the use of sampling weights to adjust for nonresponse would make this less likely. Given the different purposes and procedures of the two, one would not expect complete similarity in trends between the series.
Whatever the causes, the numerical differences are stark, which can be seen by focusing on the years 1973 and 1999. There were 911,740 recorded UCR aggravated assaults in 1999, 491,090 more than in 1973.Given the numbers of UCR homicides, flat lethality would require a drop to 332,427 aggravated assaults in 1999, a huge net drop of 579,313 for the year. That would imply an annual growth rate of almost 4% in recording of incidents that would previously not have counted as aggravated assaults. Contrariwise, there were 234,232 estimated NCVS serious injuries in 1999, 65,687 fewer than in 1973. To show a lethality drop equivalent to that of the UCR would require 647,982 serious injuries in 1999, a net gain for the year of 413,750. For this to occur across the period, the NCVS would have had to experience a negative annual growth rate of almost 4% in its ability to detect serious injuries.
Such dramatic differences require further assessment to give the researcher guidance. Concerning possible NCVS bias, others have suggested that, in light of associations between response rates (especially within more marginal groups) and victimization rates, one should separately evaluate trends in nonresponse and victimization for more-and less-marginal populations (Lynch & Addington, 2007a). Along with this, record-check studies that have been used to independently assess reported (and unreported) victimizations (e.g., Averdijk & Elffers, 2012; Cantor & Lynch, 2000; Schneider, 1981) might be applied to injuries. Concerning the UCR, there should be further elaboration of the changing nature of aggravated assaults. Research using available aggregate data needs extension with disaggregated or individual-level data, possibly using individual police department records. Finally, researchers might turn to other measures of crime or injury, as they become available, to develop independent estimates of changing victimization.
Stronger conclusions await new evidence. However, even if, as this writer judges, the lines of evidence are correct in suggesting that NCVS lethality trends more closely follow underlying patterns in the population, this would not imply a lack of effect of medical science. It would rather, in that case, indicate that medicine is simply one factor affecting lethality, one that has been unable to accomplish a net downward outcome in recent decades because of changes in weapon use and socioeconomic issues of contemporary medical care.
Footnotes
Appendix
Acknowledgements
I am indebted to the following for advice and information: Randy Roth, Mike Maltz, Lynn Langton, and Brian Wiersema.
Declaration of Conflicting Interests
The author(s) declared no potential conflicts of interest with respect to the research, authorship, and/or publication of this article.
Funding
The author(s) received no financial support for the research, authorship, and/or publication of this article.