
Abstract
This study explores the impact of COVID-19 on gun violence in NYC and its interactive effects with neighborhood factors at the census tract level. Random effects negative binomial models are used to analyze monthly data from January 2017 to March 2021. There was a significant increase in gun violence during the pandemic. In addition, poverty, economic inequality, African Americans, Hispanics, residential mobility, and total population were significantly associated with increases in gun violence. However, there were no significant interaction effects between the pandemic and neighborhood characteristics. This study concludes with a discussion of study limitations and implications.
Introduction
On March 11, 2020, the WHO declared the coronavirus a global pandemic as it had exponentially spread across the world. In the United States, state governments have enacted a range of social distancing policies, as well as pharmaceutical interventions, to diminish the risk of in-person coronavirus contagion. The restrictions that were placed on individuals have entailed school and business closings, bans on social gatherings, and so on. Under the stay-at-home orders (SAHOs), individuals were only allowed to travel for essential functions or needs. Restrictions in mobility were effective in preventing the spread of the coronavirus and resulting deaths, but they were not without costs. The pandemic and social distancing policies led to record levels of unemployment and financial hardship (Falk et al., 2020; Horowitz et al., 2021). Low-income and minority adults have borne the brunt of coronavirus-related job or wage loss and are particularly vulnerable to the adverse economic effects of the pandemic (Horowitz et al., 2021). Individuals underwent physical and social isolation and resulting psychological distress, including stress, insecurity, anxiety, and/or depression (Clair et al., 2021). People were likely to drink more alcohol and develop an alcohol use disorder during the volatile state of the pandemic (Grossman et al., 2020; Pollard et al., 2020; Tingley, 2021).
In these historical contexts, there were substantial increases in the numbers of people shot and killed or injured (Everytown Research & Policy, 2021). Individuals were more likely to engage in gun violence due to various types of stress and strain associated with physical isolation, economic hardship, poor health care, and other negative experiences associated with the pandemic. Based on the criminal background check system, it was estimated that more than 22 million guns were purchased in 2020, indicating a 64% increase compared to 2019 (Everytown Research & Policy, 2021; Savidge & Cartaya, 2021). Recent gun purchases may be attributable to a sense of uncertainty and fear about potential social disorder and violence in a volatile state of the pandemic; thus, many individuals bought their first or additional guns for personal protection (Kraviz-Wirtz et al., 2020). Prior research has shown that gun violence is more prevalent in states with high levels of gun ownership, and gun availability is more significantly related to gun violence against non-strangers, as opposed to strangers (Siegel et al., 2013, 2014).
Understanding the impact of the pandemic on gun violence is essential for guiding decision making in public health and criminal justice to reduce the number of firearm deaths and injuries. Prior research has examined whether and how the pandemic and social distancing policies exert significant impacts on gun violence across cities. The empirical evidence thus far is mixed. Some studies showed no changes in gun violence following the SAHOs (Abrams, 2020; Campedelli et al., 2021). Given the use of short-term post-intervention data (from March to May 2020 or March 2021 only), these studies failed to acknowledge that the pandemic might take a long time to exert its impact on gun violence. With relatively long-term post-intervention data, on the other hand, others found significant increases in gun violence during the pandemic (Kim, 2021; Kim & Phillips, 2021; Rosenfeld & Lopez, 2020). Finally, the findings of prior studies are limited since they analyzed city-level variations in gun violence without taking into account neighborhood-level variations in a given city, warranting further research with small geographic units.
Using census tract data in NYC from January 2017 to March 2021, this study examines the impact of the pandemic on gun violence. It expands on prior work by adjusting for various neighborhood structural factors that can possibly confound the pandemic-gun violence association and exploring whether the pandemic interacts with neighborhood structural factors in its effect on gun violence. Despite the seriousness of the pandemic and gun violence, not enough research has explored increases in gun violence, especially in small geographic units. This study will help readers have a more nuanced understanding of increases in gun violence during the pandemic.
Literature Review
Theoretical Frameworks
Social disorganization and strain theories help explain how the pandemic led to increases in gun violence. Firstly, social disorganization theory explains how urban crime is associated with neighborhood characteristics (Shaw & McKay, 1942). Crime is more likely to occur in neighborhoods with high levels of poverty, residential instability, racial and ethnic diversity, family disruption, and population density. Crime is not an abnormal behavior of an individual, but a normal response to deteriorating neighborhood conditions. Several scholars extended Shaw and McKay’s (1942) original work by explaining in what mechanism social disorganization leads to an increase in crime. They argued that ecological characteristics themselves are not direct causes of crime. Instead, social disorganization weakens collective efficacy and social capital among residents, in turn increasing crime rates at the neighborhood level (Sampson et al., 1997, 1999). Secondly, strain theory assumes that individuals are likely to engage in crime due to their incapacity to achieve material success through conventional means available in the social structure (Merton, 1938). The blockage between legitimate means and material success causes strain among individuals, which ultimately increases crime rates. Cultural pressures for pecuniary success undermine non-economic social values and institutions (i.e., family, education, and politics) that deter people from engaging in criminal behavior (Messner & Rosenfeld, 2006). Beyond Merton’s macro-structural approach, Agnew (2006) added a socio-psychological perspective at the micro level. He broadened the concept of strain and then encompassed its three key sources: failure to accomplish positively valued goals, removal of positively valued stimuli, and confrontation with negatively valued stimuli. Crime and alcohol/drug use are possible responses to the above strains.
It is important to put the above theories into context. Gun violence might result from experiences of various negative life events and relational problems during the pandemic. Individuals were banned from engaging in social gatherings and public events and compelled to spend most of their time at home. Physical and social isolation exacerbated a range of mental health problems, including anxiety, strain, depression, and frustration. Unemployment rates significantly rose as local businesses closed and many individuals were laid off or fired. Finally, there were substantial increases in alcohol consumption and sales during the pandemic (Grossman et al., 2020; Pollard et al., 2020; The Nielsen Company, 2020). Using a cross sectional online survey in the United States, Grossman et al. (2020) identified several reasons for increased alcohol use: pandemic-related stress (45.7%), alcohol availability (34.4%), and boredom (30.1%). Thus, people have chosen alcohol consumption and binge drinking to cope with pandemic-related stress and strain, especially when they are diagnosed with past or current depression symptoms (Weerakoon et al., 2021). All of the above factors might have increased risk-taking behaviors among people. Indeed, there were dramatic rises in gun purchases and violence across the United States (Everytown Research & Policy, 2021; Savidge & Cartaya, 2021).
Finally, the death of George Floyd occurred on May, 25, 2020 and led to nationwide protests against racism and police brutality. Most protests in NYC were peaceful, but some turned into violent acts (NYC Department of Investigation, 2020). Prior studies have found significant increases in shootings and/or homicides after the police involved killings of citizens (Arthur & Asher, 2016; Morgan & Pally, 2016; Pyrooz et al., 2016). There are three causal mechanisms underlying the association between George Floyd protests and gun violence. First, some protesters might be involved in looting, rioting, and shooting out of a sense of injustice after the police involved killing. Second, some vigilante citizens might engage in gun violence for self-defense out of a sense of insecurity during the protests and social unrest. Third, police officers might be disengaged from active law enforcement in response to public criticism and scrutiny about police brutality, in turn increasing gun violence in the absence of active police activities.
Research has shown that the impact of the pandemic varied by individuals’ socio-economic status. The pandemic has placed a greater financial burden upon undereducated individuals who work in service industries, including leisure and hospitality (Falk et al., 2020). In NYC, poor, uneducated individuals of color are more at risk of experiencing unemployment and pay cuts associated with the pandemic, as opposed to their wealthy, educated white counterparts (Lew, 2020). Thus, The Bronx and Queens suffered from unprecedented rates of unemployment, as well as higher rates of confirmed cases and deaths in the city, compared to other boroughs (Lew, 2020). In addition, people tended to experience increased levels of tension in their marriages when they suffered from financial hardship associated with the pandemic (The American Family Survey, 2020). It is reasonable to assume that financial difficulty accelerates strain and hostility among individuals toward others and society in general, increasing the risk of gun violence in poor inner-city neighborhoods.
Empirical Evidence
Following the outbreak of the coronavirus, researchers have examined the effects of the pandemic and its corresponding SAHOs on crime across the world. Most studies were conducted in the United States. Using a range of data and research designs, they compared temporal changes in various types of crime across cities. The focus of the review is on changes in violent crimes during the pandemic.
Using weekly data from January 2016 to May 2020 from 16 cities, Ashby (2020) built seasonal auto-regressive integrated moving average (SARIMA) models for various crime types across public and residential places. The observed counts of each crime type were compared to its predicted counts with the 99% confidence interval if there were no pandemic. Given that the observed counts fell within the confidence intervals, no significant changes were detected for serious assaults in public places and residences. Using weekly data from January 2015 to May 2020 across 25 cities, Abrams’s (2020) difference-in-difference estimation presented significant reductions in most violent crimes (robbery, aggravated assault, simple assault, domestic violence, and rape) after the SAHOs went into effect. There were, however, no significant changes in homicides and shootings. Furthermore, Rosenfeld and Lopez (2020) analyzed crime data in 28 US cities from January 2017 to October 2020. Aggravated assault, gun assault, and homicide experienced increases during the pandemic.
Some studies have reported significant effects of the pandemic on shootings in particular cities (Brantingham et al., 2021; Kim, 2021; Kim & Phillips, 2021). For example, Kim and Phillips (2021) found significant increases in gun violence, especially non-fatal and gang related shootings, during the pandemic. ARIMA and Poisson models were used to analyze weekly data in Buffalo, NY from January 2016 to October 2020. Kim (2021) also examined the varying impacts of the pandemic on NYC gun violence by fatality and borough. ARIMA and ARCH/GARCH models were used to examine weekly data from January 2016 to December 2020. There were significant increases in both fatal and non-fatal gun violence across all boroughs. On the other hand, using time series data in Los Angeles from January 2016 to September 2020, Brantingham et al. (2021) used ARIMA forecasts to compare the observed and predicted data for gang- and non-gang-related crimes, including aggravated assault, robbery, and gun violence. Most observed values fell between the upper and lower bounds of the 95% confidence interval; there were no significant changes in the volumes of gang- and non-gang-related crimes after the onset of the SAHO. According to Moran’s I, no significant changes were found in the spatial distribution of gang-related crime in Los Angeles as a result of the SAHO. Thus, the pandemic and social distancing restrictions might not have changed the spatial dynamics of social interactions among potential offenders, and thus did not influence where they engaged in gun violence. In addition, a Bayesian structural time-series analysis of daily data in Los Angeles from January 2017 to March 2020 indicated no significant changes in murder and assault with a deadly weapon (Campedelli et al., 2021).
With regard to the link between the SAHOs and domestic violence, there is conflicting evidence. Some studies found that the SAHOs led to significant increases in domestic violence (Leslie & Wilson, 2020; Mohler et al., 2020; Piquero et al., 2020). For instance, Leslie and Wilson (2020) compared changes in police calls for domestic violence across 14 US cities using weekly data between January through May of 2019 and 2020. Both event study and difference-in-difference models indicated that there were significant increases in domestic violence following the SAHOs. Their impacts were concentrated in the first 5 weeks. In contrast, other studies presented significant declines or no significant changes in domestic violence (Abrams, 2021; Campedelli et al., 2021). An examination of daily crime data from January 2017 to March 2020 in Los Angeles (Campedelli et al., 2021) found no evidence of significant changes in intimate partner assault. Although significant declines in domestic violence and rape were reported across 25 cities, Abrams (2021) noted that the declines in domestic violence and rape might result from an inability of victims to report incidents during the quarantines due to fear of intimidation and reprisal. Using a meta-analytic review of 18 empirical studies, Piquero et al. (2021) found overall increases in domestic violence after the SAHOs, and their effects were greater especially in US studies.
There have also been scholarly efforts outside the United States (Andresen & Hodgkinson, 2020; Balmori de la Miyar et al., 2021; Calderon-Anyosa & Kaufman, 2021; Hodgkinson & Andresen, 2020; Poblete-Cazenave, 2020). For example, using monthly data from January 2014 to March 2020 in Queensland, Australia, Payne et al. (2020) investigated changes in violent crimes at the state level. According to ARIMA forecasts, the observed values for violent crimes (common assault, serious assault, sexual offenses, and domestic violence) did not differ from what was predicted if there were no pandemic and social distancing measures in March 2020. However, the empirical evidence was different when social distancing was differentiated into two stages: the lockdown and relaxed social distancing. Using the structural break analyses of weekly data from May 2018 to July 2020, Andresen and Hodgkinson (2020) examined the effect of the pandemic on the number of various crimes across police service districts in Queensland, Australia. Overall, violent crimes (assault, robbery, other violence, and total violence) significantly declined during the lockdown, and had tendencies to increase again when physical distancing policies were relaxed. In addition, there were abrupt decreases in homicide in India (Poblete-Cazenave, 2020) and Peru (Calderon-Anyosa & Kaufman, 2021) after the containment measures went into effect. On the other hand, using weekly data from May 2017 to May 2020 in Vancouver, Canada, Hodgkinson and Andresen (2020) reported no apparent effects on violence. An examination of data from January to May of 2019 and 2020 in Mexico City showed that the lockdowns resulted in decreases in domestic violence, burglary, vehicle theft, assault-battery, and extortion, while no effects were reported for homicide, kidnapping, and robbery (Balmori de la Miyar et al., 2021).
In sum, the empirical evidence thus far is rather limited since the pandemic is a recent phenomenon, and data are not readily available. To make matters more complicated are the inconsistent results of prior studies across crime types, social distancing types, and locations. In addition, there are several limitations to the existing literature. All studies used city- or state-level data, which failed to capture the differences in the impacts of the pandemic and SAHOs on violent crimes across neighborhoods within a given city. Further research should use small geographic units to examine the heterogeneity of intervention impacts, which might give a more nuanced account of post-pandemic changes in gun violence at the neighborhood level. An additional way research can inform our knowledge is to include as many confounders as possible to reduce internal validity threats. To the author’s knowledge, little research has controlled for socio-economic covariates that possibly influence the relationship between the pandemic and gun violence. Finally, given that most studies examined short-term changes in violent crime following the SAHOs, future research can fill a gap in the literature by examining whether the pandemic had any long-term impacts on gun violence.
The Present Study
This research uses shooting data from New York City (NYC), which is located along the Hudson River and the Atlantic Ocean in the northeastern area of the US. It is one of the most densely populated cities with a population of more than 8.3 million (8,336,817) residents, as of 2019 (U.S. Census Bureau, 2019). The city is racially diverse; 57.3% of the population is White, 24.3% is African American, and 14.1% is Asian. Individuals of Hispanic heritage represent 29.1% of the city’s population (U.S. Census Bureau, 2019). According to the FBI’s U.S. Department of Justice, Federal Bureau of Investigation (2018), the violent crime rate in 2018 was 541.03 per 100,000 residents, and the property crime rate was 1,502.39.
NYC is an ideal location for the study of the pandemic and gun violence. As a result of the closure of non-essential workplaces, there was a substantial increase in the unemployment rate from 3.8% in March to 18.8% in June 2020 (U.S. Bureau of Labor Statistics, 2021). Non-white residents disproportionately faced a range of negative events, such as job and income loss, financial distress, food scarcity, and housing insecurity, all of which have expanded inequality among people (Shahid & Patino, 2021; Williams, 2021). As seen in Figure 1, gun violence in the city dramatically increased during the pandemic. The volume of gun violence during the early summer of 2020 was more than doubled compared to those in previous years. The current research attempts to test the hypotheses:
Hypothesis 1: Gun violence would significantly increase during the pandemic, while covariates are held constant.
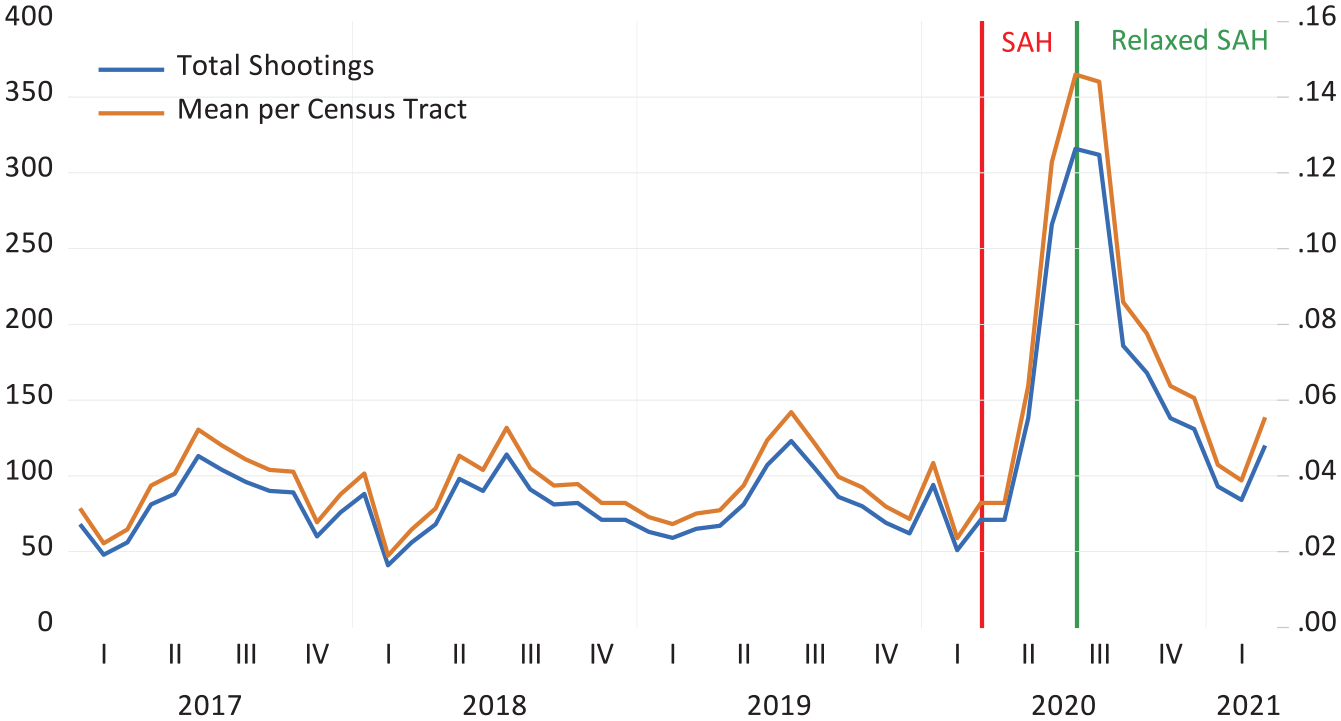
Shootings in New York City (January 2017–March 2021).
The outbreak of the pandemic took a heavy toll on poor racial minorities in NYC. Individuals in poor neighborhoods of color disproportionately lost employment income in service, construction, and retail industries and suffered from the economic downturn brought by the pandemic (Lew, 2020; Shahid & Patino, 2021; Williams, 2021). They also experienced high rates of food scarcity and housing insecurity after the pandemic. Furthermore, they were usually un- or under-insured and had fewer economic resources with which to come safely through the public health emergency (Solomon & Hamilton, 2020). Thus, they experienced more deaths from the coronavirus than did their white, wealthy counterparts (Lew, 2020; Schwirtz & Cook, 2020). Increased poverty and inequality might produce antagonistic feelings and relations among constituents and weaken informal social controls exercised through conventional values and order, all of which might have increased the risk of gun violence (Agnew, 2006; Merton, 1938; Messner & Rosenfeld, 2006; Sampson et al., 1997, 1999). Thus, this study tests additional hypotheses:
Hypothesis 2: Gun violence would increase in racial/ethnic minority neighborhoods to greater extents during the pandemic.
Hypothesis 3: Gun violence would increase in neighborhoods with high levels of absolute deprivation to greater extents during the pandemic.
Hypothesis 4: Gun violence would increase in neighborhoods with high levels of relative deprivation to greater extents during the pandemic.
Method
Data
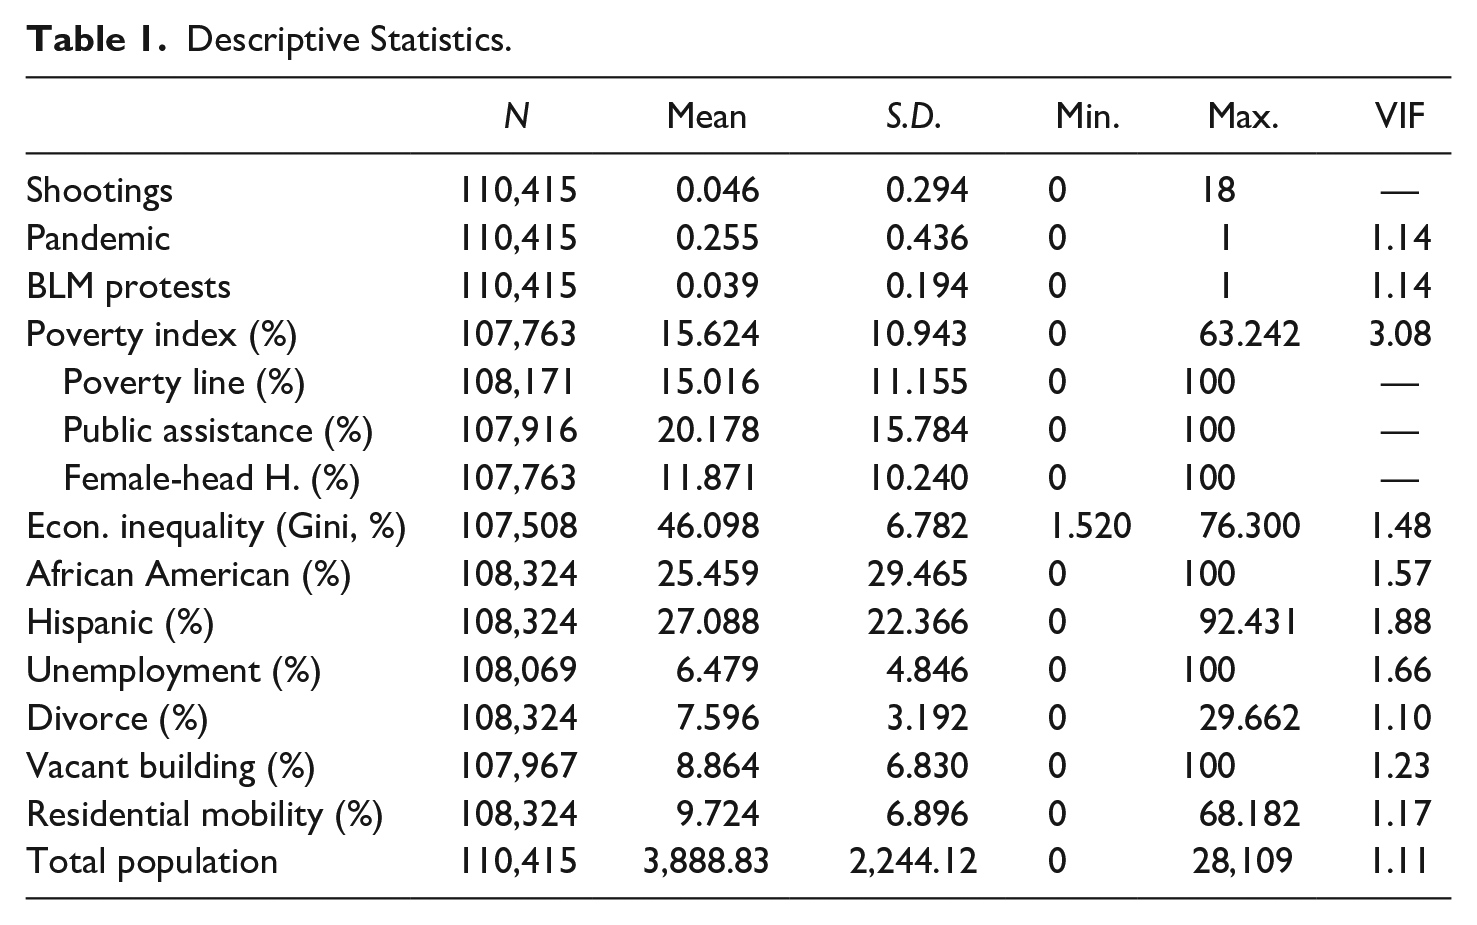
A spreadsheet of shooting data was obtained from the open data portal (https://opendata.cityofnewyork.us/). Individual cases were merged into monthly counts for each census tract. The geographic unit of analysis is census tracts, which approximate neighborhoods in NYC. The data include shooting incidents that occurred across 2,165 census tracts over 51 time points from January 2017 through March 2021, resulting in a total of 110,415 census tract-month observations. Table 1 includes descriptive statistics for all variables.
Descriptive Statistics.
Dependent variable
The dependent variable is the number of fatal and nonfatal shootings per month at the census tract level. Police crime statistics are based on the crimes known to police. One limitation is that unobserved and/or unreported shootings cannot be counted by consulting police records. However, the number of such unobserved/unreported cases may not be high due to the visibility and seriousness of shootings.
Independent variable
The independent variable entails the COVID-19 pandemic, which is captured in a dummy variable taking the value of one for the months of the intervention (March 2020–March 2021), and all pre-intervention months are coded as zero. On March 11, 2020, the WHO declared the outbreak of COVID-19 a global pandemic. Subsequently, all residents in NY State were ordered to stay at their residences from March through June. Even after the SAHO expired, the pandemic and social distancing restrictions still took a heavy toll on mental health among people and disrupted their daily routines until the end of the current data.
Control variables
Seasonality and BLM protests are included as controls. The impact of seasonality is captured in a set of 11 dummy variables for each month, for which January serves as a reference. In addition, there were a series of protests over police violence after the death of George Floyd on May 25, 2020 (Kimball, 2020). Although most protests were peaceful and nonviolent, some resulted in violence and riots (Mansoor, 2020). The highly publicized police-involved murder of George Floyd and social unrest might increase a sense of injustice, insecurity, and related strain among individuals and produce opportunistic situations in which people become involved in gun violence, either as victims or offenders, in the absence of active law enforcement.
The impact of the BLM protests is estimated via a dummy variable. Given that George Floyd was murdered at the end of the month, on May 25, 2020 and the unit of the study is months, it is difficult to appropriately operationalize the impact of the protests using a dummy variable, especially in terms of determining whether to use the month(s) of May to June or June only. Thus, the study considers multiple intervention points—a 1-month period and a 2-month period—to determine the point at which the protests started to affect civilian behavior and the onset of gun violence.
First, only the month of June in 2020 was coded as one, and the other months were coded as zero. The study uses the month of June as a primary intervention point to measure the impact of protests instead of May to June because most protests occurred in June. In addition, the impact in May of Floyd’s death on gun violence might be limited because he was murdered at the end of the month, on May 25, 2020. It might take several days until the death of Floyd began gaining public awareness and ultimately influencing gun violence.
Second, this study conducted a sensitivity analysis by estimating the model with an alternative 2-month dummy variable (see Appendix A). It took the value of one for the months of May and June, and otherwise coded as zero since the BLM protests began on May 28, and there were many protests from May 28 through June (NYC Department of Investigation, 2020). The 2-month period measure may allow for estimating the impact of George Floyd’s death on gun violence, which could not be captured by the 1-month period measure. The use of multiple intervention points helps us to understand when the BLM protests actually began to exert an impact on gun violence.
This study includes a set of neighborhood variables: poverty, economic inequality, racial/ethnic composition (African Americans and Hispanics), unemployment, family disruption, and residential instability. All neighborhood variables at the census tract level are drawn from the 2015 to 2019 American Community Survey (ACS) 5-year estimates; thus, the neighborhood data are time invariant.
First, poverty is made of three indicators: the percentages of individuals living under the poverty line, households receiving public assistance (food stamps or SNAP), and female-headed families (Cronbach’s α = .845). This index measures the extent of absolute deprivation.
Second, economic inequality as an indicator of relative deprivation is measured with the Gini Index. It represents distributional inequality of income or wealth, ranging from 0 (perfect equality) to 1 (perfect inequality). For convenience, the Gini coefficient in this study is expressed as a percentage by multiplying by 100.
Third, unemployment is measured as the percentage of unemployed individuals in the civilian labor force. It can estimate the size of economically disadvantaged people who are more prone to crime out of finantial strain during the pandemic.
Fourth, family disruption is measured as the percentage of residents who are divorced. Family bond is important in connecting individuals to conventional institutions and norms. The intact family serves as an informal social control and keeps individuals from engaging in criminal behavior, while its breakdown results in an increase in the probability of crime.
Fifth, residential instability is measured as the percentage of vacant properties and people who had moved in the past year. Both indicators were not merged into a single composite score due to the low value of Cronbach’s α (.340). Crime is often associated with physical and social disorder (Kelling & Wilson, 1982). Vacant and abandoned buildings indicate physical and social deterioration of neighborhoods and are interpreted as a sign of weakened informal social control. In addition, they provide spatial opportunities for motivated offenders to be engaged in anti-social behavior and to be hidden from police officers and neighbors. In addition, crimes are often associated with high turnovers in the population (Shaw & McKay, 1942).
Finally, the total population at the census tract level was included in the model to control for the effect of population size on gun violence. It also transforms the counts of gun violence to population-based rates, ultimately allowing for accurate comparisons between census tracts with different population sizes. A series of dummy variables were also created to examine whether there are differences in gun violence across the five boroughs. Although shooting counts at the census tract level are nested within boroughs, 1 this study does not use multilevel modeling due to the existence of very few clusters at the second level (McNeish & Stapleton, 2016; see Appendix B).
Statistical Analysis
The goal of the study is to examine the effect that the pandemic had on gun violence and its interaction effects with neighborhood characteristics. Three steps are required for statistical analysis. First, this study performs t-tests to provide preliminary evidence for the pandemic-gun violence association. Second, unit root tests examine the presence of non-stationarity in the series. Third, negative binomial regression is used since the count distribution of the dependent variable has many zero values and is overdispersed. Table 2 shows the average numbers of shootings before and after the pandemic. The conditional variances before and after the pandemic (0.069 and 0.137) are higher than the conditional means (0.037 and 0.074), which presents the existence of overdispersion. Random effects models are used to allow for estimating the effects of time-invariant neighborhood variables. Finally, fixed effects Poisson models are also used to improve the reliability of the study.
Statistics for T Tests.

Significant at α = .01.
Results
T-Tests
Figure 1 provides a visual illustration of changes in shootings from January 2017 through March 2021. The red line shows the implementation of the SAHO as a starting point of the pandemic. Although no immediate increase in gun violence was realized in March and April after the SAHO, there were dramatic increases in May and June. Given that the death of George Floyd on May 25 led to a series of protests and associated public disorder and crime in May and June, it is thus not clear whether such increases in gun violence are associated with unrest from the pandemic, the death of George Floyd, or both. Gun violence reached the highest peak in July 2020 at 316 incidents per month. Afterward, gun violence substantially fell off to 120 incidents by March 2021, but its amount was still higher than that prior to the pandemic.
As shown in Table 2, this study aggregates and averages observations across census tracts for each month. The sum and mean of shootings across census tracts in the post-pandemic period are significantly higher than those in the pre-pandemic period. The t-test supports the notion that the pandemic resulted in substantial increases in shootings. In addition, this study checks for multicollinearity. Given that the VIF values for all independent variables are less than four (Studenmund, 2014), there is no multicollinearity problem in this study. In the next sections, this study examines the impacts of the pandemic on gun violence, while other variables are held constant.
Unit Root Tests
With the pre-intervention observations, the current study conducts several non-stationarity tests: Levin-Lin-Chu, Harris-Tzavalis, and Breitung tests. All tests examine the null hypothesis of a unit root. Table 3 reports that the dependent variable does not have a unit root and is stationary. Differencing is not needed for stationarity.
Statistics for Unit Root Tests.

Significant at α = .01.
The Model With Main Effects
Table 4 reports the results of random-effects negative binomial model with main effects. Negative binomial coefficients are interpreted as the changes in the natural logs of expected counts for shootings in response to changes in the independent variables. For easier interpretation, they are exponentiated and communicated in terms of incidence rate ratios (IRRs; Long, 1997). The coefficient of COVID-19 captures the change in the average number of shootings during the pandemic, which is statistically significant (b = .683, p = .000). The estimated IRR is 1.980. During the pandemic, there was a significant increase in shootings by 98%, or (1.980−1) × 100. In addition, the estimated IRR for BLM protests is 1.329 (b = .284, p = .006), implying a 32.9% increase in the number of shootings per month following the death of George Floyd. Their effect is statistically significant at the .01 level. Eleven seasonal dummy variables are included in the model while January serves as a reference category. For conciseness, they are not reported in the table. There are significant increases in shootings during the months of May through October, as opposed to January. In contrast, shootings are less likely to occur in February and March than January.
Random Effects Negative Binomial Models With Main Effects, Total N = 107,457.

Note. Pseudo-R2 statistics = .0801. The CI lower and CI upper columns present the 95% confidence intervals around the exponentiated b coefficients. Eleven seasonal dummy variables are included in the models while January serves as a reference category. However, they are not reported in the table for conciseness. There were significant increases in shootings during the months of May through October, as opposed to January. In contrast, shootings are less likely to occur in February and March than January.
Most neighborhood variables are significant predictors of gun violence. Given that all neighborhood variables are time invariant, their coefficients present geographic differences in shootings for a one-unit difference in the independent variables across census tracts, not within census tracts. Thus, the neighborhood variables cannot be said to cause any change in gun violence because they are constant over time for each census tract. Both absolute and relative deprivation measures are statistically significant. The estimated IRR for poverty is 1.031 (b = .030, p = .000), implying a 3.1% increase in the number of shootings where the index of poverty increases by 1%. The estimated IRR for economic inequality is 1.025 (b = .024, p = .000). A 1% increase in the GINI index is associated with an estimated 2.5% increase in the incidence rate of shootings. In addition, the estimated IRR for African American and Hispanic populations are 1.032 (b = .032, p = .000) and 1.021 (b = .021, p = 0.000) and statistically significant. A 1% increase in African American and Hispanic populations would raise the rate of shootings by 3.2% and 2.1%, respectively.
In addition, divorce, residential mobility, and total population are statistically significant predictors of gun violence. The estimated IRR for divorce is −0.016 (b = −.016, p = .045), showing a 1.6% decrease in the number of shootings for every 1% increase in the proportion of divorced residents. The incidence rates of shootings increase by 2.1% (b = .021, p = .000) where there is an increase in the percent of people who had moved in the past year. Population size is also positively associated with gun violence, but its effect is very minimal (b = .000, p = .000). Further, the incidence rates of shootings are significantly lower in The Bronx (.730) at the .01 level, as opposed to Manhattan. Finally, unemployment, and vacant buildings are assumed to increase the incidence rate of shootings, but they are not significant at the .05 level.
The Model With Interaction Effects
This study examines whether the association between the pandemic and gun violence is moderated by neighborhood characteristics. The estimates were reported in Table 5. The value of the pseudo-R2 statistics for the interaction effects model (.0802) is slightly higher than that for the main effects model (.0801). However, there is no substantive difference between the main and interaction models.
Random Effects Negative Binomial Models With Interaction Effects, Total N = 107,457.
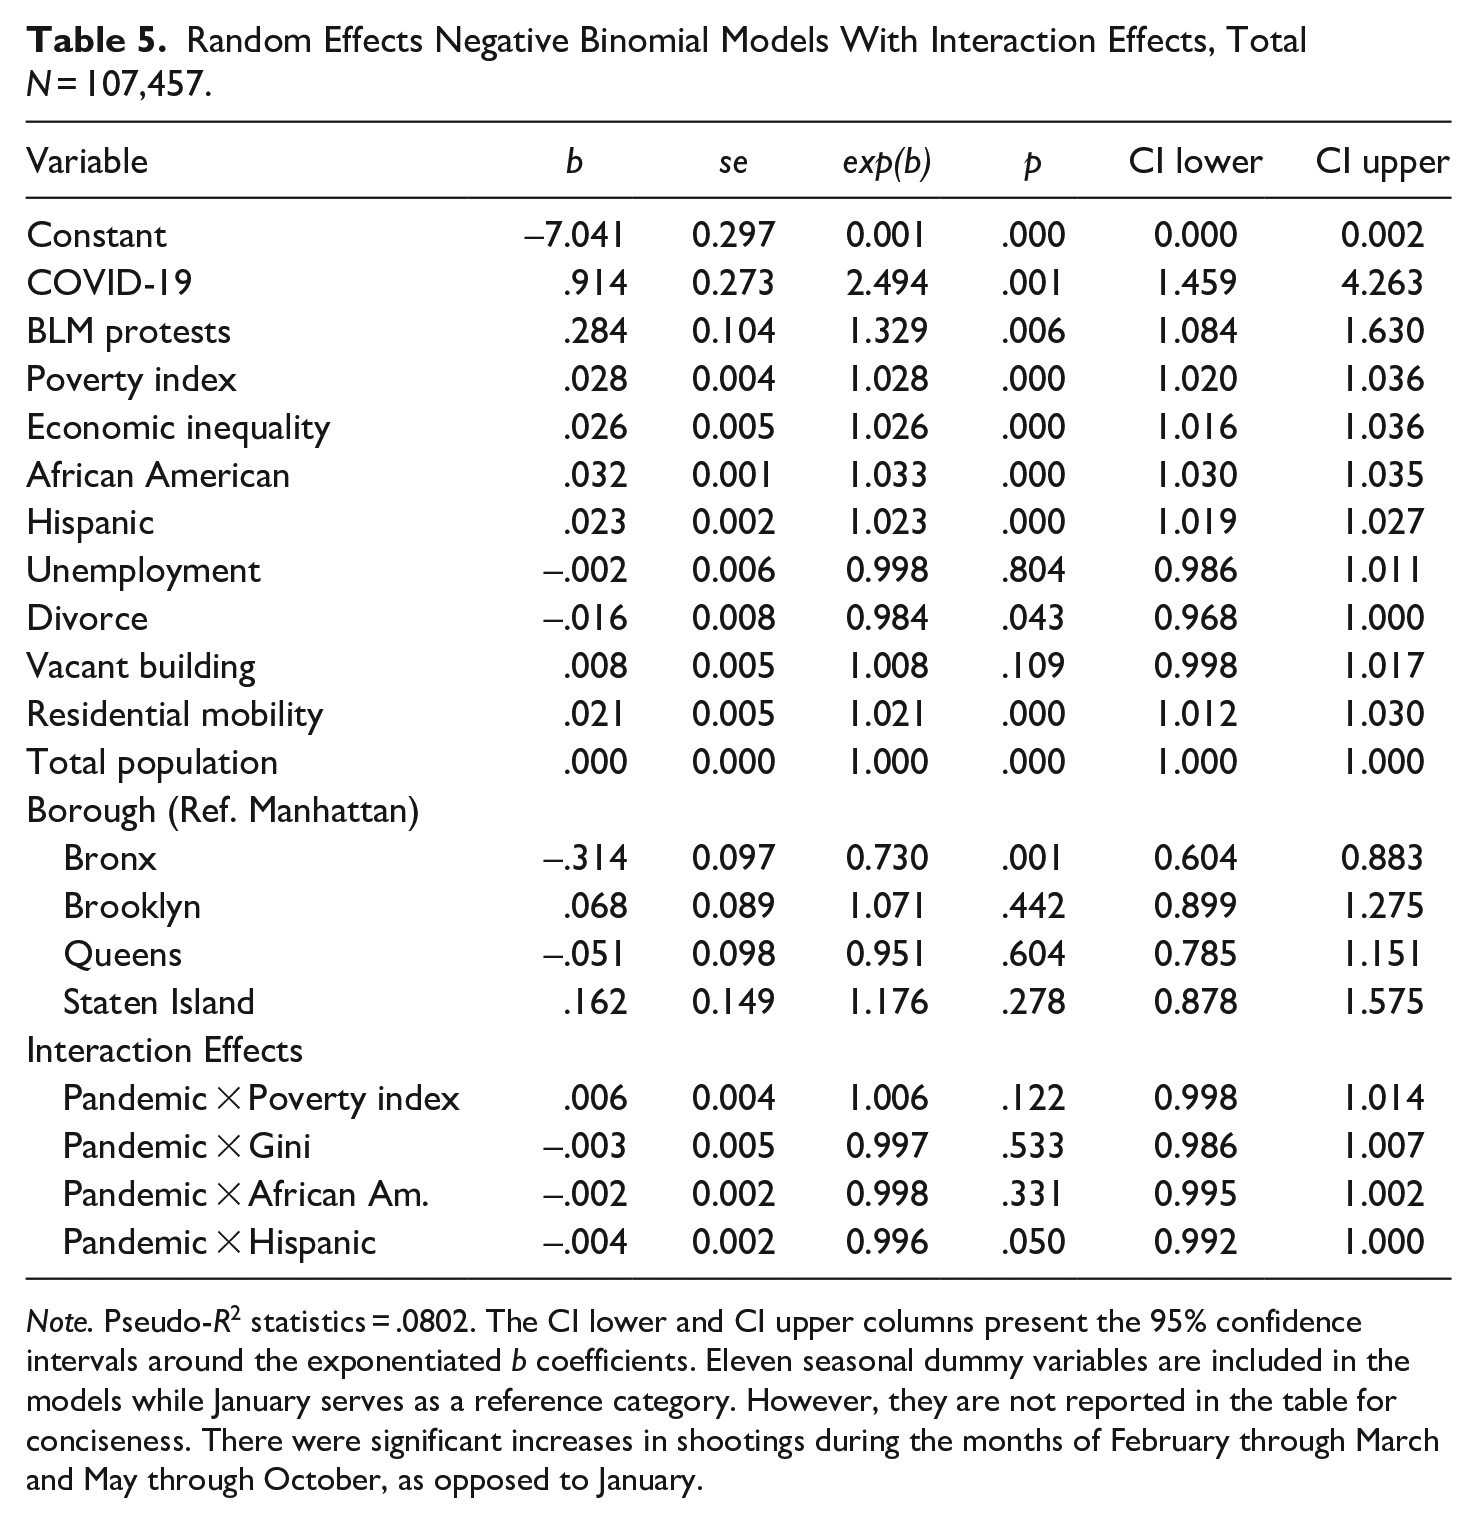
Note. Pseudo-R2 statistics = .0802. The CI lower and CI upper columns present the 95% confidence intervals around the exponentiated b coefficients. Eleven seasonal dummy variables are included in the models while January serves as a reference category. However, they are not reported in the table for conciseness. There were significant increases in shootings during the months of February through March and May through October, as opposed to January.
Among the four interaction terms, there is an interaction effect between the pandemic and Hispanic population (b = −.004, p = .050). The p-value is on the borderline of statistical significance at the conventional level. A 1% increase in the Hispanic population is associated with an estimated 0.4% decrease in the incidence rate of shootings during the pandemic. No significant interaction was detected between the pandemic and the African American population. In addition, none of the economic deprivation interaction terms reach a conventional level of significance; the pandemic does not interact with absolute and relative deprivation in their effects on gun violence. Finally, there are no notable differences in the coefficient estimates of the pandemic and neighborhood variables between the models with main- and interaction-effects with regard to their magnitude, direction, and significance.
Fixed Effects Poisson Models With Main and Interaction Effects
As seen in Tables 6 and 7, this study conducted additional analyses to improve the reliability of the study. Fixed effects Poisson models can statistically adjust for time-invariant differences between the census tracts. Robust standard errors are used to adjust for any violations of statistical assumptions, such as overdispersion, serial correlation, and heteroscedasticity (Wooldridge, 1999). The pandemic and BLM protests are statistically significant in both the main and interaction effects models. All neighborhood variables are removed from the models because they are constant within each census tract and collinear with the fixed effects. Please note that fixed effects models examine within-group variation over time. Given that many census tracts have all zero outcomes and no variation in gun violence across time units, they were dropped from the fixed effects models.
Fixed Effects Poisson Models With Main Effects, Total N = 55,080.
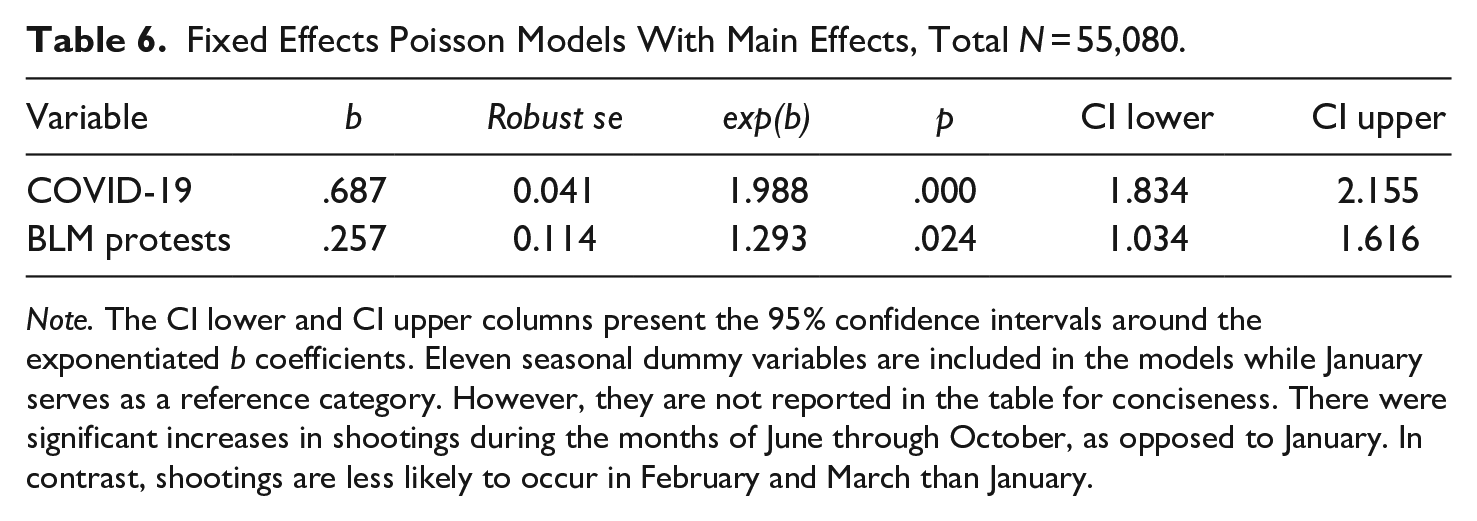
Note. The CI lower and CI upper columns present the 95% confidence intervals around the exponentiated b coefficients. Eleven seasonal dummy variables are included in the models while January serves as a reference category. However, they are not reported in the table for conciseness. There were significant increases in shootings during the months of June through October, as opposed to January. In contrast, shootings are less likely to occur in February and March than January.
Fixed Effects Poisson Models With Interaction Effects, Total N = 55,080.

Note. The CI lower and CI upper columns present the 95% confidence intervals around the exponentiated b coefficients. Eleven seasonal dummy variables are included in the models while January serves as a reference category. However, they are not reported in the table for conciseness. There were significant increases in shootings during the months of June through October, as opposed to January. In contrast, shootings are less likely to occur in February and March than January.
Discussion and Conclusion
This study examined the impact of the pandemic on gun violence and integrated its interaction effects with neighborhood factors into the analysis. Various model specifications were used to improve the reliability of the present findings. Several findings are worthy of detailed discussion.
First, NYC experienced a dramatic increase in shootings during the pandemic. The volume of gun violence in 2020 to 2021 was much higher than those in the past 3 years. Such an increase in shootings is in line with strain theory (Agnew, 2006; Merton, 1938; Messner & Rosenfeld, 2006). Given the significant effects of absolute and relative deprivation in the study, financial difficulties put a strain on individuals and compel them to commit crime in the contexts of high alcohol consumption and gun sales. Other pandemic-related stresses and strains, such as fear of contagion, physical isolation, limited social interactions, uncertainty, and insecurity, might also contribute to increases in gun violence. In addition, the current finding is consistent with the findings of prior studies (for Buffalo, Kim & Phillips, 2021; for 28 U.S. cities, Rosenfeld & Lopez, 2020). However, some studies show no significant changes in homicide and gun violence during the pandemic (for 25 US cities, Abrams, 2020; for Los Angeles, Brantingham et al., 2021; Campedelli et al., 2021). Given the short-term post-intervention data from March to May 2021 (Abrams, 2020) or in March 2021 only (Campedelli et al., 2021), both studies overlooked the possibility that the pandemic might take a long time to exert its impact on gun violence. In addition, Brantingham et al. (2021) used ARIMA forecasts to estimate whether observed values fall within or outside the upper or lower bounds of the confidence interval. Despite the authors’ conclusion of limited effects of the SAHO on gang-related gun violence, there were several discrete spikes in the series above the 95% confidence interval, suggesting significant impacts of the pandemic on gang-related gun violence.
Second, both poverty and GINI indexes are significantly associated with gun violence. Overall, shootings are likely to occur in neighborhoods with high levels of absolute and relative deprivation. Both social disorganization and strain theories offer logical mechanisms underlying the economic deprivation-gun violence association. An absolute and/or relative lack of legitimate means to attain economic goals can be important sources of strain and thereby increase crime rates (Agnew, 2006; Merton, 1938; Messner & Rosenfeld, 2006). People have a tendency to engage in gun violence across neighborhoods where they are caught in chronic poverty and economic inequality (Shaw & McKay, 1942).
Third, the percentages of African Americans and Hispanics in neighborhoods are positively related to levels of gun violence, while absolute and relative economic deprivation and other neighborhood variables are held constant. These findings are inconsistent with Shaw and McKay’s (1942) social disorganization theory stating that high crimes in inner-city areas are more attributable to poverty and other structural disadvantages regardless of which racial/ethnic population live in a neighborhood. In contrast, several scholars (Anderson, 1999; Wilson, 1987, 2009) argued that there are subcultural adaptations in inner city neighborhoods of color that are more tolerant of violence in response to chronic socio-economic disadvantage. Violence has been disproportionately concentrated in inner city neighborhoods with high minority populations, controlling for structural factors, such as poverty, unemployment, and other disadvantage factors (Land et al., 1990; Pratt & Cullen, 2005; Shihadeh & Shrum, 2004).
Fourth, Manhattan is more likely than The Bronx to experience gun violence. This finding is somewhat contrary to expectations, given that there have been more occurrences of gun violence in The Bronx. Despite controlling for a range of neighborhood variables in this study (poverty, equality, racial/ethnic composition, unemployment, divorce, residential instability, and total population), there might be unknown factors that have driven the increases in gun violence in Manhattan during the pandemic, warranting further research to investigate this issue. One possible, but speculative, explanation is occurrences of many large-scale BLM protests and associated crimes in Manhattan (NYC Department of Investigation, 2020).
Fifth, this study tests whether there are interactions between the pandemic and neighborhood characteristics in their effects on gun violence. Among the four interaction terms, only the pandemic × Hispanic population is statistically significant. While various socio-economic confounders are held constant, neighborhoods with a higher Hispanic population experienced significant decreases in gun violence during the pandemic, as opposed to prior to the pandemic. This finding is contrary to the current hypothesis and may demonstrate the importance of identifying unique subcultures in different racial/ethnic neighborhoods. In addition, although the pandemic and both absolute and relative economic deprivation have significant main effects, they do not interact in influencing gun violence. These findings fail to lend support to the current hypotheses. The pandemic has disproportionately worsened financial insecurity among disadvantaged people of color and widens inequality (Perry et al., 2021), which did not necessarily result in more shootings in minority neighborhoods with high economic deprivation during the pandemic. However, the findings should be interepreted with caution. Given that this study uses time-invariant neighborhood variables, it is not sufficient to capture interaction effects between the pandemic and neighborhood variables. In addition, it is plausible that the Coronavirus Aid, Relief, and Economic Security (CARES) Act might provide economic relief for those who are most vulnerable to the economic fallout of the pandemic and precluded disproportionate effects of the pandemic on gun violence in minority neighborhoods with high economic deprivation.
This study includes several limitations. First, the data include shooting incidents reported to the NYC Police Department. Underreporting can be a source of measurement error because reported shootings may capture only a fraction of occurred gun violence. However, crime underreporting may not be a serious issue in the study since gun violence is a type of crime that is most likely to be known to the police. In addition, given variations in defining and recording gun violence across jurisdictions, a comparison of cross-sectional data should be made with caution.
Second, this study uses a quasi-experimental research design that is vulnerable to threats to internal validity. Given that the coronavirus is a global phenomenon, it is difficult to identify comparison areas that are not exposed to the coronavirus but otherwise equivalent to the treatment areas. Alternatively, this study included a variety of neighborhood variables as controls, reducing the problem of omitted variables. However, given the unavailability of monthly information, neighborhood characteristics are measured as time-constant variables. An advanced research design for causal inference would be to use time-varying covariates to examine the pandemic-gun violence association. Unfortunately, no data provide monthly information on socio-economic variables at the census tract level.
Another concern is whether there might be some confounding of the BLM protests and pandemic in affecting gun violence. There was no immediate rise in shootings in March and April following the announcement of the SAHO and pandemic. Instead, gun violence began increasing dramatically in the end of May and peaked in June during the intense BLM protests. In this study, dummy variables were added to separate out any changes in gun violence during the post- Floyd unrest. The significance of the BLM protests is contingent upon how the variable was operationalized to measure its effects. In the models with the 1-month period measure, the BLM protests are positively associated with gun violence at the .01 significance level (see Tables 4 and 5). In contrast, while other variables remain similar in terms of significance and direction, the effects of BLM protests turned out to be nonsignificant in the model with the two-month period measure (see Appendix B). Given no direct measures of the effects of the BLM protests on gun violence, this study operationalized their effects using a dummy variable. Unless research can identify the numbers of shootings associated with the BLM protests, it is impossible to adequately separate the effect of BLM protests on gun violence from that of the pandemic. Unfortunately, no police agency has provided such detailed information. Further research is required to rule out the possibility of measurement error.
Third, this study uses aggregate data for gun violence. Due to the unavailability of disaggregated data, it overlooked the heterogeneity of intervention impacts across different gun violence types. For example, there might be increases in shootings involved in domestic violence since victims are more likely to be exposed to motivated offenders in their homes due to the SAHOs and social distancing policies. In contrast, gun violence for burglary and robbery might decrease in residential areas due to the presence of more guardianship of property. Using disaggregated data is essential to understand a complex picture of post-pandemic changes in gun violence and provide useful policy implications. A final limitation regards the lack of generalizability. It is unclear whether the findings are generalizable across other cities. Future research is required to test varying effects of the pandemic on gun violence across jurisdictions.
Despite the above shortcomings, this study should be a step in the right direction to having a greater understanding of gun violence during the pandemic. It contributes to the literature by examining the impact of the pandemic and its interactions with neighborhood characteristics. It also includes many neighborhood covariates to reduce internal validity threats. Given the lack of micro level research, further work with a range of data and research designs is needed for a deeper understanding of the pandemic-gun violence association.
Footnotes
Appendix
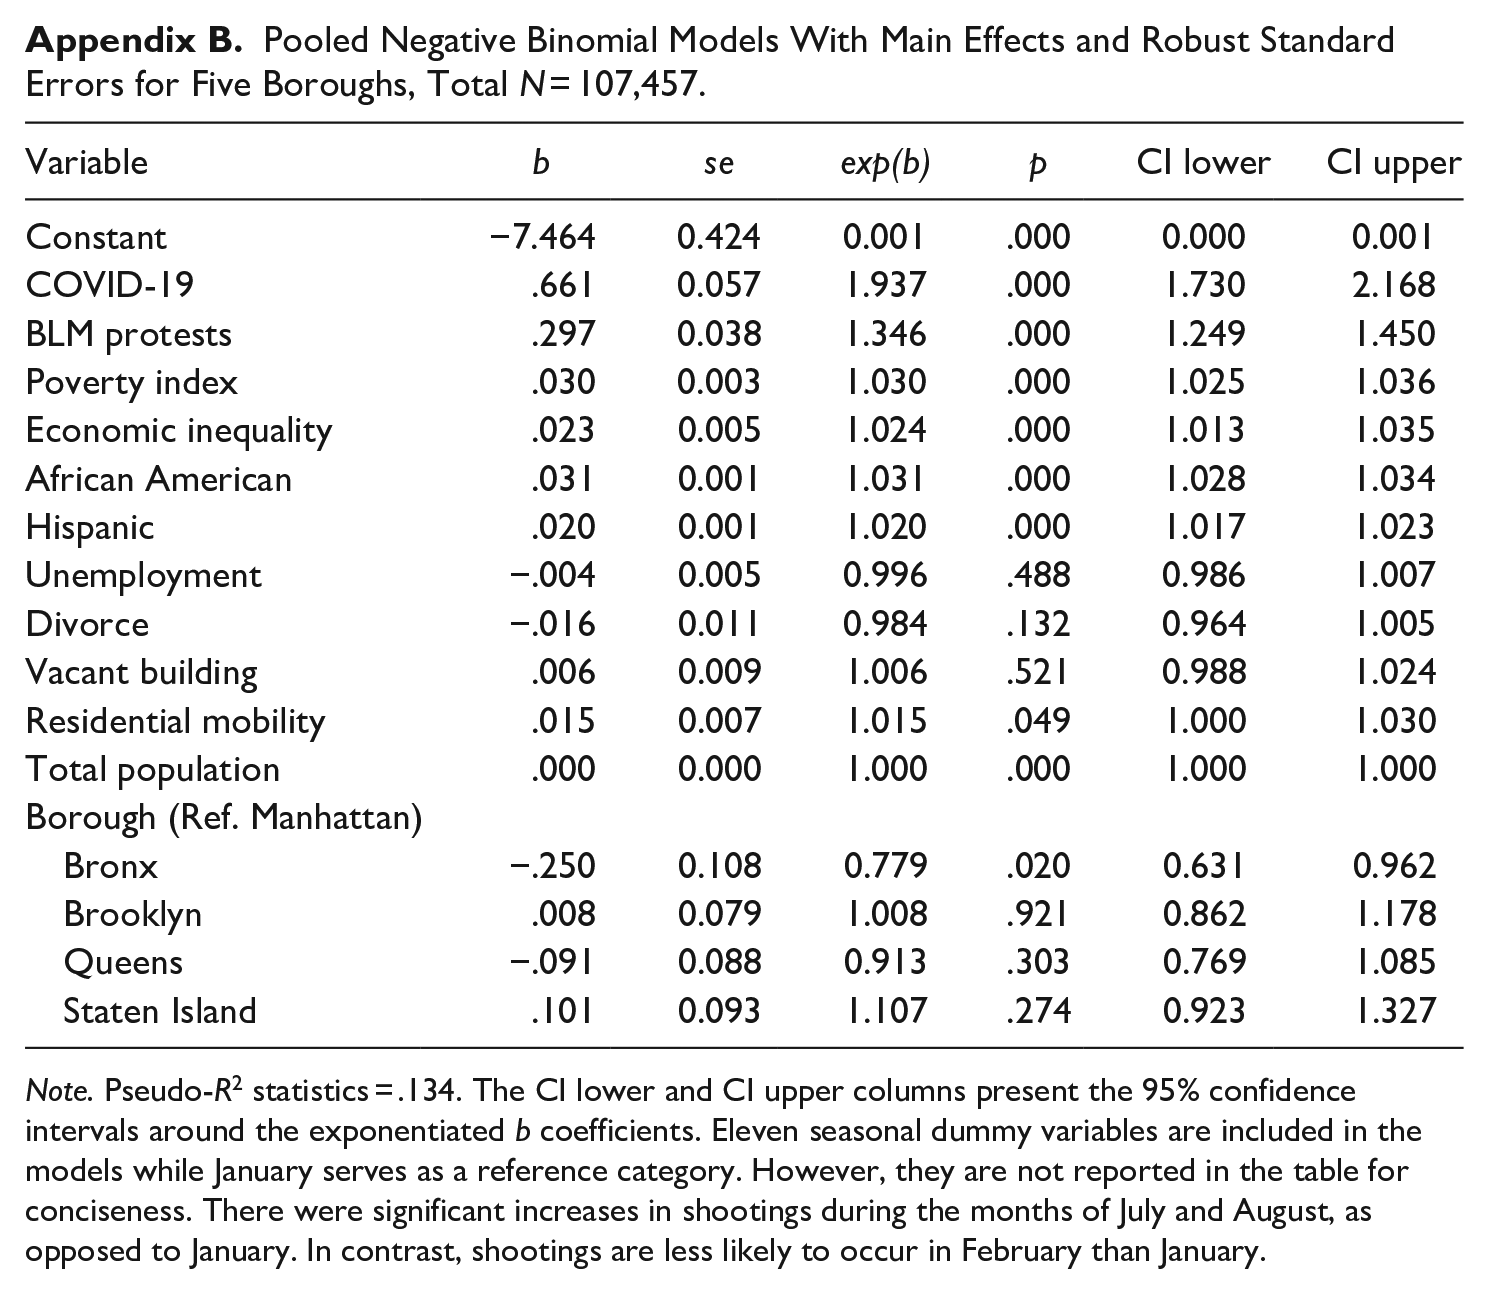
Pooled Negative Binomial Models With Main Effects and Robust Standard Errors for Five Boroughs, Total N = 107,457.
| Variable | b | se | exp(b) | p | CI lower | CI upper |
|---|---|---|---|---|---|---|
| Constant | −7.464 | 0.424 | 0.001 | .000 | 0.000 | 0.001 |
| COVID-19 | .661 | 0.057 | 1.937 | .000 | 1.730 | 2.168 |
| BLM protests | .297 | 0.038 | 1.346 | .000 | 1.249 | 1.450 |
| Poverty index | .030 | 0.003 | 1.030 | .000 | 1.025 | 1.036 |
| Economic inequality | .023 | 0.005 | 1.024 | .000 | 1.013 | 1.035 |
| African American | .031 | 0.001 | 1.031 | .000 | 1.028 | 1.034 |
| Hispanic | .020 | 0.001 | 1.020 | .000 | 1.017 | 1.023 |
| Unemployment | −.004 | 0.005 | 0.996 | .488 | 0.986 | 1.007 |
| Divorce | −.016 | 0.011 | 0.984 | .132 | 0.964 | 1.005 |
| Vacant building | .006 | 0.009 | 1.006 | .521 | 0.988 | 1.024 |
| Residential mobility | .015 | 0.007 | 1.015 | .049 | 1.000 | 1.030 |
| Total population | .000 | 0.000 | 1.000 | .000 | 1.000 | 1.000 |
| Borough (Ref. Manhattan) | ||||||
| Bronx | −.250 | 0.108 | 0.779 | .020 | 0.631 | 0.962 |
| Brooklyn | .008 | 0.079 | 1.008 | .921 | 0.862 | 1.178 |
| Queens | −.091 | 0.088 | 0.913 | .303 | 0.769 | 1.085 |
| Staten Island | .101 | 0.093 | 1.107 | .274 | 0.923 | 1.327 |
Note. Pseudo-R2 statistics = .134. The CI lower and CI upper columns present the 95% confidence intervals around the exponentiated b coefficients. Eleven seasonal dummy variables are included in the models while January serves as a reference category. However, they are not reported in the table for conciseness. There were significant increases in shootings during the months of July and August, as opposed to January. In contrast, shootings are less likely to occur in February than January.
Acknowledgements
The author expresses his sincere gratitude to Dr. Andrew Wheeler who has shared his time and knowledge for the data collection and manipulation. He also greatly appreciates Dr. Jesenia Pizarro and two anonymous reviewers for their constructive suggestions.
Declaration of Conflicting Interests
The author declared no potential conflicts of interest with respect to the research, authorship, and/or publication of this article.
Funding
The author received no financial support for the research, authorship, and/or publication of this article.