
Abstract
The use of faith-based organizations as sites to deliver diet and physical activity interventions is increasing. Methods to assess the messaging environment within churches are limited. Our research aimed to develop and test an objective assessment methodology to characterize health messages, particularly those related to diet and physical activity, within a sample of African American churches. Written messages (bulletins, brochures, magazines) were systematically collected over 1 year and analyzed with a coding scheme that had high interrater reliability (average κ = .77). Within all health messages (n = 1109), diet and physical activity messages were prevalent (47% and 32%, respectively). Consistent with prior qualitative research, messages related to meals and to providing food to people in need were frequently found (54% and 25% of diet messages, respectively). Contrary to past research, sports and physical activity as praise (e.g., praise dancing) were the most prevalent physical activity messages (36% and 31% of physical activity messages, respectively). Bulletins, flyers, and brochures were the media in which diet and physical activity messages were most frequently found (14%, 33%, and 24%, respectively), and the church was the most frequent source (41%). Only diet and physical activity messages focused on disease prevention were more likely to originate from national health organizations than from the church (26% vs. 16%). Churches varied in the topics, media types, and sources of health messages, an important factor to consider when planning and implementing health promotion research. Future research should determine whether the enhancement of church messaging environments can produce behavioral change.
From heart disease to cancer and diabetes, African Americans (AAs) have disproportionately higher incidence and mortality risk than European Americans (Centers for Disease Control and Prevention, 2008). Because diet and physical activity (PA) behaviors are important determinants of these diseases, Healthy People 2020 includes goals related to both healthy eating and PA for national health improvement and the elimination of health disparities (Koh, Piotrowski, Kumanyika, & Fielding, 2011; U.S. Department of Health and Human Services, 2010). Reports of dietary and PA practices indicate AAs may have less healthy diets and be less physically active than European Americans, which may help partially explain health disparities between these groups (Centers for Disease Control and Prevention, Office of Surveillance Epidemiology and Laboratory Services, 2009). However, exposure to physical and social environments, including policies and communications that shape these environments, has as much influence, if not more, than personal factors in influencing diet and PA behavior change (French, Story, & Jeffery, 2001; Sallis et al., 2003). The messaging environment encompasses the types and location of messages that promote either healthy or unhealthy diet and PA practices (Cohen, Scribner, & Farley, 2000). A better understanding of the messaging to which AAs are exposed should inform future intervention development.
Faith-based interventions are increasingly used to deliver programs that address health disparities among AAs (Ammerman et al., 2002; Campbell et al., 2004; Faridi et al., 2009; Resnicow et al., 2004; Resnicow et al., 2005; Wilcox et al., 2007; Wilcox et al., 2010; Yanek, Becker, Moy, Gittelsohn, & Koffman, 2001; Young & Stewart, 2006). The church is a trusted source of health information for AAs (Matthews, Sellergen, Manfriedi, & Williams, 2002), and churches have great reach within the AA community. For example, 87% of AAs in the United States report having a formal religious affiliation, and 79% report that religion is very important in their lives (The Pew Forum on Religion and Public Life, 2009). Historically, churches have been considered the cornerstone of AA communities with their mission extending to social, economic, and political issues affecting their congregants and community (Campbell et al., 2007; Mamiya, 2006; Torrence, Phillips, & Guidry, 2005). Ecological models suggest that the church setting influences not only intrapersonal factors, such as knowledge, attitudes, beliefs, and behaviors, but also interindividual relationships and social norms within the church and the larger community it serves (Cohen, 2000; McLeroy, Bibeau, Steckler, & Glanz, 1988). The health-related messages AAs receive at church may play an important role in promoting healthy behaviors; however, little is known about the range, frequency, and content of these messages.
To date, assessments of health messages within AA churches have relied on qualitative methods and self-report surveys to assess awareness of messages related to diet and, to a lesser degree, PA among church members and leaders (Baruth, Wilcox, & Condrasky, 2011; Baruth, Wilcox, Laken, Bopp, & Saunders, 2008; Campbell et al., 2000; Campbell et al., 2007; Kegler, 2010; Williams, Glanz, Kegler, & Davis, 2009). Interviews and focus groups have assessed perceptions regarding health promotion messaging provided by the pastor (Atkinson et al., 2009; Baruth et al., 2008; Campbell et al., 2007; Kegler, 2010). Other studies have asked church members to report awareness of health promotion messaging and self-report influence of these messages on dietary behavior as part of both process evaluation (Campbell et al., 2000) and impact evaluation (Baruth et al., 2011; Williams, Glanz, Kegler, & Davis, 2009). One study of AA churches found a significant positive association between intervention participants’ reported awareness of written nutrition messages and their dietary intake; however, few details were provided on question content (Baruth et al., 2011). In another study of rural churches, poor agreement was observed between pastors and church members regarding exposure to health messages (Williams et al., 2009). Given these concerns about the reliability and validity of self-reported data collected to-date, a more objective assessment of messages has been recommended in order to improve scientific understanding of the characteristics and impact of the message environment in churches (Williams et al., 2009).
The purpose of this study was to develop a systematic content analysis methodology to characterize diet and PA messages in AA churches. While based in traditional content analysis methodology (Neuendorf, 2002), our application is novel and described here in detail. Results are descriptive, exploring the frequency of diet and PA topics and their association with different media types and sources. Our intention is to aid future research on the messaging environment within churches and other organizations.
Method
Sample Collection
All study procedures were approved by the Internal Review Board at the University of South Carolina before recruitment and data collection began. Data were collected from a sample of 11 churches that participated in a larger diet and PA intervention study. The larger study is ongoing, but only data from the first wave were analyzed for this article. All 11 churches had predominantly AA congregations, ranged in size (Table 1), and were from both urban and rural areas in the Midlands of South Carolina. The majority of churches recruited were Baptist in denomination. Five churches were randomized into the study’s control arm and six into the intervention arm. The primary purpose of the intervention was to assist congregation members in adopting a more anti-inflammatory diet and increasing their PA. Leaders from each intervention church were trained to implement group classes aimed at individual-level diet and PA change. The data analyzed in this study were collected in part to assess the context within which these classes were conducted. The only intervention strategy that promoted environmental-level change was a handout given to leaders at 6 months that highlighted messages, polices, and pastor involvement as ways to promote healthier behaviors church wide.
Item Counts (Total and Unique) by Church, Time Point, and Study Arm.
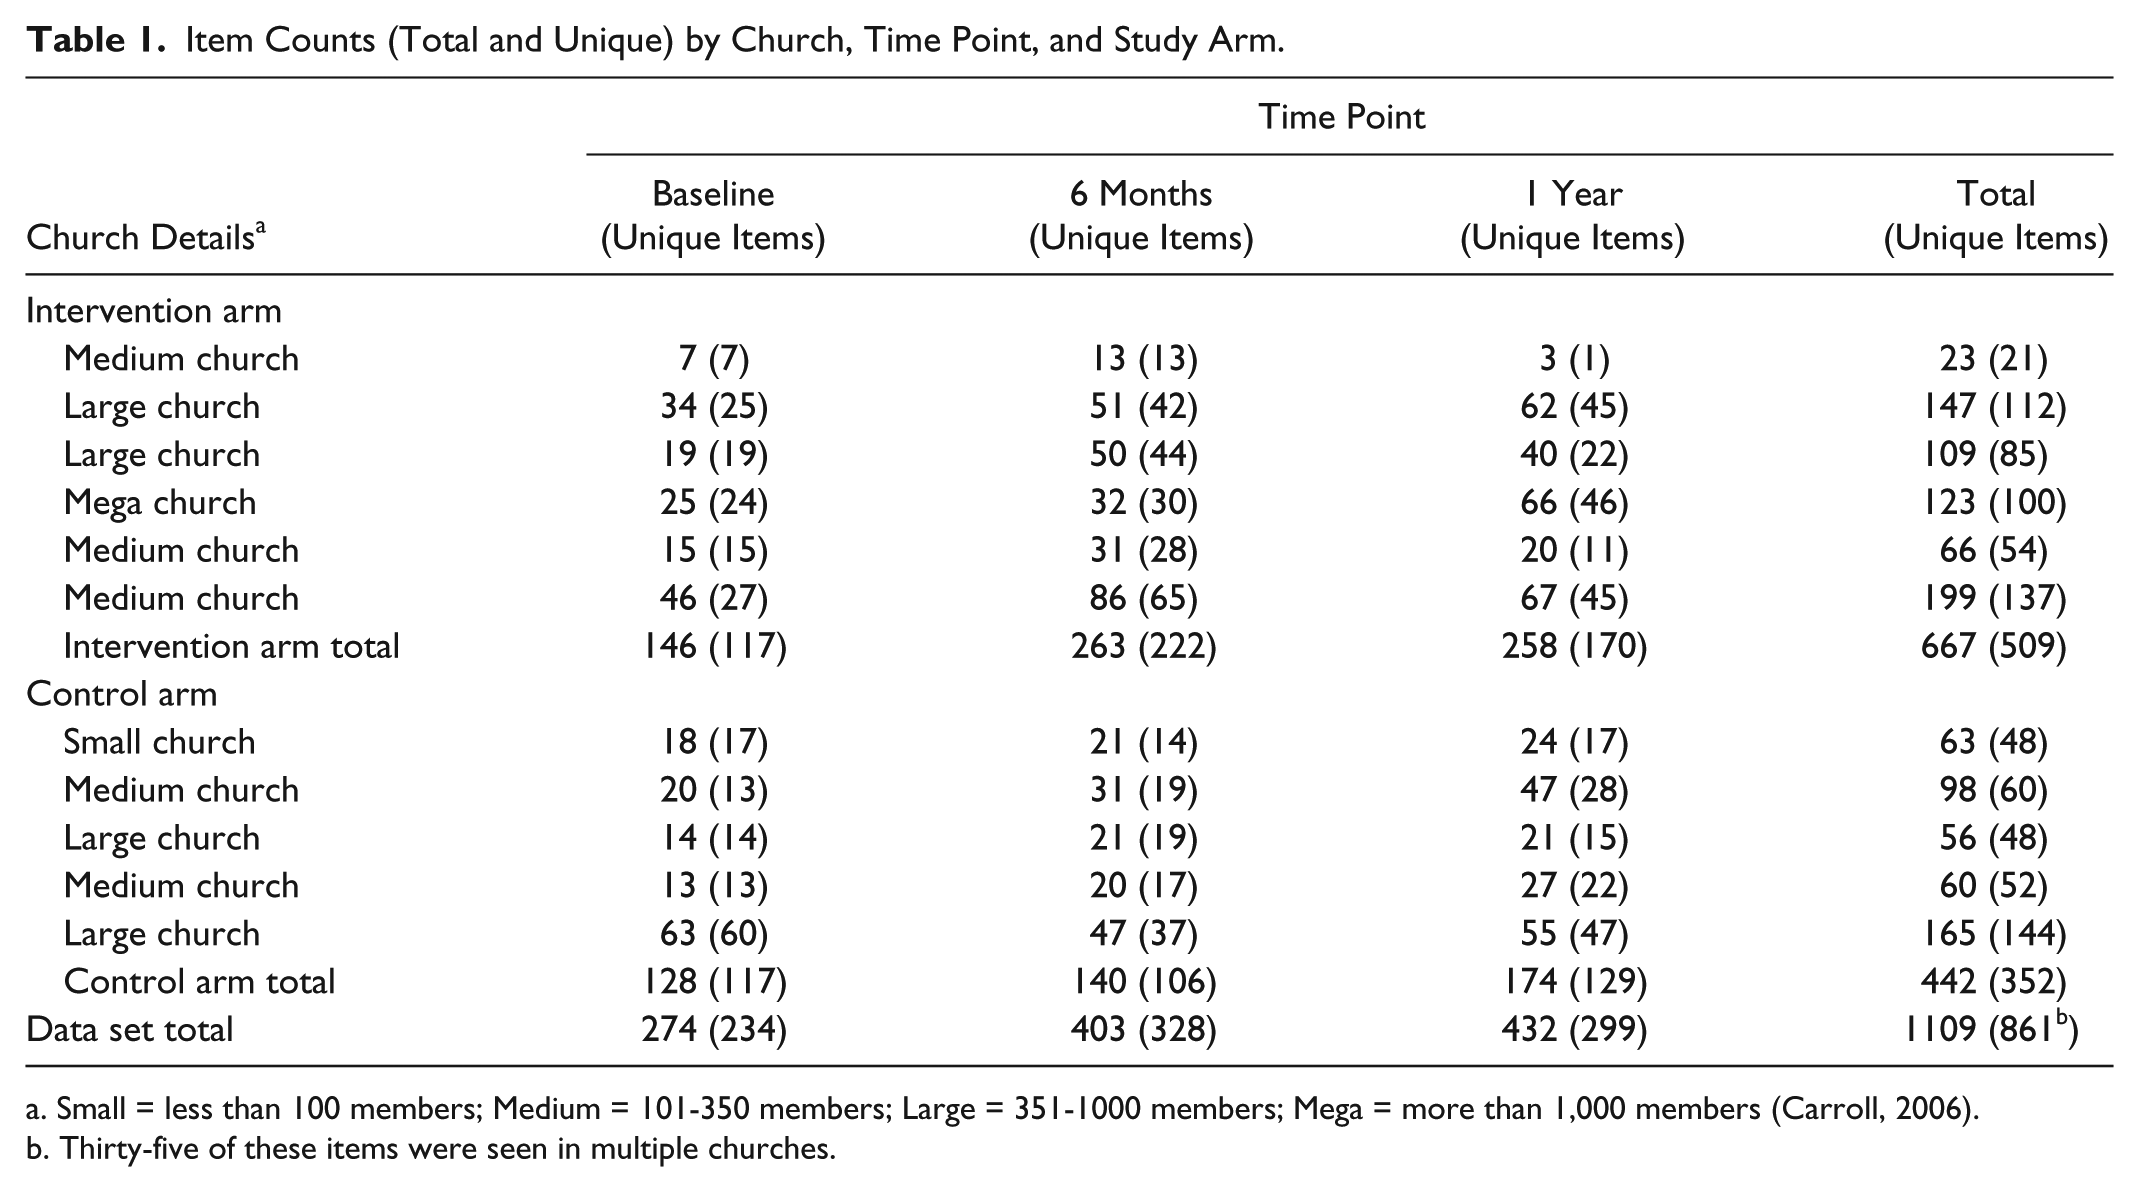
Small = less than 100 members; Medium = 101-350 members; Large = 351-1000 members; Mega = more than 1,000 members (Carroll, 2006).
Thirty-five of these items were seen in multiple churches.
Data collection took place between July 2010 and October 2011 and included three phases: preintervention (baseline), implementation (6 months), and postintervention (1 year). Data were collected over a 2-month period for each phase to capture the variety of church events that could provide health messages. At the start and end of a 2-month period, all written messages within the church were documented, both health and nonhealth related. Pictures were taken of all posted messages, and copies of all items provided to congregation members were collected. Collection occurred when no events were taking place at the church to ensure all areas frequented by the congregation at large were accessible. A church leader led the tour of the church and indicated areas where information was usually made available to congregation members. The most common areas toured in each church included the vestibule, fellowship hall, hallways, and entrances. Steps were taken to document items in common areas even when they were not arranged for easy access (e.g., a pile of items on a vestibule table were spread out and documented). Over the entire 2-month period, a church leader also collected all printed or emailed messages that were provided to the congregation at large. To minimize bias favoring larger churches with websites and church marquees, no content from these media was included.
After each data collection period, items were sorted by one person, and those unrelated to health were counted and excluded from the current study protocol. If there was uncertainty about an item’s relevance to health, it was provisionally included in the data set, and coders had an option of marking an item as unrelated to health during coding. This occurred with only three items, and these items were removed after review. Duplicates across churches as well as across time points and locations within churches were included to reflect potential message exposure at each church. Of the 2,262 items originally collected, 1,109 contained messages related to health and were included in the present analysis. Table 1 provides the total number of items collected within each church and the number of unique items (not duplicates from another time point or location) by study arm and time point.
Coding
A codebook was developed with definitions for message topics, media type, and source. An initial list of codes was determined through a literature review and observations of the church environment (Baruth et al., 2008; Campbell et al., 2000; Wilcox et al., 2010; Williams et al., 2009). Other codes were identified and definitions refined after review of a subsample of materials. The codebook was revised until adequate levels of interrater reliability were reached.
For each item, codes were either present (1) or absent (0). A coding hierarchy was created depending on media type. For booklets or brochures, the main title and subtitles were used to code the topics. For magazines, newspapers, or newsletters, the article headlines were used. For other media types, the presence or absence of topics was determined by reading the entire text (Table 2). Multiple topics could be coded as present; however, when the same topic was present more than once in an item, it was counted only once.
Code Definitions, Interrater Reliability, and Frequencies of Variables.
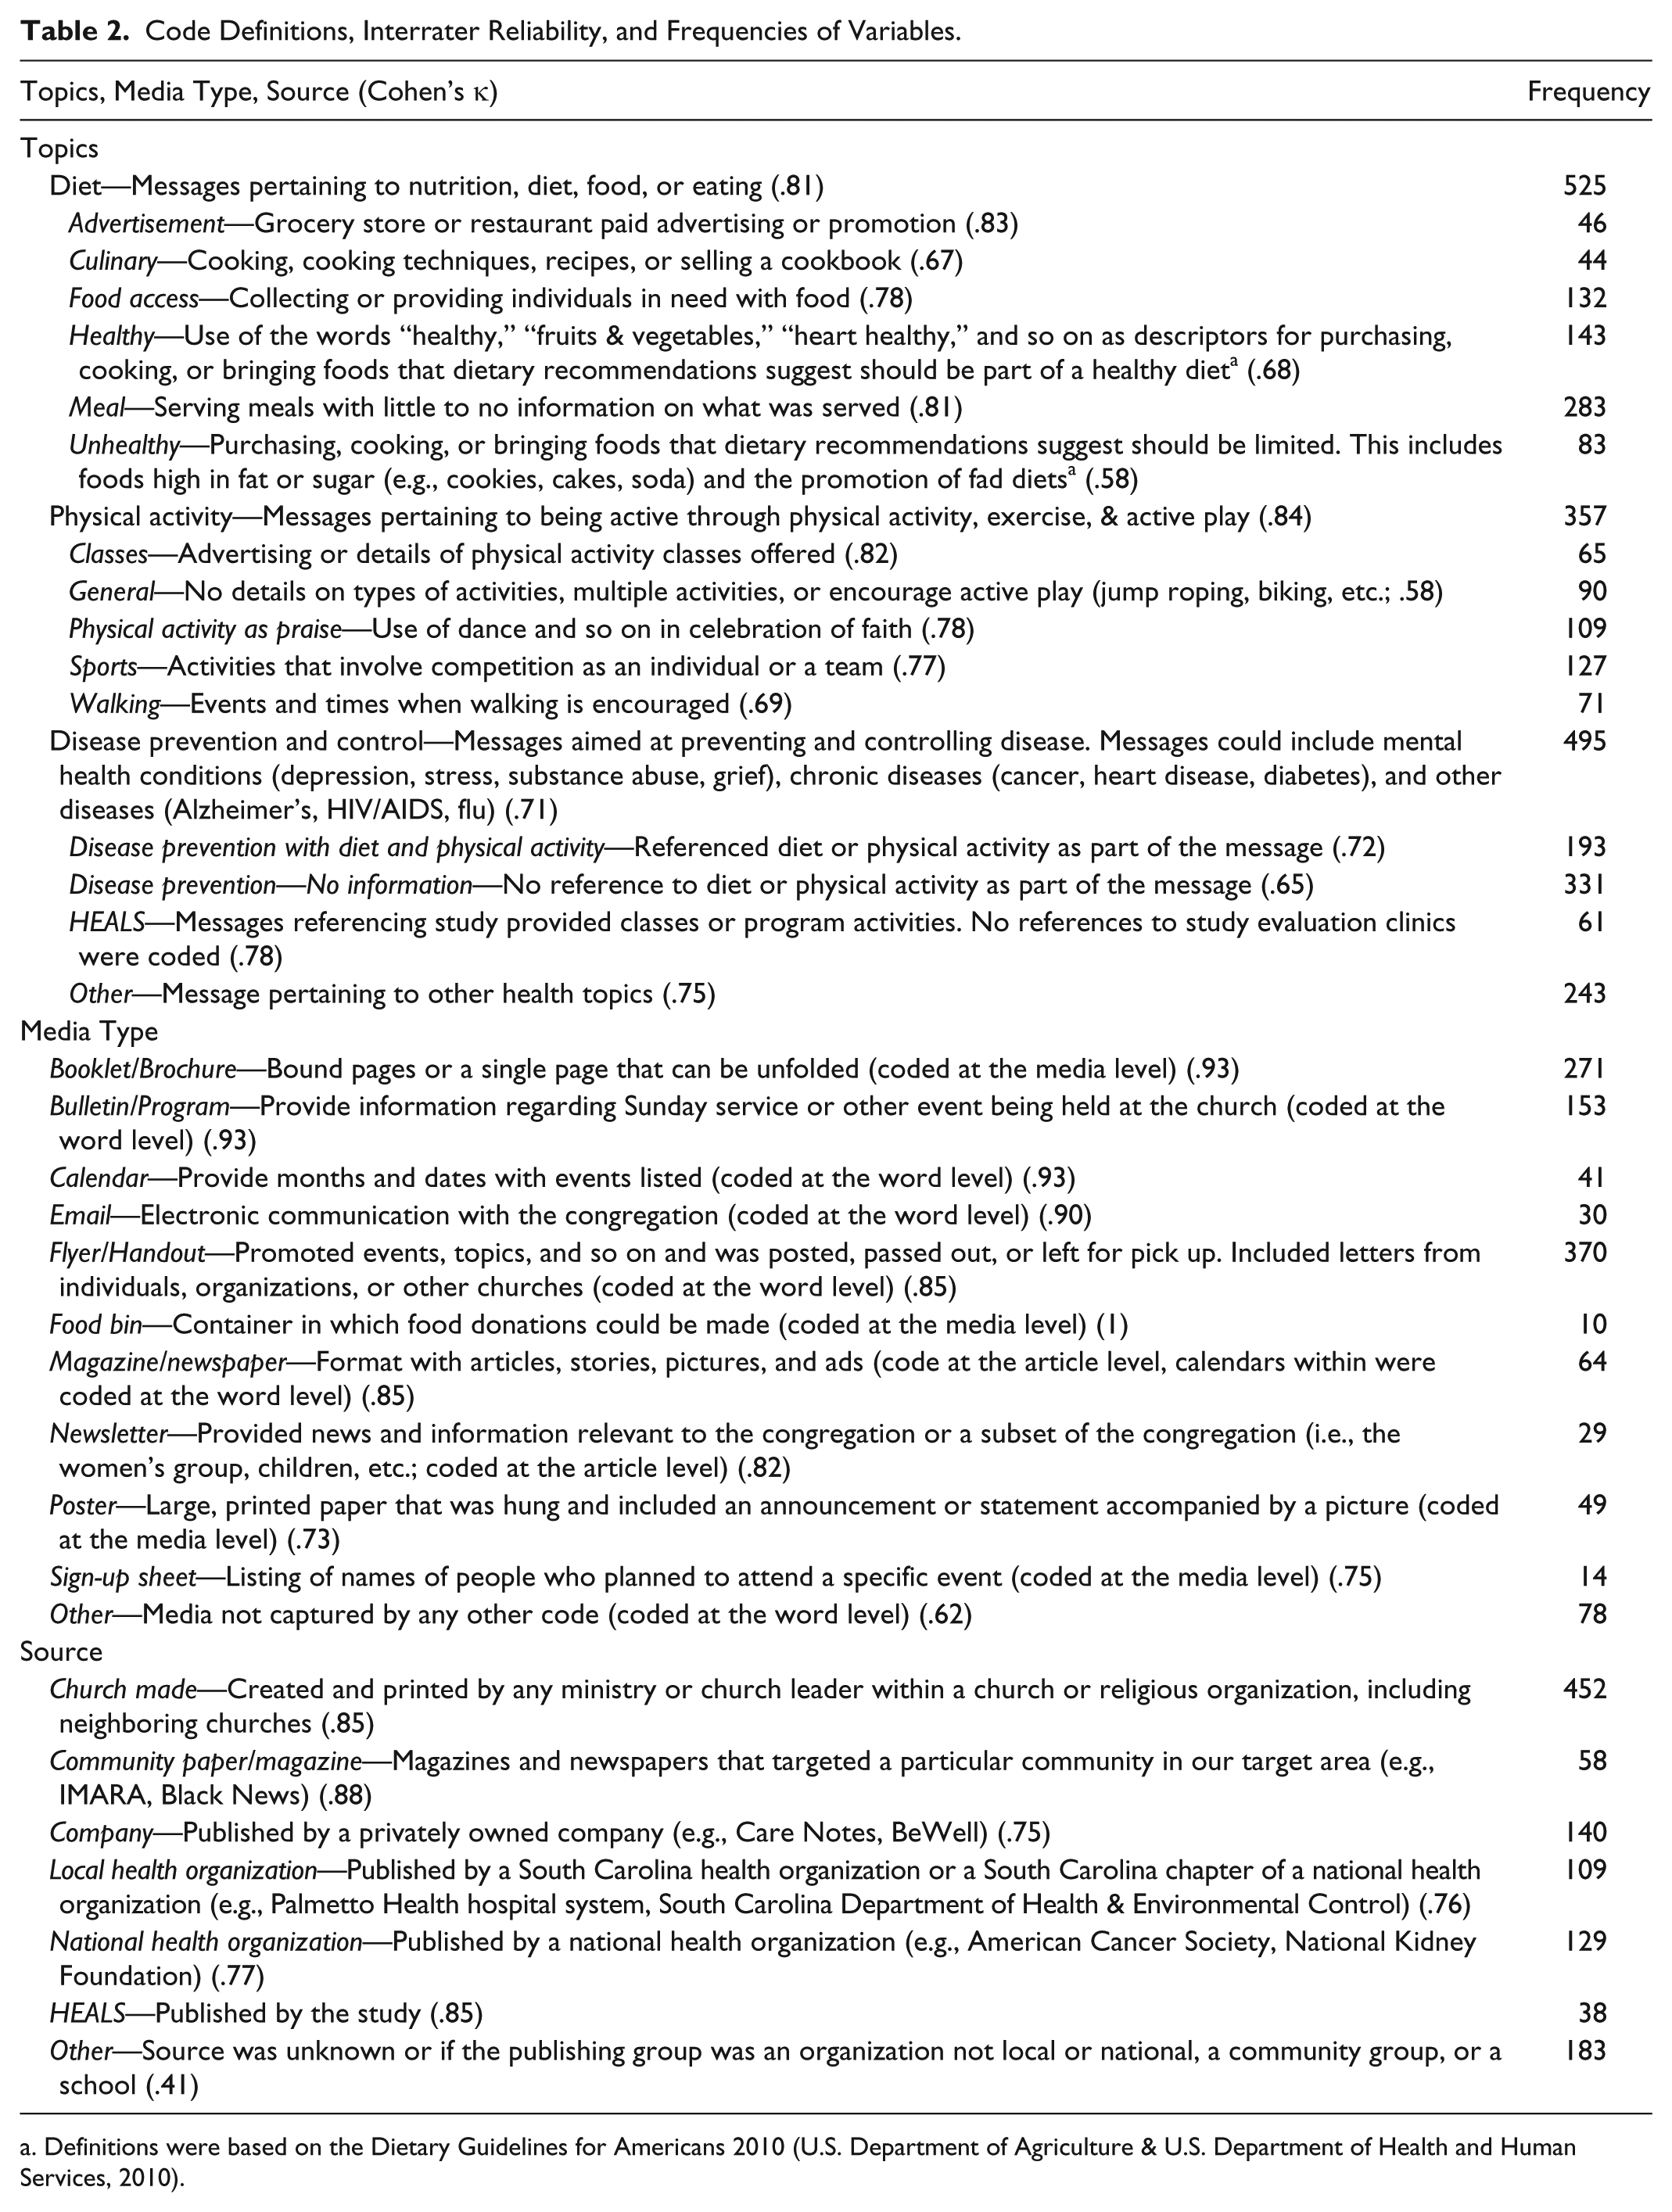
Definitions were based on the Dietary Guidelines for Americans 2010 (U.S. Department of Agriculture & U.S. Department of Health and Human Services, 2010).
Two graduate students coded items, and intercoder reliability was estimated using a randomly selected double-coded sample of approximately 30% (n = 327) of all items coded. The mean interrater reliability (Cohen’s κ) was .77 (range = .41-1.00; Table 2).
Analysis
Data were analyzed using SPSS (version 19.0). Descriptive statistics were used to explore the frequency of codes and their range across churches. Independent t tests were used to assess differences in the mean number of items collected from churches in the intervention compared to the control arm, both at baseline and again at 1 year. A one-way ANOVA was conducted to determine if variation existed in the frequency of items collected between the three time points (baseline, 6 months, 1 year). As no variation existed between study arms or across time points, data were pooled to improve the comprehensiveness of the data.
To determine whether a particular topic was more prevalent in one media type or source compared to others, a series of chi-square tests were conducted for each topic (present vs. absent) by media type (one media type vs. all other types) and by source (one source vs. all other sources). Given the large number of codes produced, only a subset was analyzed to reduce the number of statistical tests performed on the data. Variables selected for analysis were topic, media type, and source codes occurring most frequently. These codes were selected based on the rationale that congregation members would most likely be exposed to these categories, and they would therefore have the most potential to influence behavior.
Results
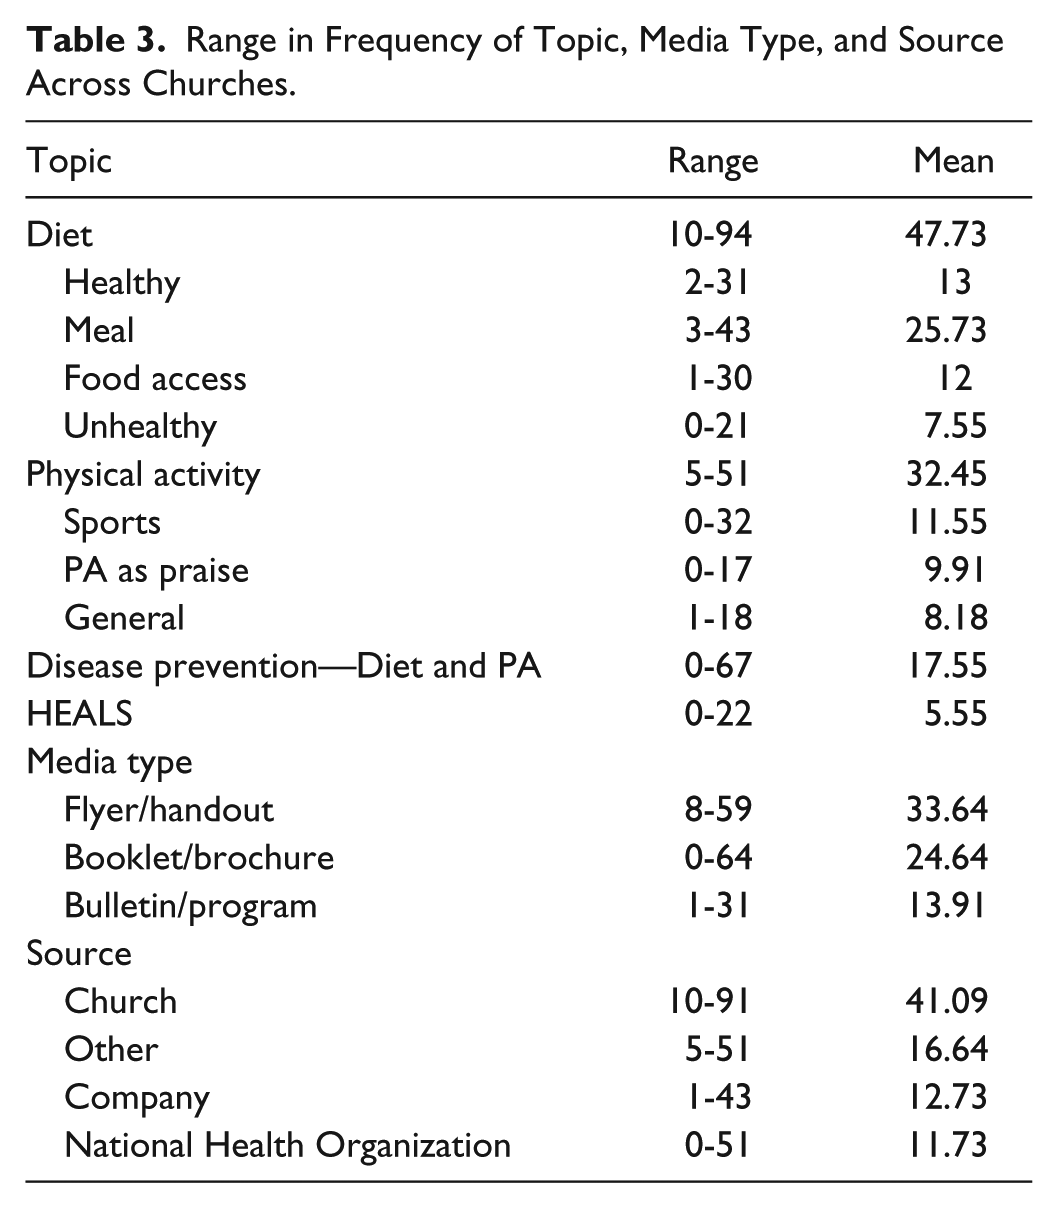
Table 1 provides the number of items collected by study arm, church, and time point. The number did not significantly differ between study arms at baseline or 1 year, nor did the change in number of items collected across the three time points. There was also little difference by church size. The number of unique items decreased over time for some churches; however, overall, the number of unique items at each time point remained the same. Nevertheless, churches did vary in the frequency of diet and PA messages, media types, and sources (Table 3).
Range in Frequency of Topic, Media Type, and Source Across Churches.
Topic
Of all items analyzed, 47% (n = 525) contained diet messages. Healthy diet messages were found in 27% of diet messages and unhealthy diet messages in 16%. However, diet messages lacking details or ones unrelated to health were noted more often than healthy and unhealthy diet messages, with most relating to serving meals (54%) and food access (25%; Table 2).
PA messages were found in 32% of items (n = 357). Of these, sports-related messages were most prevalent (36%), followed by PA as praise (31%), and general promotion of PA (25%). No messages promoting sedentary activities in lieu of PA were found (Table 2).
Forty-seven percent of items (n = 495) contained messages related to disease prevention or control with 39% of these providing diet or PA recommendations (Table 2).
Media Type
Flyers and handouts were the primary media type used to present health messages to congregations (33%), followed by booklets and brochures (24%) and bulletins and programs (14%; Table 2). When analyzing only items containing messages on diet and PA (n = 768), a similar proportion by media type was found (32%, 19%, and 15%, respectively).
Among these frequent media types, some more often presented particular topics (Table 4). Healthy diet messages were often presented in flyers and handouts as well as in bulletins and programs. However, only the relationship between the presence of healthy diet messages in flyers and handouts versus other types of media was found to be significant (n = 32, χ2 = 7.7, p < .01). Bulletins and programs more often contained diet messages in general (n = 139, χ2 = 53.1, p < .001), unhealthy diet messages (n = 29, χ2 = 14.4, p < .001), and PA messages (n = 115, χ2 = 70.0, p < .001) than other types of media. Disease prevention messages with diet and PA recommendations were presented more frequently in booklets and brochures than in other media (n = 86, χ2 = 174.4, p < .001).
Frequency of Topics Across Media Type a .
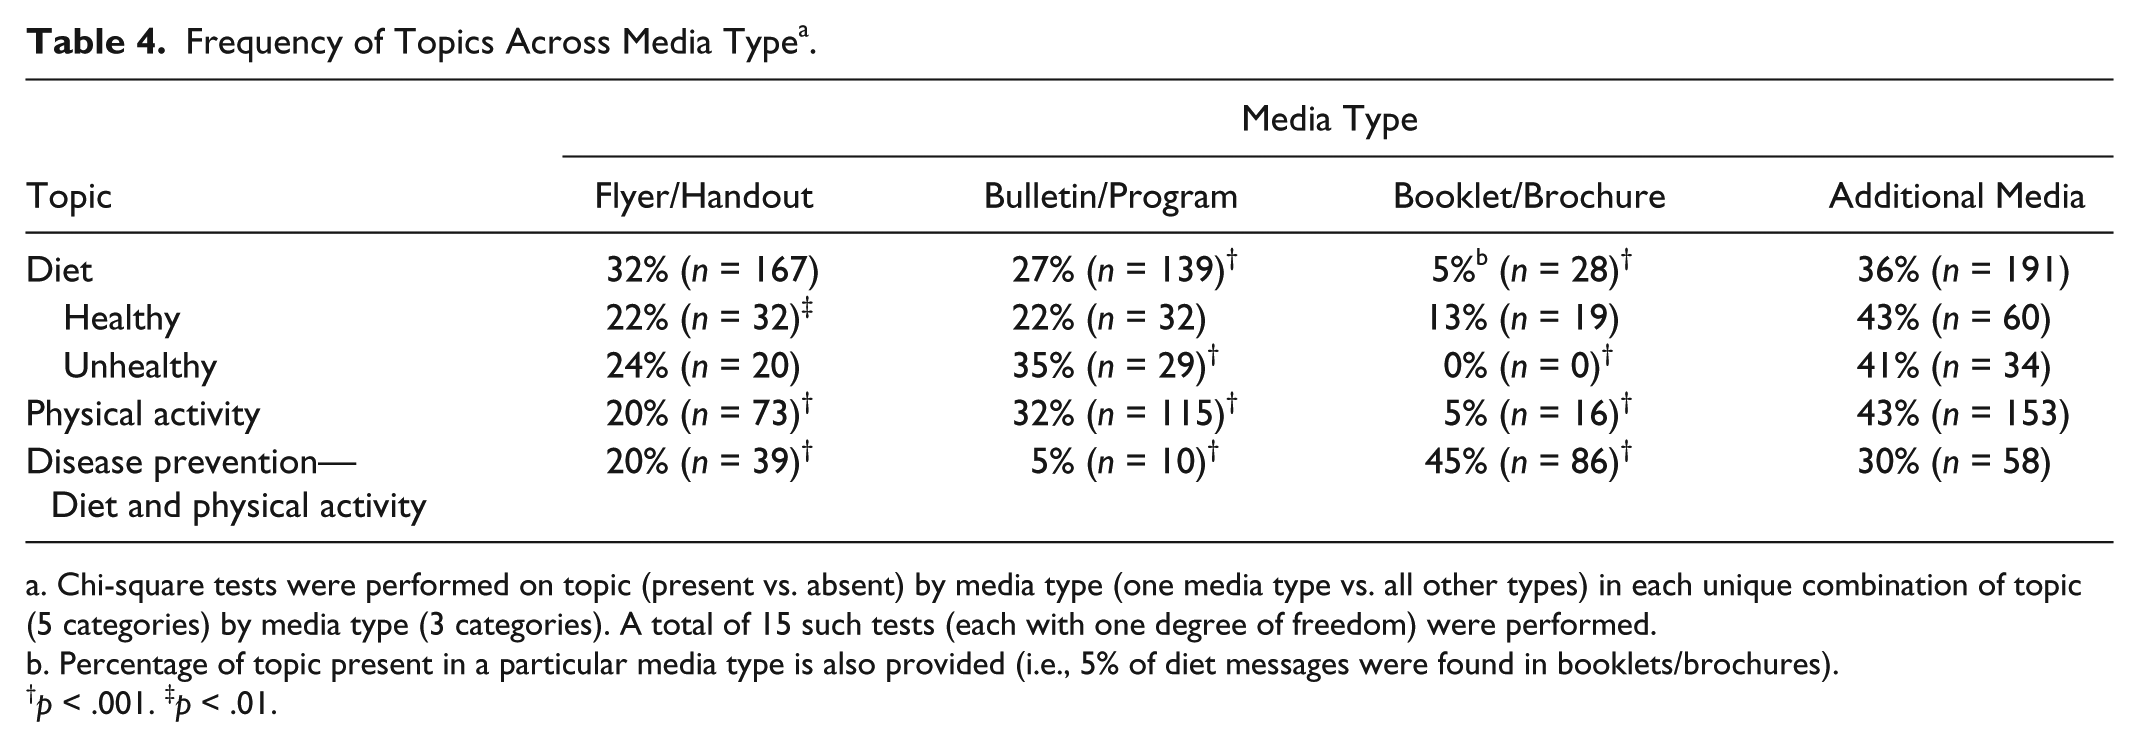
Chi-square tests were performed on topic (present vs. absent) by media type (one media type vs. all other types) in each unique combination of topic (5 categories) by media type (3 categories). A total of 15 such tests (each with one degree of freedom) were performed. b. Percentage of topic present in a particular media type is also provided (i.e., 5% of diet messages were found in booklets/brochures).
p < .001. ‡p < .01.
Source
The most frequently occurring message source was the church (41%). Our “other” category combined sources that individually did not occur often enough to constitute having their own code. These sources included unknown origin, groups that were not local to South Carolina or national, community groups, and schools. When combined, these groups became the second most frequent source of messages (17%). Companies were the third most frequent source of messages (13%). When only items with messages on diet and PA were examined (n = 768), churches were still the most frequent source (53%), but national health organizations were the third most frequent source instead of companies (9% vs. 6%).
As with media types, some topics were associated more often with particular sources (Table 5). The church versus other sources was more likely to produce items that contained diet messages in general (n = 342, χ2 = 98.3, p < .001), healthy diet messages (n = 64, χ2 = 4.79, p < .05), unhealthy diet messages (n = 59, χ2 = 12.2, p < .001), and PA messages (n = 226, χ2 = 28.5, p < .001). National health organizations were most often the source of disease prevention messages with diet and PA recommendations (n = 50, χ2 = 101.2, p < .001).
Frequency of Topics Across Source a .
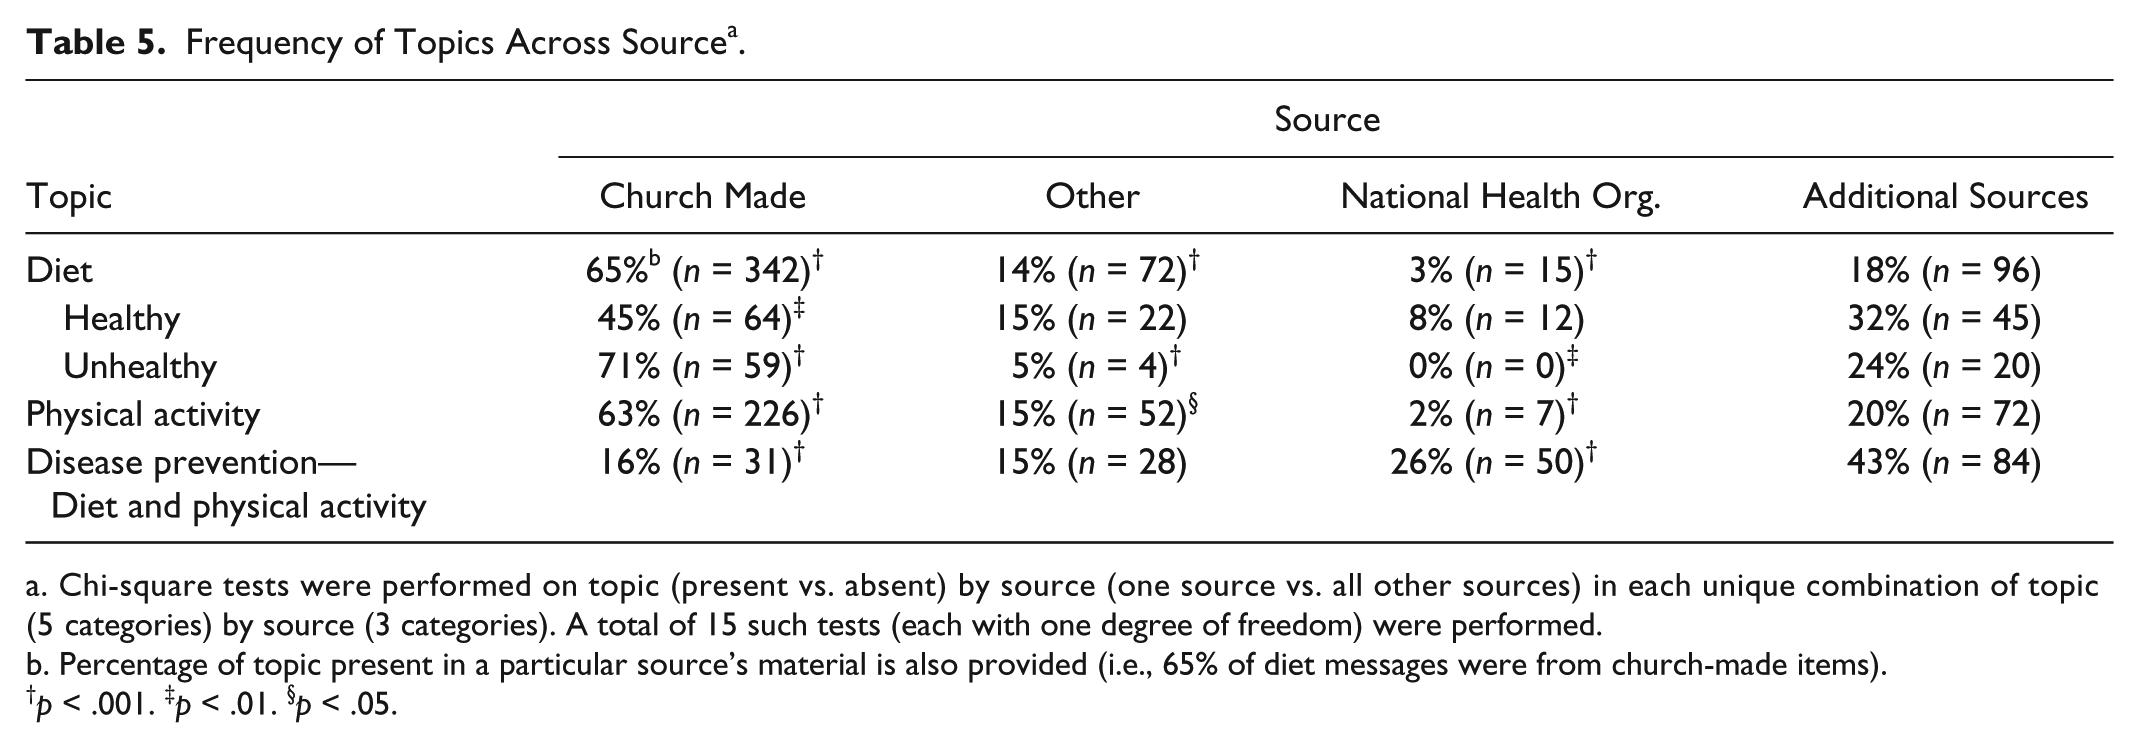
Chi-square tests were performed on topic (present vs. absent) by source (one source vs. all other sources) in each unique combination of topic (5 categories) by source (3 categories). A total of 15 such tests (each with one degree of freedom) were performed.
Percentage of topic present in a particular source’s material is also provided (i.e., 65% of diet messages were from church-made items).
p < .001. ‡p < .01. §p < .05.
Discussion
Our findings suggest it is feasible to assess the church message environment with a reliable coding scheme that captures variability across settings. As such, our approach to assessing message frequency, content, and context within church environments provides a significant advance over prior research that has relied on self-report. Furthermore, we provide a promising strategy for evaluating organization-level interventions that use messages to promote healthy eating and PA.
Results from this study suggest that media with health messages in AA churches contain a high percentage of content related to diet (47%) and PA (32%) as well as recommendations around these behaviors to prevent disease (17%). Not all messages were healthy, particularly those related to diet.Future interventions should evaluate the effects of such mixed messages, as public health messages can be drowned out by competing messaging (Wakefield et al., 2005).
Most diet messages were related to serving meals (54%), which is consistent with research indicating that most church activities involve the serving of food (Kegler, 2010). Intervening with church kitchen committees may be critical to enhancing the health quality of meals (Atkinson et al., 2009; Baruth et al., 2011; Campbell et al., 2000). Messages coded as meals lacked the details needed to determine if items served were healthy or unhealthy; however, healthy diet messages were second in frequency (27%). Highlighting the healthfulness of church meals will aid churches in continuing promotion of healthy diet messages while creating a messaging environment that promotes healthy eating as a social norm.
Food access messages occurred in 25% of diet items. This finding supports previous work indicating that churches view providing food to the community and those in need as an important outreach (Atkinson et al., 2009). This prior work also found that church members felt this outreach was an important domain in which to focus health promotion efforts (Atkinson et al., 2009). Our results reinforce the salience of food access promotion within the church and indicate an important area where programs can work with churches to ensure that healthy foods are provided to church members and the larger community.
Consistent with previous work on messaging related to diet (Baruth et al., 2008; Campbell et al., 2000; Campbell, Resnicow, Carr, Wang, & Williams, 2006), our findings indicated that bulletins and programs were the most prevalent media type for presenting diet topics (27% of diet items), and this corresponds with our finding of the church being the most frequent source of these messages (65% of diet items). Of particular interest is the association between unhealthy diet messages and bulletins and programs (35% of unhealthy diet items) as well as the church as a source of unhealthy diet messages (71% of unhealthy diet items). Despite being short in length, the frequent presence of unhealthy food requests and other such messaging in bulletins may inadvertently promote poor dietary habits.
In relation to diet messages, flyers and handouts were often used to provide healthy diet messages. While cheap and easy to produce, these types of media contain a relatively small amount of information. Such media could be used as stand-alone information or as a way to promote events through which individuals can learn about a topic in-depth. Future research should look more closely at the purpose of flyers and handouts and assess their ability to influence diet and PA behaviors.
In contrast to diet, no unhealthy PA messages were found. This may be a result of unhealthy PA being best captured as a trend over time (e.g., minutes per day of screen time) versus a one-time occurrence, which is more likely to be captured with our methodology. Previous qualitative research with health ministry leaders indicated walking programs and classes as frequent activities that churches use to promote PA (Baruth et al., 2008). Sports messaging, generally in the form of messaging about team sports (e.g., football, basketball), PA as praise, primarily the promotion of praise dancing groups and events within the church, and general messages promoting PA were most frequent in our sample. However, classes and walking messages were not uncommon, each occurring in about 20% of PA items. While, in general, PA messages were frequently present in the form of bulletins and programs (32%) and produced by the church (63%), we took a closer look at these PA subthemes. Sports and general PA topics were frequently found in magazines and newspapers (37% for sports and 17% for general PA). Inclusion of this outside media may explain the higher frequency of these types of PA messages. However, among materials produced by the church, the most frequent topics were PA through praise (45%), sports (28%), classes (23%), walking (19%), and general promotion (18%). This finding suggests that our measurement of PA messaging has uncovered other types of PA that previously have been overlooked with self-report data.
While some items containing disease prevention and control messages also contained diet and PA recommendations, 67% of disease prevention and control messages had no information regarding diet or PA. This large percentage is most likely due to our definition of disease prevention, which included mental health, flu prevention, HIV/AIDS, and other diseases not likely to have contained diet or PA recommendations. Previous research indicates AAs may be more receptive to messages that promote healthy behaviors when they are linked to outcomes such as wellness or weight management versus disease prevention (Campbell et al., 2007). Next steps for our research include coding for disease types to document the frequency with which particular diseases are present within messages in AA churches as well as coding on message framing to better understand its potential for changing behavior. Many items with disease prevention and control messaging came from national health organizations (26%) and were in the form of booklets and brochures (45%). This suggests that churches are actively seeking information related to disease prevention, or national health organizations are effectively disseminating disease prevention information to AA churches.
Though we focused only on AA churches located in South Carolina, the description of our methodology and findings should prove useful to other researchers who wish to conduct similar research. The range in frequency of messaging that was seen in our study has often been overlooked and should be considered in future faith-based interventions that use multiple settings. Furthermore, use of this methodology with a larger sample of churches and specific testing of the mediation of intervention effects through changes in the message environment will help determine the importance of the environment as a focus for intervention efforts. Adaptations needed for this methodology to be conducted by church members as part of future research or as a self-evaluation tool should be explored.
Interrater reliabilities were mostly high, but they did not reach recommended levels for some codes. Given the complex nature of many of the items coded (i.e., magazines, brochures, bulletins, etc., that contained multiple messages), low reliabilities may be driven by one coder seeing a message while another coder missed the message. Overlooking messages may have helped balance out a tendency toward inflated frequencies of diet and PA messages due to churches participating in a larger diet and PA focused study.
Unlike the application of content analysis methodology in most studies, our study did not limit data collection to a specific type of media (e.g., newspapers) or a specific source (e.g., one or two newspapers). Having data from multiple sources, different locations, and over many time points adds a layer of complexity to the interpretation of our findings. However, confidence in our analysis is bolstered by having used one study team data collector, the same data collectors in each church, and a detailed codebook to standardize data collection, inclusion/exclusion decisions, and data analysis. Despite collecting a variety of data, we did not collect oral messages as has been done in previous work (Baruth et al., 2011; Campbell et al., 2000), limiting our findings to written messages.
Despite these limitations, this research contributes to the literature as the first objective measurement of health messages within AA churches. Future work should explore the use of content analysis methodology in assessing messages within other faith-based organizations and settings as well as links between messaging and individual-level behavior change. Our findings support use of an objective environmental measurement approach to assess intervention effectiveness and describe diet and PA messages present within AA churches. Our methodology and findings should be considered by health professionals and organizational leaders within the context of their setting and programs to provide a better understanding of the impact of the messaging environment on program outcomes and individual behaviors.
Footnotes
Acknowledgements
The authors would like to acknowledge Elizabeth Chastain and Patrick Leary’s assistance with data management and coding.
Declaration of Conflicting Interests
The authors declared no potential conflicts of interest with respect to the research, authorship, and/or publication of this article.
Funding
The authors disclosed receipt of the following financial support for the research, authorship, and/or publication of this article:
This work was supported by the National Institutes of Health, National Center on Minority and Health and Health Disparities Grant (R24 MD002769-01), an Established Investigator Award in Cancer Prevention and Control from the Cancer Training Branch of the National Cancer Institute to JRH (K05 CA136975), and a Cancer Education and Career Development Program for BEH (R25 CA090956).