
Abstract
This study examined the association between having been bullied at school during the past 6 months (“bullied status”) and not meeting physical activity (PA) recommendations of 60 minutes of daily PA during the past week among 8th- and 11th-grade Texas adolescents. Multiple logistic regression analysis was conducted to examine this association, adjusted for weight status, grade, race/ethnicity, and stratified by gender; furthermore, a significant interaction was found between bullied status and weight status. Results are presented by interaction status. Results indicated that overweight girls who reported never being bullied, as well as those who reported being bullied more than twice, had higher odds of not meeting PA recommendations than normal weight girls who were never bullied (adjusted odds ratio [AOR] = 2.12, 95% confidence interval [CI: 1.12, 3.99]; AOR = 9.18, 95% CI [2.26, 37.27], respectively). Obese girls who were bullied once or twice had higher odds of not meeting PA recommendations than normal weight girls who were never bullied (AOR = 2.89, 95% CI [1.06, 7.89]). Overweight boys who reported never being bullied had lower odds of not meeting PA recommendations than normal weight boys who were never bullied (AOR = 0.62, 95% CI [0.39, 0.97]). Conversely, obese boys who were bullied once or twice reported higher odds of not meeting PA recommendations than normal weight boys who were never bullied (AOR = 3.61, 95% CI [1.22, 10.67]). Findings from this study indicate that the association between bullied status and meeting PA recommendations is complex and may differ by gender and the interaction between bullied status and weight status.
Keywords
In the United States, bullying is highly prevalent among adolescents, with just under one in five U.S. high school students reporting having experienced one instance of bullying the past year (Kann et al., 2014) and just over one in three middle school students reporting having been the victim of bullying in the past 2 months (Wang, Iannotti, & Nansel, 2009). Bullying is broadly defined as a specific type of aggression in which the behavior is intended to harm or disturb, the behavior occurs repeatedly over time, and there is an imbalance of power, with a more powerful person or group attacking a less powerful one. (Nansel et al., 2001; p. 2094; see also Olweus, 1994)
Victims of bullying are at an increased risk of psychosocial issues, including depression, general anxiety, low self-esteem, as well as suicidal ideation and suicide attempts (Bauman, Toomey, & Walker, 2013; Hawker & Boulton, 2000; Hinduja & Patchin, 2010; Nansel et al., 2001). In addition to psychosocial consequences, a recent meta-analysis found that bullied youth reported lower academic achievement than their nonbullied peers (Nakamoto & Schwartz, 2010).
Despite the growing body of evidence on the adverse psychosocial and educational consequences of adolescent bullying, research is limited on how bullying may shape adolescent engagement in health-promoting behaviors such as physical activity (PA). PA is a key health behavior for children and adolescents due to the multiple physical, cognitive, and academic benefits that it provides for children and youth (Fox, Barr-Anderson, Neumark-Sztainer & Wall, 2010; U.S. Department of Health and Human Services, 2008). To date, only a handful of studies have investigated the association between bullied status and PA participation in U.S. children and youth, and findings from these studies have been mixed (Faith, Leone, Ayers, Heo, & Pietrobelli, 2002; Jensen, Cushing, & Elledge, 2014; Jensen & Steele, 2009; Roman & Taylor, 2013; Storch et al., 2007). The mixed findings of these studies may be the result of different definitions and measures of PA. As victimization from bullying has been found to be higher among overweight adolescents (Buttitta, Iliescu, Rousseau, & Guerrien, 2014; Ottova, Erhart, Rajmil, Dettenborn-Betz, & Ravens-Sieberer, 2012) and differs by demographic factors such as grade level (Carlyle & Steinman, 2007), gender (Storch & Ledley, 2005), and ethnicity (Kann et al., 2014; Nansel et al., 2001), the failure to take into account these factors may also make studies less comparable and contribute to the conflicting findings.
The Centers for Disease Control and Prevention (CDC)’s recommendations of 60 minutes of daily PA for adolescents (U.S. Department of Health and Human Services, 2008) provide a practical measure for assessing the relation between bullied status and PA. As these recommendations are evidence-based regarding the frequency and intensity of PA needed for health benefits (U.S. Department of Health and Human Services, 2008), understanding how bullied status relates to whether youth meet or do not meet PA recommendations is an important step in assessing whether bullied students merit further attention to promote and support their PA participation. To date, only one study has specifically examined the association between bullied status and meeting PA recommendations in U.S. adolescents (Demissie, Lowry, Eaton, Hertz, & Lee, 2014). Using data from the national Youth Risk Behavior Survey, Demissie et al. (2014) found that after controlling for race/ethnicity and grade level, being bullied at school during the past year was associated with lower odds of meeting PA recommendations during the past week for U.S. high school male students but not female students.
While the specific mechanism underlying the potential association between being a victim of bullying and PA participation is still being explored, two theoretical rationales are supported by the literature. One such theoretical perspective that may elucidate lower PA in bullied adolescents is that bullied youth may avoid social situations, including group PAs and team sports, out of fear of being bullied (Faith et al., 2002; Hutzell & Payne, 2012; Storch et al., 2007). Thus, bullied youth may participate in fewer group Pas, which would contribute to lower PA levels. An alternative perspective for the association between being bullied and reduced PA participation is that physically inactive youth and adolescents may be at an increased risk of being bullied due to factors such as poor motor skills. Ultimately, youth with poor motor skills may be at an increased risk of both being physically inactive and bullied, which may explain the association between being bullied and low PA participation (Barnett, Van Beurden, Morgan, Brooks, & Beard, 2009; Bejerot, Plenty, Humble, & Humble, 2013; Okely, Booth, & Patterson, 2001; Wrotniak, Epstein, Dorn, Jones, & Kondilis, 2006).
Given the limited research on the association between being a victim of bullying and meeting PA recommendations of 60 minutes of daily PA in youth and adolescents, further research is needed to understand the nature and direction of the association. Using a statewide representative sample of 8th- and 11th-grade ethnically diverse students in Texas, this study examined the association between bullied status and not meeting PA recommendations of 60 minutes of daily PA during the past week across normal, overweight, and obese adolescents (U.S. Department of Health and Human Services, 2008) while adjusting for grade level and race/ethnicity and stratifying by gender.
Method
Study Design and Sampling Frame
This study was a cross-sectional analysis using statewide representative data of 8th- and 11th-grade students from the 2009-2011 Texas School Physical Activity and Nutrition (SPAN) study, which surveyed participants about nutrition practices, PA participation, and perceptions of health and self-perceived weight (Hoelscher, Day, Kelder, & Ward, 2003; Hoelscher, Barroso, Springer, Castrucci, & Kelder, 2009; University of Texas Health Science Center at Houston, School of Public Health, 2011). The full description of the methods has been published elsewhere, with a brief summary here (Hoelscher et al., 2004; Perez, Hoelscher, Frankowski, Day, & Lee, 2010).
SPAN used a multistage probability-based complex sampling design generating a statewide representative sample of 8th- and 11th-grade students. Basic sampling weights and adjustment for control totals were calculated using a proportional probability of selection from school enrollment (Perez et al., 2010).
The SPAN study was reviewed and approved by the University of Texas School of Public Health Committee for the Protection of Human Subjects and by local school district review committees. Parent consent and student assent were obtained prior to survey administration. The survey took approximately 35 minutes to complete. Overall participation rates were 89.1% for 8th graders and 66.1% for 11th graders.
Study Participants
The sample for the 2009-2011 SPAN study included 6,716 eighth and 11th graders. For this study, 558 were excluded due to missing data on bullied status and PA. There were no significant differences in gender, grade, and race/ethnicity between the missing and included samples. The final sample size for this study consisted of 6,158 Texas adolescents enrolled in 8th or 11th grade, representing a total of 511,768 adolescents statewide.
Measures
Not Meeting PA Recommendations
Not meeting PA recommendations served as the dependent variable for analysis. Responses to the following question were analyzed to determine if students met PA recommendations during the past week: “During the past 7 days, on how many days were you physically active for a total of at least 60 minutes per day? (Add up all the time you spent in any kind of PA that increased your heart rate and made you breathe hard some of the time).” There were eight response categories ranging from 0 to 7 days. This question was first developed by the CDC for use in their national Youth Risk Behavior Survey and has been previously evaluated for use in middle and high school students (CDC, 2011; Prochaska, Sallis, & Long, 2001). Responses were collapsed into two categories, corresponding to the national recommendations of 60 minutes of daily PA: (1) adolescents engaging in at least 60 minutes of PA per day for fewer than 7 days during the past week and (2) adolescents engaging in at least 60 minutes of PA per day for 7 days during the past week.
Bullied Status
To determine bullied status, we analyzed responses to the question: “Over the last 6 months, how often have you been bullied at school?” The 2009-2011 SPAN study defined bullying as happening when another student, or a group of students, say or do nasty and unpleasant things to him or her. It is also bullying when a student is teased repeatedly in a way he or she doesn’t like. But it is NOT BULLYING when two students of about the same strength, quarrel or fight.
Response categories included “I haven’t been bullied at school over the past 6 months,” “It has only happened once or twice,” “2 or 3 times a month,” “about once a week,” and “several times a week.” Bullied status was collapsed into three categories: never bullied, bullied once or twice during the past 6 months, and bullied more than twice during the past 6 months. Never bullied served as the referent category. This question was first developed by Olweus (1994) and has been adopted by the World Health Organization’s Health Behaviour in School-Aged Children survey (Eunice Kennedy Shriver National Institute of Child and Human Development, 2006; Olweus, 1994).
Sociodemographic Factors
Sociodemographic factors were based on single-item, self-reported measures and included gender, grade, and race/ethnicity. The SPAN 2009-2011 study collapsed race/ethnicity into three categories: White/other, Black, and Hispanic. White/other category included non-Hispanic White, Asian, Pacific Islander, Native American, and “other.” White/other adolescents served as the referent category.
Weight Status
Students’ height and weight were directly measured using standard protocols (Hoelscher et al., 2004). Based on these measures, body mass index (BMI) was computed and then collapsed into standard categories for weight status based on the CDC growth charts (National Center for Health Statistics, 2000). For this study, normal weight status was classified as a BMI less than the 85th percentile for the students’ age and gender, which included underweight adolescents; overweight weight status was defined as those adolescents with a BMI at or above the 85th percentile but less than the 95th percentile for their age and gender; and obese weight status was defined as having a BMI greater than or equal to the 95th percentile for their age and gender. The normal weight status served as the referent category.
Statistical Analyses
All statistical analyses were conducted using STATA 12.0 (College Station, TX), and incorporated the state sampling weights to account for the complex study design. First, weighted descriptive statistics were calculated to describe the demographic characteristics of the participants. Chi-square analyses were conducted to determine if there was an association between not meeting PA recommendations and gender, grade, weight status, race/ethnicity, and bullied status univariately. Multiple logistic regression analyses using state sampling weights were employed to determine the association between bullied status and not meeting PA recommendations during the past week, adjusted for weight status, grade, and race/ethnicity and stratified by gender. Results were stratified by gender as preliminary analyses indicated that there were significant gender differences in both the percentage of adolescents not meeting the PA recommendations and the percentage of adolescent who were bullied (p < .001). In a subsequent analysis, an interaction term for bullied status (three categories) and weight status (three categories) was included in the model to determine if there was a significant interaction effect with not meeting PA recommendations, after adjusting for grade and race/ethnicity and stratifying by gender. Eight dummy variables were included in the models for both girls and boys: (1) normal weight and bullied once or twice, (2) normal weight and bullied more than twice, (3) overweight and never bullied, (4) overweight and bullied once or twice, (5) overweight and bullied more than twice, (6) obese and never bullied, (7) obese and bullied once or twice, and (8) obese and bullied more than twice. Normal weight and never bullied served as the referent category.
Results
Description of Participants
Overall, 51.7% of the participants were male and the mean age was 14.8 years; 40.0% of participants were White/other, 45.3% Hispanic, and 14.7% Black. With respect to weight status, 61.4% were normal weight, 15.5% were overweight, and 23.1% were obese.
The prevalence of not meeting PA recommendations during the past week by gender, weight status, grade, race/ethnicity and bullied status is presented in Table 1. There were statistically significant differences in the proportion of not meeting PA recommendations during the past week by gender and racial/ethnic groups (p < .05). There were no significant differences in not meeting PA recommendations across grade, weight status, or bullied status categories.
Prevalence of Not Meeting Physical Activity Recommendations During the Past Week (%).
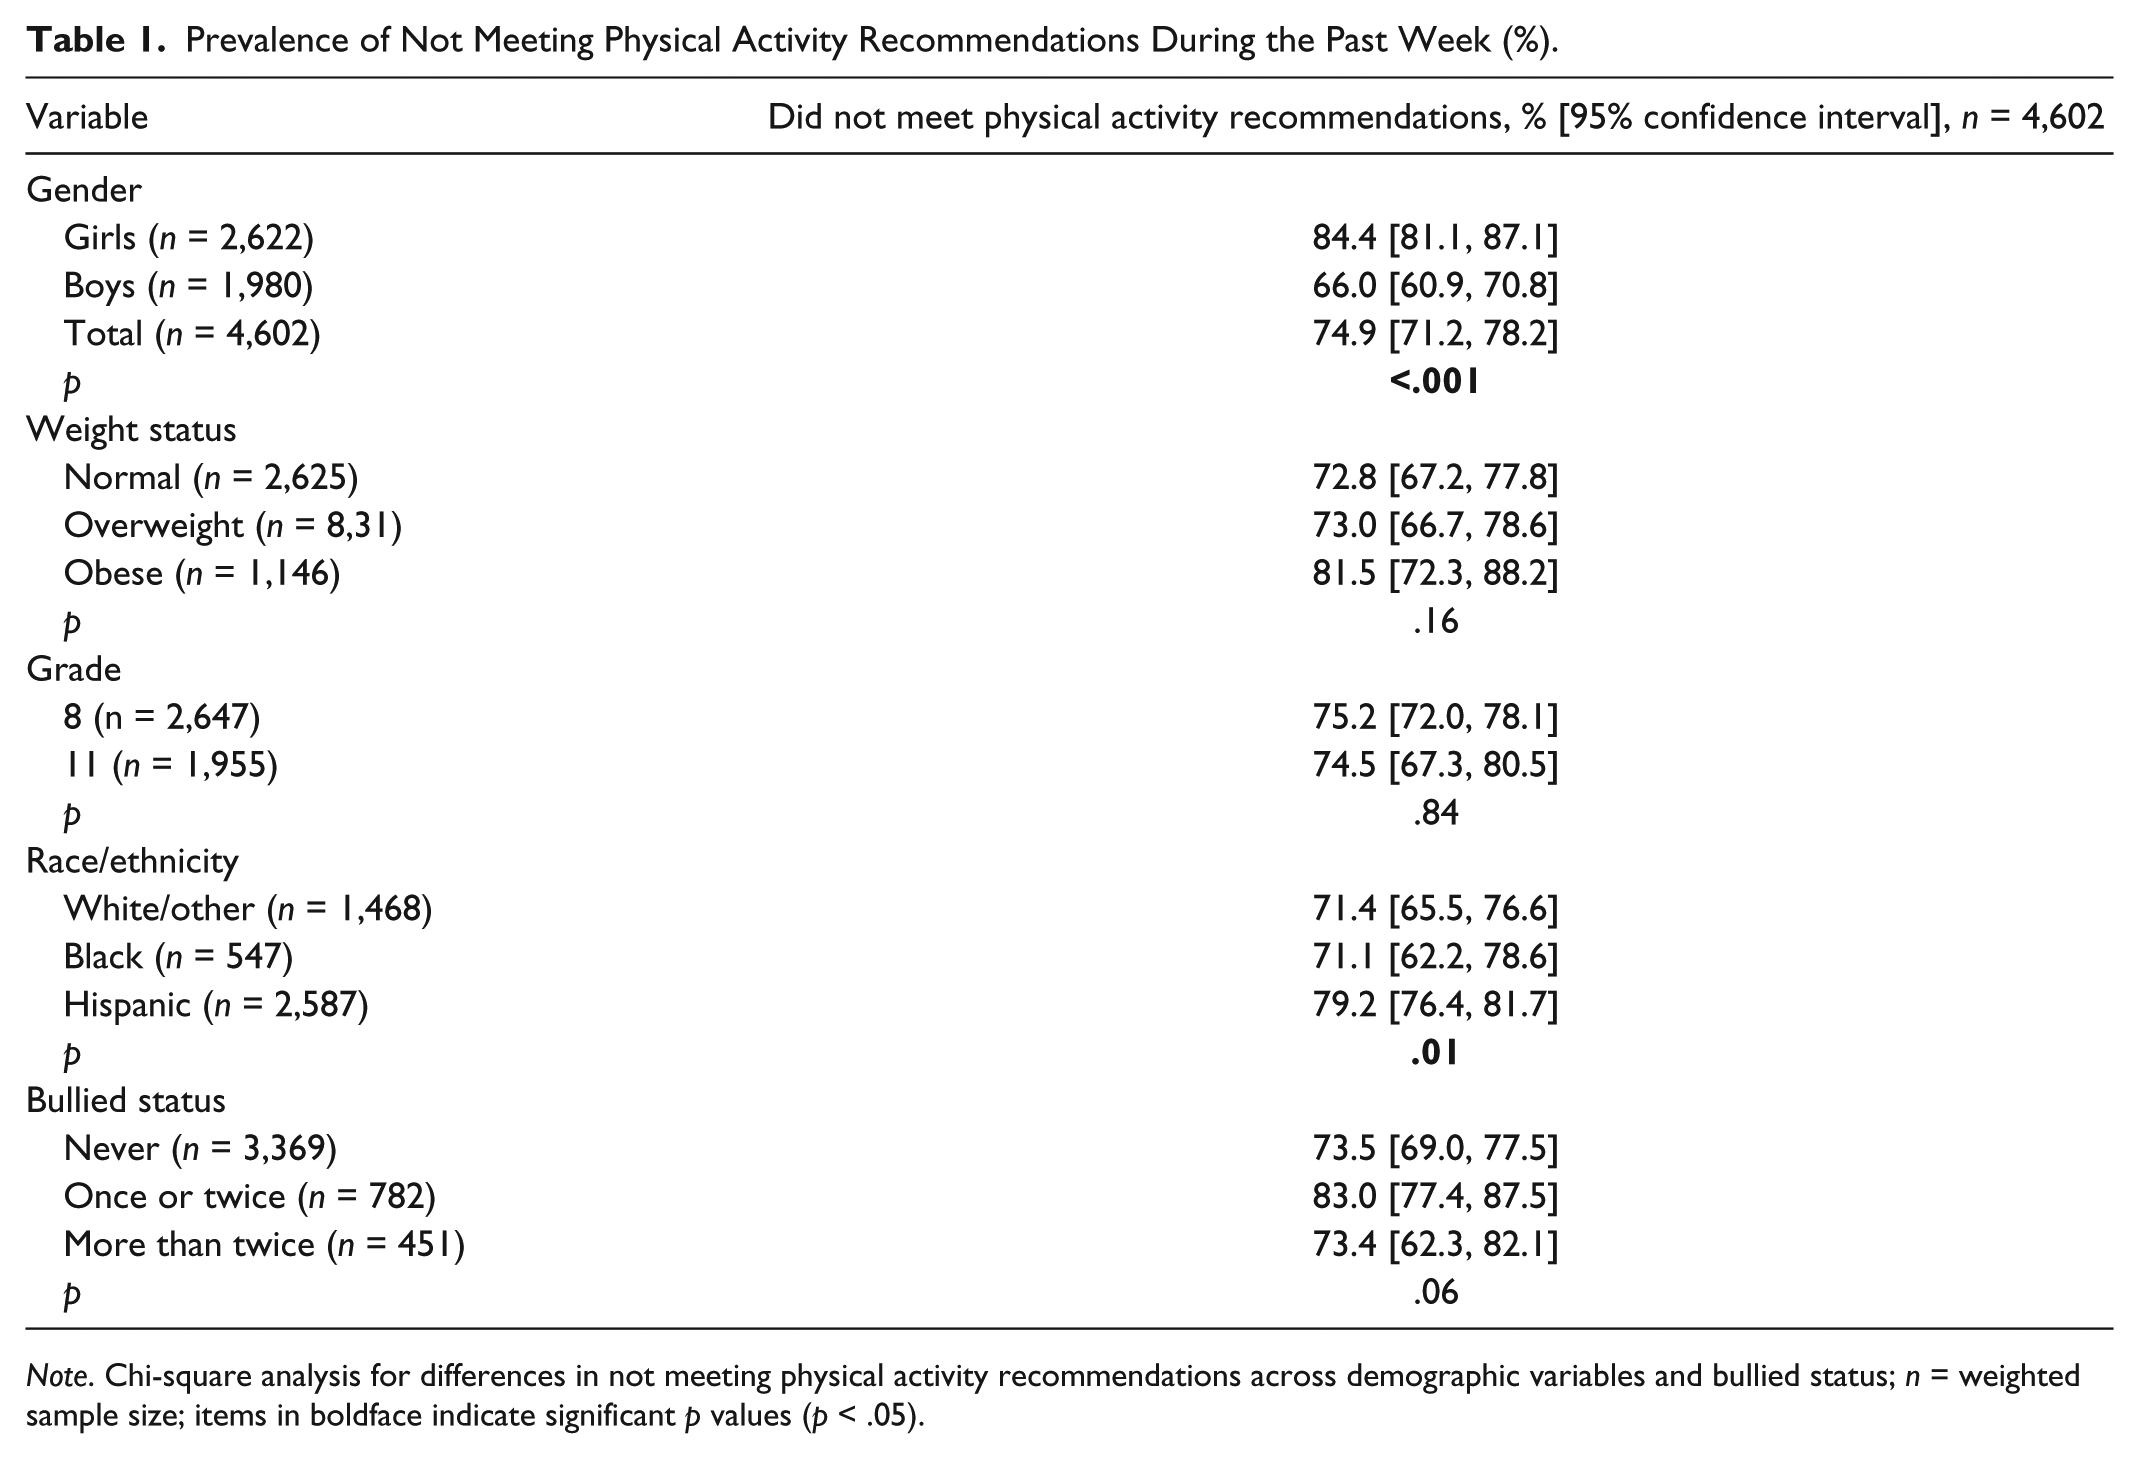
Note. Chi-square analysis for differences in not meeting physical activity recommendations across demographic variables and bullied status; n = weighted sample size; items in boldface indicate significant p values (p < .05).
The prevalence of bullied status during the past 6 months by gender, weight status, grade, and race/ethnicity are presented in Table 2. Overall, 23.8% of girls and 27.2% of boys in the combined sample of 8th- and 11-grade students reported being bullied at least one or more times during the past 6 months. Gender differences in the prevalence of being bullied were statistically significant: Girls reported a higher prevalence of being bullied once or twice while boys reported a higher prevalence of being bullied more than twice. Significant age differences in bullying were also noted, with 8th-grade students reporting a higher prevalence of being bullied at least one or more times during the past 6 months (31.7%) compared to 11-grade students (18.3%). Findings by weight status and race/ethnicity were not statistically significant.
Prevalence of Bullied Status at School During the Past 6 Months (%).

Note. CI = confidence interval. Chi-square analysis for differences in bullied status across demographic variables; n = sample size; items in boldface indicate significant p values (p < .05).
Association Between Bullied Status and Not Meeting PA Recommendations
Multiple logistic regression analysis was conducted to examine the association between bullied status and not meeting PA recommendations during the past week, adjusted for weight status, grade, and race/ethnicity and stratified by gender. In preliminary analyses, a significant interaction was found between bullied status and weight status. Findings are reported showing this interaction by gender (Tables 3 and 4). Overweight girls who were never bullied during the past 6 months had greater odds (adjusted odds ratio [AOR] = 2.12, 95% confidence interval [CI: 1.12, 3.99]) of not meeting PA recommendations during the past week compared to normal weight girls who had never been bullied in the past 6 months. Overweight girls who were bullied more than twice during the past 6 months had greater odds (AOR = 9.18, 95% CI [2.26, 37.27]) of not meeting PA recommendations during the past week compared to normal weight girls who were never bullied in the past 6 months. Obese girls who were bullied once or twice during the past 6 months had greater odds (AOR = 2.89, 95% CI [1.06, 7.89]) of not meeting PA recommendations during the past week compared to normal weight girls who had never been bullied during the past 6 months.
Logistic Regression Model Examining Bullied Status and Weight Status Interactions and Not Meeting Physical Activity Recommendations During the Past Week (Girls).
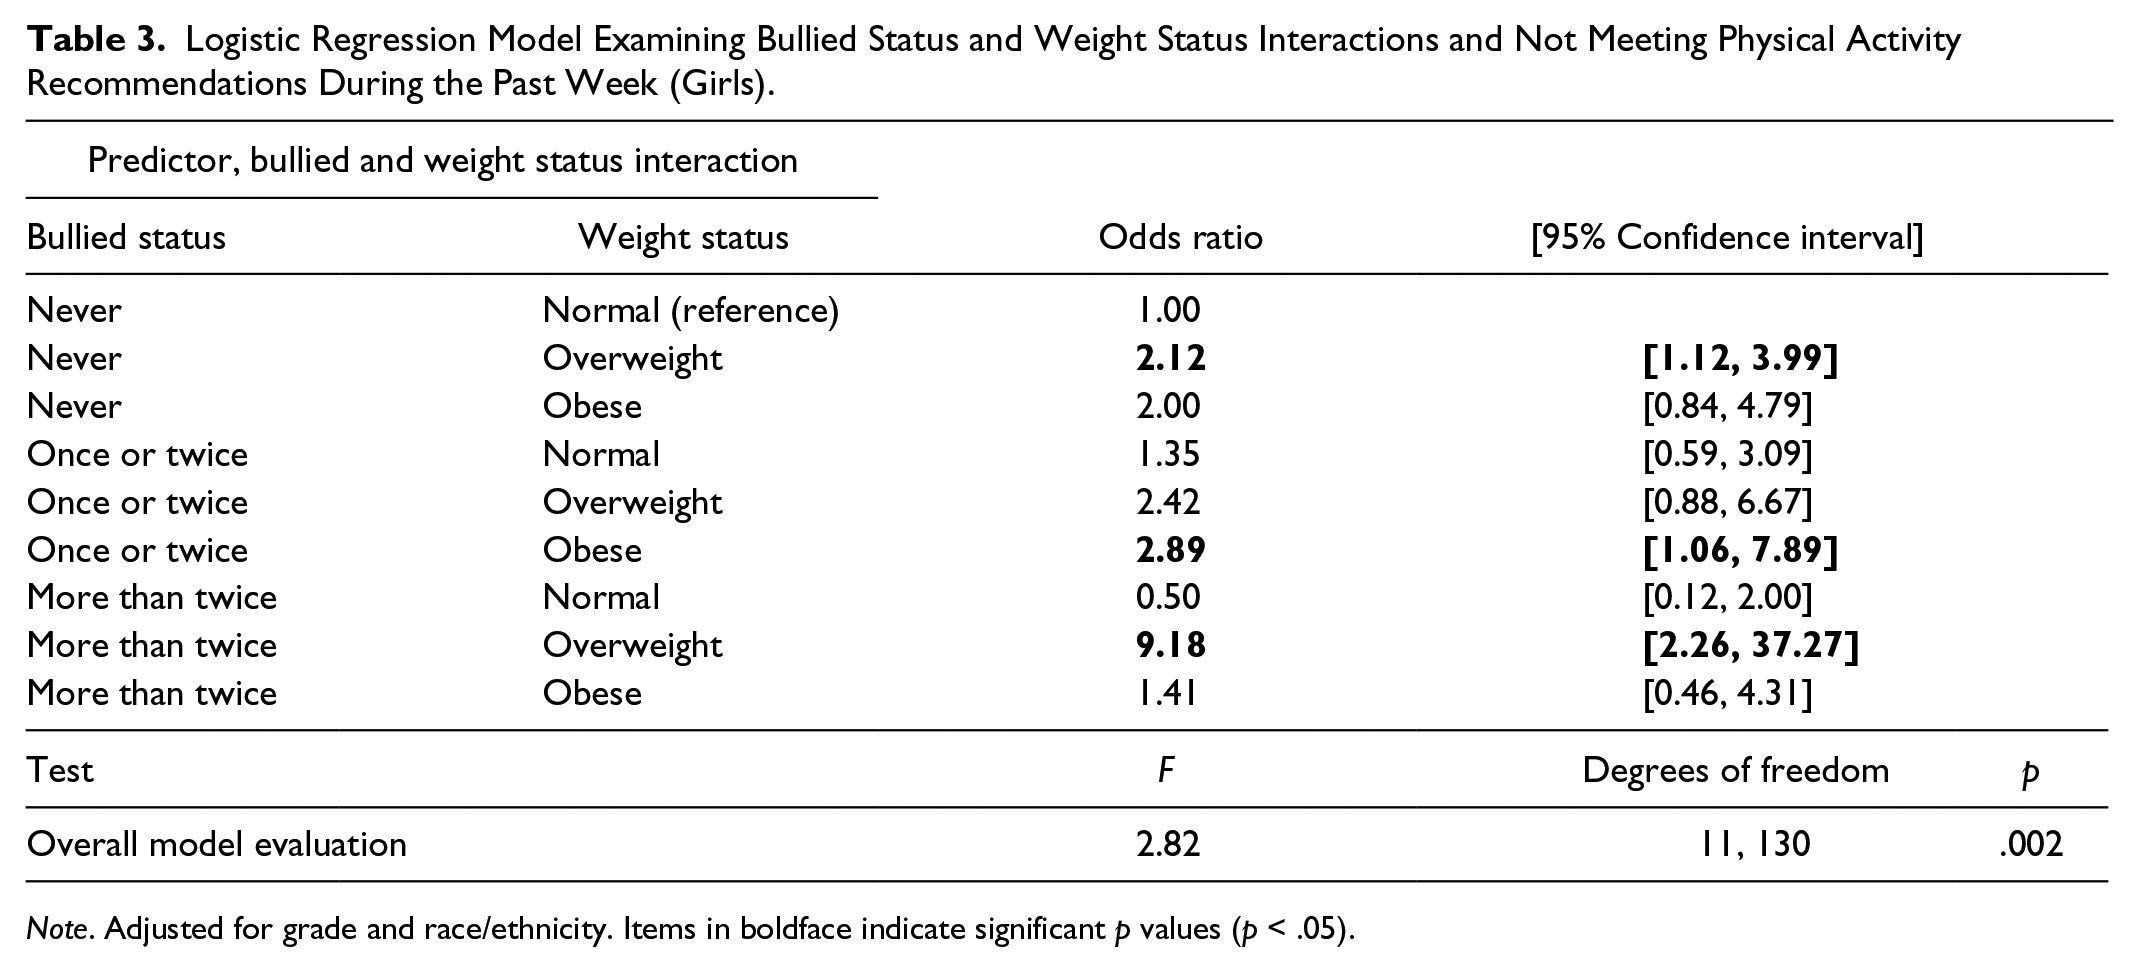
Note. Adjusted for grade and race/ethnicity. Items in boldface indicate significant p values (p < .05).
Logistic Regression Model Examining Bullied Status and Weight Status Interactions and Not Meeting Physical Activity Recommendations During the Past Week (Boys).
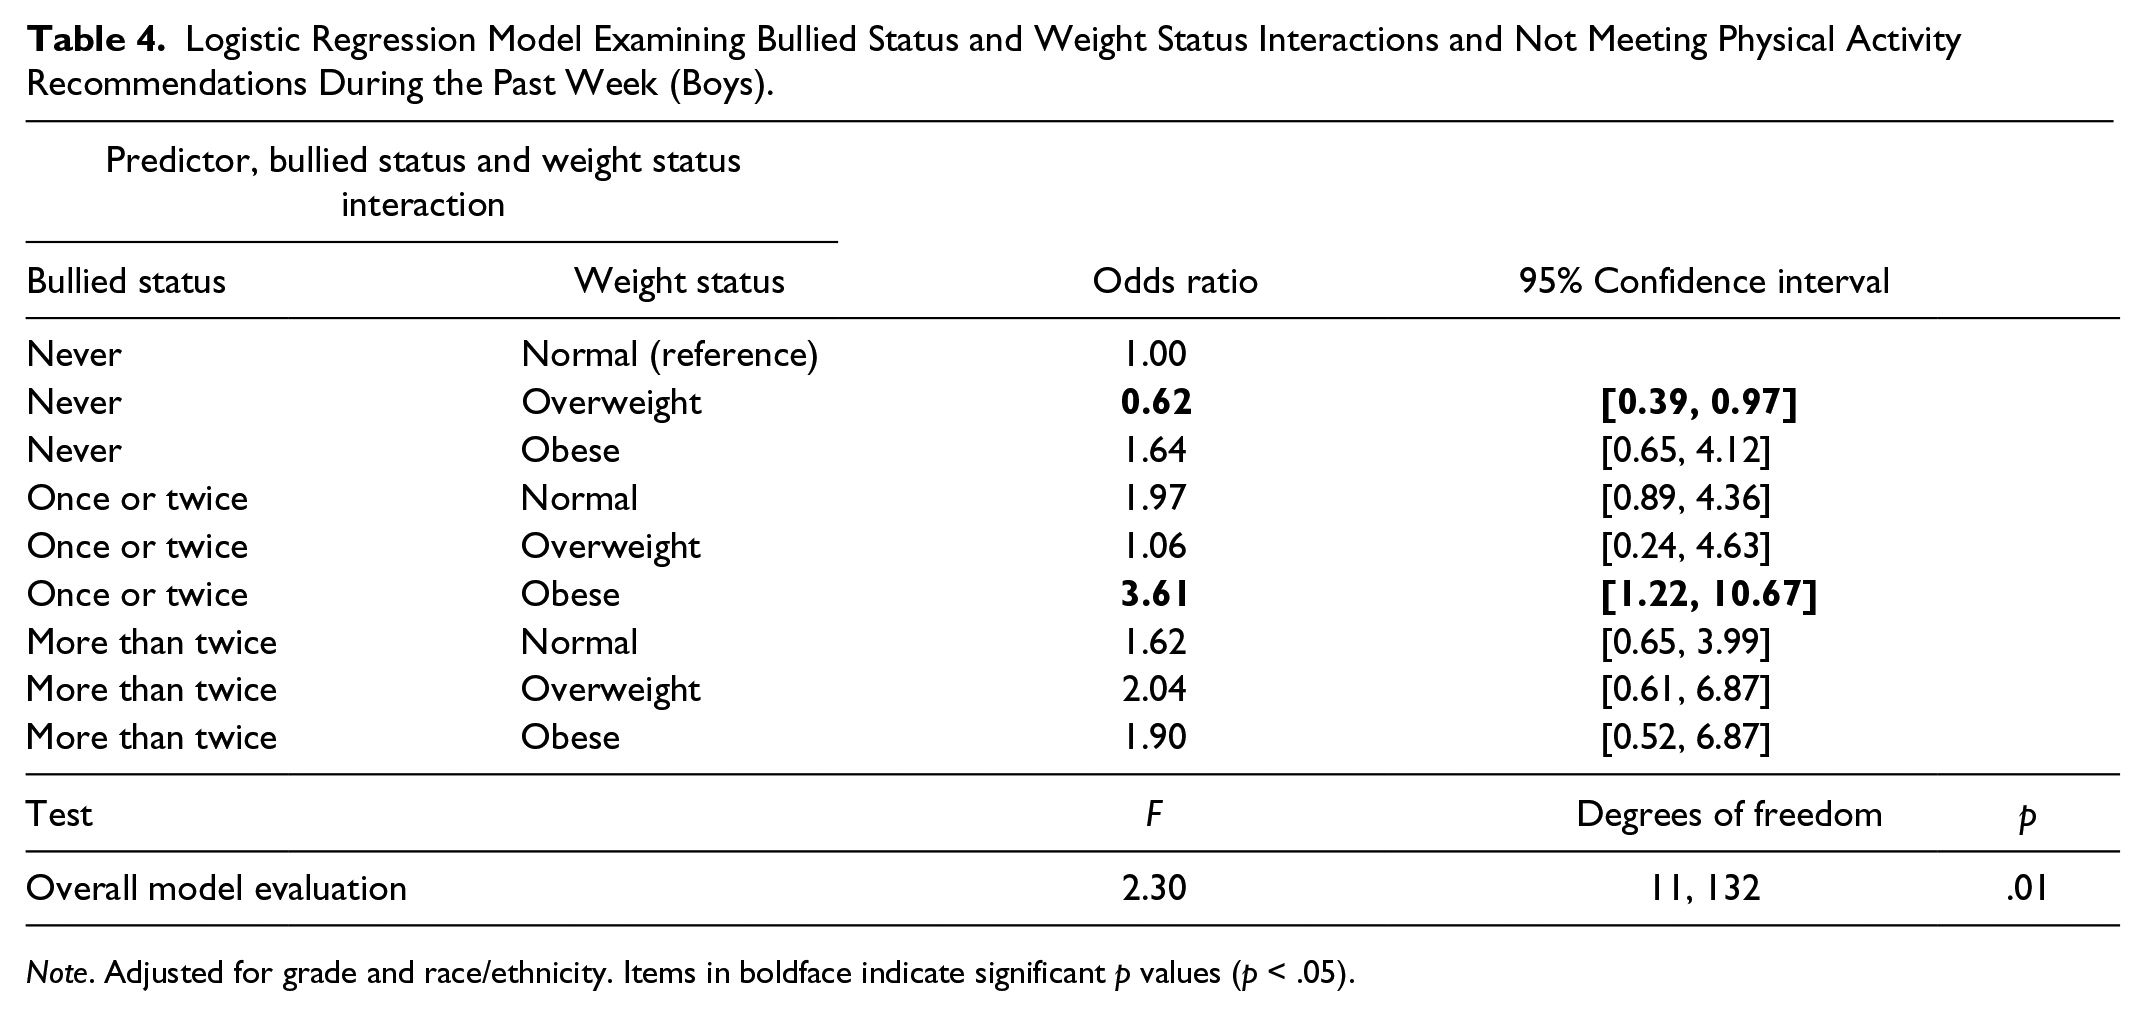
Note. Adjusted for grade and race/ethnicity. Items in boldface indicate significant p values (p < .05).
The results for boys are presented in Table 4. Overweight boys who were never bullied during the past 6 months had lower odds (AOR = 0.62, 95% CI [0.39, 0.97]) of not meeting PA recommendations during the past week compared to normal weight boys who were never bullied during the past 6 months. Obese boys who were bullied once or twice during the past 6 months had greater odds (AOR = 3.61, 95% CI [1.22, 10.67]) of not meeting PA recommendations during the past week compared to normal weight boys who were never bullied during the past 6 months.
Discussion
In this statewide representative study of adolescents in Texas, results regarding the association between bullied status during the past 6 months and not meeting PA recommendations during the past week were complex and suggest that the association differs by gender and the interaction between bullied status and weight status. The results for overweight girls who reported frequently being bullied were as anticipated: Overweight girls who were bullied more than twice had higher odds of not meeting PA recommendations during the past week than normal weight girls who were never bullied. Conversely, overweight boys who were not bullied had lower odds of not meeting PA recommendations during the past week than normal weight boys who were never bullied. Contrary to anticipated findings, the associations between being bullied more than twice and not meeting PA recommendations were not significant for normal weight or obese adolescents.
In contrast to our mixed findings, Demissie et al. (2014) found that being bullied at school during the past year was associated with significantly lower odds of meeting PA recommendations during the past week for males but not for females. There are several differences in the two studies that may explain the differential findings. First, unlike the current study that examined the association across different frequencies of bullying during the past 6 months (never, once or twice, and more than twice), Demissie et al. examined differences among individuals who were not bullied versus those who reported being bullied during the past 12 months. Therefore, our study may illustrate differences in the association between bullied status and not meeting PA recommendations by frequency of being bullied that were not captured in the previous study. Furthermore, the ethnic composition of our samples varied significantly: The racial/ethnic composition of the current sample was 40.0% White/other, 45.3% Hispanic, and 14.7% Black compared to the Demissie et al. (2014) sample, which was 58.7% White, 18.5% Hispanic, 14.4% Black, and 8.4% other race. Ultimately, there were notable differences in the operationalization of bullied status and the racial/ethnic composition of participants, which may contribute to the differential findings between the two studies.
An interesting and unexpected finding from the current study was that overweight boys who were never bullied had significantly lower odds of not meeting PA recommendations as compared to normal weight boys who were never bullied. Research examining the association between sports participation and weight status in youth and adolescents may provide important insight into our findings—for example, previous research indicates that male adolescents who participate in certain sports, such as football, are more likely to be overweight than their peers (Elkins, Cohen, Koralewicz, & Taylor, 2004; Malina et al., 2007). The current study is limited in that the SPAN survey did not include questions regarding which sports youth participated in; therefore, it is not possible to determine if a high proportion of overweight males who reported never being bullied participated in certain types of sports. An alternate explanation is that overweight males may be more physically active than their normal weight peers to facilitate weight loss. In previous research examining weight control behaviors in adolescents, researchers found that overweight males reported the highest prevalence of engaging in at least 3 days of vigorous exercise during the past week as compared to their normal weight and obese peers (Boutelle, Neumark-Sztainer, Story, & Resnick, 2002).
Results from the current study indicate that not meeting PA recommendations differs by gender and by the interaction between bullied status and weight status. These findings elucidate potential differences in the associations between bullied status and not meeting PA recommendations among normal weight, overweight, and obese adolescents, as well as between girls and boys, and may explain in part the mixed findings of previous research (Faith et al., 2002; Jensen et al., 2014; Jensen & Steele, 2009; Roman & Taylor, 2013; Storch et al., 2007).
Strengths and Limitations
There are specific limitations to the current study that merit mention. First, the cross-sectional nature of the study prevents us from making any causal inferences between bullied status during the past 6 months and not meeting PA recommendations during the past week. Second, the SPAN survey asked only one question related to overt and relational bullying. Since the question did not list shunning, exclusion from social situations, cyberbullying, or electronic bullying as examples of bullying behavior, the data may not have captured adolescents who experienced such events (Crick & Bigbee, 1998; Pearce, Boergers, & Prinstein, 2002; Storch & Ledley, 2005). An additional limitation is that PA participation was dichotomized into meeting or not meeting PA recommendations; therefore, the current study cannot determine if the association between bullied status and PA participation varies across different levels of PA. Future research with objective measures of PA such as accelerometers is merited to further discern the association between bullied status and not meeting PA recommendations. Furthermore, not meeting PA recommendations was measured through self-report, which may lead to an overreporting of PA levels compared to other objective assessments, such as accelerometers (Troiano et al., 2008). In addition, since the current study included only three categories of race/ethnicity, we were unable explore differences in bullied status and not meeting PA recommendations in other races. Finally, in spite of the large sample size, caution is needed when interpreting the estimates of the interaction of bullied status by weight status and not meeting PA recommendations. Due to the creation of nine interaction categories, some of the estimates produced wide confidence intervals as a result of the small numbers of participants in each interaction category.
The current study contributes to the limited body of research on the association between being bullied at school and meeting PA recommendations (Demissie et al., 2014). Future research is needed to explore a wide range of factors that might influence the association, including the need for further specificity on the type of bullying (e.g., weight-based, overt, relational), the type of meeting PA recommendations (e.g., group-based PA vs. individual-based PA), and the context of meeting PA recommendations (e.g., school vs. community vs. home). Ultimately, more research is needed to confirm our findings of differential associations between bullied status and not meeting PA recommendations by gender and the interaction between bullied status and weight status.
Footnotes
Declaration of Conflicting Interests
The authors declared no potential conflicts of interest with respect to the research, authorship, and/or publication of this article.
Funding
The authors disclosed receipt of the following financial support for the research, authorship, and/or publication of this article: The School Physical Activity and Nutrition study on which these data are based was funded by the Texas Department of State Health Services with funds from the Title V Maternal and Child Health Block Grant to Texas, Centers for Disease Control and Prevention Health and Human Services Block Grant, the Michael & Susan Dell Foundation through the Michael & Susan Dell Center for Healthy Living, and the National Institutes of Health, National Center on Minority Health and Health Disparities, P20MD000170-019001 and P20MD000170-019003.