
Abstract
Background. Childhood obesity is a significant but largely modifiable health risk, disproportionately affecting socioeconomically disadvantaged, racial/ethnic minority, and rural children. Elementary school–aged children typically experience the greatest increases in excess weight gain and therefore are important targets for reducing adolescent and adult obesity while improving children’s health. Our study evaluated outcomes of a 3-year elementary school–based program for reducing obesity in American Indian and White students attending eight rural schools in the U.S. upper Midwest. Method. Researchers measured body mass indexes (BMI) and other health indicators and behaviors of 308 beginning third-grade students and then again at the end of students’ third, fourth, and fifth grades. The primary focus of this study is a mixed multilevel longitudinal model testing changes in age- and gender-adjusted BMI z scores (zBMI). Results. There was a significant decrease in zBMI across the 3-year study period. Ethnicity analyses showed that White students had overall decreases in zBMI whereas American Indian students’ zBMIs remained stable across the program. Comparisons with children from an age- and cohort-matched national sample provided support for the effectiveness of the school program in reducing BMI and obesity during the study period. Conclusion. An elementary school–based health program that addresses a range of students’ obesity-related health behaviors, the school health environment, and that involves educators and parents is an effective intervention for reducing or stabilizing BMI in rural White and American Indian students. School health programs for students living in rural communities may be especially effective due to greater school and community cohesiveness, and valuing of the school’s primary role in improving community health.
Childhood obesity (body mass index [BMI]: 95th percentile and higher) is largely preventable given the substantial contribution of modifiable social, environmental, and behavioral determinants that account for the disproportionately higher obesity rates in socioeconomically disadvantaged, ethnic minority, and rural children (Davis, Bennett, Befort, & Nollen, 2011; Institute of Medicine, 2012; Johnson & Johnson, 2015; Liu, Bennett, Harun, & Probst, 2008; Liu et al., 2012; Ogden, Carroll, Fryar, & Flegal, 2015; Ogden, Lamb, Carroll, & Flegal, 2010; Singh, Siahpush, & Kogan, 2010).
Preventing obesity before adolescence would be of especially high impact in reducing adult obesity (Guo, Wu, Chumlea, & Roche, 2002; Whitaker, Wright, Pepe, Seidel, & Dietz, 1997), while contributing significantly to improved health and educational outcomes for children (Carey, Singh, Brown, & Wilkinson, 2015; Geier et al., 2007). Recent analyses suggest that preadolescent children ages 7 to 11 years are of the age most likely to experience acceleration of weight gain during childhood (Datar, Shier, & Sturm, 2011); therefore, it may be especially important to provide effective health programs during the elementary school years. Comprehensive public health approaches that include effective school-based health programs coupled with policies for improving the lives of disadvantaged children and reducing obesogenic environments offer the best approach for maintaining and even decreasing preadolescent obesity rates, which in turn will lead to decreases in adolescent and adult obesity rates.
Among children aged 6 to 11 years of different racial/ethnic groups, 2012 data from the National Health and Nutrition Examination Survey (NHANES), which provides researcher-measured heights and weights, the highest obesity rates were for Hispanic children (26.1%), followed by Black children (23.8%), White children (13.1%), and Asian American children (8.7%; Ogden, Carroll, Kit, & Flegal, 2014).
Unfortunately, NHANES does not report obesity rates for American Indian children due to lower numbers of survey participants; nor does NHANES survey American Indian youth or adults living in rural reservation communities. The most recent researcher-measured height and weight data for American Indian children ages 1 to 17 years are from the 1990s and early 2000s and indicate overweight and obesity rates exceeding all other racial/ethnic groups of comparison children, with rates for American Indian children varying by geographic region and tribal affiliation (Caballero et al., 2003; Schell & Gallo, 2012; Zephier, Himes, Story, & Zhou, 2006). More recent national data with samples of preschool-aged American Indian children are from the Pediatric Nutrition Surveillance System, which include predominately low-income children ages 2 to 4 years; and from the Early Childhood Longitudinal Study for children aged 4 years. Both surveys had measured heights and weights. In the Pediatric Nutrition Surveillance System data, American Indian children had the highest rates of extreme obesity among all racial/ethnic groups and was the only racial/ethnic group of children to not experience a slight decrease in extreme obesity in 2010 (Pan, Blanck, Sherry, Dalenius, & Grummer-Strawn, 2012). Results from the 2005 Early Childhood Longitudinal Study were that American Indian 4-year-olds had the highest rate of obesity (31.2%), followed by Hispanic children (22%), Black children (20.8%), and White children (15.9%; Anderson & Whitaker, 2009).
Children living in rural regions of the United States have higher rates of obesity compared with urban children, even after controlling for race/ethnicity and socioeconomic levels (Davis et al., 2011; Johnson & Johnson, 2015; Liu et al., 2008; Liu et al., 2012), due in part to environmental challenges of low access to supermarkets, safe and recreational spaces for physical activity, and preventive care services (Robert Wood Johnson Foundation, 2014). Rural children are also more likely to live in poverty compared with urban children (U.S. Department of Agriculture, 2015). American Indian children living in isolated rural reservation communities have some of the most extreme poverty rates in the United States (Snipp, 2005). Thus, the high obesity rates for rural lower income children are substantially influenced by an array of potentially modifiable social, environmental, and cultural determinants, and as such, will require comprehensive and ecological interventions that address risks for obesity at the child, family, community, and societal levels.
For many rural communities, the local elementary school is the center of most important community activities and will be the most effective setting for delivering universal, comprehensive, and nonstigmatizing obesity prevention programs and resources for preadolescent children (Institute of Medicine, 2012). Research to date has not identified elementary school-based obesity prevention programs that reliably lead to long-term decreases in researcher-measured overweight/obesity rates (Centers for Disease Control & Prevention [CDC], 2005). However, other positive health changes have been found including improved physical activity and nutrition, and relative to controls, smaller increases in age- and gender-adjusted BMIs (Institute of Medicine, 2012).
Recent systematic reviews have examined the effectiveness of childhood obesity prevention programs in stabilizing or reducing BMI. Waters et al.’s (2011) Cochrane Review found strong evidence of preventive effectiveness of school-based programs on BMI, especially for elementary-school–aged children. Two 2013 meta-analyses found moderate strength evidence for the effectiveness of children’s school-based obesity prevention programs that included home and community components (Bleich, Segal, Wu, Wilson, & Wang, 2013; Sobol-Goldberg, Rabinowitz, & Gross, 2013). Wang et al. (2015) conducted the largest systematic review to date of childhood obesity prevention programs conducted in different settings. The reviewers concluded that the strongest evidence in any setting was for school-based obesity prevention programs involving physical activity plus home components; and for combined physical activity, healthy eating, home, and community components. The reviews also concluded that most of the effective school-based programs, relative to control groups, stabilized BMI z scores, rather than reduced BMIs. Together, these systematic reviews provide overall support for the effectiveness of elementary school–based obesity prevention programs, which are comprehensive and include home and community involvement components. None of the studies reviewed, however, have included predominant samples of rural or American Indian children.
Almost all the school-based strategies for elementary school students identified by the systematic reviews are components of the Coordinated Approach to Child Health Program (CATCH). CATCH is the largest, most comprehensive, and most rigorously evaluated elementary school–based obesity prevention program in which children were followed from third through fifth grades. The CATCH controlled trial was conducted from 1991 to 1994 in four states involving approximately 5,000 children and included nutrition services, physical education, classroom curricula, and parental involvement components. Some of the schools were in Midwestern rural areas. Results were that CATCH students had greater improvements in nutrition and physical activity compared with no-intervention control school students; however, CATCH students did not show decreases in obesity or increases in aerobic fitness (Luepker, Perry, & McKinlay, 1996). More recently, two CATCH studies involving several Texas elementary schools with large numbers of minority and lower income children found smaller increases in obesity rates compared with children from control schools and small decreases in obesity rates in another sample in a 1-year pre–post study (Coleman et al., 2005; Hoelscher et al., 2010).
The theoretical basis of CATCH and other multicomponent elementary school–based health programs that have shown positive results (e.g., Caballero et al., 2003; HEALTHY Study Group et al., 2010), are based on the social ecological model (Institute of Medicine, 2012) and social cognitive theory (Bandura, 1986). The social ecological model explains that health outcomes are influenced by independent and interacting influences at the child, family, school, community, and societal levels, thus necessitating that school health programs go beyond trying to influence only individual-level child behavior. Social cognitive theory provides empirically supported environmental and behavior change principles (e.g., reciprocal determinism, observational learning, reinforcement, self-regulation, group- and self-efficacy) that are applied in health lessons.
Evaluating the effectiveness of elementary school–based obesity prevention programs for students from diverse demographic and geographic settings is important for adding to the knowledge base of “what works” and for using school-specific findings to inform student, educator, and school climate goals. In this current study, we report on the effectiveness of a 3-year enhanced and culturally informed CATCH program for reducing obesity and improving health in rural White and American Indian children.
Method
Student, Educator, and Parent Participants
The researchers provided information about the CATCH Program to school superintendents from rural and frontier county school districts in the U.S. state of North Dakota. Of the 53 counties in North Dakota, 38 are designated as rural or frontier (72%). These counties include four American Indian reservation communities that are tribal homes of the federally recognized Spirit Lake Tribe, Standing Rock Sioux Tribe, Three Affiliated Tribes, and the Turtle Mountain Band of Chippewa.
The researchers provided preliminary details of their proposed 3-year study but indicated that final implementation and evaluation procedures would be based on collaboration with educators, parents, and other community stakeholders from participating school districts. Twenty-five school administrators indicated an interest in having their school districts participate, but budgetary and school sample size considerations led to selecting eight schools for final participation. The eight schools were selected by dividing the state into four regional quadrants, the southeast, southwest, northeast, and northwest, and then randomly selecting two schools from within each quadrant. The selected school districts were in communities with population densities from 2.4 to 31 people per square mile. This study’s methods and procedures were reviewed and approved by the institutional review board of the authors’ university. Parents provided passive consent for their children’s participation and students provided assent.
Over the 3 years of the program, 465 students participated. Students self-identified their race/ethnicities as White (n = 254, 55%), American Indian (n = 148, 32%), Hispanic (n = 37, 8%), and other (n = 26, 5%). Students from seven of the eight schools were predominately White (ranging from 84% to 100% reporting White race/ethnicity). The remaining school was in a rural reservation community with 98% of the students reporting American Indian race/ethnicity. Only American Indian and White students are included in the study because there were too few students in other ethnicity groups for meaningful analyses.
Of the 402 American Indian and White children, only those with baseline zBMI data (beginning of third grade) are included in the analyses, resulting in a total sample of 308 students (66% White and 34% American Indian). There were 148 girls and 160 boys, with an average age of 105 months (SD = 5.6) at the baseline assessment. Attrition rates at each assessment are shown in Table 1. Forty-four percent of the children were eligible for free/reduced-price lunch, which was substantially higher than the overall state percentage of 29.6% (U.S. Department of Education, 2000-2011).
Attrition in the Number of American Indian and White Students Participating in an Obesity Prevention Program Across Four Assessments, by Gender.
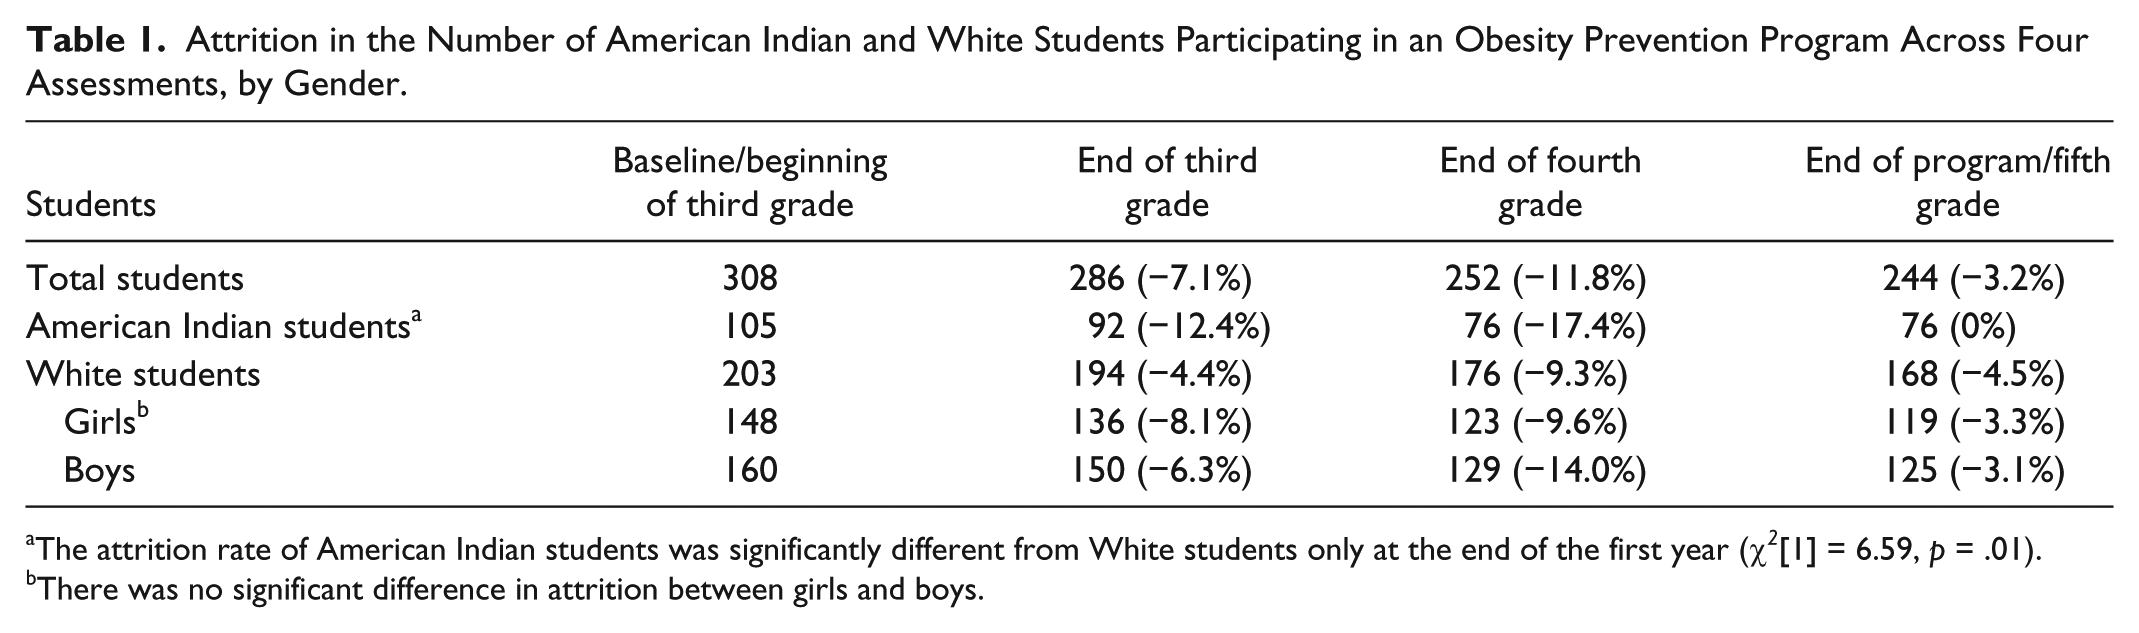
The attrition rate of American Indian students was significantly different from White students only at the end of the first year (χ 2 [1] = 6.59, p = .01). bThere was no significant difference in attrition between girls and boys.
Training and Evaluation Procedure
Assessments of students’ BMIs were conducted beginning in early September of the students’ third grade (baseline) and then at the end of each school year in late May during students’ third, fourth, and fifth grades. One of the principal investigators of the study who was experienced in measuring children’s heights and weights conducted all measurements using standardized procedures and equipment. Physical education teachers assisted the researchers in measuring students’ cardiorespiratory fitness with standardized procedures from the Fitnessgram PACER run test. Classroom teachers administered student self-report questionnaires measuring healthy eating, outside-of-school physical activities, and screen time using standardized procedures. Longitudinal data for PACER run tests and students’ self-reported health behaviors are not included in this article due to space limitations, and our goal of focusing only on objectively measured zBMI data in this longitudinal analysis. A subsequent article, in preparation, will examine students’ cardiorespiratory fitness and self-reported health behaviors as predictors of students’ zBMI changes over the study period. Personally identifiable data were not shared with students, parents, or educators, but yearly aggregate reports were distributed to educators and parents.
Classroom and physical education teachers were trained in proper data collection procedures in a 2-day workshop conducted by the researchers and CATCH training personnel from the University of Texas, 1 month before the baseline assessment. During this workshop, classroom teachers, physical education teachers, food service staff, and administrators also received extensive training in how to deliver the CATCH program components, including (a) classroom curricula, (b) physical education curricula, (c) food service delivery, and (d) family involvement. Details about the CATCH program components have been reported elsewhere (Luepker et al., 1996).
Our CATCH program implementation included two additional enhancements. First, researchers recommended that teachers enhance CATCH’s curriculum, when needed, to reflect realistic and cultural perspectives of students, their school, and their communities. The researchers provided this general guideline and also provided lesson examples to illustrate how teachers might modify healthy eating and physical activity examples to take into account students limited options for fresh foods, local food preferences, and limited options for physical activities due to the extreme cold and long winters. For example, we recommended that teachers include in their examples of healthy foods (e.g., Lesson 2, third-grade curriculum), ones that were consistent with community cultural traditions (e.g., cabbage, rye breads, bison, and gooseberries), and when discussing outdoor physical activities (e.g., Lesson 5, third-grade curriculum), we recommended that teachers have students list physical activities separately for the winter and summer. We also recommended that teachers arrange a field trip to the local, usually only, grocery store with students and parents for practice applying the concept of Go, Slow, and Whoa foods to real purchases (e.g., Lesson 3, fourth-grade curriculum).
Because CATCH was not developed specifically for American Indian children, our research team’s American Indian postdoctoral fellow facilitated a more in-depth review of the CATCH classroom, food service, physical education, and parent involvement curricula with teachers from the reservation community school. The researcher and teachers reviewed the curriculum to identify any concerns and to ensure the teachers felt confident in modifying lesson examples to reflect students’ health environments and cultural norms.
Second, all teachers received a modest stipend for submitting an online report for each lesson delivered in which they reported lesson completion, student responses to the lessons, and open-ended comments about the lesson experience. The most frequently reported modifications of the curriculum involved embedding the lesson with another subject and shortening a lesson. Educator responses indicated that across all schools for the three program years, 93% of all possible lessons were completed. Each school achieved a high lesson completion rate across the 3 years: 82%, 89%, 90%, 90%, 97%, 98%, 98%, and 99%. The lowest completion rate (82%) occurred for the reservation community school.
Consistent with the standard CATCH curriculum, parental and community involvement was emphasized. We additionally involved parents and local public health professionals during annual health assessments; provided aggregated health data via newsletters to parents, teachers, and students; and disseminated information about CATCH through local media. The researchers provided additional suggestions during training sessions for increasing parental involvement including student/parent field trips to the local grocery store, parents participating in classroom lessons (e.g., healthy snacks and breakfast), parents and older siblings joining students during CATCH physical education classes, and parent attendance and participation awards at CATCH family/community nights. All the schools adopted at least one of these activities.
Measures of Body Mass
One of the principal investigators of the study (second author Holm) measured all children’s heights using a Seca portable stadiometer (Seca, Hamburg, Germany) and their weights using a Tanita electronic scale (Model BF-522, Tanita Corporation, Tokyo, Japan), following a standardized protocol. All children were measured at least twice as the protocol required obtaining a second, verifying measurement. Height and weight measures were obtained during physical education classes, but students were measured individually in a private area. Heights and weights were used to calculate students’ BMI, which were then converted to z scores (zBMI) using the CDC’s LMS (lambda-mu-sigma) smoothing formula for growth curves by months of age (Kuczmarski et al., 2002). BMI percentile scores (pBMI) were also derived from the CDC growth curves as they offer a more readily understood measure of change in BMI and also were used to determine the percentage of students meeting CDC criterion for being overweight, ≥85th and <95th percentile, or obese, ≥95th percentile.
Waist circumference and waist-to-hip ratios were not obtained because data suggest strong relationships between those measures and BMI in children (Blüher et al., 2013; Pratesi, Paternostro, Tani, Sassoli, & Cappellini, 2012) and because of concerns for measurement standardization and children’s privacy (Garnett, Baur, Srinivasan, Lee, & Cowell, 2007).
Data Analysis
Mixed multilevel longitudinal modeling using IBM SPSS Statistics, Version 24, tested zBMI changes across the four assessment periods. The fixed effects of students’ gender and ethnicity, and the random effect of school were included in the model. The three-way interaction between longitudinal assessment, gender, and ethnicity, and the two-way interactions between longitudinal assessment and gender/ethnicity, were also tested. Bonferroni adjustment was used for follow-up paired comparisons. zBMI was used in the longitudinal models because of its advantages in statistical analyses compared with other BMI measures such as percentiles or weight categories (Must & Anderson, 2006; Wang & Chen, 2012).
Secondary analyses tested changes in students’ BMI measures from baseline to the end of the program/end of fifth grade compared with a national sample of same-aged children measured during the same time period. In addition to zBMI, pBMI and overweight and obese weight categories were also tested because they provide more readily understood measures (Flegal & Ogden, 2011).
Comparison data were from an age-in-months-matched cohort of children from the NHANES collected during 2003-2004 for the baseline comparison and in 2007-2008 for the end of program/fifth grade comparison (CDC, 2015). There were no public NHANES data available for selecting children based on rural location or American Indian ethnicity. Nor were there sufficient numbers of NHANES children to conduct subanalyses based on gender. Differences in zBMI, pBMI, percent overweight, and percent obese between Program students and NHANES children were tested at baseline (Time 1) and end of program (Time 2).
Program students and NHANES children were also compared on the magnitude of change in zBMI, pBMI, percent overweight, and percent obese between Time 1 and Time 2. Independent sample t tests were used to test zBMI and pBMI differences, while z tests for independent proportions were used to test overweight and obese differences.
Results
zBMI Longitudinal Changes in Program Students
The mixed multilevel longitudinal model resulted in a significant main effect of assessment (F[1, 249] = 5.27, p = .002) and a significant two-way longitudinal interaction between assessment period and ethnicity (F[3, 249] = 3.43, p = .018). All other main and interaction effects and the random effect of school were not statistically significant. Follow-up paired comparisons with Bonferroni adjustment for the significant two-way interaction between assessment and ethnicity are shown in Figure 1. American Indian students’ zBMI increased from baseline/beginning of third grade to the end of third grade but did not differ from baseline at the end of their fifth grade/end of program. White students’ zBMI decreased from baseline to the end of their fifth grade/end of program.
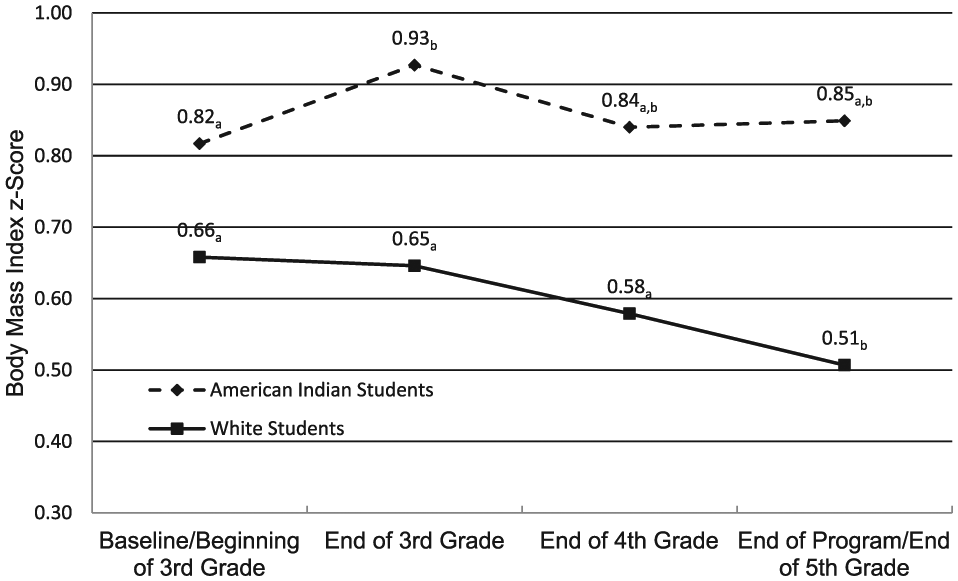
Body mass index z scores (zBMI) of American Indian and White students participating in a school-based obesity prevention program at four assessments: baseline/beginning of third grade, end of third grade, end of fourth grade, and end of program/fifth grade.
Secondary Analyses: Comparisons Between Program Students and NHANES Children
BMI measures from program students were compared with a year- and age-matched cohort of children from two NHANES samples corresponding to program students’ baseline/beginning of third grade and their end of program/fifth grade assessments. As shown in Table 2, despite significantly higher baseline pBMI for program students compared with NHANES children, program students’ obesity rates were decreased at Time 2/end of program while the NHANES children’s obesity rates remained the same—a significant difference in overall rate of change.
Body Mass Index Comparisons Between Program Students and Age- and Cohort-Matched NHANES Children at Time 1 (Program Baseline/Beginning of Third Grade) and Time 2 (End of Program/Fifth Grade).
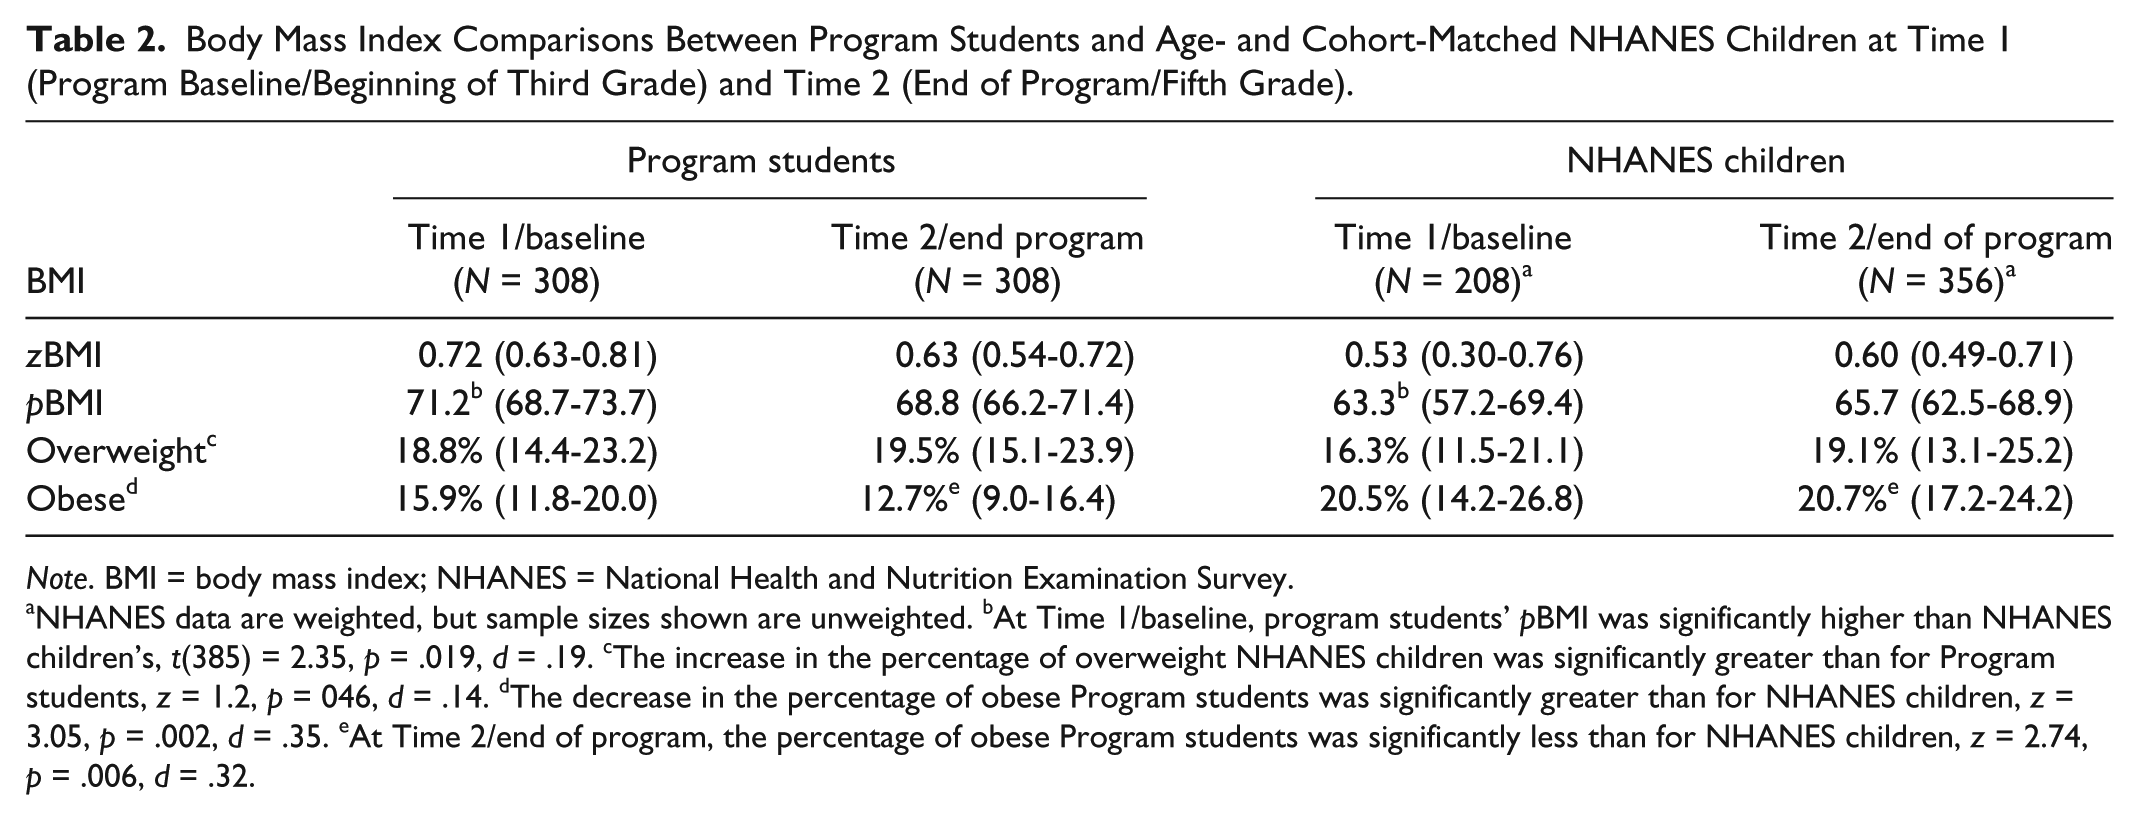
Note. BMI = body mass index; NHANES = National Health and Nutrition Examination Survey.
NHANES data are weighted, but sample sizes shown are unweighted. bAt Time 1/baseline, program students’ pBMI was significantly higher than NHANES children’s, t(385) = 2.35, p = .019, d = .19. cThe increase in the percentage of overweight NHANES children was significantly greater than for Program students, z = 1.2, p = 046, d = .14. dThe decrease in the percentage of obese Program students was significantly greater than for NHANES children, z = 3.05, p = .002, d = .35. eAt Time 2/end of program, the percentage of obese Program students was significantly less than for NHANES children, z = 2.74, p = .006, d = .32.
Discussion
Our 3-year longitudinal evaluation of changes in rural elementary school students’ BMI measures following a comprehensive obesity prevention program found significant decreases for White students and no significant increases for American Indian students. Research with preadolescent children indicates that even small decreases (<0.1) or no-increases in zBMI have been associated with improved metabolic functioning, including cholesterol levels (Kolsgaard et al., 2011).
Our effectiveness study did not include a no-intervention control group. In addition to educators expressing reluctance to serve as no-treatment control schools, the study costs would have increased significantly for providing an additional 3-year implementation and evaluation for the control schools. Schanzenbach (2012) has discussed educator concerns with no-treatment control groups in education research when study designs are longer than 1 to 2 years. Moreover, the evidence is now strong enough to support the efficacy of elementary school-based childhood obesity prevention programs that include community and parent components relative to no treatment.
We strengthened our confidence that the program was effective by using a NHANES comparison group. NHANES children matched to our sample in birth year and age experienced increases in zBMI and BMI percentiles during the 3-year study period—a trend that was also found in other evaluated elementary school–based obesity prevention programs. To our knowledge, this is the first demonstration of decreases in age- and gender-adjusted zBMI and BMI percentiles following a long-term (3-year) comprehensive/multiple health targets elementary school obesity prevention program. Compared with earlier long-term elementary school obesity prevention studies, our study was also the first to use multilevel modeling to also test and adjust for school-level effects.
Based on formal educator feedback, high lesson completion, and informal parent and student feedback at community events, our conclusion was that the school community considered the CATCH implementation as value-added and an effective tool for improving students’ health. Because all our schools were in rural isolated communities and involved relatively small numbers of students, this valuing process may have led to greater cohesiveness, which may account for the increased effectiveness found in our study relative to the original CATCH study in which many large schools were included. We believe this cohesiveness—coupled with the addition of the online educator reporting system—may have contributed to the superior outcomes we found relative to original CATCH study outcomes for BMI. The small sizes of the rural eight schools, relative to the school sizes from the original CATCH trials, may have also increased the effectiveness of our implementation and evaluation. However, the widespread adoption of CATCH in the state of Texas suggests the feasibility of CATCH in diverse school settings.
This was also the first long-term study of an enhanced CATCH program for American Indian students. BMI did not increase across the study period, potentially demonstrating a beneficial effect similar to findings from previous studies in which intervention schools had less steep increases in BMI relative to control schools (Bleich et al., 2013). We believe this is especially promising given the American Indian students had higher baseline obesity rates (21.9% vs. 12.8% for White students); the highest percentage of students receiving reduced price lunches (71.7% vs. 32.3% for non-reservation community schools); and the lowest 3-year lesson completion rate (82% vs. 89% for the next lowest school). Additionally, educators from the reservation community school reported their gymnasium space was not sufficient to fully accommodate all students for full activity periods each day.
Another evidence-based program designed specifically for American Indian elementary school children—the Pathways Program—could be an alternative choice for implementing and evaluating in rural reservation communities. Pathways was evaluated from 1997 to 2001 and, like CATCH, was comprehensive in approach but similarly failed to show significant improvements in students’ BMI and percent body fat (although school-level effects and zBMI were not assessed). However, there were significant decreases in fat intake and increases in self-reported knowledge and attitudes toward healthy behavior (Caballero et al., 2003).
Another limitation of our study is that our matched comparison sample of children from NHANES did not include any American Indian children from reservation communities, nor were we able to select only children based on rurality or geographic region. However, comparing local evaluation results from school-based health programs to a U.S. population sample may be a feasible and cost-effective way to gauge effectiveness, while contributing to regional databases that in turn could be used for improving matching. The lack of NHANES data for American Indian children and their families who live in reservation communities is a significant limitation in achieving national goals for improving American Indian health. Nor are there typically sufficient numbers of American Indian youth and adults to yield reliable and valid estimates of health behaviors from other national surveys such as the Behavioral Risk Factors Surveillance System (BRFSS) and the Youth Risk Behavior Surveillance System (YRBSS). As a result, our research team partnered with tribal health leaders to adapt national surveys such as the BRFSS and YRBSS for directly surveying representative samples of American Indian youth and adults in our state—a practice that may be necessary in states with reservation communities given the lack of national data (Holm, Vogeltanz-Holm, Poltavski, & McDonald, 2010; Vogeltanz-Holm, Holm, White Plume, & Poltavski, 2009).
Research on body mass changes in children suggest that preadolescent children aged 7 to 11 years are of the age most likely to experience acceleration of weight gain during childhood (Datar et al., 2011), and therefore the age group that prevention programming will have the most impact in reducing the likelihood of adolescent obesity, which then is much more difficult to modify with school/community-based programs. Programs that target this age group may represent the most effective intervention strategy, coupled with other public health efforts to decrease obesogenic environments and improve health policies. However, more long-term effectiveness research needs to be conducted before we can confidently inform educators about the most effective—and cost-effective—programs for use in their student populations. Improved research should include, in addition to adiposity measures, factors known to influence obesity in elementary school children including sleep and gross motor coordination (D’Hondt et al., 2013; Landhuis, Poulton, Welch, & Hancox, 2008). Importantly, because adiposity is only one indicator of improvement following obesity-prevention programs, long-term effectiveness studies should include objective measures of cardiorespiratory fitness, school performance, and observed-in-school increases in vigorous physical activity and intake of fruits and vegetables to determine potential causes of BMI decreases.
Of final note, we believe there should be a substantial increase in studies such as ours—type 2 translational research—in which the local effectiveness of evidence-based/efficacious health programs are measured and disseminated. As indicated in the Cochrane review of childhood obesity prevention programs (Waters et al., 2011), effectiveness studies are needed to advance children’s health. Moreover, these studies provide critical opportunities to assist our educators and community members in their school- and community-based efforts to improve health.
Conclusion and Implications for Practice
Current data, supported by the findings of our evaluation, provide confidence that one important component of preventing childhood obesity is implementing empirically supported and comprehensive elementary school–based health programs. Educators should strongly consider adopting health programs such as CATCH, especially for elementary school children. For small and rural school districts, the successful implementation of multicomponent school health programs could be aided by forming partnerships between local school districts and higher education professionals. These partnerships strengthen the educational system and contribute new knowledge of how to improve students’ health.
Footnotes
Acknowledgements
The authors thank Vice-President of Health Affairs, Dr. H. David Wilson; Center research associates Dr. Dmitri Poltavski, Dr. Jessica White Plume, and Dr. Tami Jollie-Trottier; graduate students Sonia Marrone, Patrick Kerr, and Mark Goetz; and staff Jeanne Prom, Polly Alfonso, and Louise Diers for their contributions throughout this project. The authors thank all the elementary school educators, administrators, and food services staff whose caring and collaborative work on behalf of their students made this project possible. Last, we thank the children and their families for their participation and support of the curriculum and evaluation activities.
Declaration of Conflicting Interests
The authors declared no potential conflicts of interest with respect to the research, authorship, and/or publication of this article.
Funding
The authors disclosed receipt of the following financial support for the research, authorship, and/or publication of this article: This study was supported, in part, by a Center grant (RICRH00051) from the Health Resources and Services Administration.