
Abstract
Sexual assault, dating violence, stalking, and sexual harassment present serious challenges to the health and well-being of college students across the United States. An estimated one in five female college students is sexually assaulted during college. Under the federal protection of Title IX, institutions of higher education are responsible for addressing sexual harassment and sexual misconduct as forms of discrimination, thus campus climate surveys are increasingly being conducted in campus settings to examine student beliefs and experiences about sexual assault, dating violence, stalking, sexual harassment, and related campus prevention and response efforts. The Administrator-Researcher Campus Climate Collaborative (ARC3) Campus Climate Survey was designed to assess a range of Title IX violations that include sexual harassment, dating violence, and sexual misconduct victimization and perpetration. This article used a sample of students drawn from seven universities to assess the psychometric properties of the ARC3 survey. Specifically, factor analysis (exploratory and confirmatory) was used to examine the factor structure of each module of the ARC3 survey. Results indicated that the majority of modules within the ARC3 survey were valid and reliable. Recommendations are provided for university administration to utilize a scorecard approach in order to get a brief but comprehensive view of campus safety status.
Sexual assault, dating violence, stalking, and sexual harassment present serious challenges to the health and well-being of college students across the United States. These problems are known to have a negative health impact, both short and long terms in nature (Breiding et al., 2014). Despite a flurry of media attention and growing efforts by lawmakers and administrators of institutions of higher education (IHEs) to rein in these problems, sexual assault and other types of sexual misconduct continue to occur at an alarming rate. Campus climate surveys are an important tool for understanding and preventing campus sexual assault (Lindquist & Krebs, 2018). The purpose of the study described here was to describe the psychometric properties of the Administrator-Researcher Campus Climate Collaborative (ARC3) Campus Climate Survey (henceforth referred to as ARC3 survey) and to assess the approach of scoring of the ARC3 survey by module in a way that allows universities to quickly assess their progress or lack of progress in specific areas related to campus sexual assault. At most universities, the complex problem of campus sexual assault is addressed through a number of interventions and programming delivered by several departments across campus. Providing module scores allows university administrators to quickly assess progress in specific modules, such as bystander intervention effectiveness or peer responses.
An estimated one in five female college students is sexually assaulted during college (Krebs et al., 2016). Fewer than 20% of victims report the assault, citing reasons such as lack of proof, fear of retaliation by the perpetrator, lack of certainty about whether the event was serious enough, worry about hostile treatment by authorities, and not knowing how to report (Krebs et al., 2007). Seventy percent of women who are sexually assaulted know the perpetrator (DiJulio et al., 2015).
Forty-three percent of dating college women report experiencing violent and abusive dating behaviors, including physical, verbal, and emotional abuse (Know Your Title IX, n.d.). Thirteen percent of women report being stalked during their time in college, with 80% of those knowing the person stalking them (Know Your Title IX, n.d.). Hill and Silva (2005) reported that sexual harassment on college campuses is widespread, with 60% of female students experiencing some form of sexual harassment. Hill and Silva (2005) also reported that men are most often the perpetrators and that most victims do not report sexual harassment.
Campus Climate Surveys
The Office on Violence Against Women continues to recommend climate surveys as a best practice for the prevention of sexual assault (Lindquist & Krebs, 2018). Campus climate surveys typically examine student beliefs and experiences about sexual assault, dating violence, stalking, sexual harassment, and related campus prevention and response efforts. Many also include assessment of long- and short-term consequences of sexual assault and sexual misconduct on victims and survivors (Hart & Fellabaum, 2008). Campus climate surveys are an important tool in efforts to reduce sexual misconduct as they assess strengths and weaknesses around efforts to reduce sexual misconduct (Linquist & Krebs, 2018).
There are a number of campus climate surveys currently in use. The most commonly used instruments were described in detail by Wood et al. (2017). Some of the commonly used instruments include the following:
Association of American Universities Campus Climate Survey on Sexual Assault & Sexual Misconduct (abbreviation AAU)
University of Kentucky Campus Attitudes Toward Safety Survey (abbreviation CATS)
Higher Education Data Sharing Consortium Sexual Assault Campus Climate Survey (abbreviation HEDS)
Rutgers University Campus Climate Survey iSpeak (abbreviated iSpeak)
Johns Hopkins University, It’s on Us, Hopkins (abbreviated JHU)
University of Chicago Sexual Misconduct Survey (abbreviated UC)
University of Oregon Sexual Violence and Institution Behavior Campus Survey (abbreviated UO)
Variation in surveys is wide, largely because of lack of agreement about what behaviors constitute sexual assault and sexual misconduct and which outcome variables are most closely associated with sexual assault and sexual misconduct (Hart & Fellabaum, 2008; Wood et al., 2017). In 2016, the Bureau of Justice conducted a nine-school study to develop the Campus Climate Survey, (U.S. Department of Justice, 2017). The survey included assessments of prevalence and incidence of sexual assault, rape, and sexual battery. In addition to the goals of developing a valid survey instrument and survey methodology, the study aimed to create assessment reports that produce school-specific results to be compared across schools and are useful to participating schools. Latent class analysis validated the ability for sexual assault items to be aggregated for school comparison (Krebs et al., 2016). While the survey was methodologically sound and was successful in highlighting problems associated with sexual assault in college campuses, neither did it sample graduate students nor did it include other relevant components of campus safety such as alcohol use (Caamano-Isorna et al., 2018; Mellins et al., 2017; Parks et al., 2014; White & Hingson, 2013; Yeater et al., 2018), peer norms (Bountress et al., 2017), consent (Fedina et al., 2018), and bystander intervention (Kettrey et al., 2019).
Campus Climate Assessment
To expand upon school comparison of sexual assault data by the Bureau of Justice, the researchers of the present study examined module scores to allow university administrators and program leaders to quickly determine which areas related to sexual misconduct required the most immediate attention as well as identify areas of success. The ARC3 instrument was an ideal instrument for providing module scores because it was created with modules that “serve as a barometer of the success of policies, procedures, services, and prevention programs” (ARC3, 2015). The ARC3 survey addresses the experience of sexual misconduct from risk factors through outcomes and considers both perpetration and victimization. The modules in the ARC3 survey are as follows:
Possible Outcomes
Alcohol Use
Peer Norms
Perceptions of Campus Climate Regarding Sexual Misconduct
Sexual Harassment by Faculty/Staff
Sexual Harassment by Students
Stalking Victimization
Stalking Perpetration
Dating Violence Victimization
Dating Violence Perpetration
Sexual Violence Victimization
Sexual Violence Perpetration
Institutional Responses
Peer Responses
Consent
Bystander Intervention
Campus Safety
Additional Information
The Present Study
The primary purpose of this study was twofold. First, we examined the psychometric properties of the ARC3 survey. Once validity evidence was established to aggregate factor scores, the second purpose of this study was to examine the use of module scores as means of providing a brief but comprehensive view of campus safety status.
Method
The work described here was conducted as part of the Cultivating Safe College Campuses project, one of eight similar projects, funded by the U.S. Department of Health and Human (HHS) services. For this Cultivating Safe College Campuses study, 10 IHEs in Texas collaborated to improve efforts on their respective campuses to prevent and respond to campus sexual assault. One of the obligations of the project was for each IHE to conduct an annual campus climate survey. The IHEs were very diverse in size and student demographics. Public, private, urban, and rural universities were included. Two of the IHEs are designated Hispanic-serving institutions and one is a historically Black university. Student enrollment for these IHEs ranged from 1,074 to 37,979 students with an average of 11,160 students. More than half of the institutions were public schools (60.0%) and there were an equal number of rural and urban schools (50.0%). The IHE partners formed a consortium whose goal was to create a consistent, effective response to campus sexual assault. Approval from the institutional review board was obtained for the work described here.
Instrumentation
Several existing instruments were considered for use (Wood et al., 2017). The ARC3 survey was ultimately selected for a variety of reasons. The ARC3 survey is a free campus climate survey developed to assess perpetration and victimization of sexual misconduct on college campuses in the United States, and serves as a barometer of the success of policies, procedures, services, and prevention programs available on higher education campuses. The assessment is comprehensive and one of three instruments that measures both victimization and perpetration (Wood et al., 2017). It also gathers data on alcohol use, peer norms, institutional responses, peer responses, consent, bystander interventions, campus safety, and demographics. As many assessments were developed by universities themselves, the ARC3 survey was developed by a consortium of both professionals and practitioners—sexual assault researchers, social work professionals, psychologists, public health professors, association members, and representatives from higher education groups. It was founded on the principles of (a) inclusiveness, mutual respect, collaboration, (b) engaging in an iterative and transparent drafting process, (c) ensuring independence and integrity in research, (d) a commitment to use of the best scientific evidence as the foundation, (e) equal focus on surveying victimization and perpetration, (f) adoption of a civil rights approach grounded in Title IX, (g) framing efforts with the principles of the Belmont Report, and (h) sensitivity to the unique issues faced by various diverse populations and higher education institutional types (ARC3, 2015). The primary purpose of the Belmont report, one of the leading works concerning ethics in health care research, is to protect subjects in health research (U.S. Department of Health & Human Services, n.d.). The ARC3 developers framed the survey using the Belmont report principles of respect for persons, beneficence, and justice (ARC3, 2015).
The survey is appropriate for use with both graduate and undergraduate students (ARC3, 2015). The time estimated to complete the ARC3 survey is 30 minutes; most campus climate surveys require between 15 and 30 minutes to complete (Wood et al., 2017). The ARC3 survey is composed of 19 modules, which can be selected to provide IHEs with the flexibility in survey length and content. Most of these modules are composed of a series of interrelated items measuring the overall module concept, such as peer norms, alcohol use, and dating violence victimization. All individual modules are listed in Table 1. Though it is not required that all modules be administered, the developers recommend that the modules be presented in order (ARC3, 2015). Responses to items for many of the modules were given on a 5-point scale depending on the specific item. Table 1 contains the number of specific items and scale points contained within each module and submodule. For example, the first item in Module 1 stated “I would recommend attending [Institution] to others.” Responses were given on a 5-point scale that ranged from 1 = strongly disagree to 5 = strongly agree.
ARC3 Module Scale Information.

Note. Module 18 contains demographic questions, such as gender, class standing, and so on. Module 19 contains items related to distress level of the items, meaningfulness of completing the survey, and so on. ARC3 = Administrator-Researcher Campus Climate Collaborative.
Preliminary research utilizing a three-university sample has demonstrated evidence for the scale’s reliability (Swartout et al., 2018). Specifically, authors examined the internal consistency of modules within the ARC3 survey and determined that all but two had acceptable reliability with α > .70 (the remaining two modules (Modules 1 and 17) had internal consistency scores between .65 and .70. Although these results provide initial evidence of the scale’s reliability, additional psychometric evaluation is needed to provide additional validity and reliability support, as well as support for module items to be aggregated into statistically valid factors.
Data Collection
Each IHE administered the baseline ARC3 survey between February and May of 2017 using an online survey platform. Representative sample calculations were determined for each IHE based on the size of their student population, a 50% response distribution, a 95% confidence interval, and 5% margin of error. Representativeness of the samples was assessed by comparing the demographic makeup of the IHE student population on gender, age, and race. Three schools were removed from analysis due to very low data collection rates and nonrepresentative samples. On completion of the data collection, a validity check was conducted to ensure that valid participants were used in the data analyses. Participants who completed the survey in too short a time, incorrectly answered more than half of the attention trap questions, or dropped off before reaching the sexual harassment sections were removed from the data file. Response rates from the six included IHEs ranged from 16% to 23%. The average sample size collected was 967 respondents with a range of 361 to 2,637.
Sample and Data
The sample consisted of students from six 1 Texas Universities. These universities are diverse in terms of size, location, and student demographics. Data from each individual university were merged together to form a data set with 6,973 students. However, because each university had a set of optional modules from which they could select, the total number of observations differed per module. In order to cross-validate the proposed measures, the total sample of 6,973 was randomly split approximately into half (n = 3,389 for the calibration sample and n = 3,386 for the validation sample). To ensure that universities were equally represented in each subset, the random split was done within each school. The two samples did not significantly differ with regard to gender, χ2(1) = 0.001, p = .97; ethnic composition, χ2(5) = 3.65, p = .60; and class standing, χ2(5) = 2.33, p = .80. Frequencies and percentages for each group/sample are presented in Table 2.
Descriptive Statistics for Samples 1 and 2.
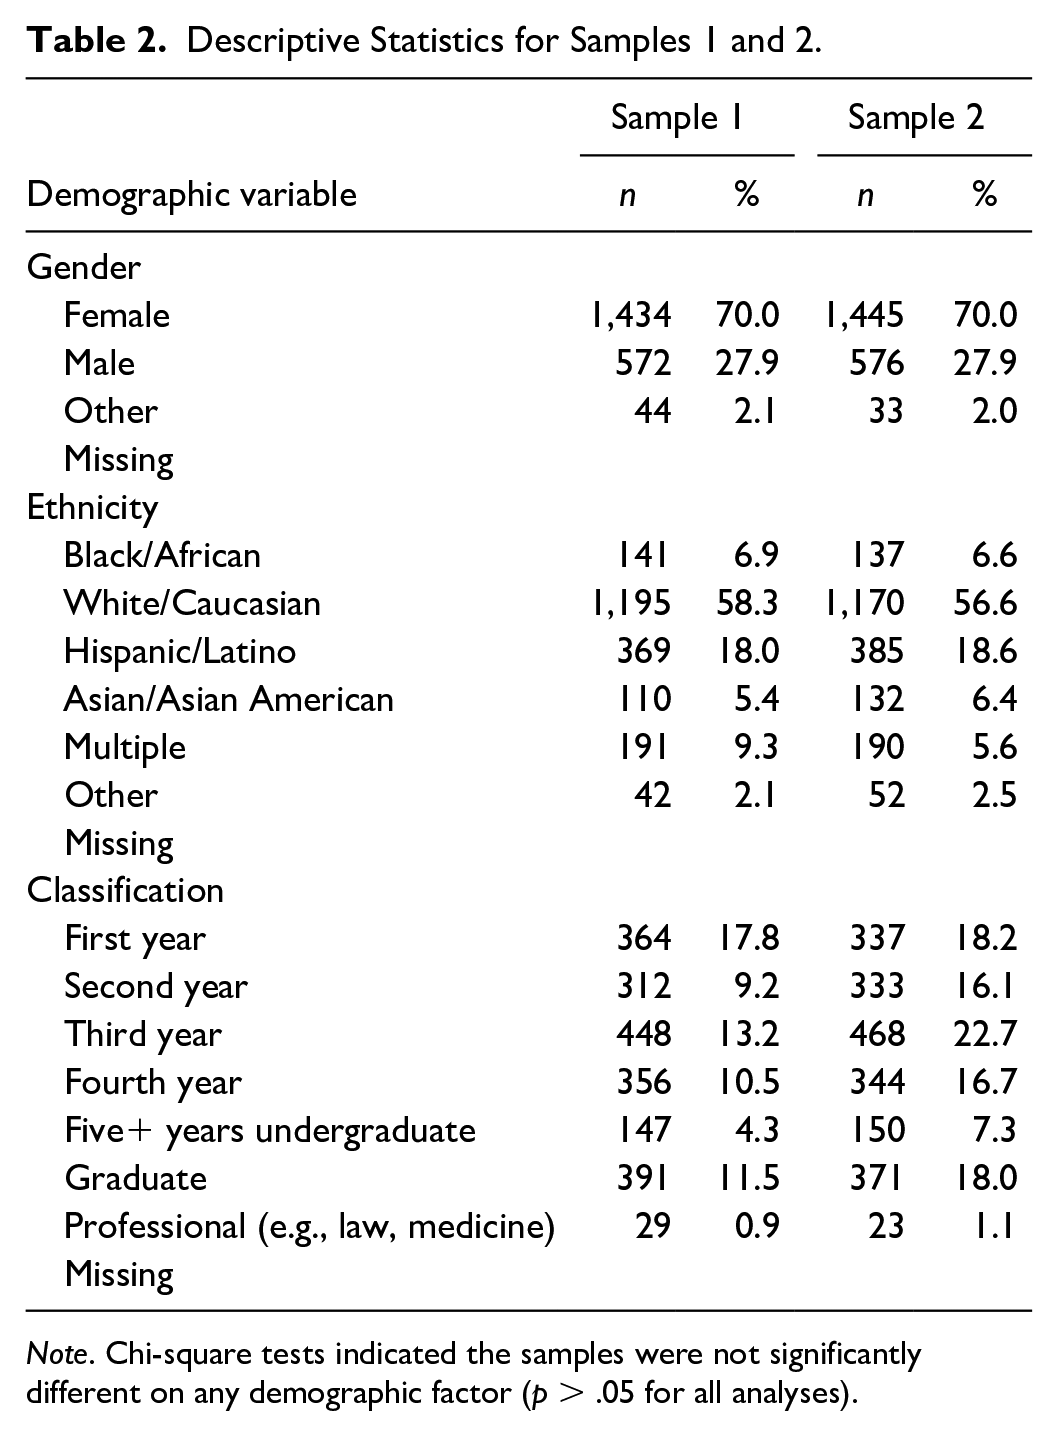
Note. Chi-square tests indicated the samples were not significantly different on any demographic factor (p > .05 for all analyses).
Data Analysis
Exploratory factor analysis (EFA) was used to examine the factor structure of each predesigned module of the ARC3 survey. Individual EFAs were conducted for each predesigned factor that made up the overall modules. For example, Module 1 contained five factors (Factors A through F; see Table 1). However, factors E and F contained only one item, thus, it was not appropriate to conduct EFA within those specific factors. The goal of EFA in scale development is to improve the psychometric properties, and ultimately the validity, of a measure. As defined by Reise et al. (2000), the concept of validity implies that a measure (a) has item content and a corresponding factor structure that is representative of what is known regarding a construct, (b) has a factor structure that is replicable and generalizable, and (c) has a clear interpretability.
As recommended by Henson and Roberts (2006), factor retention was determined using parallel analysis. Varimax rotation was used when more than one factor existed within a module to improve interpretation. Items with factor loadings less than .300 or items that did clearly identify with a single factor (i.e., items that “cross-loaded”) were considered a criterion for removal (Brown, 2006; Kline, 1994). The internal consistency in every module and the underlying subscales were examined using Cronbach’s alpha. A scale was considered to have adequate internal consistency when α > .70 (Field, 2013). The percent of variance explained by factors was reported. When more than one factor was extracted, variance explained based on the rotated sum of squares was reported. All EFAs were performed using IBM SPSS Version 25.
Once the EFA process was complete, the proposed factor structure was confirmed using CFA in the second subset of data (the validation sample). The robust maximum likelihood-based estimation to correct for nonnormality, comparative fit index (CFI), and standardized root mean square residual (SRMR) were examined to collectively test model fit. A general rule of thumb for acceptable model fit using these indexes is SRMR ≤ .08; and CFI ≥ .90 (Hooper et al., 2008; McDonald & Ho, 2002; Sun, 2005). While these values correspond with “acceptable” model fit, SRMR ≤ .5 and CFI ≥ .95 indicate “good” model fit. As noted by Clark and Watson (1995), scales will yield more information and have improved validity when they contain more differentiated items that are only moderately correlated. Thus, the goal of the current analyses was to demonstrate that items within each ARC3 subscale were consistent with one another but were not overly redundant (i.e., α > .95, or near-perfect model fit statistics). CFAs were performed using the lavaan package of R Version 3.1.2.
Standard EFA using SPSS was not appropriate for Modules 2, 11, 12, and 13 due to within-module items on difference scales (Module 2—alcohol use), occurrence of items with highly nonnormal distributions (Module 11—Sexual Violence Victimization and Module 12—Sexual Violence Perpetration) and items with dichotomous answer choices (Module 13—Institutional Responses); thus, factor analysis of mixed data was conducted on Sample 1 and confirmatory factor analysis was conducted on Sample 2 using R Version 3.1.2 (Pagès, 2004, 2014). Finally, Module 13 contained dichotomous items (i.e., yes/no responses) and was not appropriate for Cronbach’s alpha. To test the reliability of the binary items in Module 13, latent variable modeling was used (Raykov et al., 2010). The procedure calculates scale reliability by estimating true score variance and error variance among a set of binary items.
Results
Exploratory Factor Analyses
EFAs were conducted on items within each module of the ARC3 survey containing Likert-type scale items, specifically Modules 1, 3, 4, 5, 6, 7, 8, 9, 10, 14, 15, 16, and 17. Module 1 contained four subscales that encompassed components of academic satisfaction, academic disengagement, satisfaction with life, and mental health. Results of the four EFAs indicated that items within each module loaded onto a single factor with each factor explaining 86%, 38%, 70%, and 61% of variance, respectively (see Table 3). Internal consistency for each subscale was α = .84, .76, .89, and .87, respectively.
Summary of Exploratory Factor Analysis and Reliability Results for Possible Outcomes (Module 1).

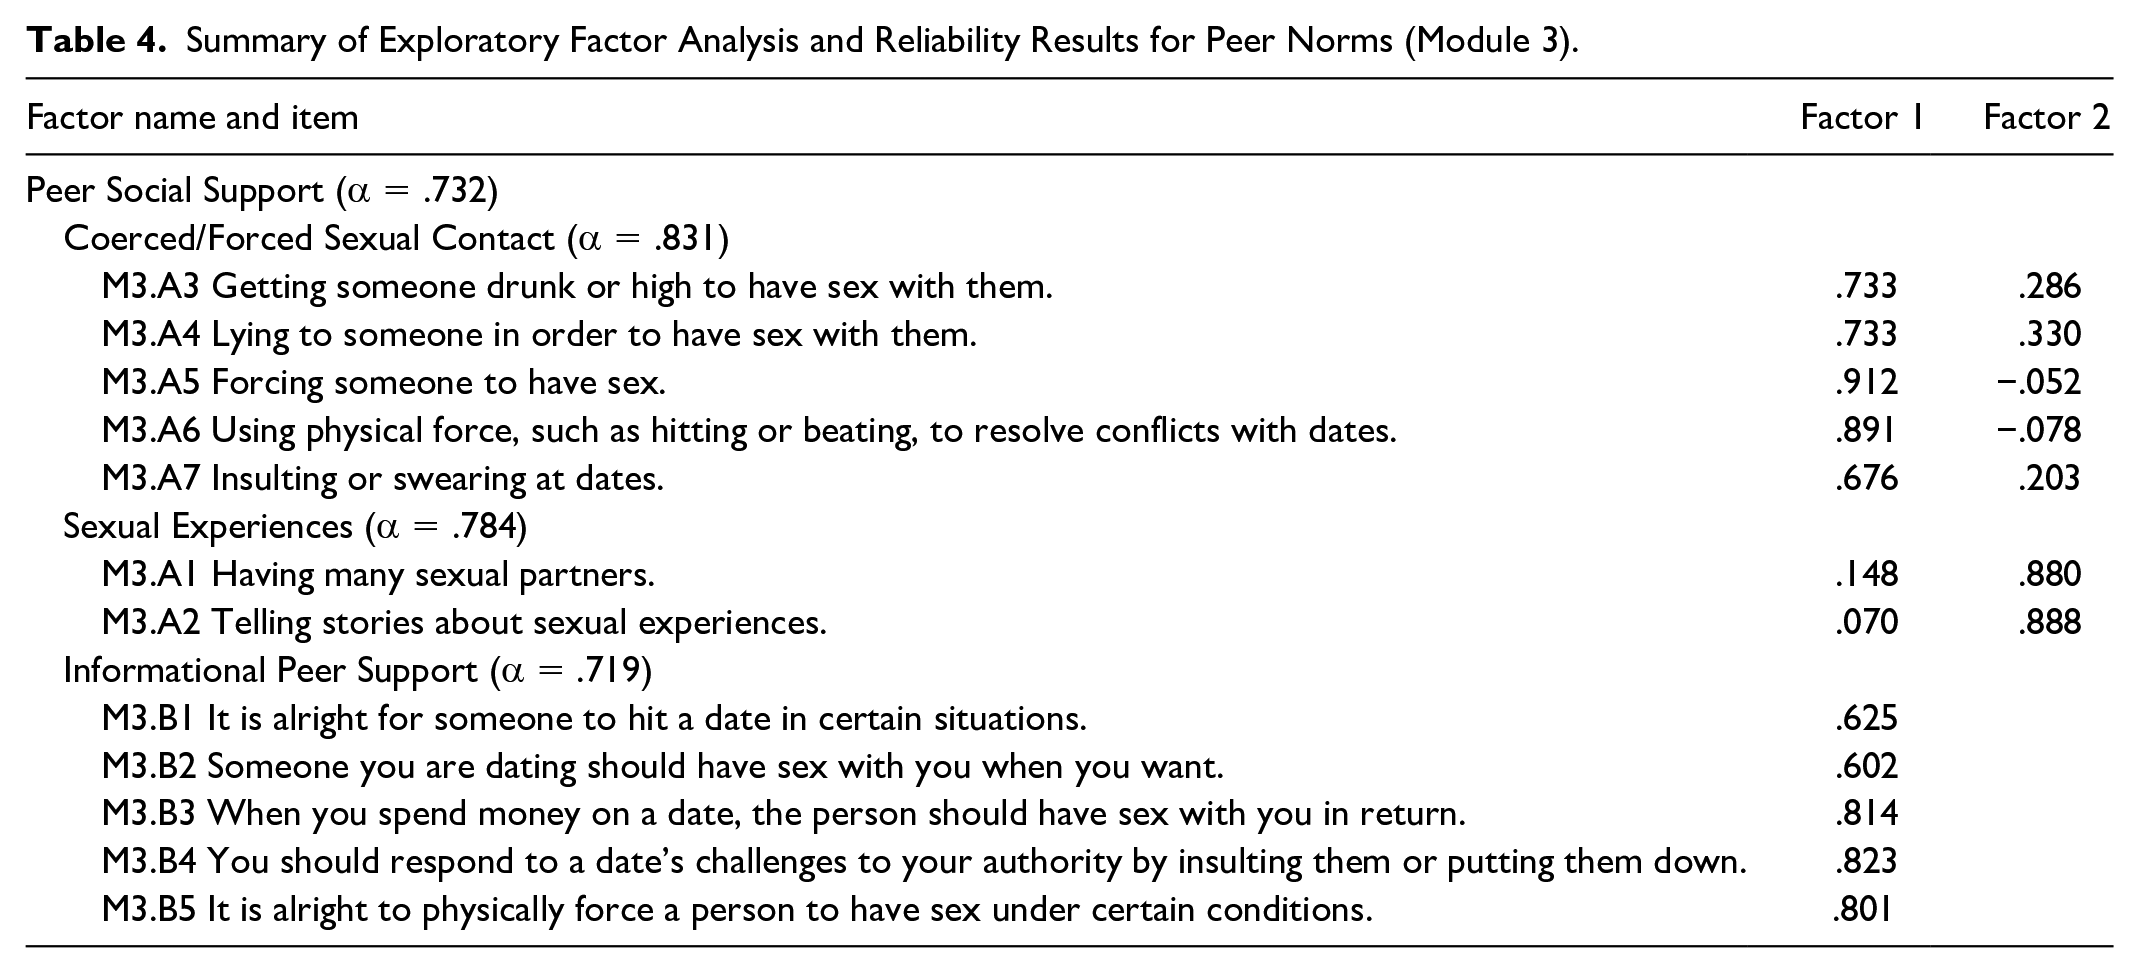
Module 3 contained two subscales: peer social support and informational peer support. The EFA for peer social support indicated a two-factor solution (see Table 4). The first factor was primarily made up of variance from Items 3 through 7 and explained 45% of variance in the items (based on the rotated sum of squares). Based on the items that loaded onto this factor, it appeared that the factor represented support of coerced/forced sexual contact. The second factor explained 26% of variance among the items. Based on pattern coefficients, this second factor was primarily composed of variance from the first two items, which inquired about peer support for having multiple sexual partners and telling stories about sexual experiences. Internal consistency for the two factors in the peer social support subscale was α = .83 and .78, respectively. Regarding the second subscale in Module 3 (informational peer support), results indicated a one-factor solution that explained 54% of variance among the items. Internal consistency was α = .72.
Summary of Exploratory Factor Analysis and Reliability Results for Peer Norms (Module 3).
Module 4 contained four subscales: institutional response, knowledge of campus sexual misconduct resources, sexual misconduct discussion/information (Question 2 in Module 4-C), and awareness of services (Question 4 in Module 4-C), as shown in Table 5. The first EFA for institutional response items indicated a two-factor solution. The first factor explained 51% of variance among items and was primarily made up of variance from Items 1 through 9 (α = .95). Based on the item loadings, it was apparent that the first factor represented positive institutional behaviors, such as handling reports seriously, fairly, and privately. The second factor explained 23% of variance in the items and was primarily made up of variance from the final three questions in the subscale. Internal consistency for the three items was α = .88. The factor appeared to represent negative institutional behaviors such as “punish a person who made a report,” or “would have a hard time supporting someone who made a report.”
Summary of Exploratory Factor Analysis and Reliability Results for Perceptions of Campus Climate Regarding Sexual Misconduct (Module 4).

Note. IHE = institution of higher education.
The EFA for the second, third, and fourth subscales in Module 4 (knowledge of campus sexual misconduct resources, sexual misconduct discussion/information, and awareness of services) all indicated a single-factor solution. Variance explained by each factor was 82%, 49%, and 56%, respectively. Likewise, internal consistency for these three subscales was α = .89, .91, and .87. Based on the large amount of variance explained and high alpha coefficients, it was apparent that a single factor represented all items in the second, third, and fourth subscales of Module 4.
Module 5 was composed of a single subscale that encompassed sexual harassment by faculty/staff. Results of EFA indicated a two-factor solution (see Table 6). The first factor was primarily made up of variance from Items 9 through 16 and explained 43% of variance in the items (α = .95). Based on the items, it appeared that the factor represented pressure to engage in sexual acts. The second factor was made up of variance from Items 1 through 5, and Item 7. This factor explained 31% of variance in the items (α = .91) and appeared to represent offensive comments or jokes. Items 6 and 8 were trimmed from the EFA because they did not clearly relate to one of the two factors (i.e., cross-loading).
Summary of Exploratory Factor Analysis and Reliability Results for Sexual Harassment by Faculty/Staff (Module 5).

Note. Items 6 and 8 were trimmed from the Nonphysical Harassment subscale due to cross-loading.
For the sexual harassment by students items (Module 6), the EFA indicated a one-factor solution (see Table 7). Item 10 had a small pattern coefficient and was trimmed from the analysis. The updated model produced a single factor that accounted for 58% of the total variance. All items loaded well on the factor and internal consistency was α = .93. Based on the variance explained and alpha level, it appeared that a single factor was useful for representing the items in Module 6.
Summary of Exploratory Factor Analysis and Reliability Results for Sexual Harassment by Students (Module 6).
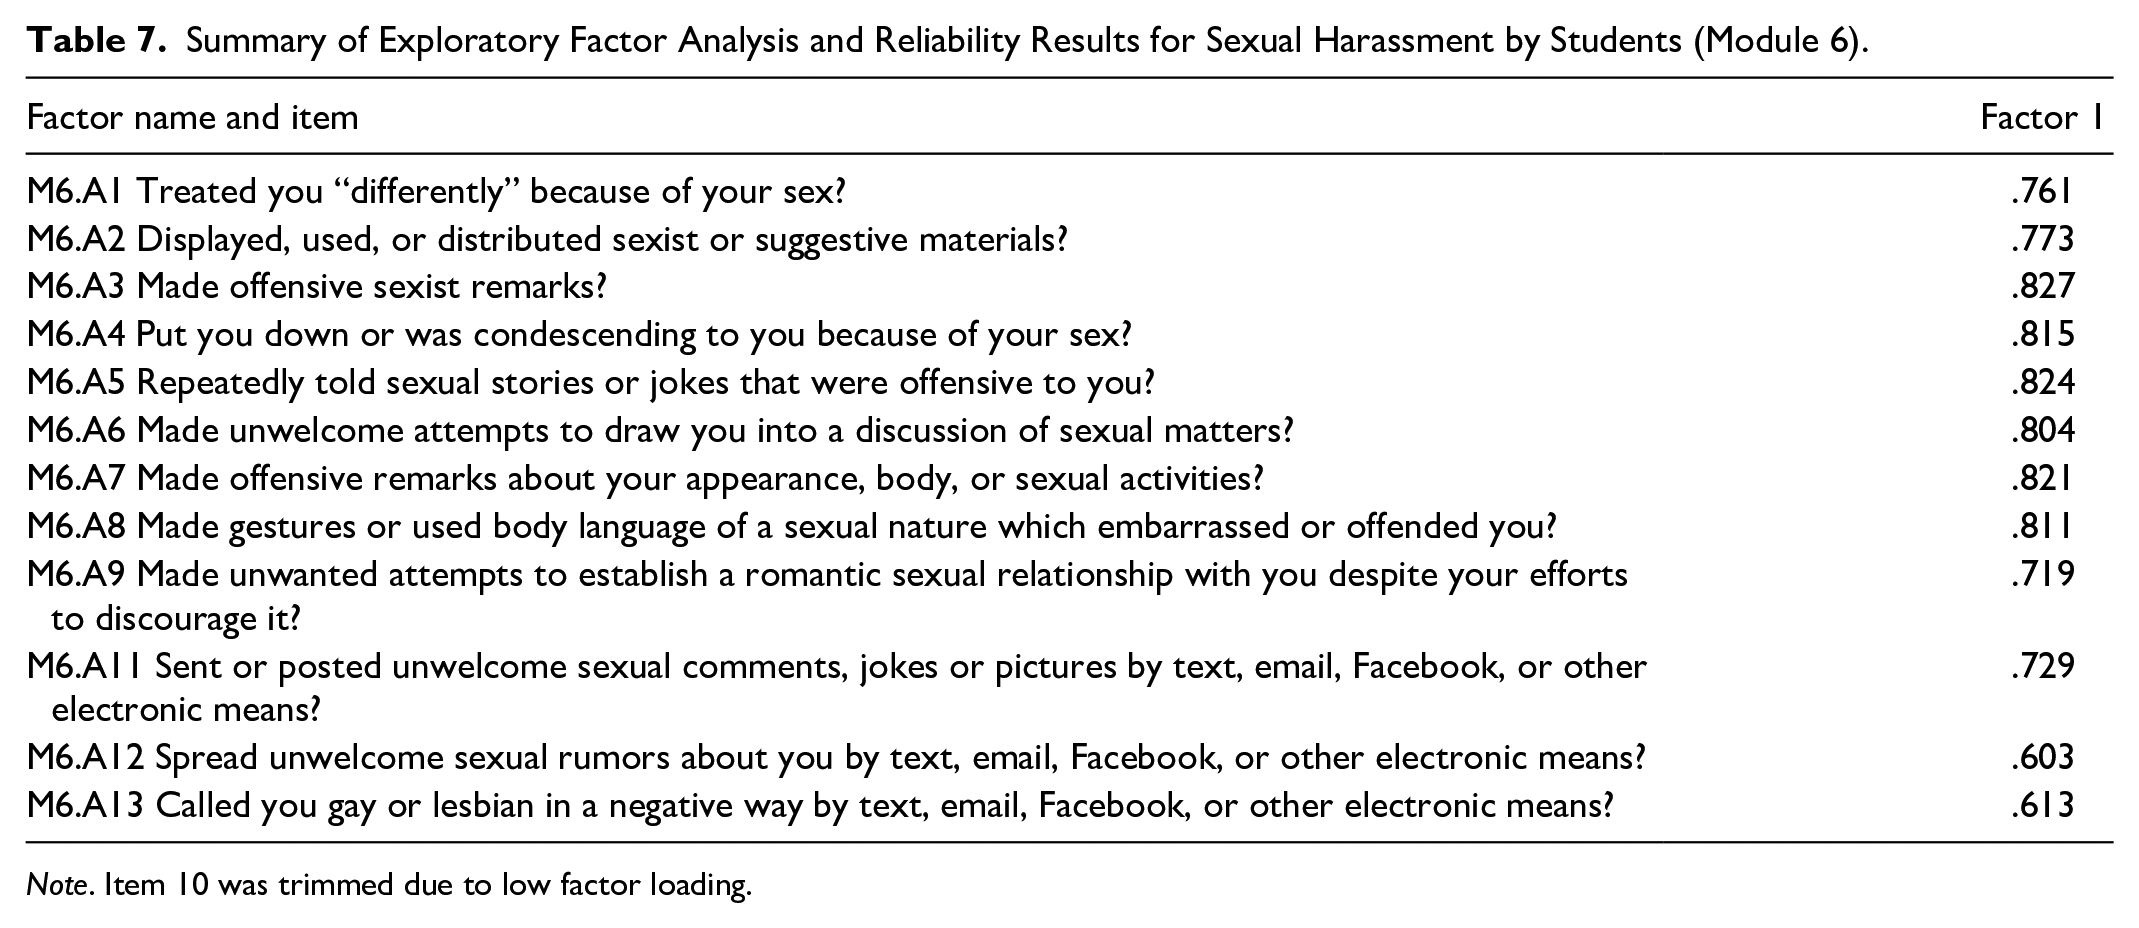
Note. Item 10 was trimmed due to low factor loading.
Results indicated that Module 7 (stalking victimization) was composed of two factors (see Table 8). The first (made up of Items 5, 6, 7, 9, and 10) explained 33% of variance in the items and had an internal consistency of α = .86. This factor could be conceptualized as online stalking. The second factor (made up of Items 1, 2, 3, 4, and 8) explained 31% of variance in the items and had an internal consistency of α = .80. Based on the items that loaded on this second factor, it appeared to represent physical stalking.
Summary of Exploratory Factor Analysis and Reliability Results for Stalking Victimization (Module 7).

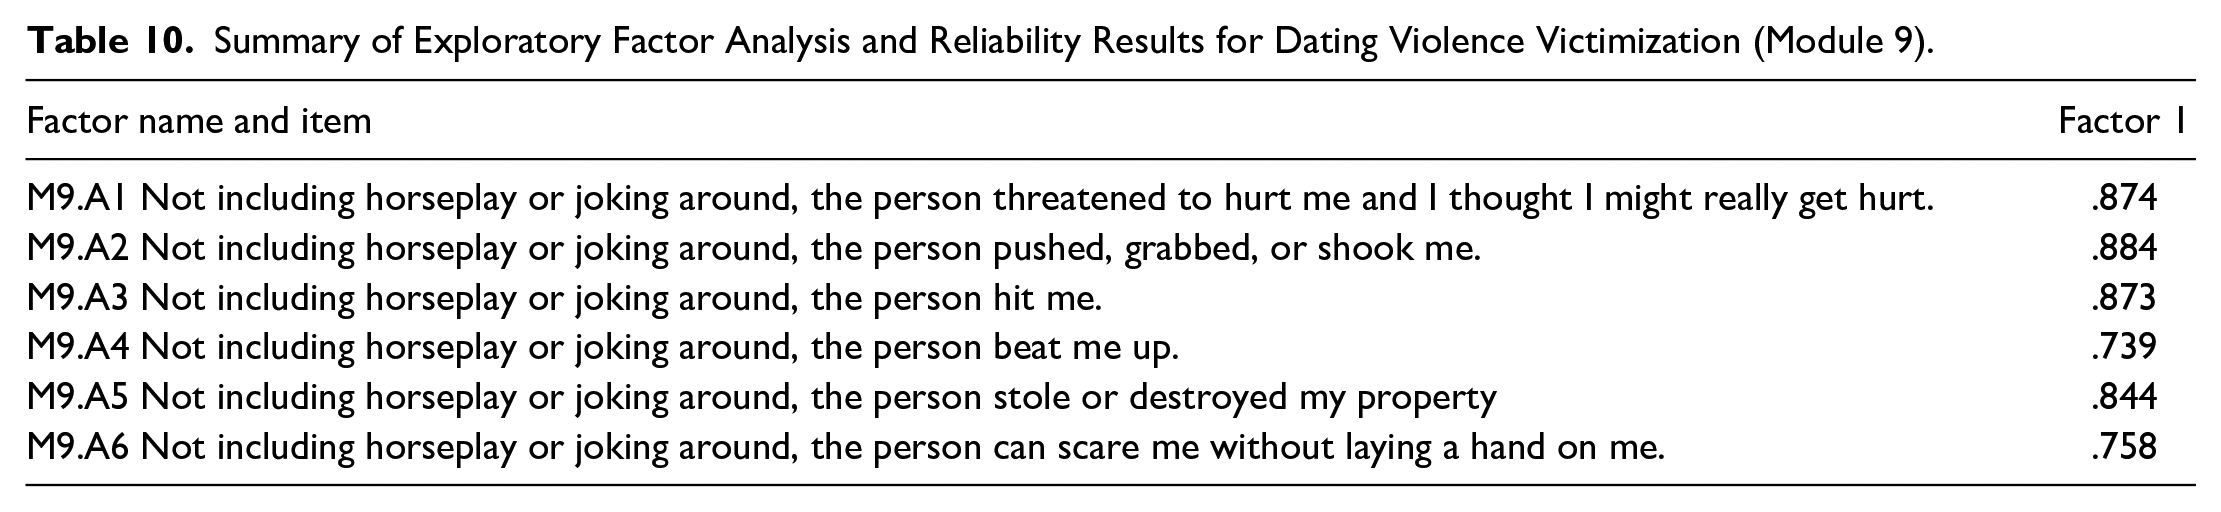
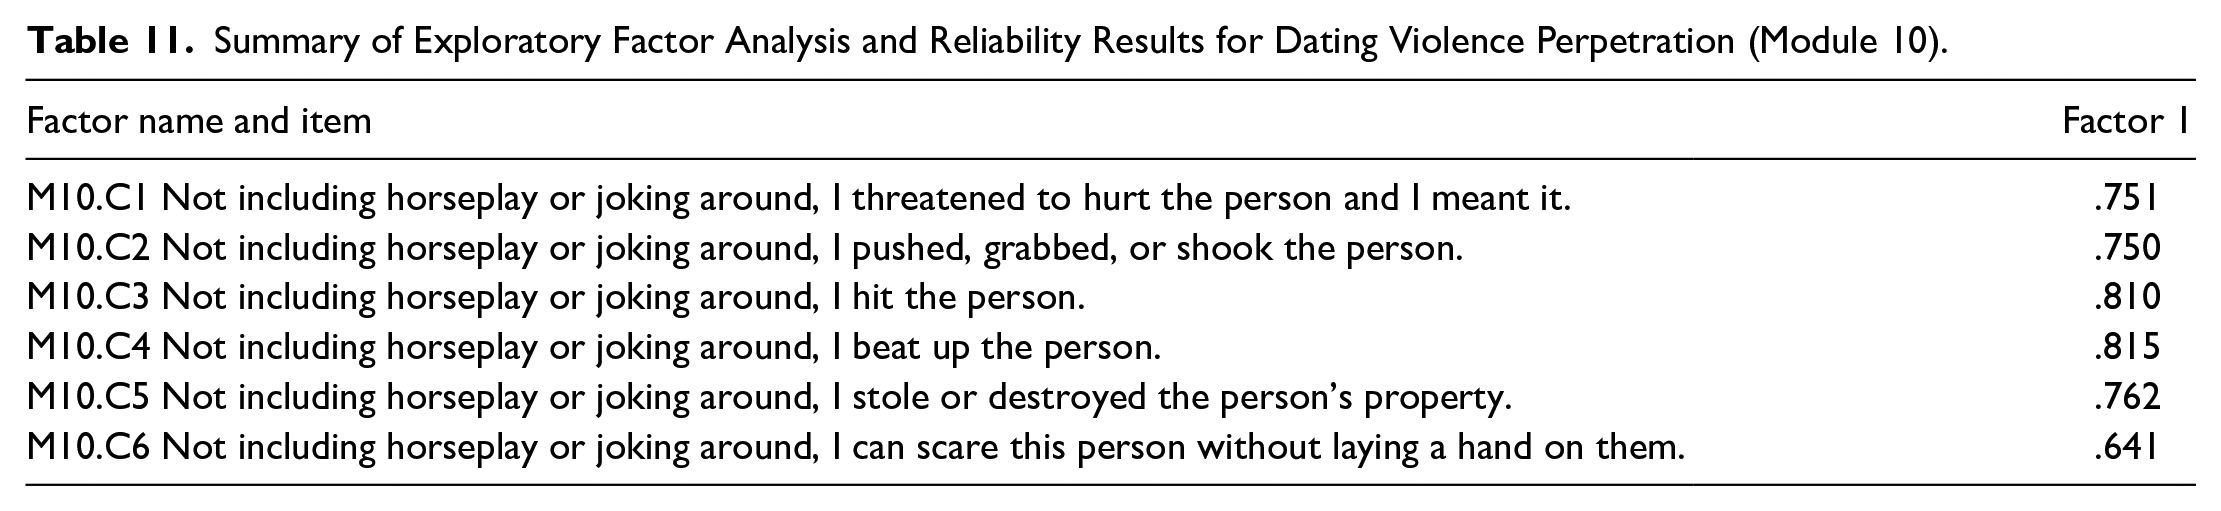
Factor analysis results for Modules 8 (stalking perpetration), 9 (dating violence victimization), and 10 (dating violence perpetration) all indicated that one factor could be used to represent each module. EFA results for the three modules are located in Tables 9, 10, and 11, respectively. Total variance accounted for by each factor was 53%, 69%, and 57% and internal consistency was α = .87, .89, and .83, respectively. Based on the variance explained and strong alpha coefficients, it was apparent that items within each module worked well together to capture the focus of the module. In this case, the items in Module 8 pertaining to stalking perpetration all worked well together to represent the concept of stalking perpetration. This was also the case with Module 9 for dating violence victimization and Module 10 dating violence perpetration.
Summary of Exploratory Factor Analysis and Reliability Results for Stalking Perpetration (Module 8).

Summary of Exploratory Factor Analysis and Reliability Results for Dating Violence Victimization (Module 9).
Summary of Exploratory Factor Analysis and Reliability Results for Dating Violence Perpetration (Module 10).
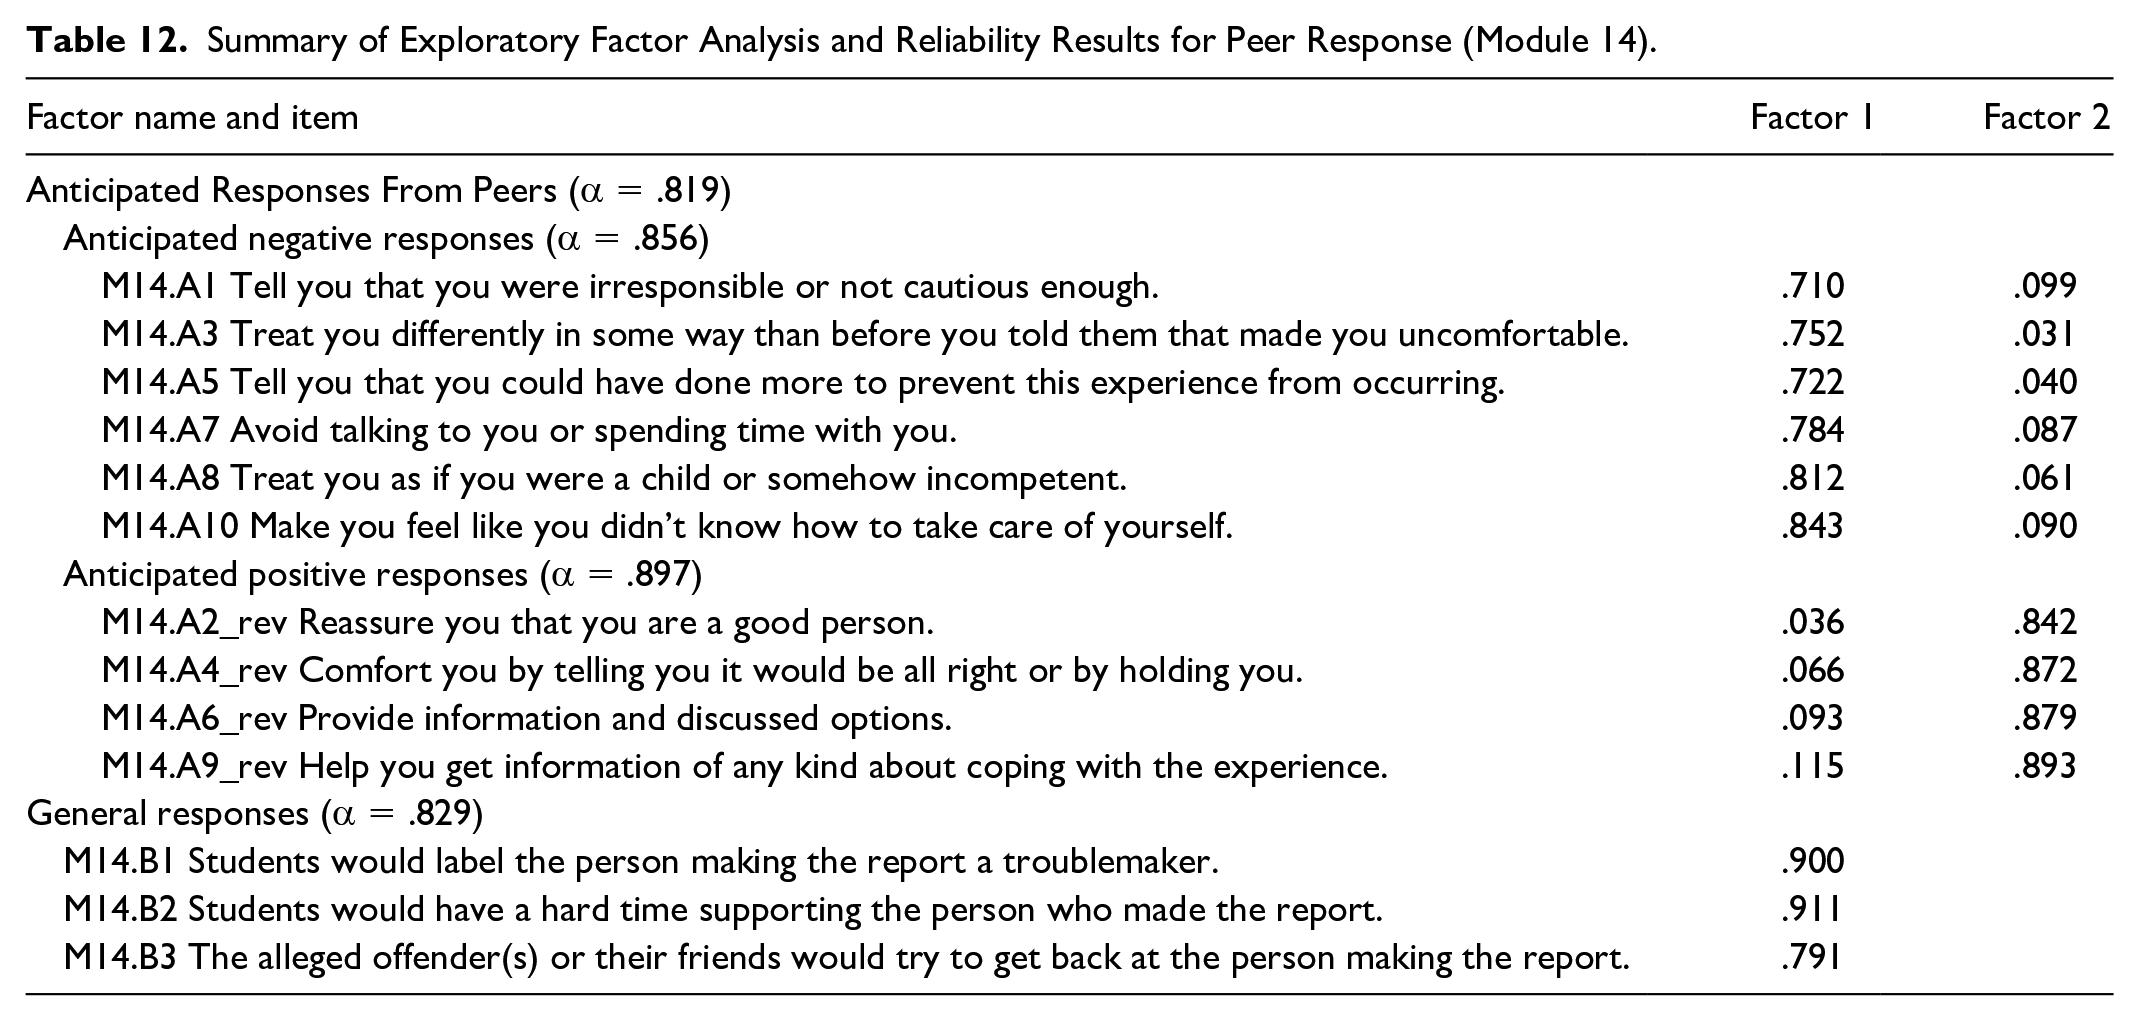
Module 14 (dating violence perpetration) was made up of two subscales: peer responses and general responses (see Table 12). EFA results for the peer responses subscale indicated that two factors could be used to represent the 10 items. The first factor, which explained 36% of variance in the items (α = .86), was primarily made up of variance from Items 1, 3, 5, 7, 8, and 10. Based on the items, it appeared the factor represented judgmental or critical comments from peers. The second factor was made up of variance from Items 2, 4, 6, and 9. This factor explained 31% of variance in the items (α = .90) and appeared to represent positive/supportive peer comments. The second subscale in Module 14 (general responses) was represented by a single factor that explained 75% of variance. The three items also had a strong internal consistency (α = .83).
Summary of Exploratory Factor Analysis and Reliability Results for Peer Response (Module 14).
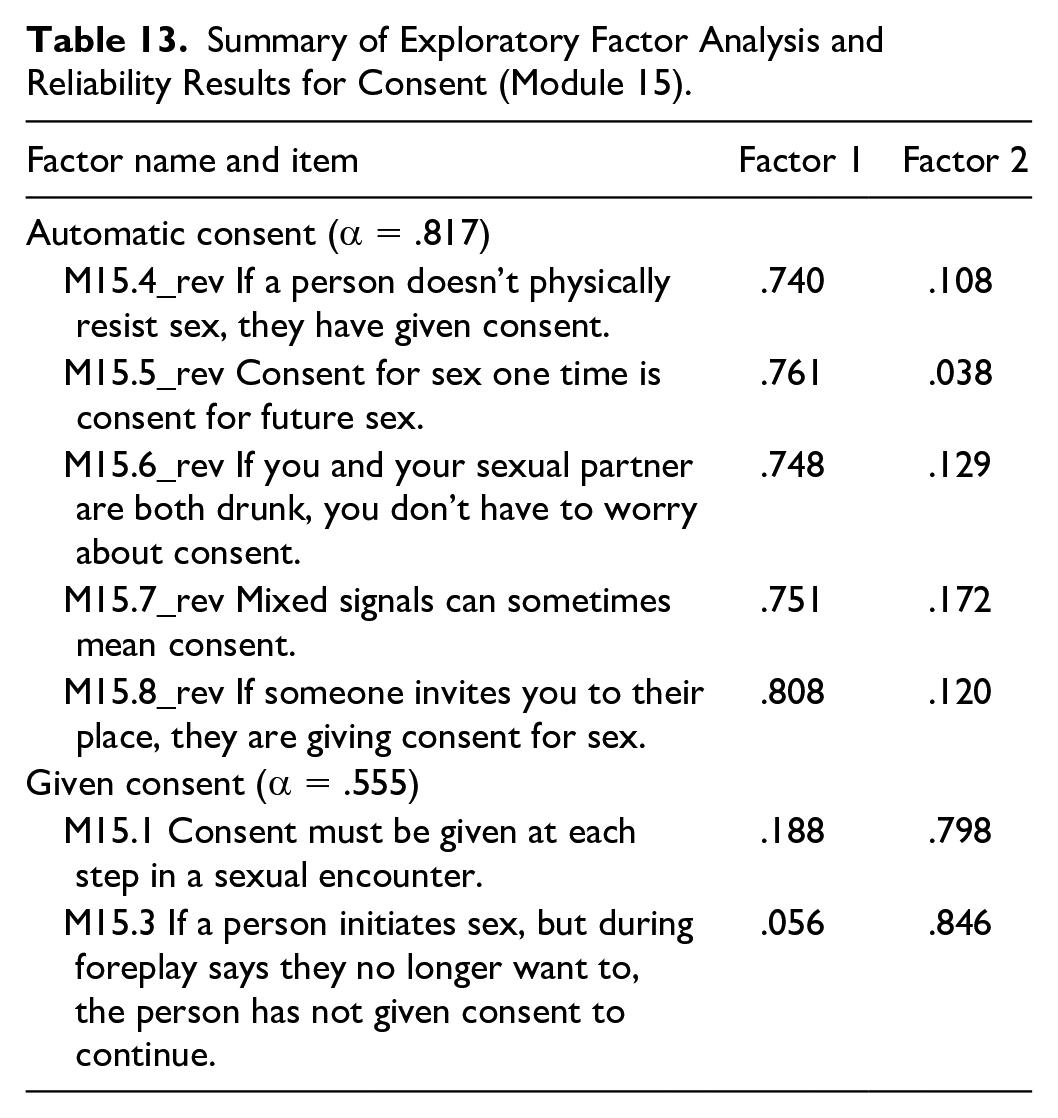
The EFA for Module 15 (consent) also indicated a two-factor solution, as shown in Table 13. The first factor was primarily made up of variance from Items 4 through 8. This factor appeared to represent interpretations of consent (e.g., “If someone invites you to their place, they are giving consent for sex”). There was 42% of variance explained by Factor 1 and internal consistency was α = .82. The second factor was primarily made up of variance from Items 1 and 3, which inquired about consent during a sexual encounter. This factor explained 20% of variance in the items and had an internal consistency of α = .56. It should be noted that the alpha statistic tends to underestimate reliability when the number of test items is low (Tavakol & Dennick, 2011).
Summary of Exploratory Factor Analysis and Reliability Results for Consent (Module 15).
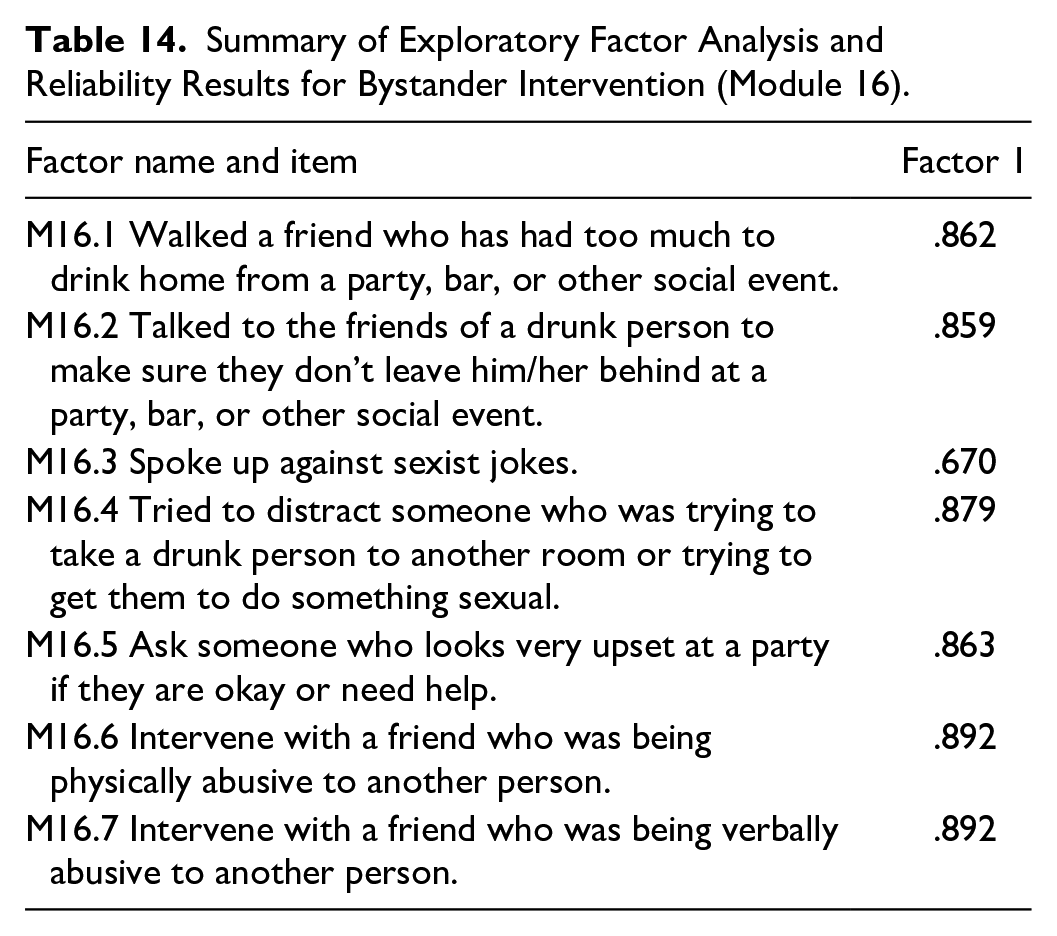
The results from Module 16 suggests only one factor that explained 72% of variance (α = .94). Based on high variance explained and strong alpha coefficients, all seven items within the module worked well together in defining bystander intervention. Specific EFA results are located in Table 14.
Summary of Exploratory Factor Analysis and Reliability Results for Bystander Intervention (Module 16).
Module 17 (campus safety) was composed of two subscales: sense of safety and perception of sexual misconduct as part of campus life (see Table 15). The EFA for sense of safety indicated that the items worked well in forming a single factor that explained 82% of their variance (α = .93). Likewise, items in the second subscale were represented by a single factor that explained 52% of variance (α = .52). Again, the alpha coefficient was likely underestimated due to the small number of items used (Tavakol & Dennick, 2011).
Summary of Exploratory Factor Analysis and Reliability Results for Campus Safety Items (Module 17).
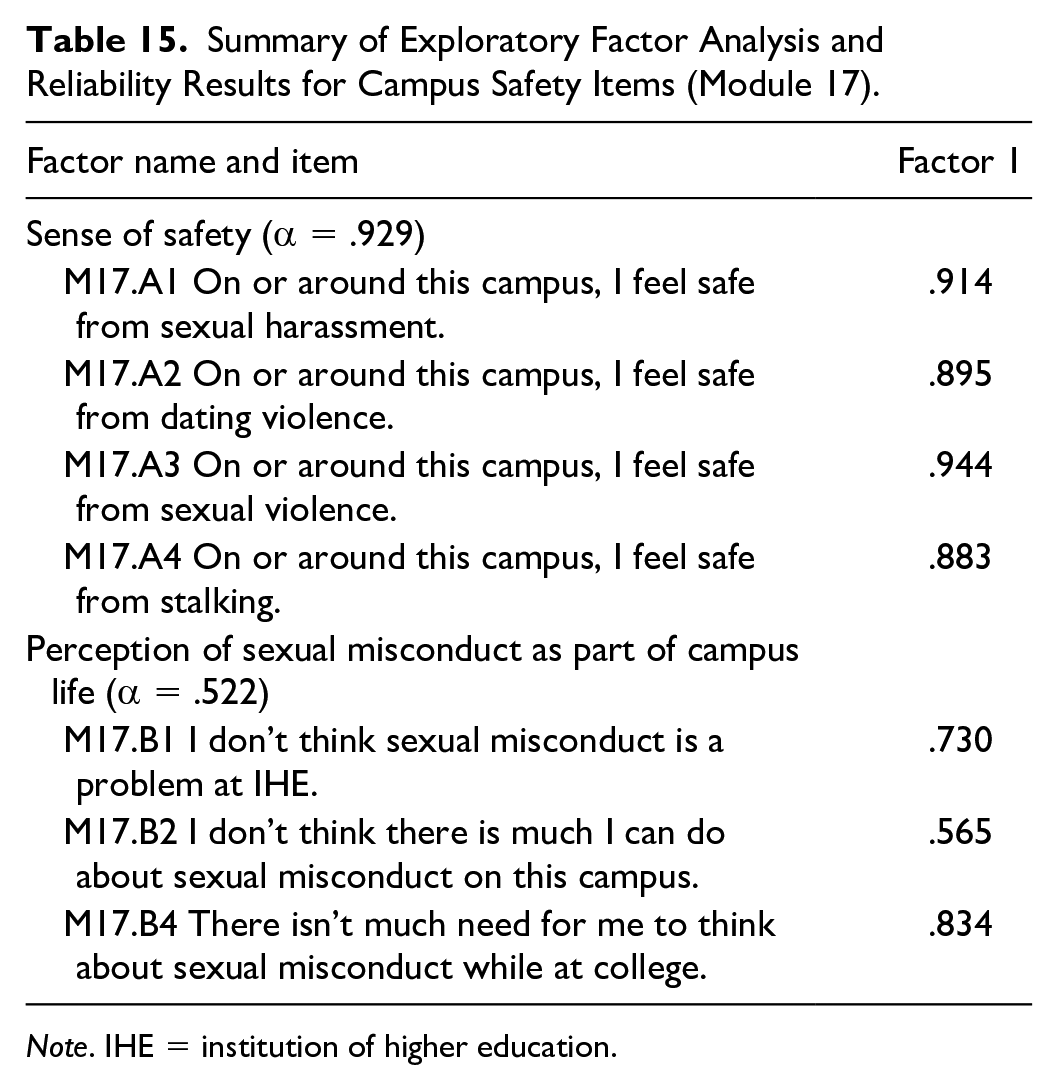
Note. IHE = institution of higher education.
Confirmatory Factor Analyses
Confirmatory factor analyses were conducted to verify the factor structure that resulted from individual EFAs. See Table 16 for a summary of the fit indices from the confirmatory factor analyses and latent variable correlations where applicable. Mean scores were calculated for the items in each factor and subfactor. See Table 17 for a summary of descriptive statistics for each factor and subfactor.
Summary of Confirmatory Factor Analysis Fit Indices and Latent Variable Correlations.
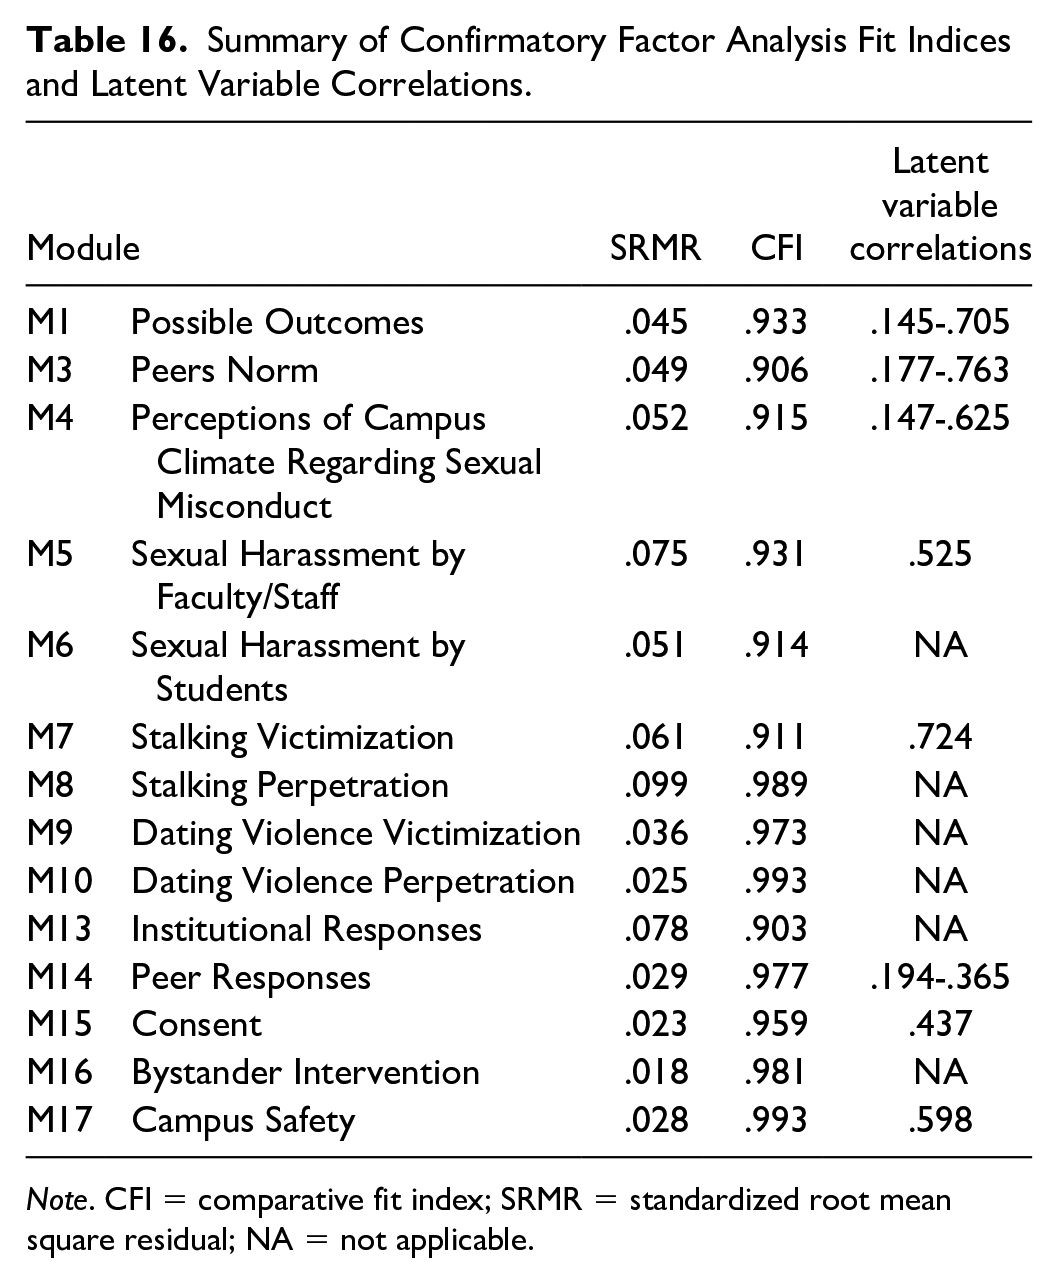
Note. CFI = comparative fit index; SRMR = standardized root mean square residual; NA = not applicable.
Descriptive Statistics of Module and Subfactor on Full Sample.

According to the predesignated structures, the four-factor model for possible outcomes fit the data satisfactorily, SRMR = .045 and CFI = .933. These four factors were positively correlated with each other (latent variable correlation ≥ .145, ps < .001). The three-factor model for peer norms fit the data satisfactorily, SRMR = .049 and CFI = .938. They were positively related to each other (latent variable correlation ≥ .177, ps < .001). The factors in the perceptions of campus climate regarding sexual misconduct also fit the model satisfactorily, SRMR = .052 and CFI = .915. These five factors in this module were positively correlated with each other (latent variable correlation ≥ .147, ps < .001).
Regarding the sexual harassment module, the fit for the two-factor model was acceptable (SRMR = .075 and CFI = .931). The two factors were significantly associated with each other (latent variable correlation = .525, p < .001). Also, the one factor in the sexual harassment by students demonstrated adequate model fit (SRMR = .051 and CFI = .914). For the stalking victimization, the model fit for the underlying two factors was satisfactory (SRMR = .061 and CFI = .911). Physical stalking and online stalking factors were significantly related to each other (latent variable correlation = .724, p < .001). The one-factor model fit in the stalking perpetration was considered acceptable (SRMR = .099 and CFI = .989). With respect to dating violence victimization and perpetration, only one factor was detected in the EFA separately. Both performed good model fits in dating violence victimization (SRMR = .036 and CFI = .973) and dating violence perpetration (SRMR = .025 and CFI = .993).
Peer responses was composed of three factors and the model fit was good (SRMR = .029 and CFI = .977). After reverse coding anticipated positive responses, the three factors were positively correlated with each other (latent variable correlation ≥ .194, ps < .001). As for the consent items, the two factors generated from EFA demonstrated good model fit (SRMR = .023 and CFI = .959). These two factors were positively associated with each other (latent variable correlation = .437, p < .001). In the bystander intervention, only one factor was extracted, which showed good model fit as well (SRMR = .018 and CFI = .981). Last, the predesignated two-factor model in the campus safety fit the data satisfactorily (SRMR = .028 and CFI = .993). Sense of safety was positively correlated with perception of sexual misconduct as part of campus life (latent variable correlation = .598, p < .001).
Factor Analysis of Mixed Data
Factor analysis of mixed data and confirmatory factor analyses were conducted to verify the factor structure for Modules 2, 11, 12, and 13. See Table 18 for a summary of the fit indices and reliability statistics. Mean and summed scores were calculated for the items in each factor. Due to the unique answer scales on each item, Module 2 items were standardized before creating a mean score. See Table 19 for a summary of descriptive statistics for each factor and subfactor.
Summary of Fit Indices From Mixed Data and Confirmatory Factor Analyses.
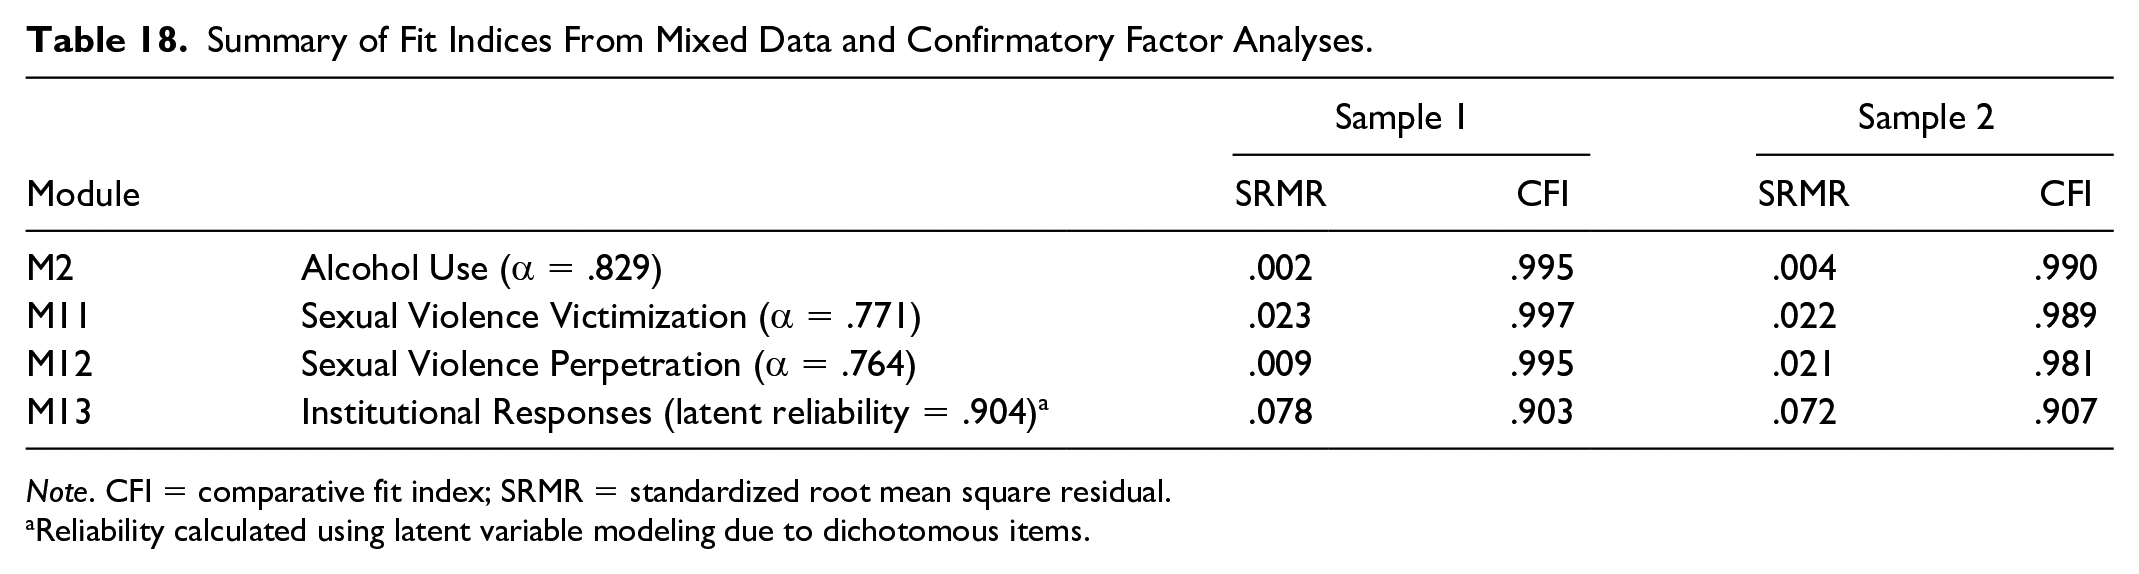
Note. CFI = comparative fit index; SRMR = standardized root mean square residual.
Reliability calculated using latent variable modeling due to dichotomous items.
Descriptive Statistics of Modules 2, 11, 12, and 13.
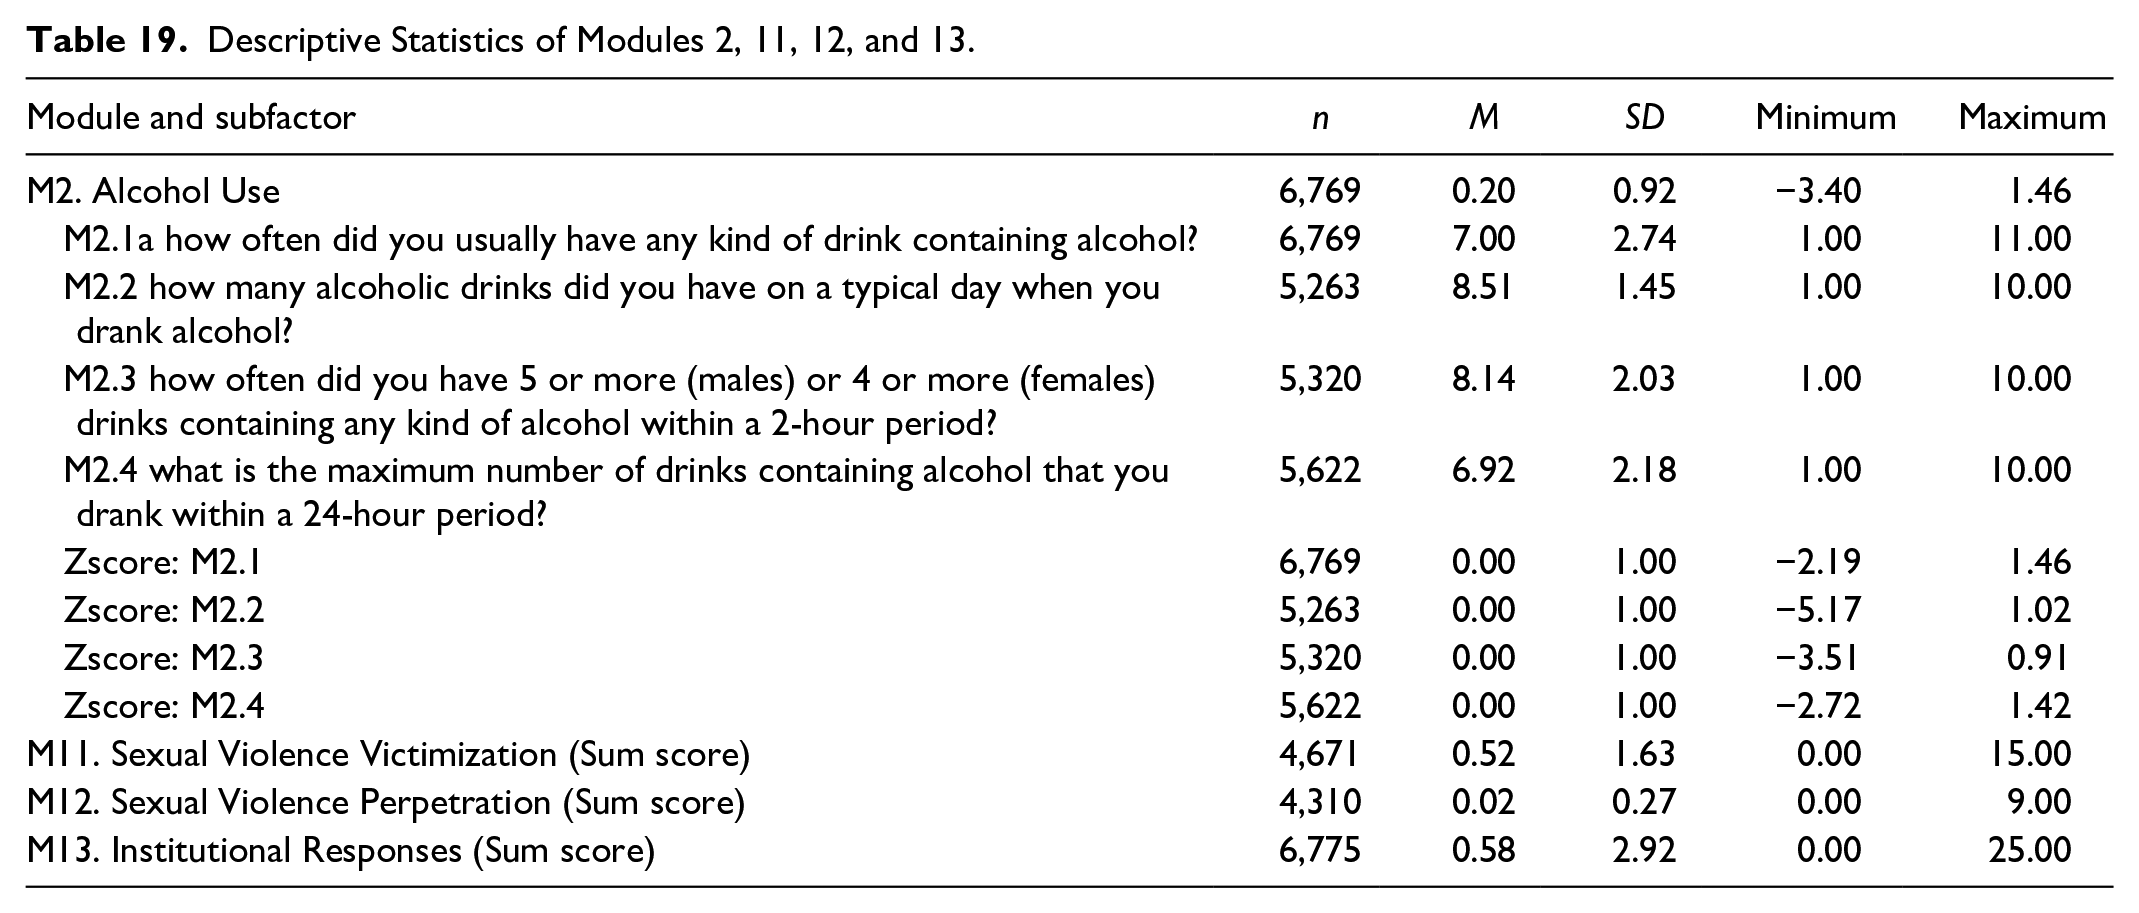
Module 2 (Alcohol Use) asked about having ever consumed alcohol, typical number of drinks, frequency of episodic drinking, and maximum number of drinks in a 24-hour period. The model for alcohol use (Module 2) was composed of four items and results confirmed very good model fit for this predesignated one factor (Sample 1: SRMR = .002 and CFI = .995; Sample 2: SRMR = .004 and CFI = .990). Reliability of these four items was also good (α = .829). Similarly, Module 11 (Sexual Violence Victimization), Module 12 (Sexual Violence Perpetration), and Module 13 (Institutional Responses) each also had good one-factor solutions (see Table 18).
Discussion
The ARC3 survey is a reliable and valid instrument to measure campus climate around sexual misconduct and related concepts. Taken together, predesignated and generated factors in each module demonstrated strong internal consistency across their respective items. Only Modules 5 (Sexual Harassment by Faculty/Staff) and 6 (Sexual Harassment by Students) had items that did not appear to have strong consistency with the other items. CFA further confirmed the satisfactory factor structure in the predesignated modules. Thus, items can be aggregated into a subscale score composed of the mean of the items within that factor. For example, Module 5 is composed of two separate factors (Physical Sexual Harassment and Nonphysical Sexual Harassment). Based on the factorial validity evidence presented above, individual mean scores could be calculated to represent each factor. These mean scores can be used by IHE administrators and researchers to attain a general idea about campus climate and the prevalence of sexual abuse and misconduct, as well as areas to prioritize for intervention.
Using factor scores from the ARC3 instrument allowed evaluators and IHE leadership to take a strategic, diagnostic, and operational approach to the data, identify areas of weakness on their particular campus, and develop programs to facilitate a culture shift, as well as incorporate regular campus climate surveys to assess potential change. Strategies for action and change were selected on an institution-by-institution basis based on the scores they received at the baseline measurement, which served as a diagnostic measure. Each IHE and the project office worked together to strategically determine the prevention approaches best fit for addressing the areas in need of improvement based on the module scores the IHE it received. Posttest scores will reflect whether their efforts are working and offer other areas for further improvement. Utilizing a tailored approach to targeted efforts for each IHE allows for effective allocation of resources, as there is not a one-size-fits-all approach to addressing campus climate. Module scores allowed IHEs to focus their attention on increasing or decreasing scores for targeted areas specific to their institutions. Whereas one IHE may need to address bystander interventions more thoroughly, another may need to address the perceptions of risk on their campus.
Limitations and Directions for Future Research
Several limitations existed in the current study. First, while the sample size was large, participants in the samples were primarily White (57%) and female (70%). Future studies could examine whether the psychometric properties of the ARC3 survey are upheld in more diverse samples. Second, participants self-selected to complete the survey; individual interest in the topic may have represented a source of bias. Further, many students with incomplete data or who did not respond correctly to the validity questions were removed from analysis, therefore, the sample may represent only conscientious students. Third, the ARC3 survey is a comprehensive survey that requires approximately 30 minutes to complete (Swartout et al., 2018). The time commitment may have dissuaded some participants from participating. Finally, the ARC3 survey does not include an assessment of social desirability response bias. This is of particular note given the sensitive nature of many of the items.
Conclusion
Campus climate surveys are an important tool in helping universities understand the nature and extent of sexual assault on their campuses. The ARC3 survey is an effective instrument to collect university data on campus climate related to sexual assault and sexual misconduct. This psychometric analysis of the ARC3 survey indicated that it is a valid self-report measure that provides important data about the problem of sexual assault and associated variables. This analysis also indicated that generally factors and subfactors can be aggregated from the items predesignated within the ARC3 survey to allow academic leadership to develop strategies for action from the module scores report. Utilizing a tailored approach to targeted efforts for each IHE means that resources can be utilized more effectively, as there is not a one-size-fits-all approach to addressing campus climate. Module scores allow IHEs to focus their attention on increasing or decreasing scores for targeted areas. This practical and operational approach to managing outcomes has the potential to help other campus initiatives more fully address the issues specific to their institutions.
Footnotes
Declaration of Conflicting Interests
The authors declared no potential conflicts of interest with respect to the research, authorship, and/or publication of this article.
Funding
The authors disclosed receipt of the following financial support for the research, authorship, and/or publication of this article: This work was funded by a grant (Cultivating Safe College Campuses) from the Department of Health and Human Services, Office on Women’s Health. Its contents are solely the responsibility of the authors and do not necessarily represent the official views of the Office on Women’s Health or the U.S. Department of Health and Human Services.
Notes
Supplement Note
This article is part of the Health Education & Behavior supplement issue, “Campus Sexual Assault Policy and Prevention.” Thank you to the following organizations which have generously supported the open access publication of this special supplement: Johns Hopkins Bloomberg School of Public Health, Center for Injury Research and Policy; Johns Hopkins University School of Nursing; Futures Without Violence; NORC at the University of Chicago; Texas Woman’s University; University of Kansas Department of Women, Gender & Sexuality Studies; University of Kansas School of Social Welfare; University of Kansas School of Public Affairs & Administration; and University of New Hampshire’s Prevention Innovations Research Center (PIRC). The entire supplement is available open access at ![]() .
.