



Abstract
This article has two goals. First, it presents a preliminary literature review of the empirical findings of the worldwide proceeds of transnational organized crime (TOC) and for some Organisation for Economic Co-operation and Development countries as well as a breakdown of the different types of crime proceeds. Also the illegal cross-border flows of global dirty money (including tax fraud figures) are shown, which are by far the biggest share (66 percent) of all illegal transactions. Second, some remarks are made about the infiltration of the TOC into the “official” economic system, and the functioning of the Hawala (or informal) banking is described. There are four main conclusions. First, the revenues of transnational crime are extremely difficult to estimate. Second, fighting transnational crime is very difficult, as there are no efficient and powerful international organizations that can effectively do this job. Third, tax fraud and/or other illegal cross-border capital flows should be the prime target for governments to reduce them. Fourth, this article should be seen as a first start/attempt in order to shed some light on the gray area of the magnitude of proceeds of tax fraud and of transnational crime.
Keywords
Over the last decade, the growth of the world economy has been quite high, and has improved the economic well-being all over the globe. This development was also accompanied by some risks. Two of them are proceeds from transnational organized crime (TOC) and from financial and tax fraud, which both rose remarkably in the last twenty years. This raises three questions. 1 First, from where does transnational crime get its proceeds and what do we know about their size and development? Second, how large are the proceeds from financial and tax fraud? Third, what economic implications does transnational crime have?
In this article, I attempt to give preliminary answers to the first two questions, on the origin of both types of criminal proceeds. A detailed analysis of the financial proceeds and their sources is crucial in order to reduce their possibilities, so that the basis of their operations is at least limited. Hence, the literature review meets two objectives: to widen the knowledge of this subject and to focus on the literature closely related to the research topic. The body of literature on transnational crime financing is huge and diverse and quite often merely descriptive; hence, in my article only those contributions are summarized that contain the latest and (hopefully) the most reliable figures. Also, I briefly answer the third question, but my main focus lies on providing more detailed answers on the size and development of the proceeds of transnational crime and the ones from financial and tax fraud.
My article is structured as follows. The second section provides a literature review of the empirical findings and on the kinds of transnational crime proceeds. The third section shows the infiltration of transnational crime into the economic system and makes some remarks about the Hawala banking system. In the fourth section, some conclusions and policy recommendations are drawn.
Transnational Crime Proceeds and Money Laundering 2
Worldwide Figures
Dirty money from crime is earned through various underground activities, like drug, weapons, and human trafficking. How much illicit crime money in all its forms can be observed? 3 The most widely quoted figure for the extent of money laundering criminal proceeds has been the International Monetary Fund (IMF, 2001a, 2001b, 2003) consensus range of 2.0 percent to 5.0 percent of global gross domestic product (GDP).
Tables 1 and 2 show the Financial Action Task Force (FATF) estimates and the IMF estimates of worldwide money laundered, for a similar period (FATF 1988–2005; IMF 1996–2009). Considering first the FATF estimate, the amount of worldwide money laundering is 2.0 percent in 1988, increased to 3.5 percent in 1996 and decreased again to 3.0 percent in 2005. The IMF estimate has a range of between 2.0 percent and 5.0 percent over the period 1996–2009. In absolute terms, the worldwide money laundered increased by 36.0 percent from 1996 to 2005 and by 33.0 percent from 2005 to 2009, which is quite a dramatic increase. These FATF or IMF figures are more or less in a similar range.
FATF Estimate of Worldwide Money Laundering, 1988–2005.

Source: IMF (2001a, 2001b, 2003) and FATF (2007).
Note. FATF = Financial Action Task Force; GDP = gross domestic product; USD = United States dollar.
IMF Estimates of Money Laundered Worldwide, 1996–2009.
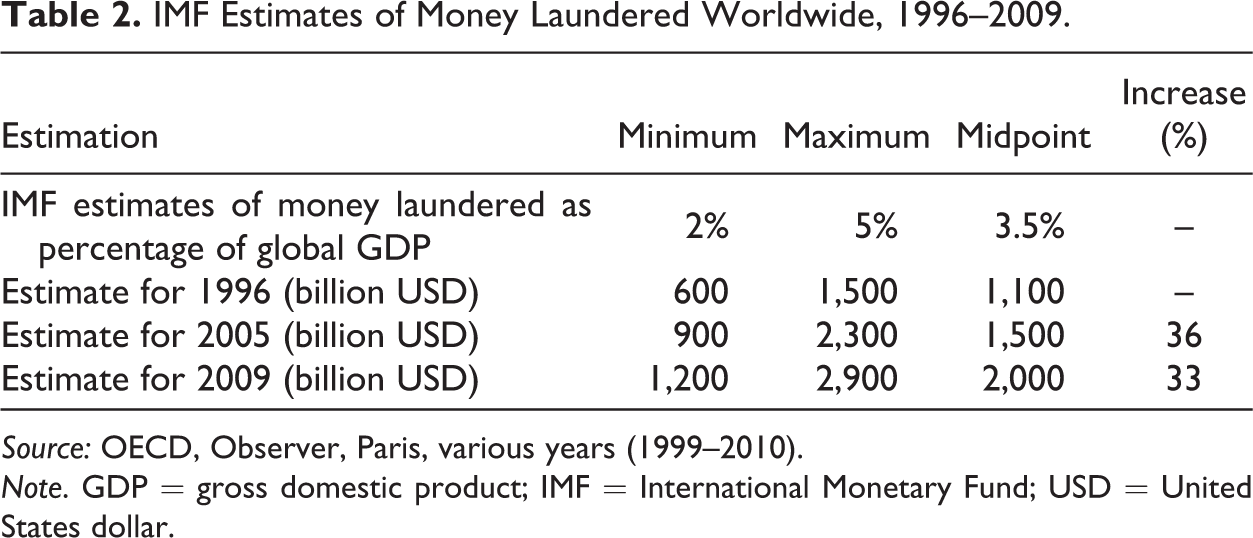
Source: OECD, Observer, Paris, various years (1999–2010).
Note. GDP = gross domestic product; IMF = International Monetary Fund; USD = United States dollar.
Table 3 shows the FATF estimates of global amounts of laundered money up to the year 2009. Here the key focus lies on drugs and for this a calculation of the total amounts laundered from all criminal proceeds. In the year 2000, it is estimated that laundered money is 0.6 trillion United States dollar (USD) and doubles up to the year 2009 to 1.2 trillion USD.
FATF Estimates of Global Amounts of Laundered Money, 1988–2009.
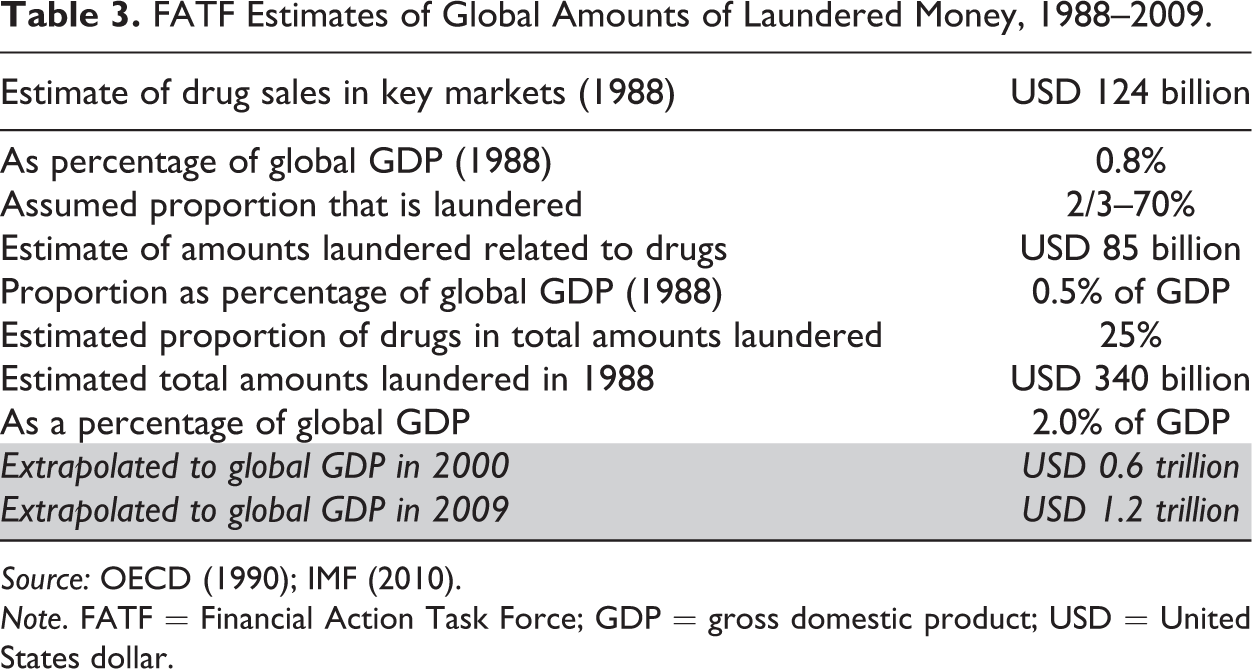
Source: OECD (1990); IMF (2010).
Note. FATF = Financial Action Task Force; GDP = gross domestic product; USD = United States dollar.
Table 4 shows some newer FATF data, again for the drug market for the year 2003. For the year 2003, the FATF estimates of the total amounts laundered (from all criminal proceeds) is 880 billion USD, or 2.4 percent of world GDP. Extrapolated to the year 2009, the calculation reaches 1.4 trillion USD.
Updated FATF Model of Global Amounts Laundered.

Note. FATF = Financial Action Task Force; GDP = gross domestic product; USD = United States dollar.
Table 5 indicates money laundering by region over the period 2000–2005. North and South America have by far the biggest share with 37.8 percent in 2000, which remains more or less constant up to 2005 with 37.7 percent. This is followed by Asia Pacific with a modest increase from 29.7 percent in 2000 to 31.5 percent in 2005. Europe slightly decreased over this period, from 27.8 percent in 2000 (of all money laundered proceeds) and to 26.0 percent in 2005.
Annual Money Laundering by Region (Billion USD), 2000–2005.

Source: Celent (2002, 2006).
Note. GDP = gross domestic product; USD = United States dollar.
aThe 2005 estimates are projections.
In Table 6, the cross-border flows of global “dirty money” in trillion USD are shown over the period 2000–2005 on a worldwide basis. This includes tax fraud money and all money that leaves a country due to some criminal reason. One clearly sees from Table 6 that the overall amounts of dirty money laundered is between 1.1 and 1.6 trillion USD and increases to 1.7 to 2.5 trillion USD in the year 2009. This is quite a large sum, which amounts to between 2.9 and 4.3 percent of the world GDP. The classic criminal component lies only between 27.0 percent and 31.0 percent of the total dirty money. Hence, one clearly sees that capital flight and tax fraud money are by far the biggest proportions of dirty money. 4
Cross-border Flows of Global Dirty Money Including Tax Evasion (Trillion USD), 2000–2005.

Source: Baker (2005); World Bank Indicators (for GDP).
Note. GDP = gross domestic product; USD = United States dollar.
Table 7 shows the proceeds of transnational crime (time range 2003–2009). Here we have a clear-cut result. Drugs are the biggest business with 50.0 percent, followed by counterfeiting with 39.0 percent, human trafficking with 5.0 percent, and oil with 2.0 percent. The proceeds from all other crime are much lower. In total, we have here a sum of 650 billion USD, which amounts to 1.1 percent of global GDP.
Proceeds of Transnational Crime, 2003–2009.
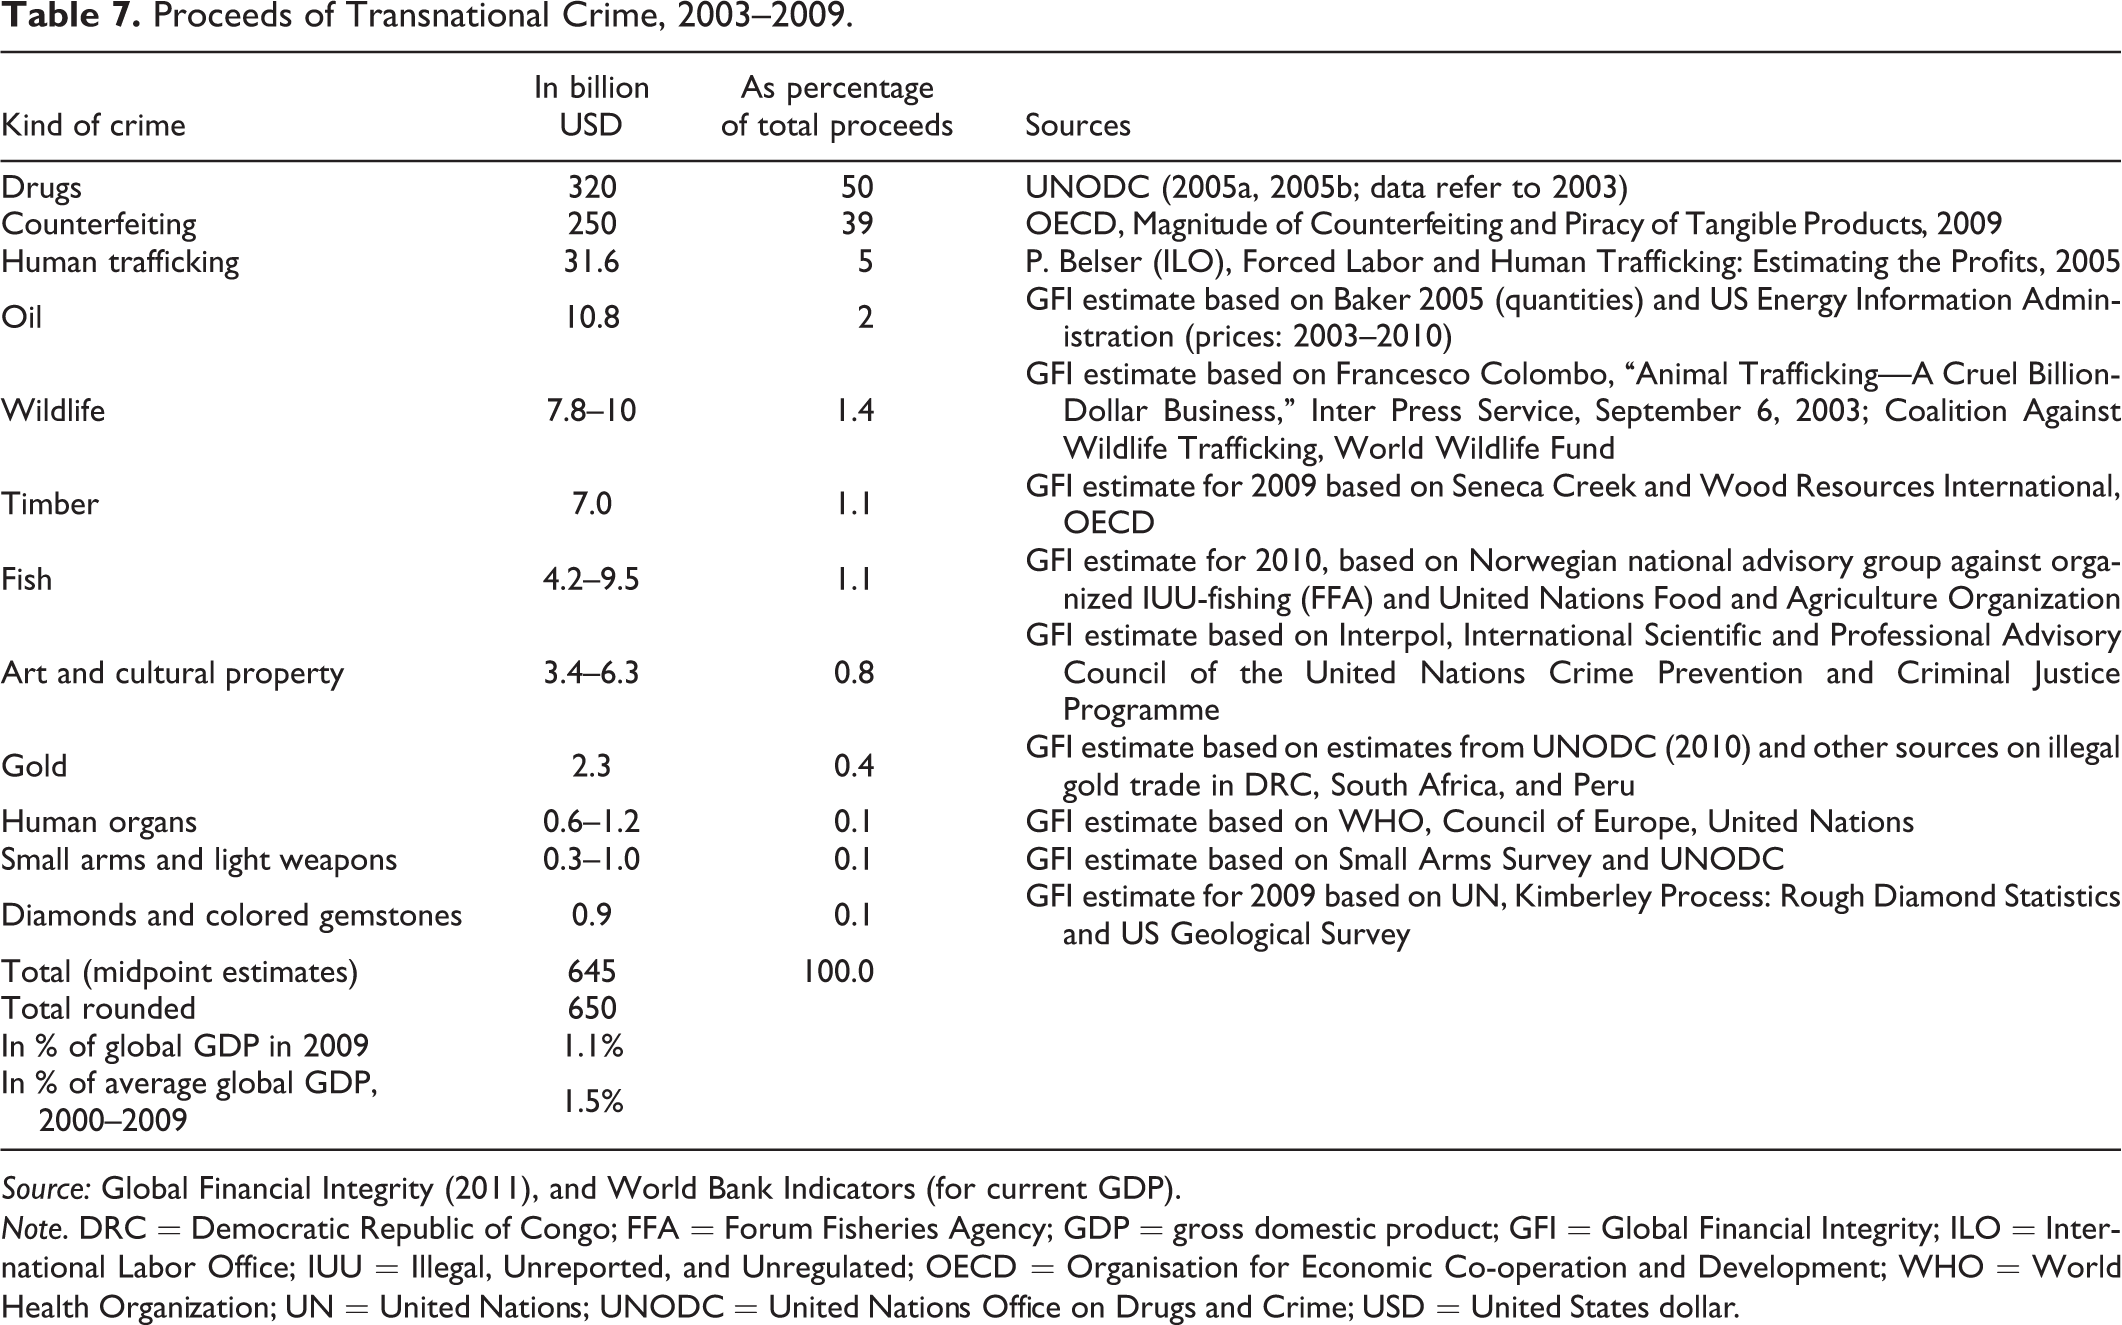
Source: Global Financial Integrity (2011), and World Bank Indicators (for current GDP).
Note. DRC = Democratic Republic of Congo; FFA = Forum Fisheries Agency; GDP = gross domestic product; GFI = Global Financial Integrity; ILO = International Labor Office; IUU = Illegal, Unreported, and Unregulated; OECD = Organisation for Economic Co-operation and Development; WHO = World Health Organization; UN = United Nations; UNODC = United Nations Office on Drugs and Crime; USD = United States dollar.
Finally, table 8 presents estimates of worldwide turnover of organized crime in trillion USD. These estimates clearly show a huge range, and it is left to the reader to make his or her own evaluation and judgment of plausibility. A median of all estimates is 1.9 trillion USD for the year 2009, and the average is 2.1 trillion USD in 2009 or 3.6 percent of world GDP. The confidence interval lies between 1.6 and 2.6 trillion USD, or 2.7 percent to 4.4 percent. In general, we see that we have a huge variation, and all figures should be handled with great care.
Estimates of Worldwide Turnover of Organized Crime.

Note. GDP = gross domestic product; UN = United nations; USD = United States dollar.
aThis is a tentative estimate, assuming that Schneider’s proportion of turnover of organized crime expressed as a percentage of GDP remained unchanged over 2006–2009 period. bThis estimate is extrapolated to global GDP in 2009.
National Crime Proceeds and Money Laundering
In table 9, the estimated earnings from criminal activities are shown for the United States over the period 1965–2010. We have here two series: estimated criminal income including financial and tax fraud proceeds and estimated criminal income excluding financial and tax fraud proceeds. In absolute figures, there is a strong increase from 49 billion USD in 1965 to 1,043 billion USD in 2010. If we standardize these figures in percentage of GDP, we have a modest increase up to the year 2000; it was 6.8 percent in 1965 and 8.0 percent in 2000, then it decreased to 7.0 percent in 2010. If we consider the ratio of criminal income in percentage of total illicit income (criminal plus financial and tax fraud income), we see that classical criminal income ranges between 29.0 percent in 2000 and a maximum of 49.0 percent in 1985. This clearly shows that financial and tax fraud is again by far the largest crime figure in the United States. 5
Estimated Earnings from Criminal Activity in the United States, 1965–2010.a
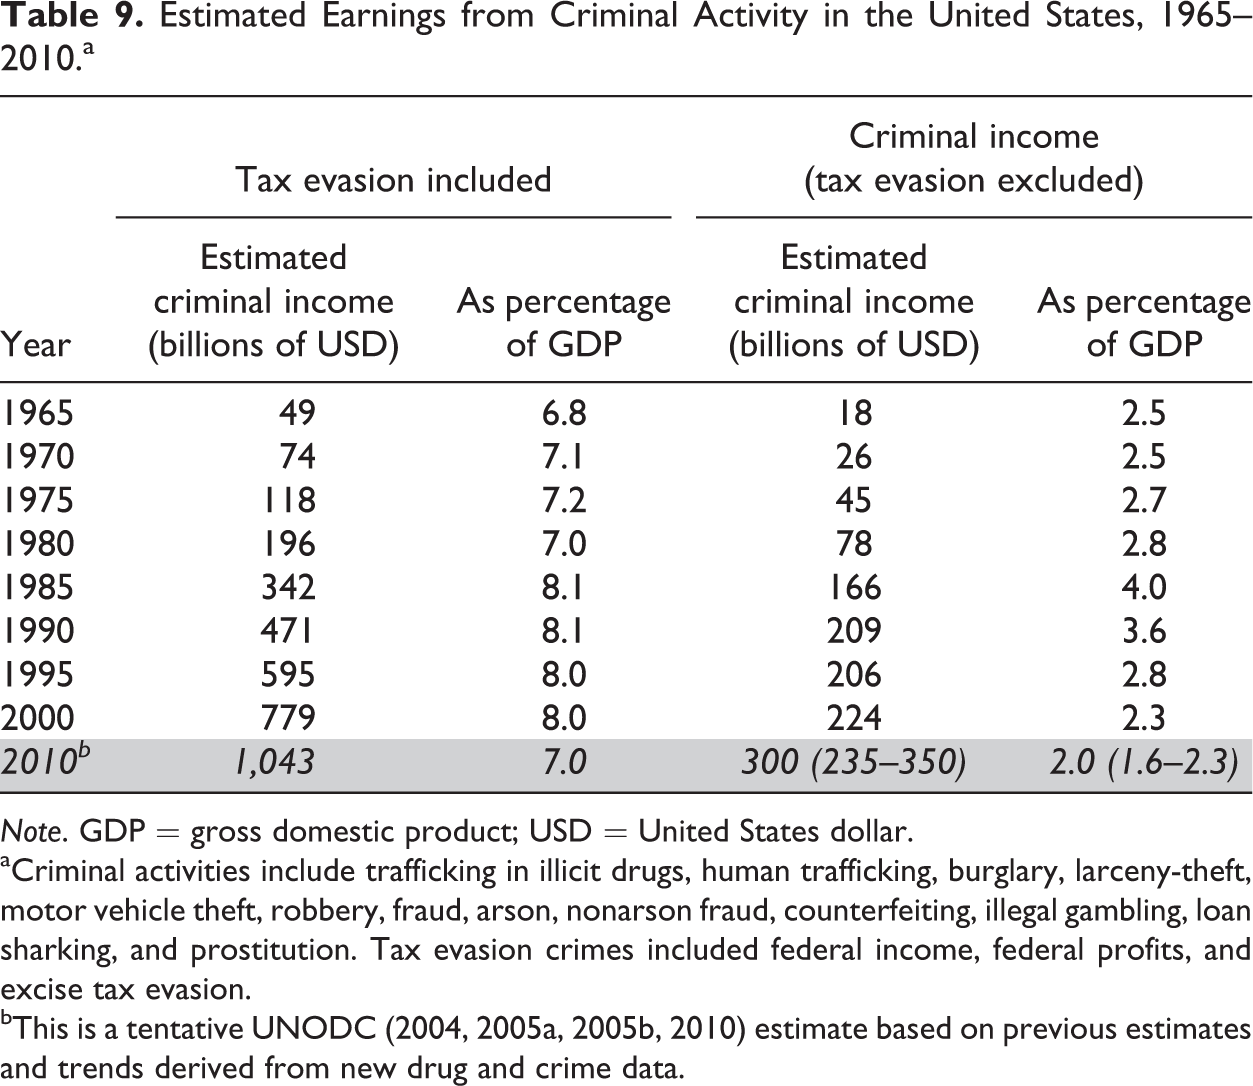
Note. GDP = gross domestic product; USD = United States dollar.
aCriminal activities include trafficking in illicit drugs, human trafficking, burglary, larceny-theft, motor vehicle theft, robbery, fraud, arson, nonarson fraud, counterfeiting, illegal gambling, loan sharking, and prostitution. Tax evasion crimes included federal income, federal profits, and excise tax evasion. bThis is a tentative UNODC (2004, 2005a, 2005b, 2010) estimate based on previous estimates and trends derived from new drug and crime data.
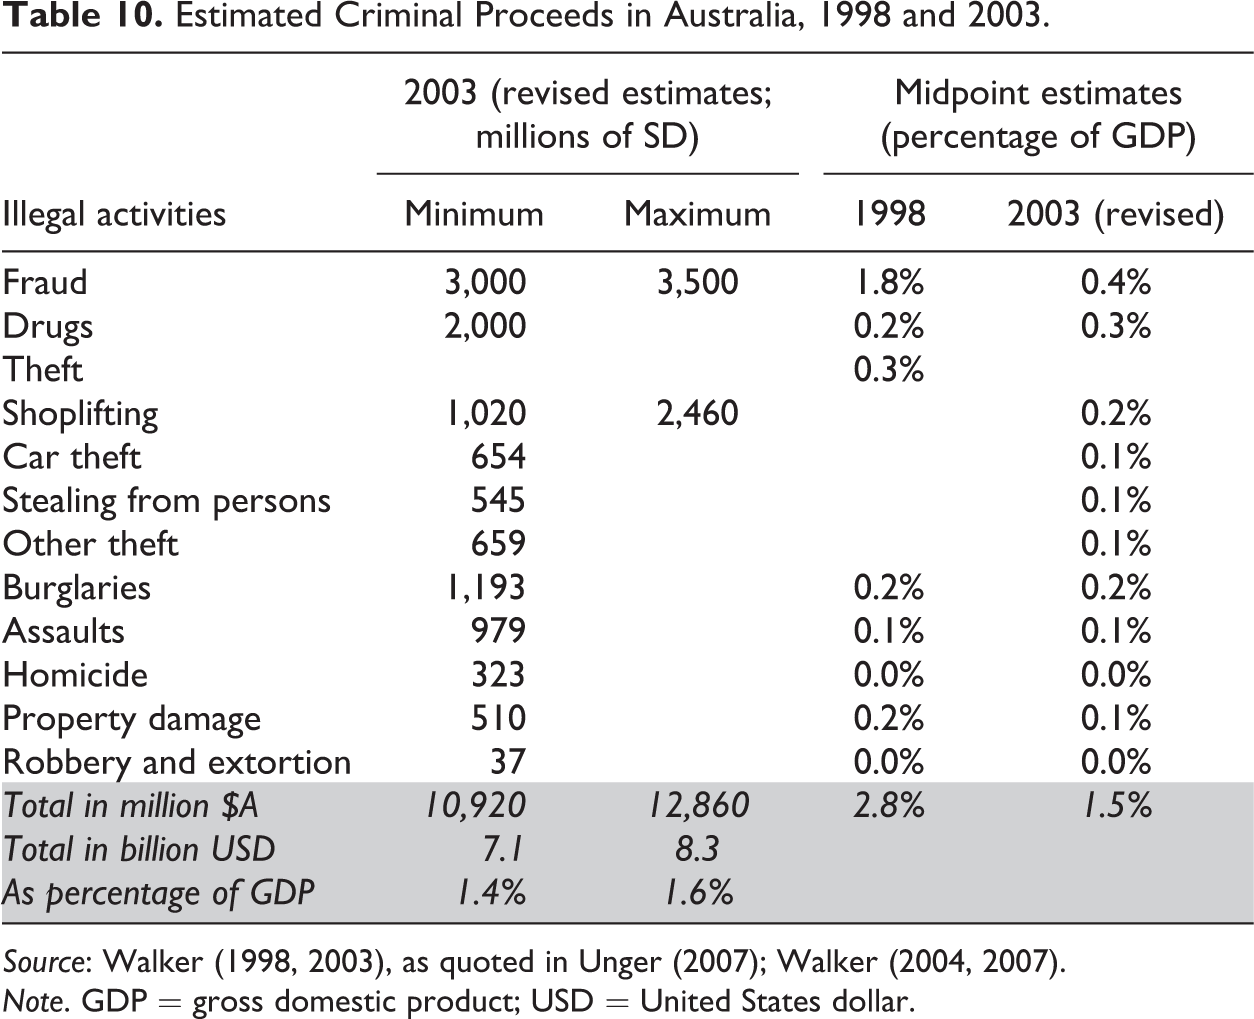
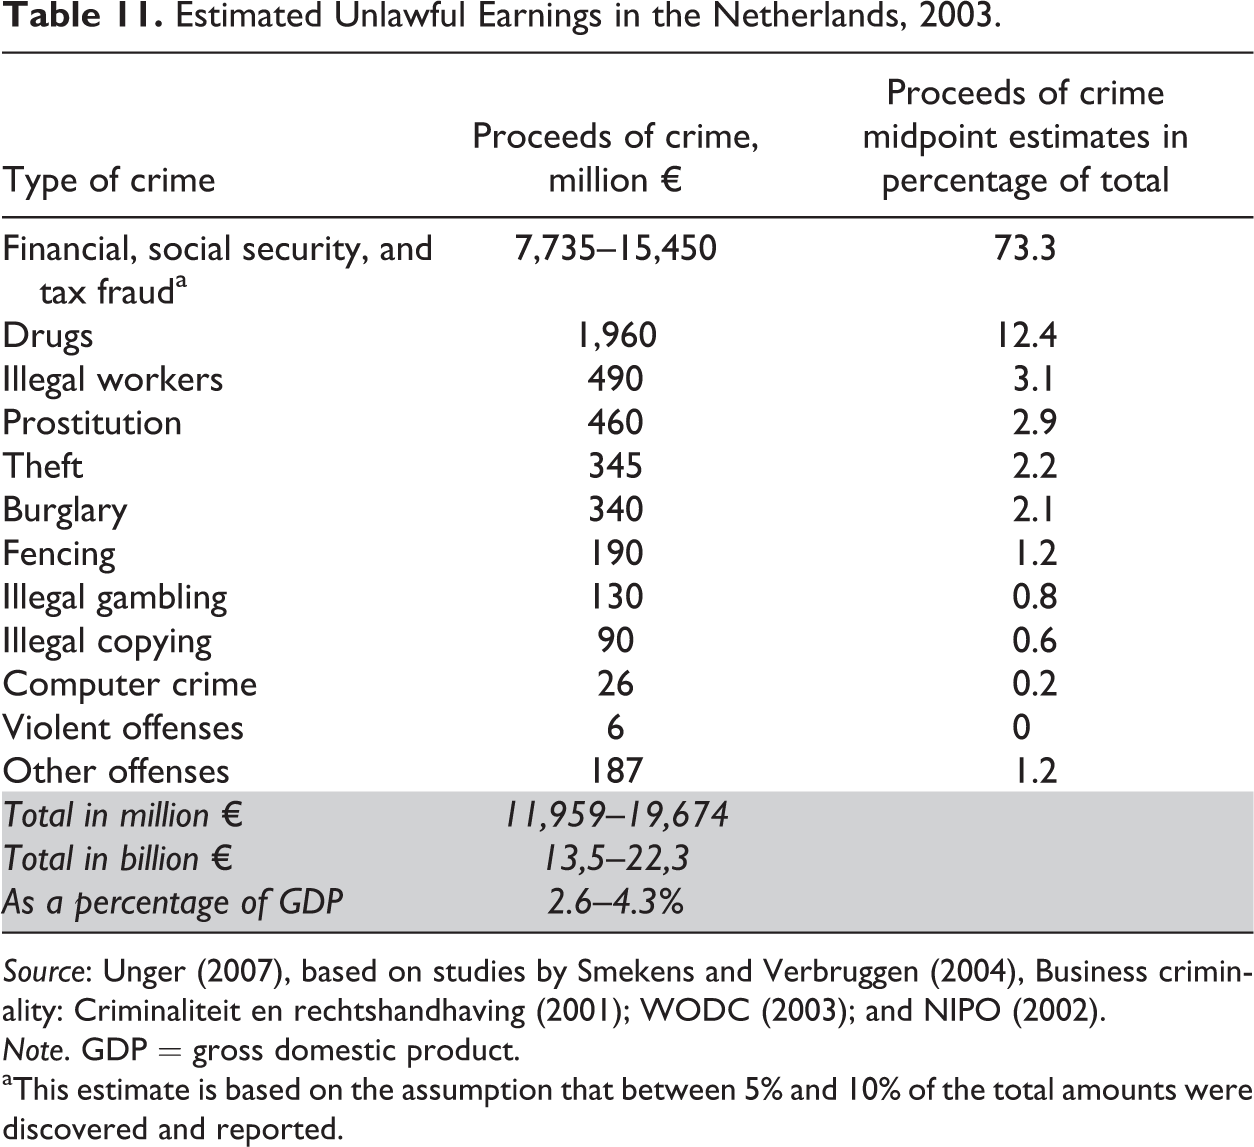
In table 10, figures for Australia are shown. Here, we clearly see that fraud, drugs, and shop lifting are the three biggest types of crime. In total, the criminal proceeds in Australia reached 10.9 billion Australian dollars or 7.1 billion USD, and they are in a range between 1.5 percent and 2.8 percent of Australian GDP. Table 11 shows the crime proceeds for the Netherlands. Again, we have the remarkable result that 73.0 percent of all crime proceeds come from financial, social security, and tax fraud, followed by drugs with 12.4 percent and illegal workers with 3.1 percent. In the Netherlands, between 11.0 and 19.0 billion euros are the range of the crime proceeds, which amounts to between 2.6 percent and 4.3 percent of official GDP.
Estimated Criminal Proceeds in Australia, 1998 and 2003.
Source: Walker (1998, 2003), as quoted in Unger (2007); Walker (2004, 2007).
Note. GDP = gross domestic product; USD = United States dollar.
Estimated Unlawful Earnings in the Netherlands, 2003.
Source: Unger (2007), based on studies by Smekens and Verbruggen (2004), Business criminality: Criminaliteit en rechtshandhaving (2001); WODC (2003); and NIPO (2002).
Note. GDP = gross domestic product.
aThis estimate is based on the assumption that between 5% and 10% of the total amounts were discovered and reported.
Finally, table 12 presents the crime proceeds of Italy. Crime proceeds from drugs are by far the largest with 60.0 billion euros, followed by ecomafia/agromafia with 16.0 billion euros and loan sharking with 15.0 billion euros. Total income of crime proceeds is 135.0 billion euros or 8.9 percent of the Italian GDP.
Estimates of the Income and Profits of Organized Crime in Italy, 2009.

Source: SOS Impresa (2010).
Note. GDP = gross domestic product; USD = United States dollar.
Money Laundering—Some Methodical Remarks
Laundering “crime” money has the purpose to make dirty money appear legal (Walker 1999, 2000, 2004, 2007). 6 There are many methods of money laundering. Table 13 presents the twelve most common methods (Unger 2007; Walker 2007). Which of these methods is chosen depends on the type of crime activity and on the specific institutional arrangements in a country where the criminal money is “earned.” For example, in the drug business, method 8 (business ownership) is quite often used. 7 In the drug business and in big cities, smaller amounts of cash are earned by drug dealers in many different cash-intensive places such as restaurants, which are especially well suited for money laundering purposes.
The Methods of Money Launderin.a

Source: Unger (2007).
With the help of the Multiple Indicators Multiple Causes estimation procedure, Schneider (2008a, 2008b) and Buehn and Schneider (2013, in press) estimate that money laundering and/or financial turnover from transnational crime has increased from 1995 USD 273 billion (1.33 percent of the total official GDP) to USD 603 billion (or 1.74 percent of the official GDP) in 2006 for twenty Organisation for Economic Co-operation and Development countries (Australia, Austria, Belgium, Canada, Denmark, Germany, Finland, France, Greece, Great Britain, Ireland, Italy, Japan, the Netherlands, New Zealand, Norway, Portugal, Switzerland, Spain, and the United States). These figures show a steady increase in the volume of laundered money over 1995–2006. 8
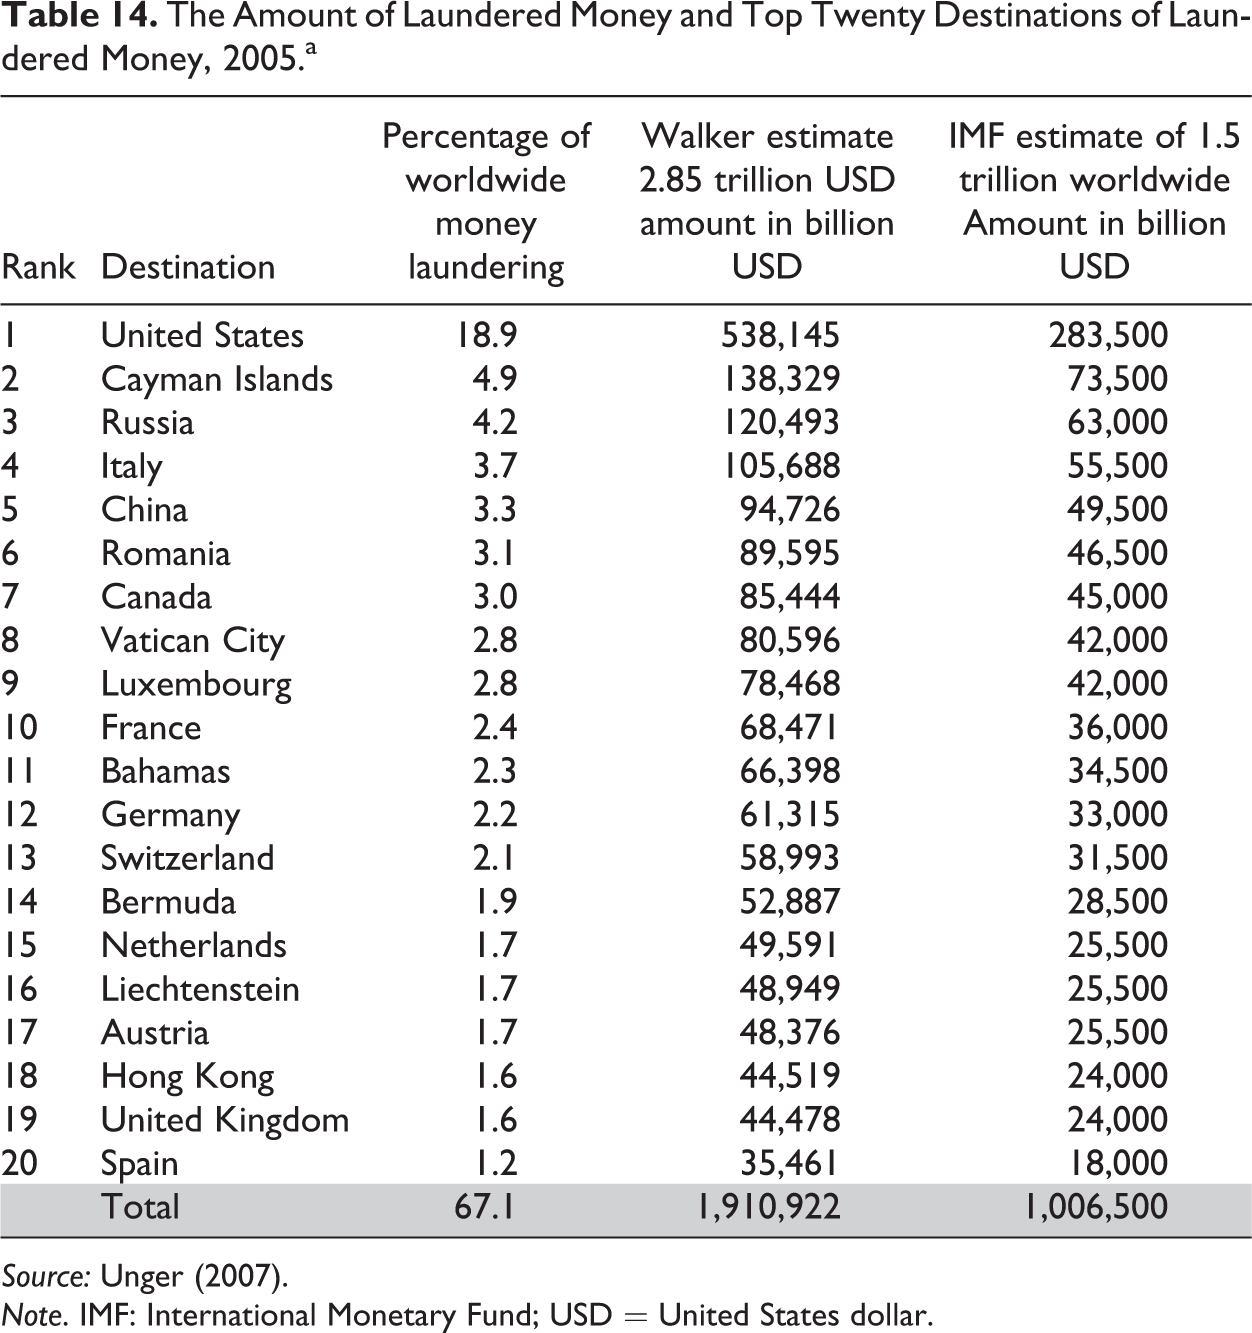
Unger (2007) estimates the amount of laundered money and its top twenty destination countries (table 15). Two estimates for the year 2005 are presented, one by Walker (1999, 2007) and one by the IMF. The Walker figure of 2.850 billion USD is much larger than the IMF figure of 1.500 billion USD. Walker’s figures have been criticized as much too high, which was one reason why the IMF estimates are also shown. Table 15 clearly demonstrates that two-thirds of worldwide money laundering was sent to the top twenty countries listed. One should realize that most of these countries are highly developed and have quite sizable legal/official economies. What is also amazing is that there are only a few small countries and/or offshore countries and tax heavens among them (Cayman Islands, Vatican City, Bermuda, and Liechtenstein). 9 The majority of countries that attract money laundering flows are economically “big” players. The United States has the largest worldwide share of money laundering (almost 19 percent), followed by the Cayman Islands (4.9 percent), Russia (4.2 percent), and Italy (3.7 percent); smaller countries like Switzerland (2.1 percent of worldwide money laundering), Liechtenstein (1.7 percent), and Austria (1.7 percent) are attractive. If one takes the lower IMF value for Austria, Switzerland, and the United Kingdom, roughly 5.5 percent of the total amount is laundered, which comes close to roughly 10 percent of official GDP of these three countries. However, it needs to be emphasized that it is not clear whether this money is “only” laundered in these countries or remains in these countries; it may well leave these countries after the laundering process. In general, table 15 demonstrates how substantial the amount of laundered money is and that two-thirds of these funds are concentrated in only twenty countries.
The Amount of Laundered Money and Top Twenty Destinations of Laundered Money, 2005.a
Source: Unger (2007).
Note. IMF: International Monetary Fund; USD = United States dollar.
Estimates of the Various Cost Components (Partly Proceeds) of Cybercrime.

Source: Anderson et al. (2012, 24).
Note. Estimating costs and scaling: figures in boldface are estimates based on data or assumption for the reference area. Unless both figures in a row are boldface, the nonboldface figure has been scaled using the UK share of world GDP unless otherwise stated in the main text. Extrapolations from UK numbers to the global scale should be interpreted with utmost caution. A threshold to enter this table is defined at $10 m for the global estimates.
Legend: x: included; (x): partly converted; with qualifiers x for likely overestimated, x for likely underestimated, and x? for high uncertainty.
Bagella, Busato, and Argentiero (2009) use a two-sector dynamic general equilibrium model to measure money laundering for the United States and the EU-15 macro areas over the sample 2000:01–2007:01 on a quarterly data basis. Their series is generated through a fully microfounded dynamic model, which is appropriately calibrated to replicate selected stochastic properties of the two economies. Their model (and the analysis) has a short-run perspective. Bagella, Busato, and Argentiero (2009) find several main results. First, money laundering accounts for approximately 19 percent of the GDP measured for the EU-15, while it accounts for 13 percent in the US economy, over the sample 2000:01–2007:04. Second, the simulated money laundering appears less volatile than the corresponding GDP. Third, as regards the EU-15 macro area, the simulated statistics suggest that money laundering volatility is one-third of the GDP volatility. Fourth, for the US economy, the same statistics produce a figure of two-fifths. Considering these estimates, I must admit that they are quite high, and I have some doubts about their plausibility.
In their latest study, Walker and Unger (2009) again undertake an attempt to measure global money laundering and/or the proceeds from transnational crime that are pumped through the financial system worldwide. They criticize methods such as case studies, proxy variables, or models for measuring the crime economy, arguing that they all tend to overestimate money laundering. They present a gravity model that makes it possible to estimate the flows of illicit funds from and to each jurisdiction in the world. This “Walker Model” was first developed in 1994 and was recently updated. Walker and Unger (2009) show that their model belongs to the group of gravity models that have recently become popular in international trade theory. They demonstrate that the original Walker Model estimates are compatible with recent findings on money laundering.
Once the scale of money laundering is known, its macroeconomic effects and the impact of crime prevention, regulation and law enforcement effects on money laundering, and transnational crime can also be measured. Walker and Unger (2009) conclude that their model still seems to be the most reliable and robust method to estimate global money laundering, and thereby the important effects of transnational crime on economic, social, and political institutions. Rightly they argue that the attractiveness of the distance indicator in the Walker Model is a first approximation, but is still not theoretically satisfactory. A better micro foundation for the Walker Model will be needed. A micro foundation means that the behavior of money launderers is analyzed, in particular what makes them send their money to a specific country. Hence, Walker and Unger (2009) argue that an economics of crime micro foundation for the Walker Model would mean that, similar to international trade theory, behavioral assumptions about money launderers have to be made. Their gravity model can be seen as a reduced form or outcome of a rational calculus of sending the money to a certain country and potentially making large profits.
Using their model in table 14, the amount of laundered money and the top (“most” attractive) twenty destinations of laundered money are shown for 2005. The United States ranks number one, followed by the Cayman Islands and Russia. With 18.9 percent of worldwide money laundering, the United States has by far the biggest share, followed by the Cayman Islands with 4.9 percent.
Cost and Proceeds of Cybercrime—The Latest Development in TOC
According to Anderson et al. (2012), in the last ten to fifteen years cybercrime arose from white-collar crimes. In the year 2007, the European Commission defined cybercrime as including traditional forms of crime such as fraud or forgery, though committed over electronic communication, networks, and information systems; the publication of illegal content over electronic media; and crimes unique to electronic networks. 10
Today, cybercrime takes many forms, like online banking fraud (phishing), fake antivirus, computer programs, fake errors cam, and other variants. In a first systematic article, Anderson et al. (2012) try to give a survey in measuring the cost of cybercrime and/or the criminal proceeds from some types of cybercrime. 11 Cybercrime is a rather new development and is certainly becoming more and more important.
What types of cybercrime costs can one observe? Anderson et al. (2012) state the following four types:
Costs in anticipation of cybercrime, such as antivirus software, insurance, and compliance; Costs as a consequence of cybercrime, such as direct losses and indirect costs, such as weakened competitiveness as a result of intellectual property compromise; Costs in response to cybercrime, such as compensation payments to victims and fines paid to regulatory bodies; and Indirect costs such as reputational damage to firms, loss of confidence in cyber transactions by individuals and businesses, reduced public-sector revenues, and the growth of the underground economy.
These types of costs are shown in figure 1, where Anderson et al. (2012) try to analyze the costs of cybercrime and also some criminal revenues. From Figure 1, one clearly sees that criminal revenues or criminal proceeds, my main topic in this article, can be derived from the direct losses of cybercrime, where we have also defense costs and indirect costs. Direct losses (or proceeds of national or transnational criminal activities) include money withdrawn from victim accounts, stolen software, and faked financial transactions.
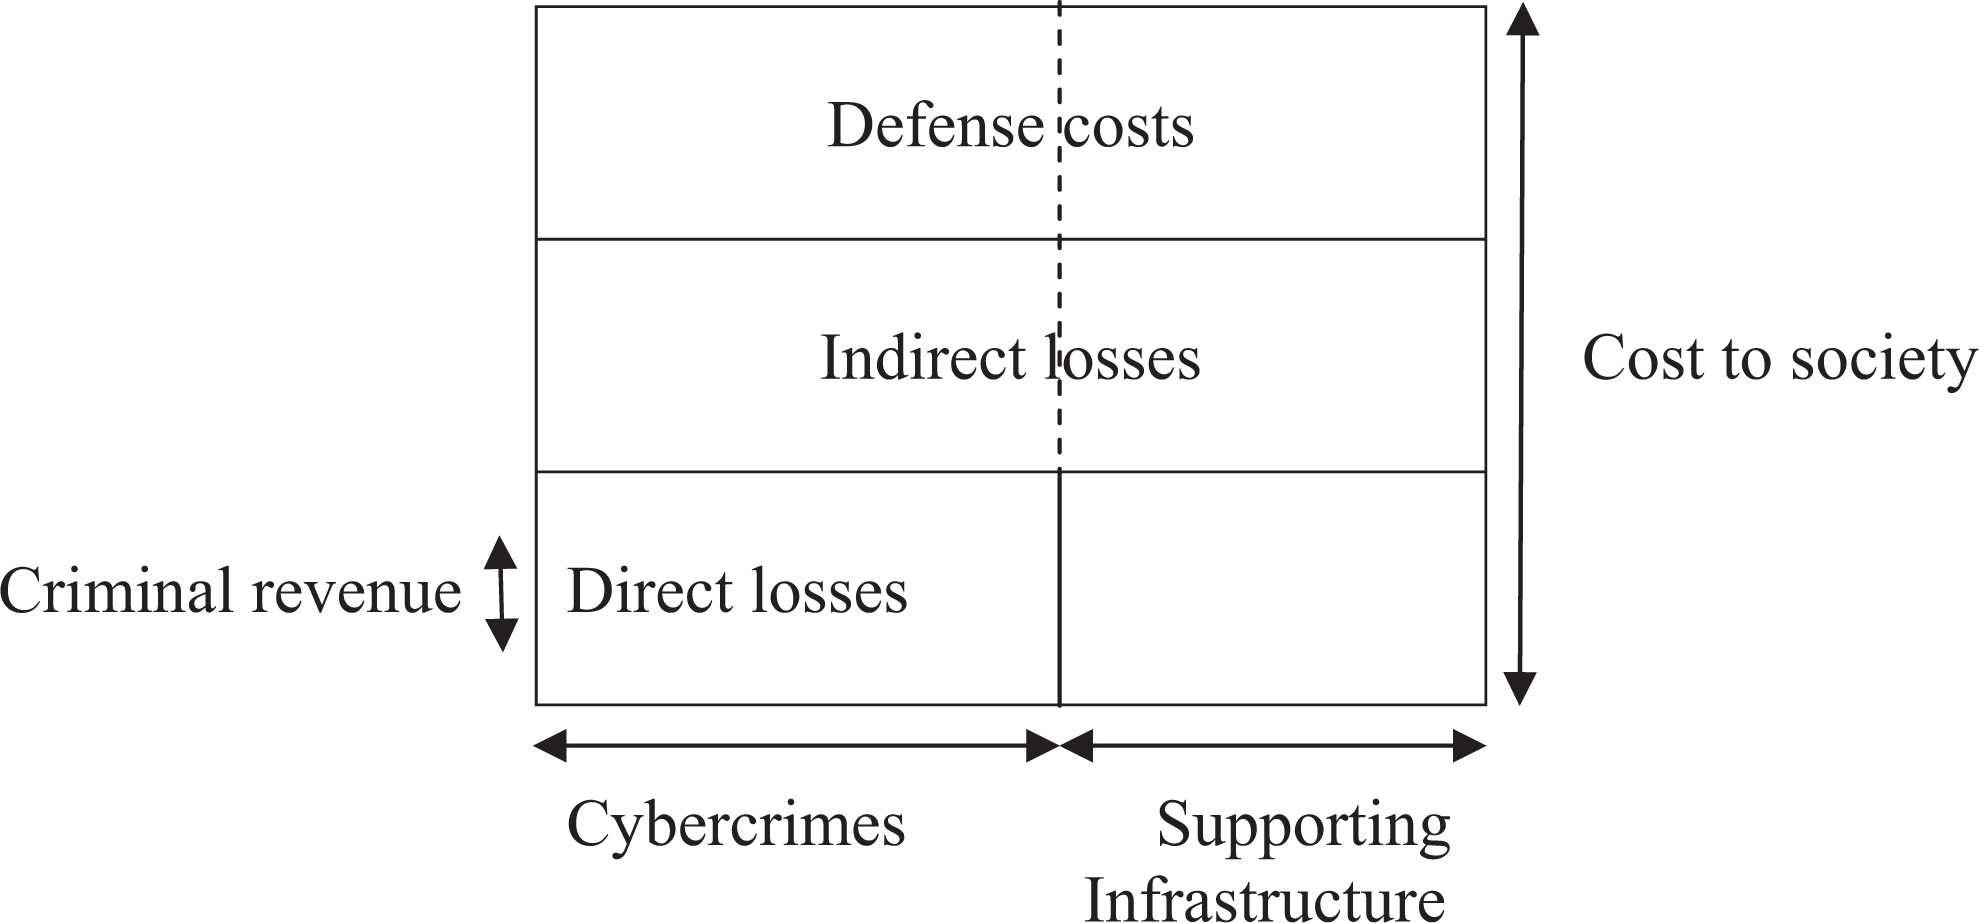
Framework for analyzing the costs of cybercrime.
What do we know about the costs (and partly proceeds of criminal activities) in the cybercrime area? Anderson et al. (2012) provide some first estimates of these costs (and partly proceeds) of the category of cybercrime. 12
Considering the four cost components (cost of genuine cybercrime, cost of transitional cybercrime, cost of cybercriminal infrastructure, and cost of traditional crimes becoming “cyber”), one clearly realizes that number 4, “Cost of crime against public institutions (welfare tax fraud)” becoming “cyber,” is by far the largest part, covering 67.5 percent of all costs of cybercrime, which amount to a sum of 222.697 billion USD on a global estimate. If we further turn to the global estimate, we see the cost of “genuine cybercrime” on a worldwide basis is 3.457 billion USD or 1.6 percent of the total cost of cybercrime. The 3.457 billion USD can also be seen as the large part of the proceeds of genuine cybercrime activities. If we consider number 2, “Cost of transitional cybercrime,” we see that it amounts to 44.2 billion USD or 20.8 percent of the total cost of cybercrime. With 24.8 billion USD, the cost of cybercriminal infrastructure is quite sizable, and amounts to 11.2 percent of the total cost. As already said, the costs of traditional crimes becoming cyber are with 150.200 billion USD, the largest part of the cost of cybercrime. In general, table 16 clearly shows that the cost and proceeds of cybercrime activities are sizable. In the future, they will certainly rise because the use of electronic networks for crime activities is becoming more and more attractive.
Estimates of the Amount of Informal Money Flows through Hawala Banking.

Note. IMF: International Monetary Fund; USD = United States dollar.
The Infiltration of Transnational Crime Organizations and the Informal Money Banking (Hawala) System
Obviously, transnational crime organizations prefer to use an informal banking system, in order to make it more difficult for the state authorities to detect these activities. The most famous and oldest informal banking system is the Hawala banking system, which is analyzed in the The Informal Money Banking (Hawala) System subsection after a short introduction of the kinds of infiltration in which organized crime organizations are involved.
The Infiltration of Transnational Crime
In figure 2, the various channels of the infiltration of the transnational crime groups are summarized. Figure 2 concentrates on the use of financial resources and clearly demonstrates that the financial means/flows stand on six pillars ranking from legal investments to classical criminal activities.
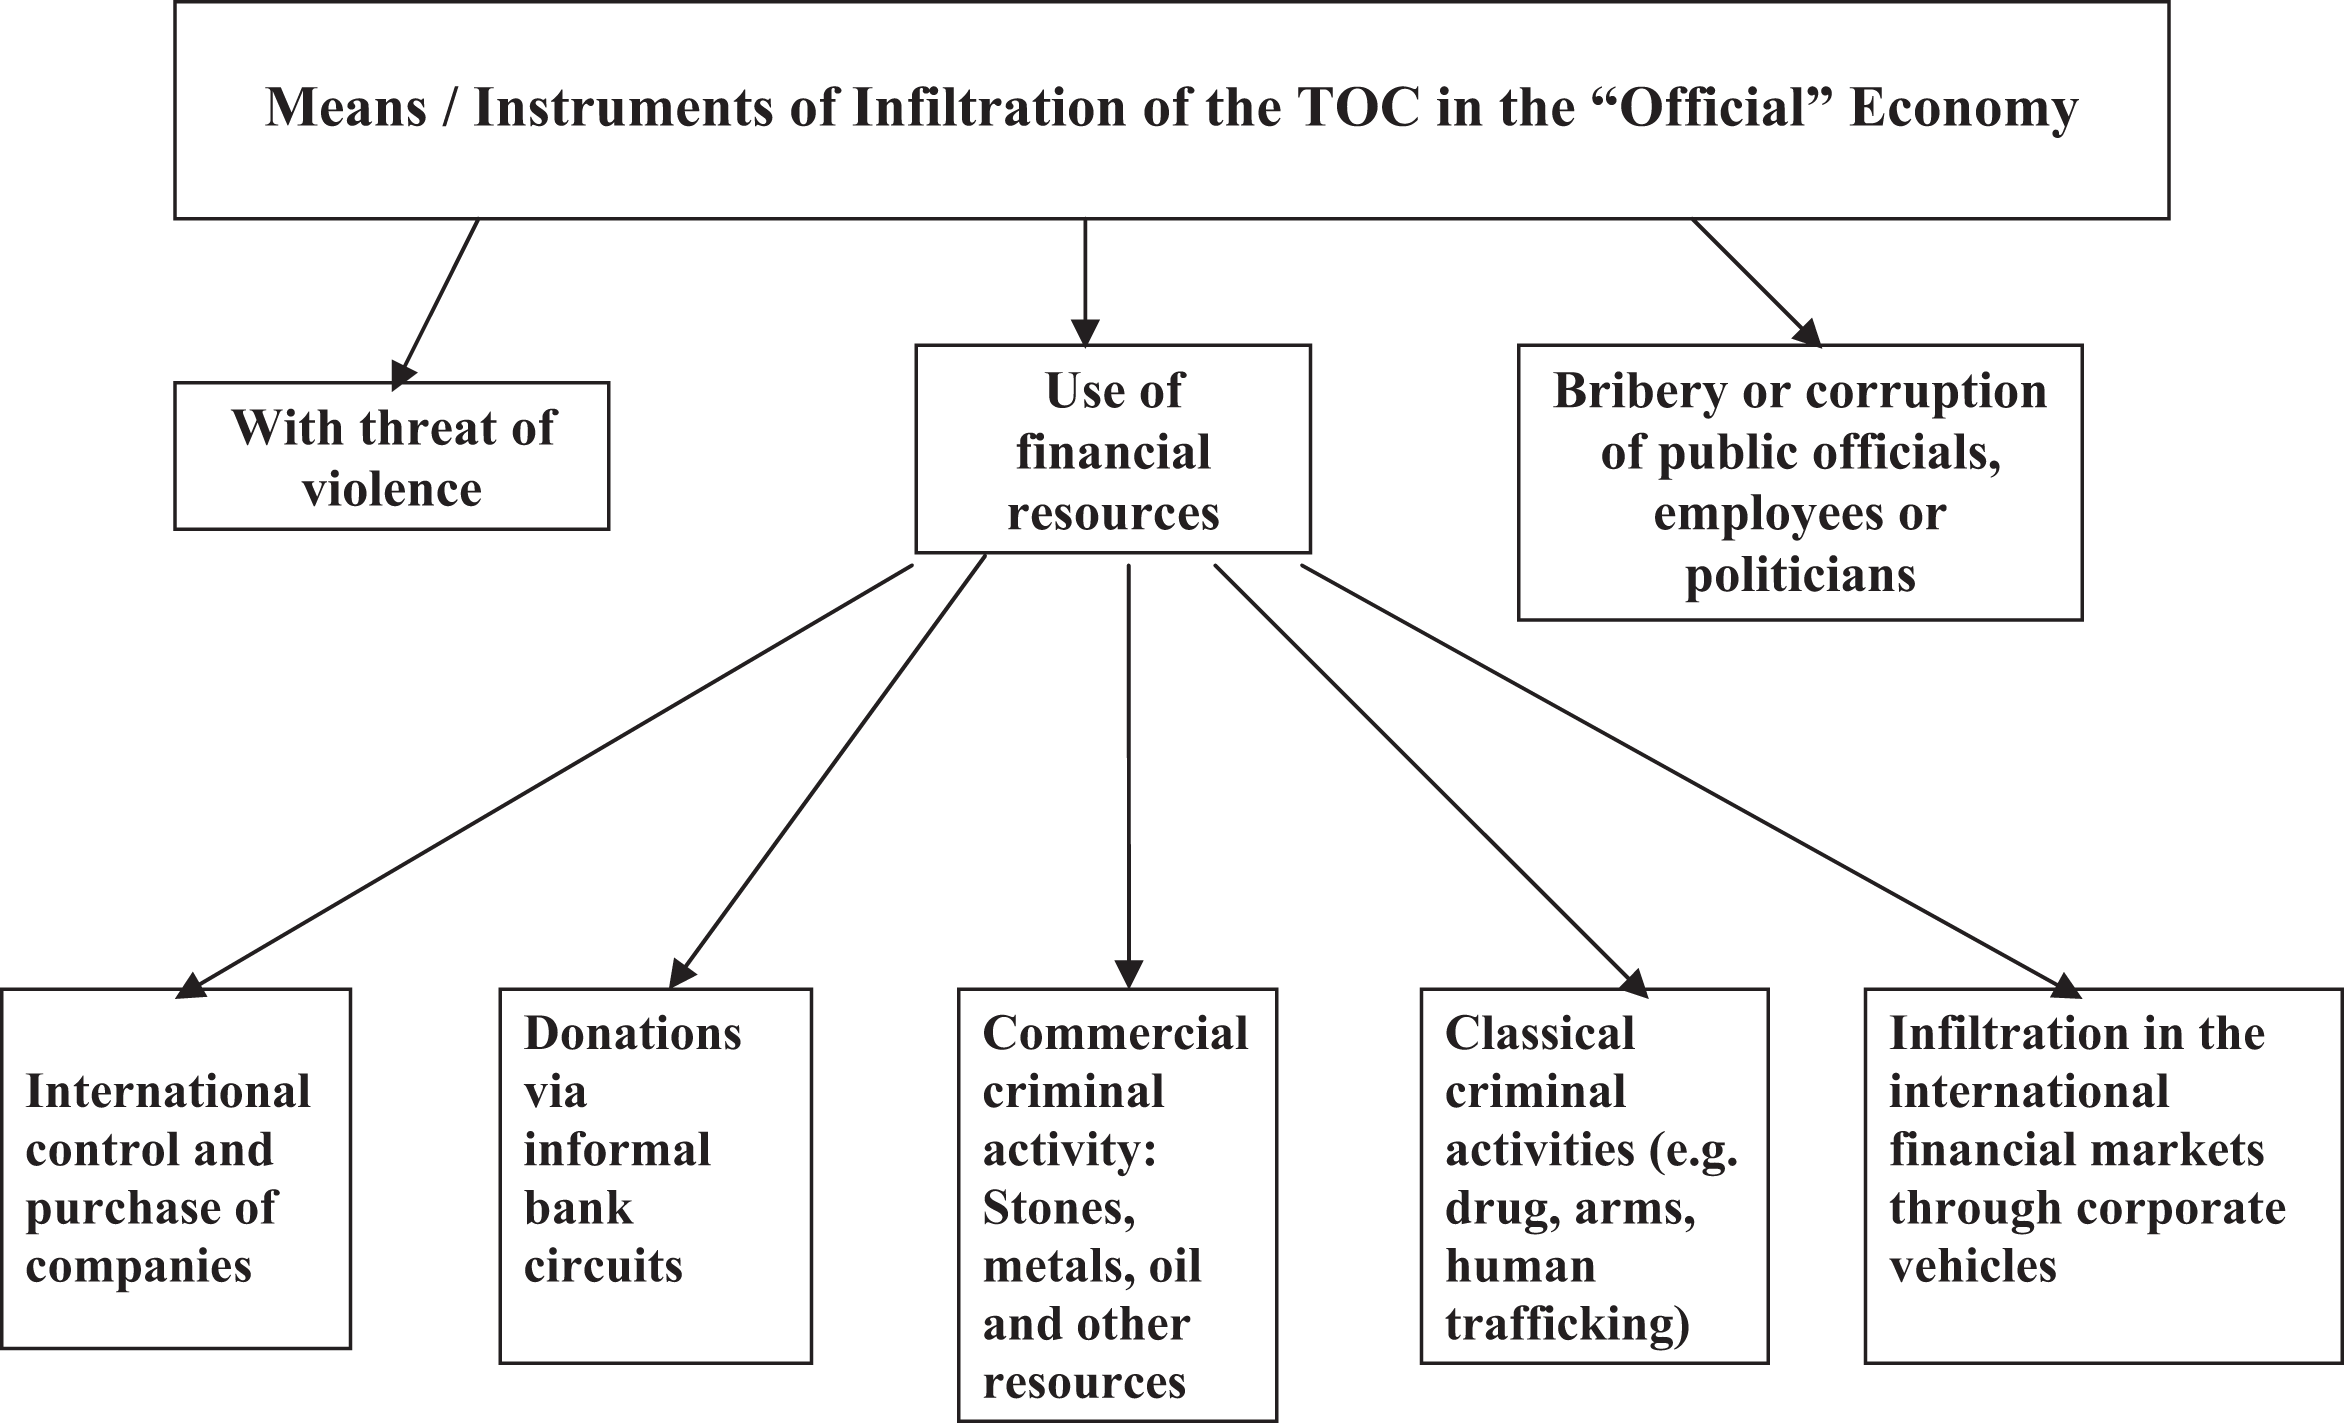
Infiltration of the legal economy by transnational organized crime.
The Informal Money Banking (Hawala) System
During the 1990s, international concern grew over the so-called underground banking and its abuse by criminal offenders. Some studies (e.g., Williams 2007; Savona and ISPAC [Organization], 1997; El-Quorchi, Munzele Maimbo, and Wilson 2003) have explained how informal systems operate, including their risks. The Informal Value Transfer Systems change from region to region (Hawala or door-to-door banking). Williams (2007) and El-Quorchi, Munzele Maimbo, and Wilson (2003) argue that Hawala is vulnerable to criminal abuse, and like the other financial institutions, there is evidence that money derived from drug trafficking, illegal arms sales, body part trade, corruption, tax evasion, and all kinds of fraud have indeed moved through Hawala networks.
Hawala banking still takes place, and some authors analyze (Perkel 2004; Bunt 2007). These authors point to the need for a regulation of the Hawala banking system, because it can be another way to transfer criminal financial flows. According to Bunt (2007), Hawala bankers are financial service providers who carry out financial transactions without a license and therefore without any government control. 13,14 They accept cash, checks, or other valuable goods (diamonds and gold) at one location and pay a corresponding sum in cash or other remuneration at another location. Unlike official banks, Hawala bankers disregard the legal obligations concerning the identification of clients, record keeping, and the disclosure of unusual transactions, to which these official financial institutions are subject.
To repeat, through this system, Hawala bankers ensure the transfer of money without having to move it physically or electronically. When a payment needs to be made overseas, the underground banker will get in touch with a courier (or more recently using e-mail, fax, or phone) in that country informing him of the details of making the payment. If the recipient of the payment wishes to personally obtain the money, a code referring to the underground banker in the country of payment is given to the recipient. Such a system is almost untraceable since it leaves little if any paper trail. Transaction records are being kept only until the money is delivered, at which time they are destroyed. Even when there is a paper or an electronic record of the transaction it is often in dialects and languages that serve as a de facto encryption system. 15
In table 16, some guess estimates or estimates of Hawala banking turnover or proceeds are shown. On a global scale, Page and Plaza (2006) estimate 57.53 billion USD as the amount of informal money flows used by Hawala banking for the year 2004. The country sums are much smaller with the exception of the study by Fischer (2002), where he comes up with an estimated amount of informal money flows of Hawala banking for Saudi Arabia of 40 billion USD per year. Countries like Pakistan or Afghanistan range between 2.5 and 3.0 billion USD per year. Table 16 should be seen as a first attempt to come up with some ideas of the relative size of the estimated amount of informal money flows via Hawala banking.
According to Bunt (2007), there are two different views about Hawala banking. In the first point of view, Hawala banking is regarded as a centuries-old institution that has not yet outlived its usefulness. Low-income workers and migrant workers in particular supposedly put more trust in Hawala bankers than in formal banks. This viewpoint emphasizes the problem associated with subjecting Hawala banking to the same rules as formal banks. Regulation either through registration or licensing is seen as ineffective because it will simply push the system further into the underground, further complicating the already problematic task of controlling Hawala transactions (Razavy 2005; Perkel 2004). Hence, Hawala banking might be the closest thing of a free market banking, without government regulation and it functioned well for centuries. One should clearly emphasize these advantages of Hawala banking when criticizing it.
From the second and opposite point of view, Bunt (2007) argues that Hawala banking is described as “underground banking,” a system that flies under the radar of modern supervision of financial transactions. Underground banking can be considered a threat to the effectiveness of antimoney laundering measures and the fight against terrorist financing. To prevent underground bankers from becoming a safe haven for criminals and terrorists, they should be subject to the standard regulations regarding record keeping, disclosure of unusual transactions, and identification of clients. 16
Summary and Conclusions
This article reviews the literature of the finances of TOC with a focus on estimations of the volume of the finances of transnational crime. I come to the following preliminary findings.
The necessity of money laundering is obvious as a great number of illegal (criminal) transactions are done by cash. Hence, this amount of cash from criminal activities must be laundered in order to have some “legal” profit, to do some investment or consumption in the legal world. Further, to get an estimate of the extent and development of the amount of the financial means of transnational crime over time is even more difficult. On a worldwide basis, in 2009, 1.4 trillion USD (or 2.5 percent of world GDP) are estimated to be laundered coming from all types of crime (IMF 2010). These figures are very preliminary with a quite large margin of error but give a clear indication how important money laundering and the turnover of transnational crime nowadays is. Finally, tax fraud and/or illegal cross-border capital flows are by far the biggest/highest share of all illegal transactions; quite often 66 percent of all illegal capital flows/proceeds.
From these preliminary results, I draw four conclusions. First, the revenues of transnational crime are extremely difficult to estimate. They are defined differently in almost every country, the measures taken against them are different and vary from country to country, and it is not at all clear which part of these revenues from transnational crime stays in a country with the consequence of a severe double counting problem. 17 Second, fighting transnational crime is very difficult, as there are no efficient and powerful international organizations that can effectively do this job. 18 Third, tax fraud and/or other illegal cross-border capital flows should be the prime target for governments to reduce them; that is, a rigorous fight against tax heavens should have the highest priority. Fourth, this article should be seen as a first start/attempt in order to shed some light on the gray area of the magnitude of proceeds of tax fraud and of transnational crime.
Footnotes
Declaration of Conflicting Interests
The author(s) declared no potential conflicts of interest with respect to the research, authorship, and/or publication of this article.
Funding
The author(s) received no financial support for the research, authorship, and/or publication of this article.
Notes
Author Biography