



Abstract
Capitalization of the property tax is of particular interest in Norway since many local governments decide not to have a property tax. We apply a rich data set of housing transactions and characteristics for three years (1997–1999) and combine them with local government-level data about property taxation, local services, and community characteristics. The analysis of capitalization faces serious methodological challenges of endogeneity and background factors affecting housing prices and local fiscal decisions. We investigate the relationship between property tax and housing prices using a variety of econometric specifications and using instruments for property taxation. The results indicate that housing prices respond to property taxation and with full capitalization at realistic discount rates. High child care coverage also contributes to high housing prices. The existence of capitalization effects suggests that housing markets reflect local fiscal conditions and that residential mobility is of importance to understand local government resource use.
Capitalization represents a key economic adjustment mechanism of fiscal policy. The interest in the capitalization hypothesis is triggered by the fact that it can be given several economic interpretations. The degree of capitalization determines the incidence of the property tax. Full capitalization implies that current owners bear the entire burden of expected tax liabilities, whereas partial capitalization suggests that some of the burden is passed on to future owners. Capitalization is also considered as empirical support for the underlying mechanisms of the Tiebout (1956) model where competition and mobility between local governments lead to efficient resource allocation. The hypothesis of property tax capitalization was first developed and tested by Oates (1969).
The early studies are summarized by Yinger et al. (1988). Basically all studies in this early phase, most using data from the United States and Canada, conclude that property taxes have a negative effect on housing values. Estimates of the degree of capitalization vary widely, but most of them fall in the interval between 15 and 65 percent. A key issue has been the relationship between property taxes and public services. Palmon and Smith (1998) offer a survey and have applied data where there is little variation in service provision and where differences in property tax to a large extent are historically determined. They find support for full capitalization and conclude that housing market participants rationally discount properties burdened with higher taxes. More recent research has addressed methodological issues related to endogeneity and simultaneity as covered by overviews by Sirmas, Gatzlaff, and Macpherson (2008) and Hilber (2011).
The empirical literature on capitalization has contributed to broader discussions of public policy. Capitalization has distributional implications. With full capitalization, any increase in the property tax immediately shows up in the housing price and there is no way to escape them. The loss is equal to the full present value of the future flow of the increased tax. Also assessment reforms have immediate and large effects for housing values. Changes in assessment and tax rates create capital losses and gains that may be seen unfair with changing ownership. The rise in property taxation with higher school costs in the United States provoked the “property tax revolt”, best known with Proposition 13 in California (a proposition to hold down assessment). More specifically, the capitalization literature has influenced the understanding of housing market regulation. Hamilton (1975) emphasized the strength of the property tax as a benefit tax when combined with fiscal zoning.
The motivation to study property tax capitalization also includes the incentives for government behavior. The broad argument was developed by Brennan and Buchanan (1978, 1980) with the proposition that responsive tax bases may help limit the growth of the public sector in the case of Leviathan governments. Wallis, Sylla, and Lagler (1994) developed the “fiscal interest approach” further by combining tax policy and regulation. The basic idea is that public officials prefer policies that relax their budget constraint. Fischel (2001a, 2001b) introduces the concept of “homevoters”, or homeowners whose voting is guided by their concern for home values. To protect property values, homevoters will put great pressure on local governments to provide services efficiently. In Fischel’s view, the homevoter model strengthens the case for viewing the local property tax as a benefit tax. Dehring, Depken, and Ward (2008) present empirical evidence in support of the homevoter hypothesis.
Recent research has addressed the incentive effects of the property tax. Oates (2001) argues that the property tax is visible and transparent and therefore contributes to an awareness of the costs of local public programs. Glaeser (1996) and Hoxby (1999) are important contributions that explicitly model the relationship between property taxation and cost incentives. Borge and Rattsø (2008) find that property taxation is associated with lower costs of utility services in Norwegian local governments.
Our starting point is Norwegian studies that have shown how local fiscal conditions respond to incentive mechanisms addressed in the theoretical literature. Fiva and Rattsø (2007) analyze the choice of having property taxes and identify a spatial pattern consistent with tax competition. The importance of fiscal competition in Norway has previously been shown by Carlsen, Langset, and Rattsø (2005) in an analysis of the relationship between firm mobility and infrastructure fees. Local governments with high firm mobility have lower fee level. The capitalization effect is a possible mechanism explaining the incentive effects documented above and motivates this analysis. Carlsen (2005) examines the effects of local fiscal variables and local economic conditions on migration plans of Norwegian households. His analysis confirms the importance of local services for migration plans and opens up for the possibility of capitalization effect of the services. Related to this article and using the same housing data, Carlsen et al. (2009) offer a first analysis of capitalization using information from household surveys. Interviews about household satisfaction with local services are used to analyze the relationship between service satisfaction and housing prices. The article is a response to the literature struggling with input and output measures of services and shows that satisfaction is associated with housing prices. Fiva and Kirkebøen (2011) use housing data for the Oslo districts to analyze the capitalization of school quality with particular emphasis on the identification problem. The publication of school quality indicators is shown to influence housing prices in the short term. In this article, we offer a broad evaluation of capitalization of property taxation using data about all municipalities and a broad data set of housing transactions.
The analysis is motivated by renewed attention to property taxation as source of local government financing. The fact that many local governments do not have property tax makes the Norwegian case interesting. The property tax is an optional tax for the local governments. The analysis is made possible by a rich data set of housing transactions during the period 1997–1999 that can be combined with data about local government property taxation. The data cover all local governments with large variation in housing markets, fiscal situation and priority, and community characteristics. The variation in property taxation across local governments is substantial, while the time-series variation is limited. Since the statistical inference must be based on cross-sectional variation, there are serious methodological challenges of endogeneity and omitted background variables.
We investigate the relationship between property taxation and housing prices using a variety of econometric specifications and using instruments for property taxation. Many local services are standardized, but child care has large variation across municipalities. The results indicate that housing prices respond to property taxation and with full capitalization at realistic discount rates. Child care coverage also represents an important determinant of housing prices. The existence of capitalization effects suggests that housing markets reflect local fiscal conditions and that residential mobility is important in understanding local government resource use.
The next section addresses methodological challenges and research design and then data and econometric specifications are presented. After the discussion and interpretation of the results, we offer some concluding remarks.
Methodological Challenges and Research Design
The mechanics of capitalization can be understood in a simple framework of household mobility and housing market; see Brueckner (1982) for a standard setup. Households are assumed to have identical tastes, but different incomes. The stock of housing is given, and the housing value is entirely demand determined.
The individual household derives utility from housing services H, municipal services Q, amenities A, and a numeraire private good X; U = U(H, Q, A, X). In migration equilibrium, the household must obtain the (best) utility level of alternative locations corresponding to the income level Y,

Here R is the rent for housing H and the bid rent of the household can be defined as

The bid rent is increasing with higher housing services, municipal services, amenities, and income. The housing value V is the discounted presented value of the excess of the bid rent over the property tax payments T, here using discount rate r and assuming a long time horizon:

When the property tax payment is defined by an effective tax rate τ and the market value of housing,

The econometric analysis investigates the relationship between the market value of housing H, the property tax rate τ, the housing characteristics H, the local services Q, the local amenities A, and the private income level Y at the local government level (the interest rate is assumed constant):

Capitalization of property tax into property values means that varying property tax rates across municipalities is a source of differences in house prices. The idea is that mobility contributes to equalization of the after-tax unit price of housing. Consider two communities that are equal in all respects, except for the property tax rate. Households are only willing to buy a house in the high tax community if they are compensated by a lower housing price. Full capitalization means that the difference in housing prices equals the present value of anticipated differences in property tax.
The relationship between tax rate and housing value in equation (4) is nonlinear, and most of the empirical literature uses approximations. The technicalities are discussed by Yinger (2006). We follow the standard approach and estimate a linear approximation assuming that the interest rate is constant. The main shortcoming with this formulation is that the degree of capitalization will vary with housing value. The homogeneity of the housing standard in our data reduces this problem. For convenience, we use a semilog form and index for house h in local government i in year t:

where V is the measured market price of house transactions, τ is the property tax rate (see the following about the assumptions made), Q is a vector describing the provision of municipal services, H is a vector describing the standard of the house (e.g., size, number of baths), A is a vector of amenities (e.g., climate), and u an error term.
If the property tax is capitalized into property values, the coefficient β1 will be negative. The degree of capitalization depends both on the coefficient β1 and on the chosen discount rate. For a given discount rate, the degree of capitalization increases with the absolute value of β1 (the effect of the property tax rate on property values is larger). For a given β1, the degree of capitalization increases with the discount rate since the present value of future taxes is lower.
Oates (1969, 1973) recognized that local taxation must be seen in the context of financing local services. The estimation of the capitalization effect of property taxation alone can underestimate the true effect because service spending financed by the increased property tax may raise housing prices. Net capitalization effect of property taxes must take into account the expansion of services financed by the tax. Taxation and services must be investigated simultaneously. The relationship follows from the local government budget constraint and includes the effect that high housing prices will increase the local tax base and contribute to a lower tax rate and/or better services.
In general, it is of great importance that the analysis includes a complete description of municipal services. Leaving out important elements will cause a positive correlation between the property tax rate and the error term. There will be a systematic tendency to underestimate the degree of capitalization since the property tax rate also captures the effect of left out municipal services that have a positive effect on housing prices. Because of the heterogeneity of housing and community characteristics, it is also important to have good indicators of housing standard and amenities. We estimate a series of econometric models with different specification and handling of control variables to investigate the robustness of the capitalization effect.
The more recent literature on capitalization is motivated by the role of property taxation for local government fiscal conditions, decision making, and resource use. Housing prices and fiscal conditions must be understood as simultaneously determined when the fiscal priorities of local governments take into account household location decisions. Local governments may choose taxation level and service allocation in response to the migration pattern of households. Municipalities experiencing outmigration and declining house prices may mitigate these problems by lowering taxes and improve services for highly mobile households. Standard ordinary least squares (OLS) estimation will tend to underestimate the capitalization effects of both property tax and services.
The endogeneity argument is of particular relevance in Norway, where the property tax is an optional tax for the local governments. We deal with the endogeneity problem by the use of instruments. Two different types of instruments are applied. First, before 1975, the local governments were separated into towns and rural municipalities and the property tax was compulsory only for towns. Different histories with respect to property taxation may influence later decisions about property tax, but without affecting the housing market several decades later. Second, a substantial literature documents that characteristics of the local political system like party fragmentation, ideology, and female representation in the local council may affect taxation and service allocation. We argue that these characteristics can be used as instruments in our context since they are unlikely to have a direct effect on the housing market.
Data and Econometric Formulation
The data set covers house transactions and with detailed housing characteristics. The analysis is restricted by the availability of data about property taxes (explained in the following), for which we have data for the years 1997–1999.
Statistics Norway has collected information about all house transactions in Norway (except transactions administered by housing cooperatives). The data set provides information about price, building year, square meters, the number of baths and water closets (WCs), type of house (e.g., detached house, apartment), and distance to the center of the municipality. Compared to most US studies, our data set represents an improvement regarding housing characteristics and description of local government services and community characteristics.
The data of housing prices are documented in appendix A. In the tables, housing prices are grouped by municipal population size and part of the country. We also separate between three types of houses: detached houses, semidetached or row houses, and apartments. From 1997 to 1999, the average increase in nominal housing prices was 21 to 23 percent. By comparison, the consumer price index increased by less than 5 percent during the same period, yielding a real housing price growth of 16 to 18 percent. Housing prices are clearly higher in urban areas (larger municipalities, the capital area) than in rural areas (small municipalities, east inland, and the northern part of the country). These differences widened during the period under study, as the areas with the highest housing prices at the outset also experienced the highest growth in housing prices.
The financing of Norwegian local governments is quite centralized, and the revenues are dominated by general purpose grants and regulated income and wealth taxes (where all local governments apply the maximum rates). The property tax is an important source of marginal revenue under local control and is not included in the tax equalization system. The other local financing instrument with some discretion is a series of fees related to infrastructure services (e.g., garbage collection and sewage). We have collected these in a utility charge, which is included as a control variable. Except for the property tax and the utility charge, local governments are basically financed by revenue sources regulated by the central government.
The property tax is an optional tax for the local governments, and applies to both residential and commercial property. The tax is regulated by national law and during the period studied the tax was restricted to urban areas and certain facilities, notably hydroelectric power plants. From 2007, property tax can also be levied in nonurban areas. Power plants and some other facilities can be taxed without taxing residential and commercial property in urban areas. Property is taxed at a flat rate that may vary between 0.2 percent and 0.7 percent. The property tax included in this study concerns tax on residential property in urban areas. Local governments can reassess the value of the houses every tenth year based on market value. The assessed value is given a discount before taxation. The discount varies across local governments, but is the same for all houses within the same local government. On average, the taxation value is about 30 percent of market value. Except for the discount, the assessment is assumed to give a realistic valuation of residential property. For residential property, the local government can decide whether to have a basic deduction or not, as well as the size of the basic deduction. The basic deduction is a fixed amount per housing unit. Most local governments use a basic deduction. Then, the effective (average) tax rate increases with the value of the house.
Data on residential property taxation cannot be obtained from local government accounts since they do not separate revenues from different types of property. We use property tax payment for a standard family house with market value of Norwegian Krone (NOK) 750,000 collected by Norwegian Household Finances (Norsk Familieøkonomi) based on a survey available for all municipalities for the years 1997–1999. In this survey, a municipality is classified as having residential property tax if at least 50 percent of all properties in the municipality are subject to property tax. Using this definition, 15 percent of the municipalities had residential property tax during the period under study (67 in 1997, 60 in 1998, and 65 in 1999). We investigate the robustness of the results using a broader definition of the property tax available for 1996.
The pool of municipalities with residential property tax is quite stable, forty-five municipalities are classified as having property tax each year. The average property tax payment in 1999 (among the municipalities with property tax) was nearly NOK 1,600 per standard house (about USD 300), varying from NOK 400 to NOK 5,250. From 1997 to 1999, the average property tax for a standard house increased by 13 percent among the forty-five municipalities with property tax all three years. The main driver for the increase is rate increases.
In the empirical analysis, residential property taxation is captured by two variables. The first is the effective property tax rate for a standard house defined as property tax payment for a standard house divided by the market value of NOK 750,000. The effective tax rate captures the formal tax rate, the discount in market value, and the basic deduction. We do not have a measure of the effective property tax rate for each house, but must rely on a standard house common for all municipalities. It is a weakness that the measure may understate the effective property tax rate for a typical house in high-priced areas, while the effective property tax rate for a typical house in low-priced areas may be understated. We do not have housing price data to construct a prediction model for housing prices, in particular in periphery regions. In 1999, the average effective property tax rate (among the municipalities with property tax) was 0.2 percent, varying from 0.05 percent to 0.7 percent. Because of the weakness of our measure, we also study the differences in housing prices between municipalities with and without property tax. The existence of property taxation is measured by a dummy variable. This alternative measure offers a robustness check since the inference is based only on the difference between local governments with and without property tax.
The local public services are subject to standardization to have equalization of service levels across the country, but service qualities may vary. It should be noticed that quality aspects of the services do not necessarily represent permanent characteristics that the housing market will capitalize to much extent. The recent literature has been occupied with school quality, but unfortunately there is no data about student and school performance for the period we study. To control for service quality more broadly, we investigate the effect of local revenue level. The main service variation is related to child care, an expanding service with large geographic variation in coverage. Child care is assumed important for the migration of young families and therefore important for the housing market. Child care coverage is calculated for children aged one to five years. We have also included the variation in home-based care and nursing homes for elderly, although this is expected to be less important for housing markets. The coverage for nursing homes are calculated for inhabitants eighty years or more, while the coverage for home-based care is calculated for inhabitants sixty-seven years or more. It should be noticed that the coverage rate in primary school is excluded since it is compulsory. Data about municipal services and other characteristics are available from Norwegian Social Science Data Services based on data collection by Statistics Norway.
Whereas the typical US analysis uses data for a cross section of communities within a narrow geographical area that share a common labor market, a Norwegian analysis can rely on data for a larger geographical area comprising several labor markets. The variation is larger, but so is the heterogeneity. Extending the analysis to a larger geographical area and several labor markets makes the estimation of capitalization more challenging as the number of elements in the measurement of amenities will increase substantially. In addition, we must take into account that the residential property tax is restricted to urban areas and thereby is more widespread in municipalities with large population size and high population density. A large number of controls are included to capture local amenities and the regulation of the property tax. The municipal unemployment rate is included to represent local labor market conditions, while the population size and the settlement pattern of the municipality take account of restrictions on the use of the property tax. We also control for centrality and part of country. Centrality is based on a classification developed by Statistics Norway where the municipalities are divided into seven groups depending on the travel distance to regional centers with specific functions. Part of country is based on the same classification as in table A2 in appendix A. The role of climate is captured by a measure of the average winter temperature during the period 1971–2000.
Finally, it is important to control for housing characteristics that influence the price of each house. We include the following housing characteristics: age in years, size in m2, number of bathrooms (zero, one, two, and three or more), number of WCs (zero, one, two, and three or more), whether a garage is included, and whether it is a single-family house (detached house), a semidetached or row house, or an apartment. After excluding extreme observations with respect to size and price per m2, houses built before 1900, and transactions with missing values for some housing characteristics, we are left with a data set of nearly 73,000 observations.
The models are estimated by pooled OLS since the short time series and the stability of the property tax do not allow for municipal effects. It is well known that pooled regressions may underestimate the standard errors and thereby overestimate the t-values (Wooldridge 2003). To avoid this problem, we report t-values based on clustered standard errors taking into account that error terms from the same municipality are correlated. In the regressions, we always include the full set of housing characteristics and year dummies to represent common shocks. Given that the statistical inference must be based on cross-sectional variation, we investigate the robustness of the results using alternative formulations for the structural characteristics capturing labor and housing markets and the difference between urban and rural municipalities. As additional robustness checks, we perform year-by-year regressions, exclude small and large municipalities, and estimate separate regressions for the three types of houses. Finally, endogeneity of property taxation and services is investigated by instrument variables.
Capitalization Effects
The results of the first pooled regressions for the data set covering 1997 through 1999 are presented in table 1. The table shows the results for taxes and services and community characteristics. Descriptive statistics for these explanatory variables are reported in appendix B. As stated earlier, we always include the full set of housing characteristics and include time dummies to take account of common shocks. The housing characteristics come out with reasonable effects; see appendix C. Housing prices increase with size, the number of bathrooms, and the number of WCs, and decreases with age and distance to the center of the municipality. The housing price is higher, if a garage is part of the property.
Pooled Regression Results, 1997–1999.

Note. NOK = Norwegian Krone. The dependent variable is the log of the real housing price. T-values based on clustered standard errors (at the municipal level) are in parentheses.
The point of departure is model A that concentrates on the effect of the effective property tax rate for a standard house. The negative sign of the coefficient is consistent with the capitalization hypothesis, but the effect is far from significant. In model B, we include the full set of community characteristics; population size, the share of population living in rural areas, the unemployment rate, the winter temperature, and dummy variables for centrality and part of country. All the structural variables are of importance. Housing prices are increasing with population size and winter temperature, and decreasing with the unemployment rate and the share of the population in rural areas; the centrality dummies are statistically significant at the 1 percent level and the part of country dummies are significant at the 2 percent level. The quantitative effect of the property tax rate is nearly doubled compared to model A. The estimate is −34.9 and highly significant.
In model C, we include the utility charge and local government services. Child care coverage has a consistent positive impact on housing prices, while no such effect can be found for elderly care. This finding may reflect that families with children younger than school age have high mobility and that child care coverage is important for their choice of municipality. The estimated coefficients indicate that an increase in child care coverage by 10 percentage points is associated with a housing price increase of around 3 percent. We have included the local revenue level as a proxy for service quality, but find no effect of this variable. The quantitative effect of the property tax was expected to increase with the control for local government services, since in model B the property tax rate also may pick of effects of services with a positive effect on property prices. But this is not the case; the estimated effect of the property tax is of the same magnitude and significance as in model B. This may reflect the fact that most of the variables are insignificant. However, the same holds true in model D where only child care coverage is included.
The property tax rate is replaced by a dummy formulation in models E and F. The alternative formulation confirms that property tax has a negative effect on housing prices, and the estimated coefficients indicate that municipalities with residential property tax have 5 to 6 percent lower housing prices. Also with this formulation, child care coverage has a significantly positive effect on property values, and in this case the service control contributes to a slightly stronger property tax effect.
The degree of capitalization depends on the estimated property tax effect and the discount rate. The estimates indicate that an increase in the effective property tax rate by 0.1 percentage point will reduce housing prices by nearly 3.5 percent. For the average housing price in the sample of around NOK 1 million, this represents a price reduction of NOK 35,000 and an annual property tax increase of NOK 1,000. It follows that the estimated property tax effect is consistent with full capitalization with a discount rate of 2.9 percent. The dummy formulation of the property tax implies that the price of the average house is NOK 60,000 lower in municipalities with property tax. Given an average annual property tax payment of NOK 1,350, this estimate is consistent with full capitalization with a discount rate of 2.3 percent. It is reassuring that two formulations yield roughly similar results. Moreover, since the estimates are based on real housing prices and real property tax payments, it is natural to interpret the calculated discount rates as claims on the real interest rate. According to Statistics Norway, the average real interest rate on bank deposits during the period under study was 1.6 percent and the average real interest rate on loans was 4.8 percent. The finding of Do and Sirmans (1994) is that homebuyers in the US county of San Diego in 1989 used a nominal discount rate of 4 percent for capitalization of taxes.
Full capitalization of the property tax is consistent with recent US studies (e.g., Palmon and Smith 1998). The main explanation for partly capitalization is related to expectations (see Yinger et al. 1988). Full capitalization implies that property tax changes are understood as permanent, while partial capitalization may reflect that tax differences are expected to be reduced. The results above indicate that property taxes in Norway immediately are reflected at housing markets and are expected to persist.
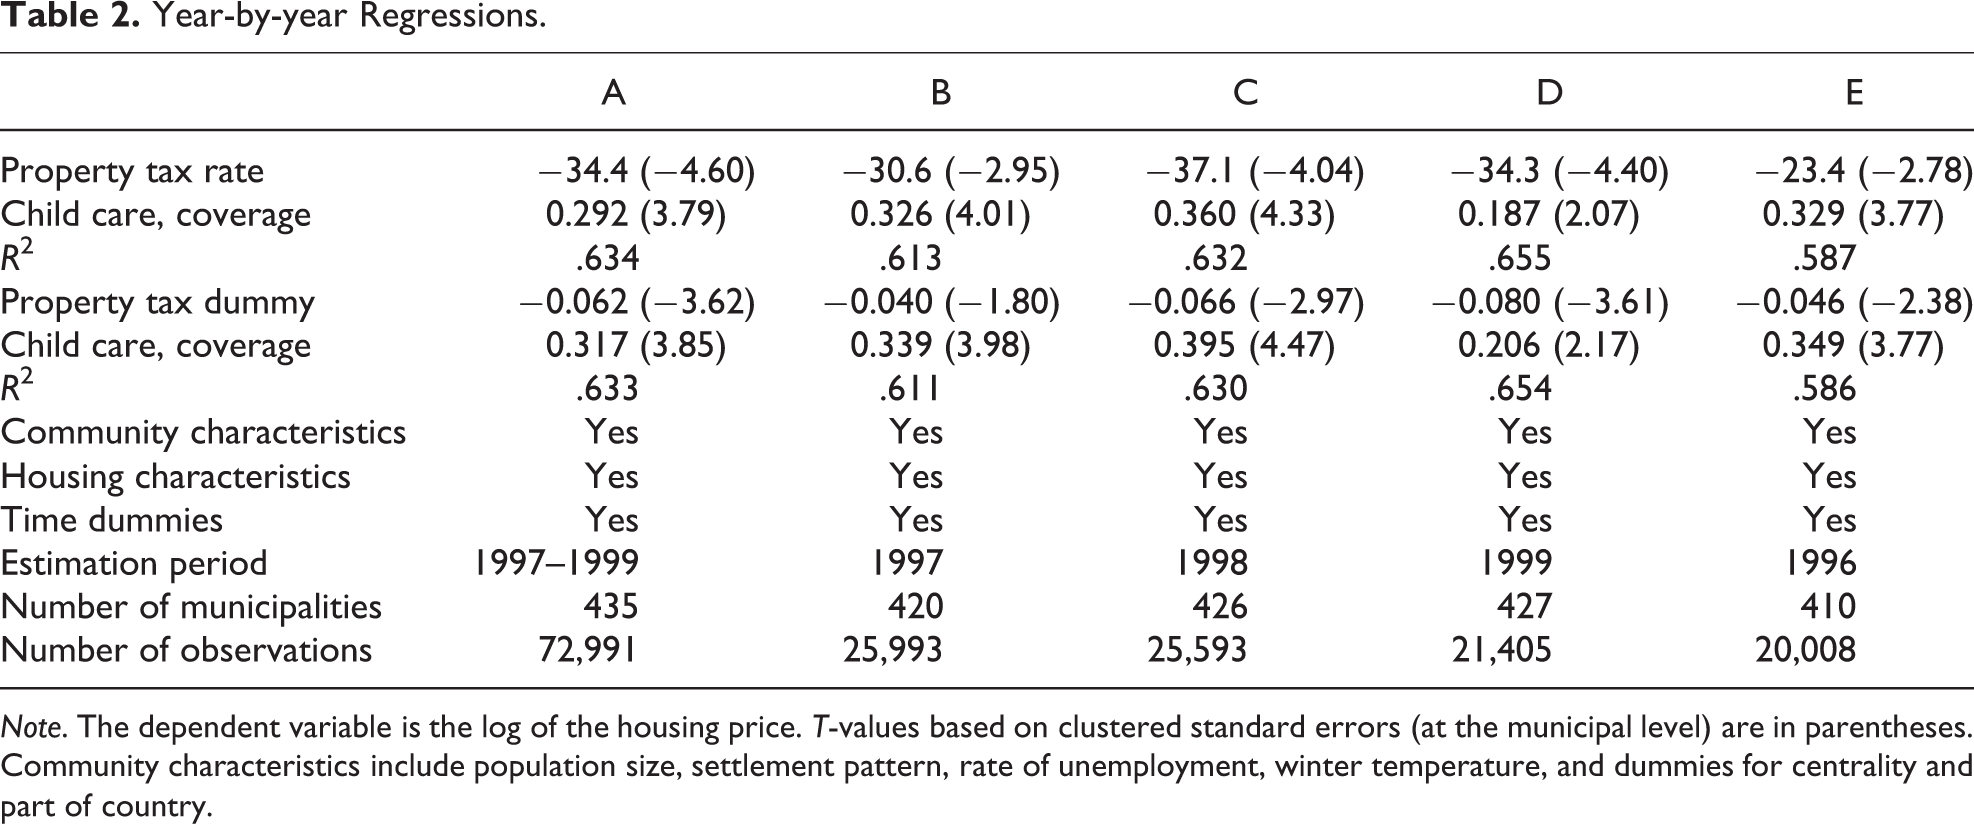
Year-by-year regressions are shown in table 2 where the points of departure are models D and F in table 1. We only report results for property tax and child care coverage. For the main estimation period 1997–1999, both property tax variables come out with a negative and significant effect in all three years. Child care coverage comes out with positive sign in all years. The estimated coefficients for child care coverage are substantially lower in 1999, but they are still statistically significant at the 10 percent level.
Year-by-year Regressions.
Note. The dependent variable is the log of the housing price. T-values based on clustered standard errors (at the municipal level) are in parentheses. Community characteristics include population size, settlement pattern, rate of unemployment, winter temperature, and dummies for centrality and part of country.
The main analysis is based on a narrow definition of residential property tax where it is required that at least 50 percent of all residential property is taxed. In the 1996 survey, no such threshold was imposed. Then 126 municipalities were classified as having residential property tax, compared to 60 to 70 in 1997 through 1999. We investigate the robustness of the results by estimating models on data for 1996 using the broader property tax definition. The results are reported in column E in table 2, and indicate that the two definitions of residential property tax yield very similar results. The property tax variables based on the broader definitions are highly significant in the 1996 analysis and the quantitative effects are of roughly the same order as in the main analysis for 1997 through 1999.
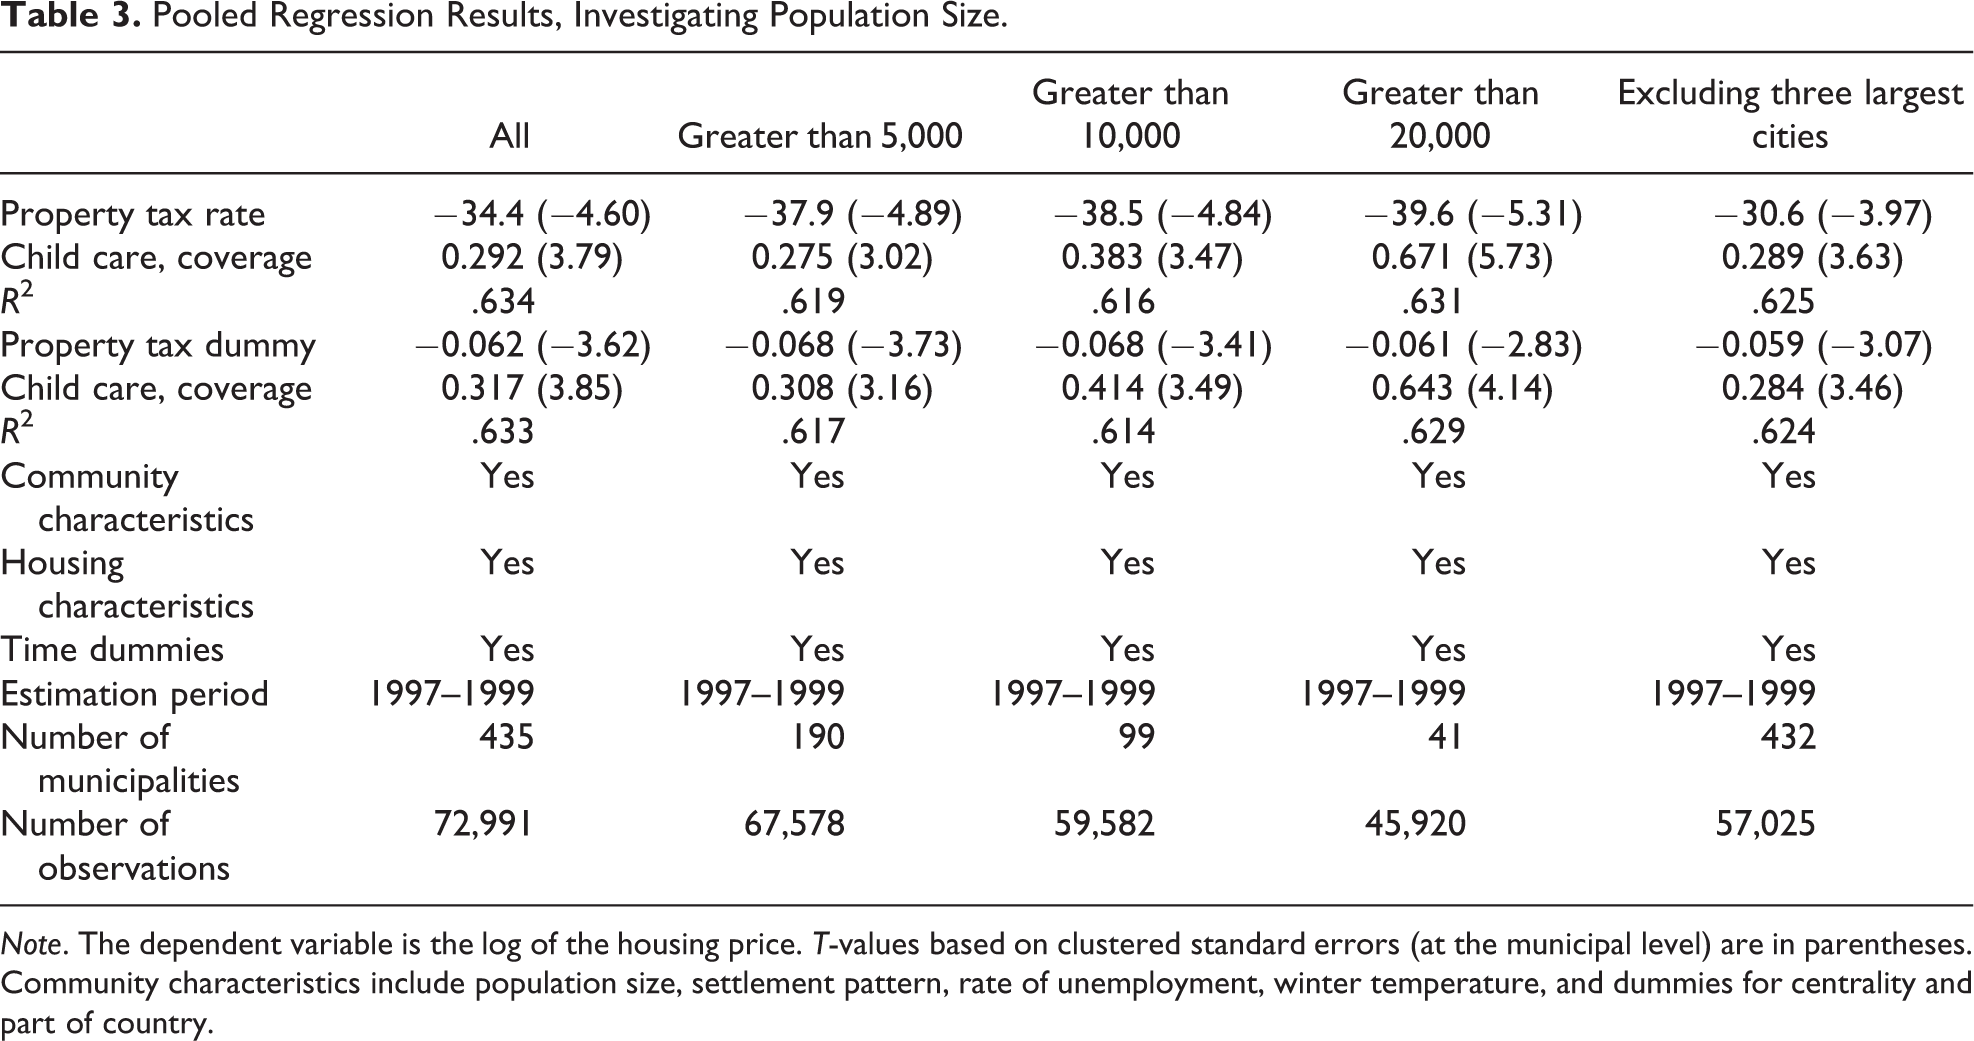
The population size of the municipalities is important, since the property tax has not been available for small local governments with limited urban population. In addition, the working of the housing market may differ between small municipalities in rural areas and larger municipalities in urban areas. As documented in the table A1, both the level and the growth of housing prices are lower in rural areas. The many small municipalities also have few housing transactions. We investigate the possible importance of these factors by excluding municipalities with fewer than 5,000, 10,000, and 20,000 inhabitants, respectively, and also by excluding the three largest cities Oslo, Bergen, and Trondheim. As shown in table 3, the size of the capitalization effects for both the property tax rate and the existence of property taxation is not much affected by the exclusion of small municipalities or the exclusion of the largest cities. However, the quantitative impact of child care coverage on housing prices increases with population size. This may reflect that higher female work participation and higher wage levels in urban areas increase the consumer valuation of child care.
Pooled Regression Results, Investigating Population Size.
Note. The dependent variable is the log of the housing price. T-values based on clustered standard errors (at the municipal level) are in parentheses. Community characteristics include population size, settlement pattern, rate of unemployment, winter temperature, and dummies for centrality and part of country.
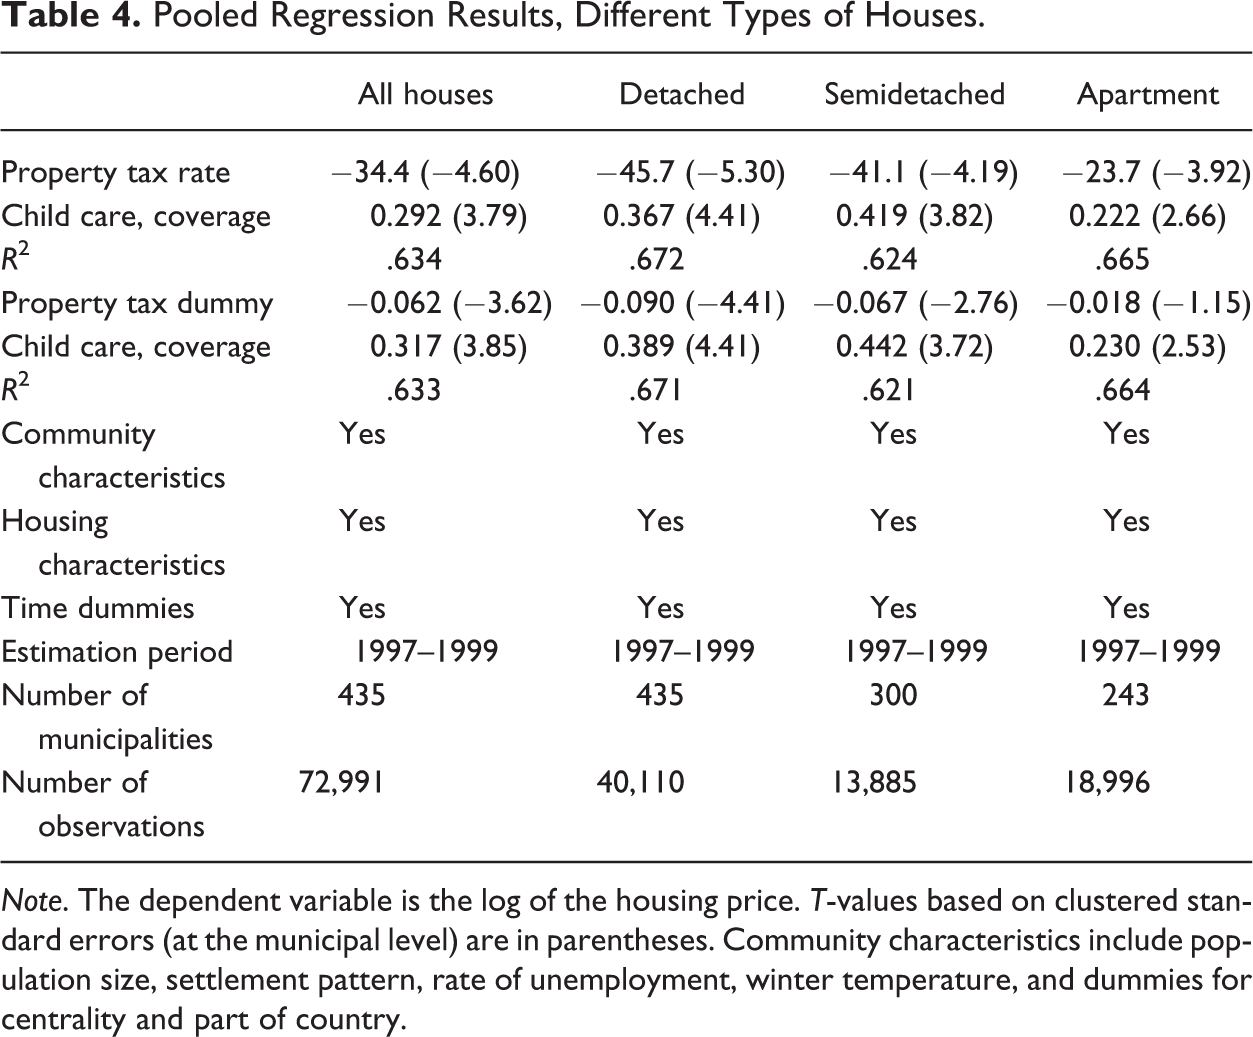
The data set consists of different types of houses, and the capitalization may vary between housing types. The analysis covers detached houses, semidetached houses, and apartments. Table 4 reports separate regressions for the three housing types to investigate the robustness. The sign and significance of the property tax variables and child care coverage are largely consistent across housing types. The only exception is that the property tax dummy becomes insignificant for apartments. There is a tendency that the capitalization effects of property taxes and child care coverage are weaker for apartments than for houses.
Pooled Regression Results, Different Types of Houses.
Note. The dependent variable is the log of the housing price. T-values based on clustered standard errors (at the municipal level) are in parentheses. Community characteristics include population size, settlement pattern, rate of unemployment, winter temperature, and dummies for centrality and part of country.
If fiscal variables are set to influence the mobility of households, we expect underestimation of property tax and child care coverage with standard OLS. The reason is that municipalities experiencing outmigration and declining house prices may tend to have low property taxes and high child care coverage to reduce outmigration. We investigate this simultaneity problem by the use of instruments for property taxation and child care coverage.
Our choice of instruments is guided by historical regulations of the property tax and by earlier literature on political determinants of taxes and service provision. First, before 1975, the local governments were separated into towns and rural municipalities with different legal regulations. The property tax was (since 1911) compulsory for towns, but not for rural municipalities. It is likely that the historical differences may have persistent effects. Towns may find it difficult to abolish a tax they have relied on for a long time, and in rural municipalities there may be severe political resistance against proposals to introduce a new tax. Even so, the historical differences in property tax regulation are unlikely to have a direct effect on the housing market. A town dummy is used as instrument as applied by Fiva and Rønning (2008).
Second, we draw on earlier empirical studies investigating how taxes and services are affected by political variables. The Norwegian studies by Borge and Rattsø (2004) and Fiva and Rattsø (2007) analyze the determinants of property taxation. They find that the choice of having property tax, as well as property tax payment for a standard house, is affected by party fragmentation and socialist influence. We use a Herfindahl index of (inverse) party fragmentation and the share of socialist representatives in the local council as instruments. Moreover, we expand the list of instruments for child care. Svaleryd (2009) investigates whether the degree of female representation in Swedish local councils affects local public expenditure patterns. She finds that increased female representation increases spending on child care and education. The Swedish evidence motivates us to use the share of female representatives in the local council as instrument. We in general argue that the political variables are unlikely to have any direct impact on the housing market, given the large number of community characteristics included as controls. We acknowledge that the political factors may affect other aspects of the local services that we do not control for and offer tests of the instrumentation.
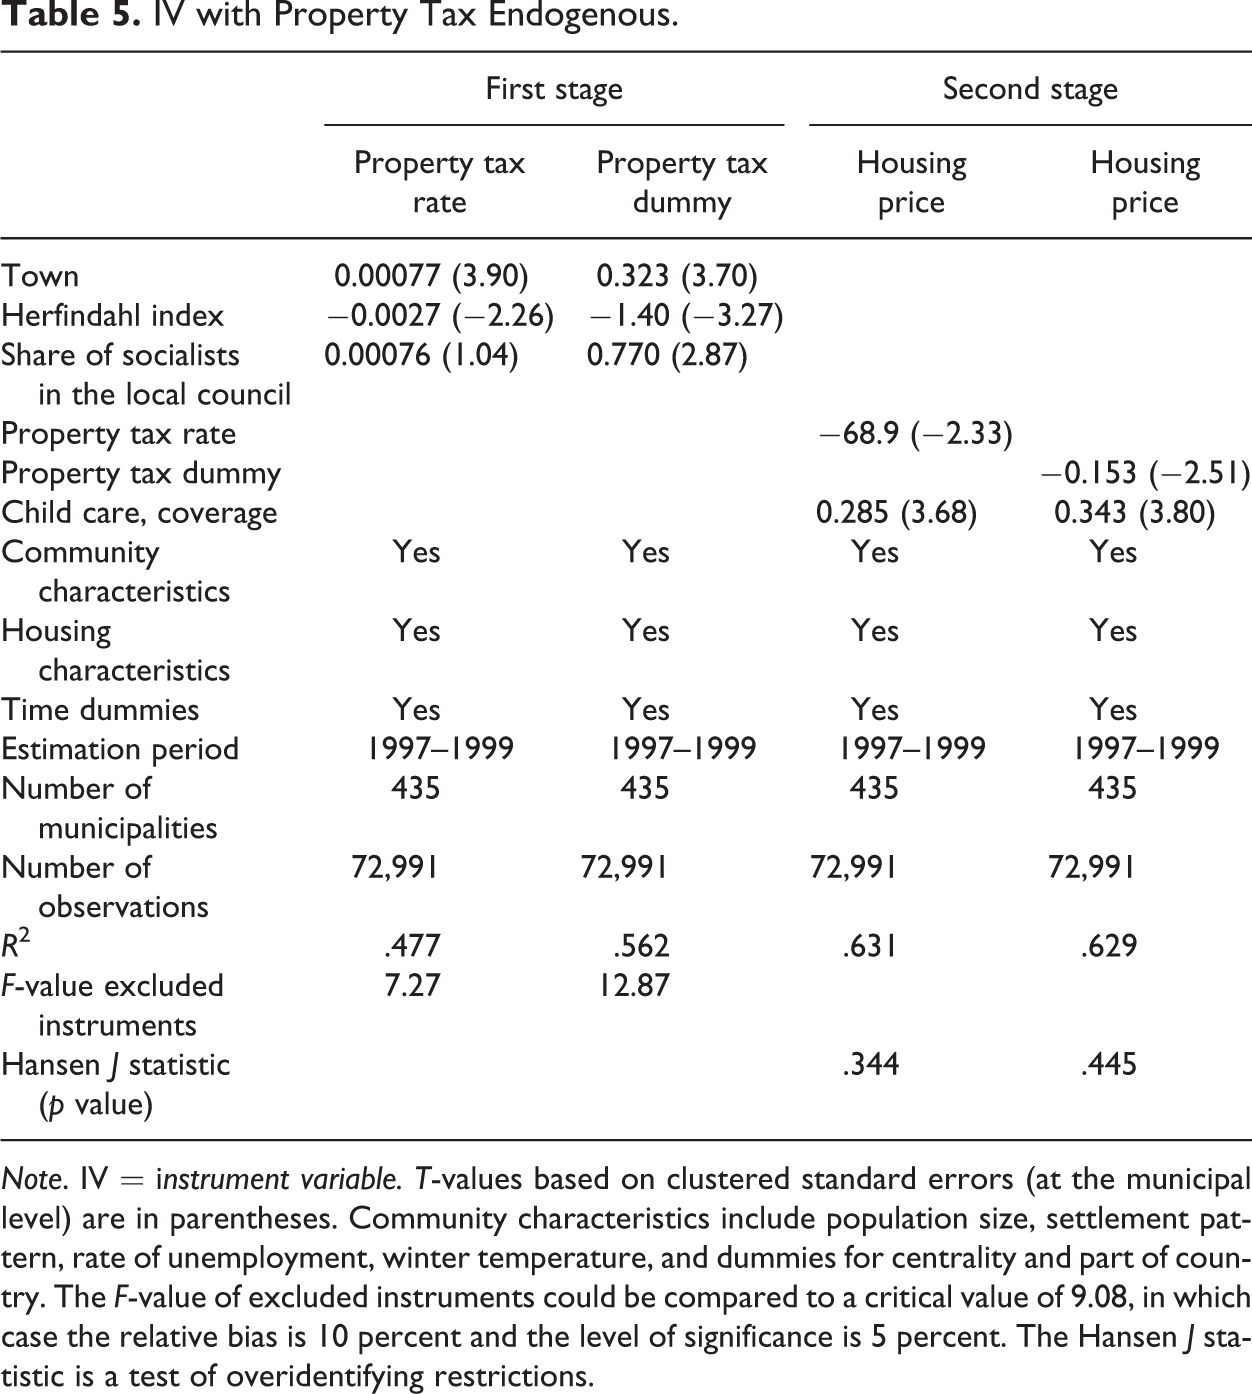
We start out with the instrumentation of the property tax alone and do not include female representation in the local council in the instrument set. The first-stage regressions are reported in the left panel of table 5 and confirm that the instruments are relevant determinants of property tax. The town dummy, the Herfindahl index, and the share of socialists in the local council come out as significant and with the expected signs. The exception is that the share of socialists is insignificant in the equation for the property tax rate. We test for weak instruments using the first-stage F-statistic for which critical values are computed by Stock and Yogo (2002). For the property tax dummy, the hypothesis of weak instruments can be rejected at the 5 percent level of significance and a relative bias of 10 percent (critical value of 9.08). The F-value is substantially lower for the property tax rate, mainly reflecting the insignificance of the share of socialists. In this case, the hypothesis of weak instruments can be rejected only at the 5 percent level when allowing for a relative bias of 20 percent (critical value of 6.46).
IV with Property Tax Endogenous.
Note. IV = instrument variable. T-values based on clustered standard errors (at the municipal level) are in parentheses. Community characteristics include population size, settlement pattern, rate of unemployment, winter temperature, and dummies for centrality and part of country. The F-value of excluded instruments could be compared to a critical value of 9.08, in which case the relative bias is 10 percent and the level of significance is 5 percent. The Hansen J statistic is a test of overidentifying restrictions.
The right panel of table 5 reports the second-stage regressions for the two specifications of the property tax variable. The two formulations yield similar results for the property tax, and in both cases the property tax variable comes out as negative and significant. The qualitative results are the same as with OLS, but as expected the quantitative effects increase with two-stage least squares. The estimates of the property tax variables are roughly doubled. The higher point estimates indicate that standard OLS underestimates the capitalization effect. According to the Hansen J statistic, validity of the instruments cannot be rejected at conventional levels of significance in any case. We conclude that the instrument estimation support our interpretation of full property tax capitalization in this data set.
The extended instrumentation of both property tax and child care coverage including share of female representation in the local council are shown in table 6. The first-stage regressions are included in the left panel. Consistent with the experience from Sweden, child care coverage increases with the share of female representatives in the local council. Child care coverage also is significantly affected by the characteristics of the local party system. Less party fragmentation is associated with higher child care coverage, while a higher share of socialists (a bit surprisingly) has the opposite effect. The share of female representatives has no significant effect in the property tax equation. Otherwise, the results for the first-stage property tax equations are similar to the results in table 5.
IV with Property Tax and Child Care Coverage as Endogenous.

Note. IV = instrument variable. T-values based on clustered standard errors (at the municipal level) are in parentheses. Community characteristics include population size, settlement pattern, rate of unemployment, winter temperature, and dummies for centrality and part of country. The AP F-value is an Angrist–Pischke test statistic for weak instruments taking into account that there is more than one endogenous regressor. The Hansen J statistic is a test of overidentifying restrictions.
In this extended case, we test for weak instruments using a method described by Angrist and Pischke (2009) that takes into account more than one endogenous regressor. The Angrist–Pischke F-statistic can be compared to the critical values reported by Stock and Yogo (2002, 2005) for the case of one endogenous regressor. For the property tax dummy and child care coverage, the hypothesis of weak instruments is rejected at the 5 percent level of significance and a relative bias of 10 percent (critical value of 9.08). For the property tax rate, weak instruments only can be rejected at the 5 percent level when allowing for a relative bias of 20 percent (critical value of 6.46).
The second-stage regressions are reported in the right panel of table 6. The extended instrumentation does not affect the property tax results, but the capitalization effect of child care increases significantly. The estimates of child care coverage are more than doubled compared to OLS, and it follows that OLS underestimates the capitalization effect. However, the overidentification test is more troublesome in the extended case. In both model specifications, the hypotheses of valid instruments are rejected at the 5 percent level. It is demanding to handle instrumentation of two endogenous variables, and in this analysis we have concentrated on the effect of property taxation.
Concluding Remarks
Our analysis indicates full capitalization of property taxation in regression analysis covering about 73,000 housing transactions and 435 municipalities during the period 1997–1999 in Norway. This is of particular interest in a country where many local governments decide not to have property tax. The statistical inference is based on cross-sectional differences, since property taxes do not change much over time. We have investigated alternative econometric specifications to check the robustness of the results with respect to controls and instrumentation for the endogeneity of property taxation and child care coverage. Housing markets clearly interact with local public finance in our data.
Further improvements of this analysis basically depend on data availability. It is expected that local government accounts and other data records in the future will give a better description of property taxes and quality of public services. If this will be the case, we can take benefit of changes in the financing of the local governments as natural experiments in future analysis.
Footnotes
Appendix A
Appendix B
Appendix C
Acknowledgments
We appreciate comments at the Norwegian Tax Forum, the Annual Meeting of the European Public Choice Society, the Norwegian German Seminar on Public Economics, and seminars in Konstanz and Trondheim, in particular from Erling Røed Larsen, David Stadelman, Johannes Voget, two referees, and the editor. Thanks also to Fredrik Carlsen for providing data on winter temperature.
Declaration of Conflicting Interests
The author(s) declared no potential conflicts of interest with respect to the research, authorship, and/or publication of this article.
Funding
The author(s) disclosed receipt of the following financial support for the research, authorship, and/or publication of this article: Received funding from the Research Program on Taxation of the Norwegian Research Council.