



Abstract
Episodes of large tax differentials between neighboring states create an incentive for cigarette tax avoidance by border crossing. We use unique quarterly panel data at the county level for the state of Kansas on cigarette retailers’ sales tax remittances by distance to a state border to gauge the extent of smuggling activity and revenue effects of increases in cigarette excise tax rates. For quantities sold near an urban, low-tax border, we find sizable effects of higher excise tax rates on sales and cigarette excise tax revenues. Implications for cross-border state revenue leakages are discussed.
Most US states have increased their cigarette excise tax rates at least once since 2000, and there is considerable variation in cigarette excise tax rates across states, with 2012 rates ranging from US$4.35 per pack in New York to 17 cents per pack in Missouri. 1 The extent to which higher cigarette excise taxes generate higher cigarette tax revenue depends on the behavioral response. If smokers do not substantially alter their behavior, a higher excise tax rate results in higher revenue being collected. Alternatively, if smokers decrease the number of packs of cigarettes purchased, travel to lower-cost jurisdictions to make purchases or buy cigarettes on the Internet in response to a home state excise tax rate increase, any increase in that state’s tax revenue will be mitigated by such indirect effects. Cigarettes are taxed twice in most US states, once at the wholesale or distributor level, whereby the wholesaler remits the cigarette excise tax to the state, prior to substate product distribution to retailers, and then again at the retail level wherein the retailer collects sales tax from the buyer. 2 Behavior responses to higher cigarette taxes can thus lead to revenue loss in the form of reduced cigarette excise tax collections and reduced sales tax collections on cigarette products. A growing tax disparity among US bordering states has been documented (Chiou and Muehlegger 2008), and there is evidence that border-crossing effects from raising cigarette excise taxes lead to tax avoidance behavior (i.e., Lovenheim 2008; Merriman 2010), making state tax revenue leakages due to cross-border purchases of significant concern.
In this article, we exploit the relationship between sales taxes on cigarette products and excise taxes on cigarettes to provide a novel approach to examine the cross-border effects of higher cigarette excise tax rates. We empirically examine the implications of increases in the state cigarette excise tax rate for state sales tax collections from two types of cigarette retailers, convenience stores with a gas station and tobacco stores, in order to address three central questions. First, in the presence of low-tax borders, are sales tax revenue collections from tobacco retailers impacted by an increase in a state’s cigarette excise tax rate and, if so, is there geographic variation in such impacts by border proximity? The effect of an increase in the cigarette excise tax rate on sales tax revenue collections is a previously unexplored channel by which overall state tax revenue collections may be impacted in the presence of low-tax borders.
Second, how steep is the cigarette tax avoidance gradient? While an extensive literature examines cigarette excise tax rates and smuggling behavior, fewer articles have estimated tax avoidance by distance to a lower-tax jurisdiction, and there is uncertainty about the steepness of the tax avoidance gradient. Lovenheim (2008) provides evidence of a relative flat smuggling gradient. In contrast, Merriman (2010) finds that the smuggling gradient is steep in the case of the Chicago–Indiana border. Harding, Leibtag, and Lovenheim (2012) and Chiou and Muehlegger (2008) report data that also suggest a relatively steep tax gradient. The steepness of the smuggling gradient holds important implications for public policy and public health. A steep gradient implies that higher cigarette excise taxes may yet be a useful tool for raising tax revenue and deterring consumption, even in the presence of low-tax borders.
Third, what is the extent of cigarette excise tax revenue loss due to border crossing? Cigarette excise tax studies that provide insights into state cigarette tax revenue effects (i.e., Goolsbee, Lovenheim, and Slemrod 2010) do not derive cross-border effects, and studies that consider cross-border impacts (i.e., Merriman 2010; Chiou and Muehlegger 2008) provide important insights on smuggling and consumption but not revenue per se. In this article, we provide an additional contribution by characterizing cigarette tax revenue effects according to border proximity.
We address these questions using data for the state of Kansas, a state from which we have obtained retail-level sales tax remittances over time for two types of tobacco retailers in all 105 of its counties. The use of geographically narrow samples is not new and has allowed researchers to make use of unique data to generate insights, as evidenced in the studies of the tax avoidance behavior of smokers in the city of Chicago and California by Merriman (2010) and Emery et al. (2002), respectively. A strength of the data used in this article is that they are (sales tax) revenue data disaggregated at the county level and quarterly, allowing us to model distance to a state border and capture the timing of cigarette excise tax rate changes, which frequently occur midyear. 3 In terms of the geographic focus, there are several factors that make Kansas a meaningful state to examine for cross-border effects. First, Kansas is representative of the tax situation faced by many US states: most of its population resides near a border, and much of its population lives in close proximity to an urban, low-tax border. 4 Second, like other states, Kansas has increased its cigarette tax rate more than once since 2000 and has done so in years when at least one of its lower-tax neighbors did not do the same. Third, Kansas faces a considerable diversity of neighboring state excise tax rates. Referring to Panel A of table 1, we see that between 2000 and 2005, among Kansas and its four neighboring states, excise taxes were increased five times, more than tripling in some instances, and by 2005 range from a high of US$1.03 per pack in Oklahoma to a low of 17 cents per pack in Missouri (The Tax Burden on Tobacco 2009).
Area Cigarette Tax Rates and Prices.
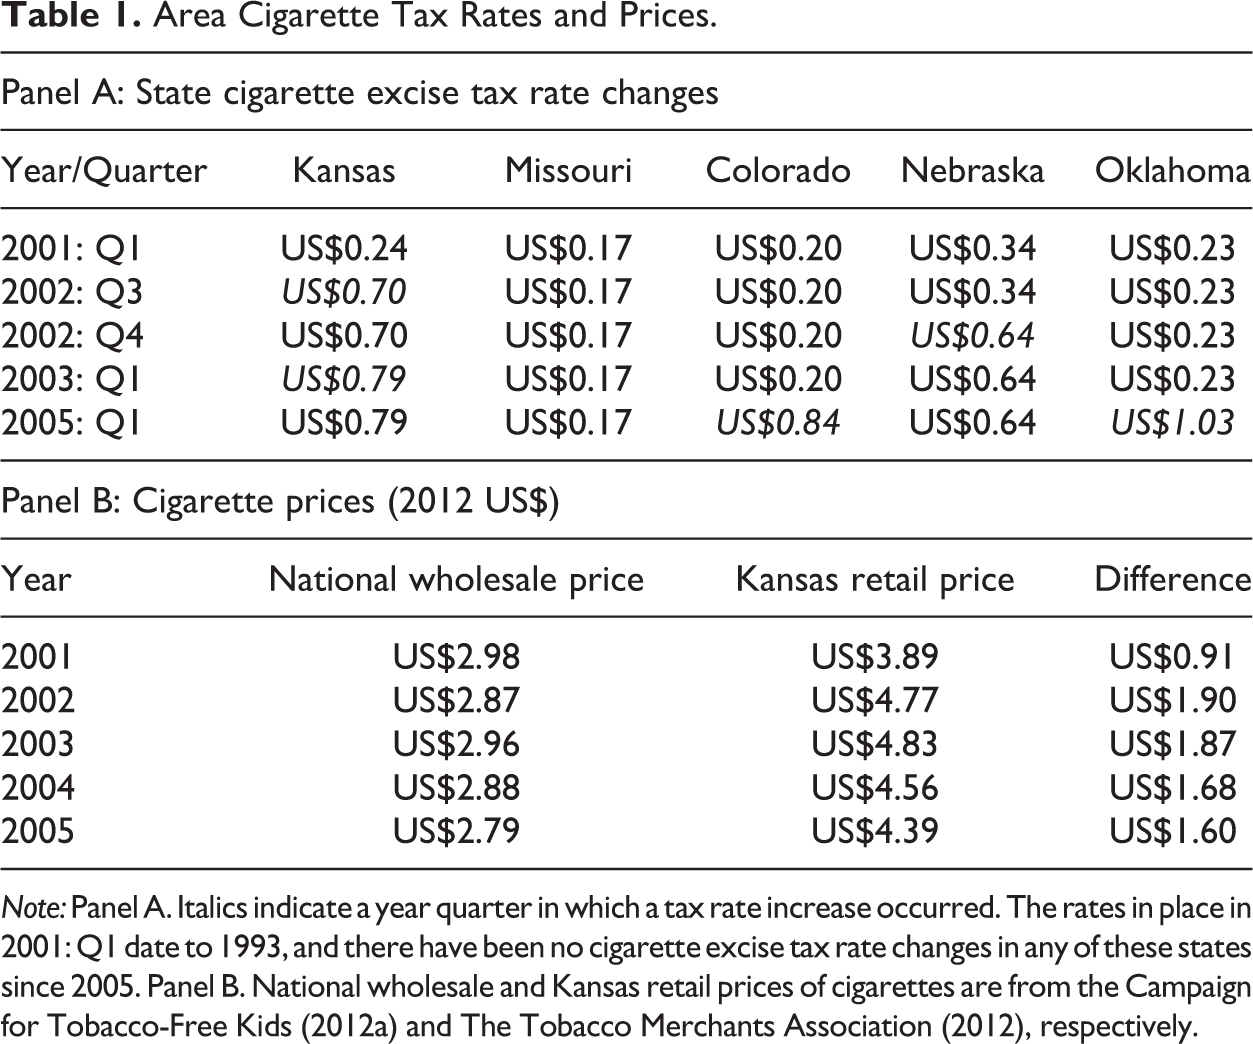
Note: Panel A. Italics indicate a year quarter in which a tax rate increase occurred. The rates in place in 2001: Q1 date to 1993, and there have been no cigarette excise tax rate changes in any of these states since 2005. Panel B. National wholesale and Kansas retail prices of cigarettes are from the Campaign for Tobacco-Free Kids (2012a) and The Tobacco Merchants Association (2012), respectively.
Our econometric approach identifies cross-border tax effects by retailer type using county-to-state-border distance measures and variation in neighboring states’ excise tax rates relative to the Kansas excise tax rate over time, focusing on the large tax increases that occurred within the time period 2001: Q1 to 2005: Q4. 5 Our main findings indicate that proximity to a low-tax border generates sizable revenue leakages and smuggling activity. For both types of retailers, we detect a border effect; however, it is stronger for tobacco sellers than convenience stores. The elasticity of the sales tax revenue with respect to the cigarette tax rate is negative on the border; however, it is larger in magnitude for tobacco stores, with an estimated value of −0.84, in comparison to an estimated value of −0.17 for convenience stores. We generate a sales tax revenue loss gradient and find that it varies by retailer type. We find a relatively flat gradient in the case of tobacco stores, wherein significant sales tax revenue loss occurs beyond 30 miles to the border, but a steeper gradient for purchases made from convenience stores, with revenue loss at just 17 percent of the border revenue leakage by 23 miles into the interior. Our estimates of the elasticity of the quantity of cigarettes sold with respect to the cigarette tax rate are −0.36 and −1.02 for convenience stores and tobacco stores, respectively, on the border (in the case of full cigarette excise tax pass through). As we note subsequently, other studies that examine data at the state level suggest a state aggregate elasticity of the taxable quantity of cigarettes sold with respect to the cigarette excise tax rate of a lower magnitude (i.e., Goolsbee, Lovenheim, and Slemrod 2010 find a state aggregate value of −0.20 assuming full pass through), and a contribution of this article is the use of substate data and a border sample that allow us to estimate revenue effects by border distance. The remainder of this article is organized as follows. The Literature Review section discusses recent studies that examine cigarette smuggling behavior. In the Sales Tax Revenue and the Taxable Sales Elasticity section, we derive three elasticities of interest: the elasticity of sales tax revenue, elasticity of taxable cigarette quantities sold, and elasticity of cigarette excise tax revenue, each with respect to the cigarette excise tax rate, from a sales tax revenue model for tobacco products. The Data and Empirical Methods section discusses the data and our empirical approach. The Empirical Results section presents our econometric findings, and the Tax Avoidance and Cigarette Tax Revenue Effects section applies the econometric estimates to assess the steepness of the sales tax revenue loss gradient and cigarette excise tax revenue effects by retailer type. The Conclusion section provides discussion and concludes.
Literature Review
Decades of research confirms that the demand for cigarettes is on average price inelastic, with a price elasticity of demand estimated to be in the range of −0.40 to −0.50 (e.g., Sung, Hu, and Keeler 1994; Chaloupka and Warner 2000; Baltagi and Goel 2004; Chiou and Muehlegger 2008). A series of articles discuss cigarette smuggling, focusing on the impact of the cigarette excise tax rate on cigarette sales at the state level and include Baltagi and Goel (2004), Chaloupka and Saffer (1992) and Yurekli and Zhang (2000). Stehr (2005) points out that these articles do not distinguish between types of tax avoidance or consumption effects. Gruber, Sen, and Stabile (2003) examine the price elasticity of consumption in an analysis that accounts for consumption versus total sales and finds evidence of a more inelastic demand in areas where smuggling is less likely. Stehr (2005) extends that research by showing that the elasticity of consumption is less than the elasticity of taxed sales. Moreover, the taxed sales elasticity is greater in states and years with high cigarette excise taxes. Stehr detects tax avoidance behavior by regressing the difference in taxed sales and reported consumption by state on home state and neighboring excise tax rates. Stehr further estimates that, between 1985 and 2001, 9.6 percent of cigarettes were purchased without payment of state taxes.
Differences between cigarette consumption and taxed cigarette sales in a state can arise from organized smuggling (i.e., illegally transporting quantities of cigarettes from a low-tax state to a high-tax state for illegal resale) and casual smuggling, whereby consumers purchase cigarettes from lower-tax jurisdictions. In most states, consumers can legally casually smuggle in small quantities (Lovenheim 2008). Emery et al. (2002) find evidence of tax avoidance based on survey data for California following that state’s 1999 excise tax hike. Casual smuggling can occur through border crossings or Internet purchases. Border crossing can refer to travel to a Native American reservation, where cigarettes are sold in some states to nontribal members free of state sales and cigarette excise taxes (Lovenheim 2008, 11). Such border crossings are of particular concern in the state of New York, for example, where tribal manufacture of cigarettes takes place. Several states, including Kansas, have passed legislation to tax nontribal-manufactured cigarettes sold on reservations (Lovenheim 2008), however, thereby eliminating the tax break in many states from reservation border crossing.
Another resource for tax avoidance is the Internet. Goolsbee, Lovenheim, and Slemrod (2010) report that, although few people comply, an individual who purchases cigarettes on the Internet is required to remit the excise tax in effect in his or her state of residence. Several articles discuss the role of Internet penetration (IP) in increasing access to low-tax cigarettes (i.e., Lovenheim 2008; Chiou and Muehlegger 2008). Goolsbee, Lovenheim, and Slemrod (2010) test for Internet effects using the computer supplements to the Current Population Survey combined with cigarette consumption, sales, and tax data at the state level from 1990 to 2005. They estimate the impact of Internet access on the so-called taxable sales elasticity measured as the responsiveness of a state’s taxable cigarette sales to the cigarette excise tax rate, controlling for neighboring states’ tax rates. The authors find that with no Internet smuggling, the taxable sales elasticity equals −0.112 (table 2, model 2, which they report implies a price elasticity of demand for cigarettes that is consistent prior research). 6 Internet access increases the magnitude of the taxable sales elasticity to values ranging from −0.189 to −0.267. The authors investigate the revenue impact, finding that Internet smuggling reduced average tax revenues gained from the 2000 to 2005 tax increases by 9 percent below what they would have been without tax-free Internet sales, yet the tax changes have no impact in either increasing or decreasing cigarette consumption.
To our knowledge, only a few articles identify cross-border tax effects of cigarette excise taxes using distance measures, and each has a unique geographic scope. Merriman (2010) uses distance measures combined with a sample of littered cigarette packs to investigate tax avoidance among Chicago residents as a result of its large tax disparity with neighboring areas. His analysis suggests that tax avoidance is pursued by a significant portion of Chicago residents: of the littered packs collected strictly in the city of Chicago, 59 percent had identification of being purchased in the state of Illinois, 36 percent were purchased in Cook County, and only 25 percent had the identification mark for purchase in the city of Chicago. Merriman estimates the probability that a littered pack has a local stamp using a number of data sources including Census data and Euclidean distance data, and, as noted previously, finds a steep tax avoidance gradient in the case of the Indiana and Chicago border, with little smuggling beyond 30 miles from the Indiana border (figure 6, 79).
Lovenheim (2008) examines cross-border effects on cigarette consumption using a stacked cross section of individuals in multiple years spanning 1992 to 2002 from the Current Population Survey Tobacco Use Supplement (TUS), which he aggregates to the metropolitan statistical area (MSA) level, and a Euclidean measure that captures distance from an MSA’s population center to the closest lower-tax border to that MSA. Note that Lovenheim uses cigarette excise tax rates to instrument for cigarette prices, and, as such, Lovenheim’s results reported in Lovenheim’s table 6 correspond to a taxable sales elasticity, as in Goolsbee, Lovenheim, and Slemrod (2010), ranging from −0.44 to −0.53 on the full margin (intensive plus extensive), accounting for cross-border effects. Lovenheim’s taxable sales elasticity estimates are thus more elastic than Goolsbee, Lovenheim, and Slemrod’s (2010) noted previously. Finally, Lovenheim estimates that on average 13 percent to 25 percent of consumers engage in border-crossing smuggling activities and finds a relatively flat tax avoidance gradient slope (figure 1, 25), as noted previously.
Sample Characteristics.

Note: SD = standard deviation; Min = minimum; Max = maximum. Tax rates and revenue data are provided by Kansas Department of Revenue (KDOR). County income and population data are from the Bureau of Economic Analysis (BEA). All dollars amounts are inflation adjusted to 2012: Quarter 2 (Q2) dollars. The convenience store sample begins in 2003: Q1 due to an industry code change that occurred in 2002: Q4. The tobacco store sample begins in 2001: Q1. Due to confidentiality requirements (i.e., a minimum of five reporting units per county), the tobacco store sample includes the three largest Kansas counties only, namely Johnson, Douglas, and Sedgwick counties with (centroid) distances to the nearest border of 45, 11.6, and 58 miles, respectively. The number of county-quarter observations in the convenience store any border, convenience store Missouri border, and tobacco store samples are 396, 216, and 60, respectively.
Determinants of Convenience Store Sales Tax Revenue.
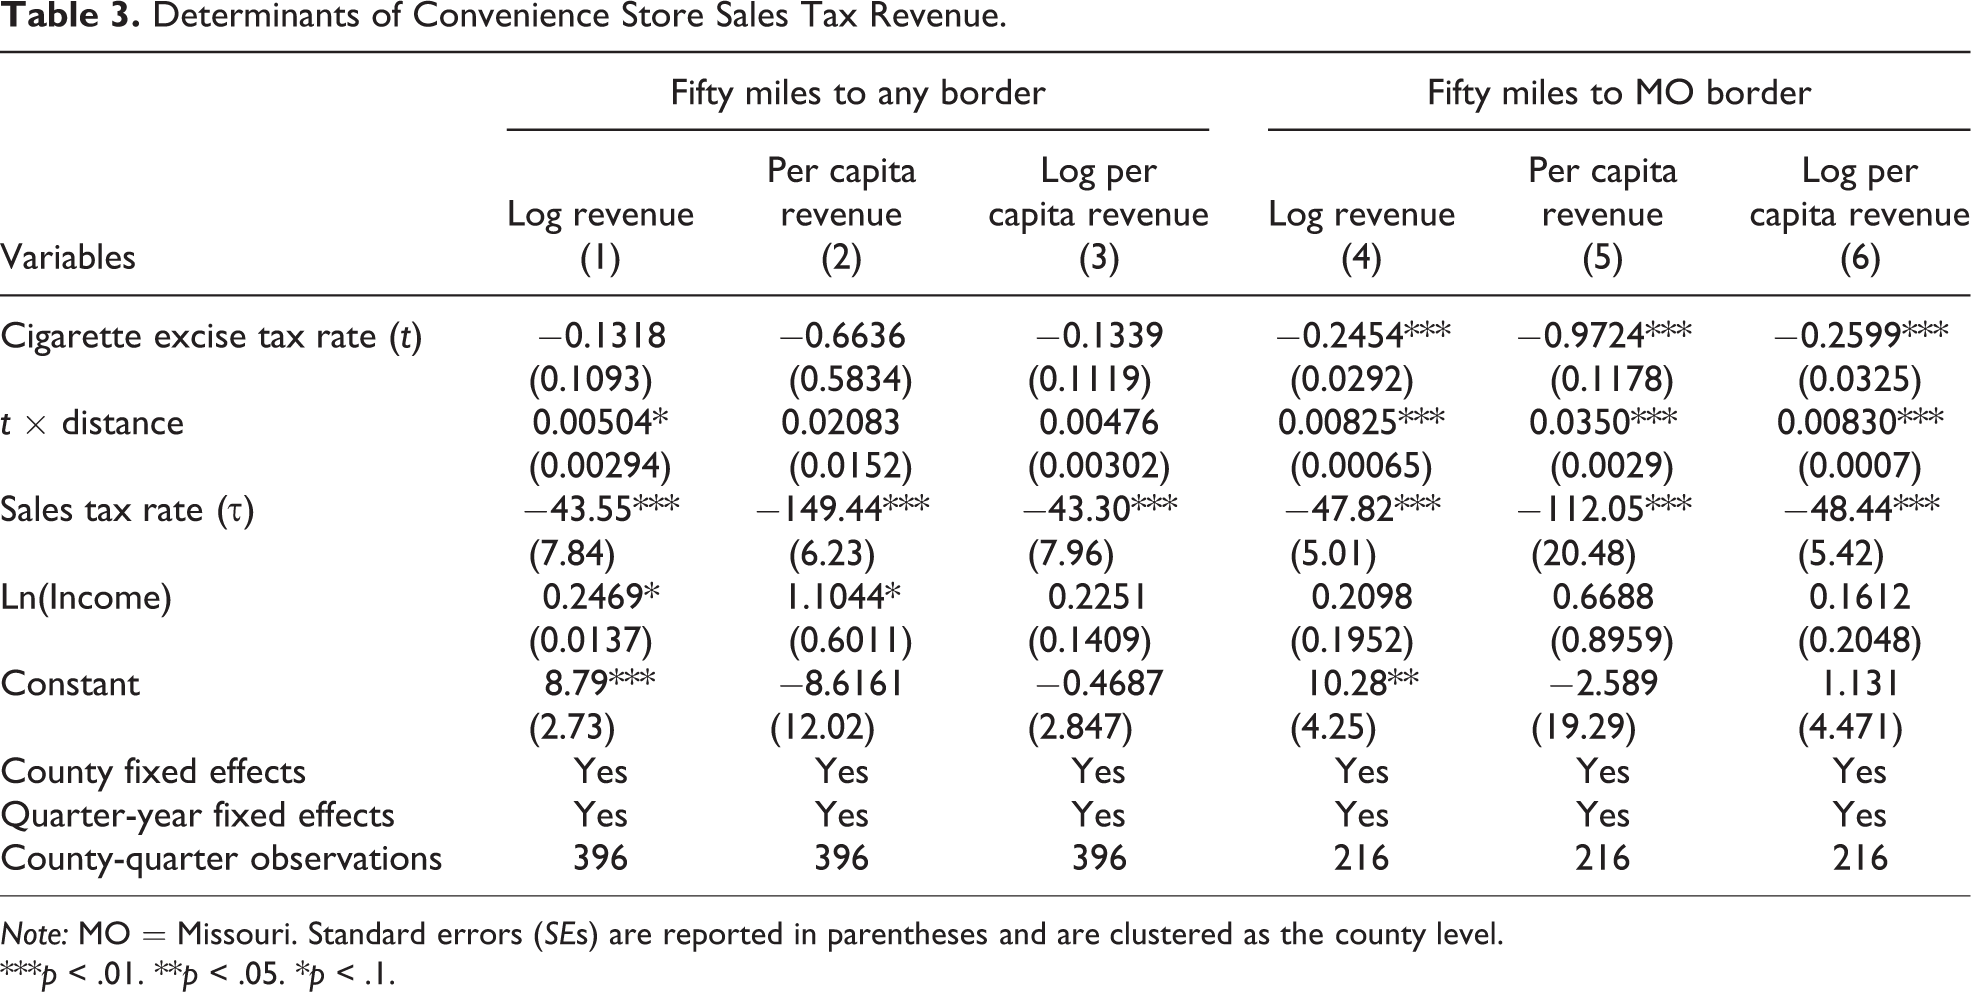
Note: MO = Missouri. Standard errors (SEs) are reported in parentheses and are clustered as the county level.
***p < .01. **p < .05. *p < .1.
Determinants of Tobacco Store Sales Tax Revenue.
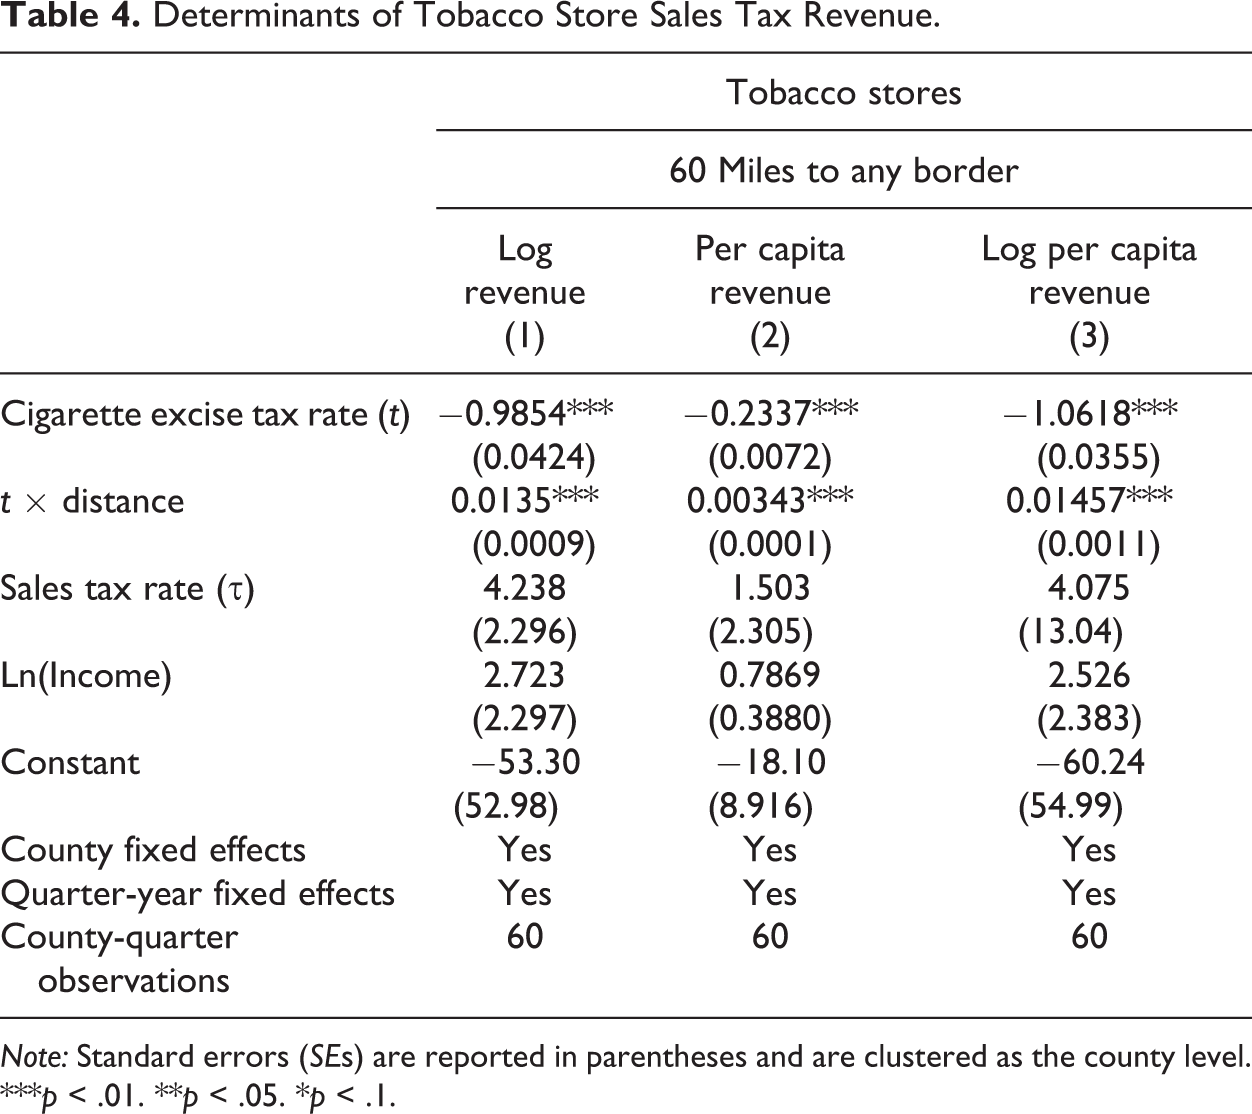
Note: Standard errors (SEs) are reported in parentheses and are clustered as the county level.
***p < .01. **p < .05. *p < .1.
Marginal Effects, Tax Elasticities, and Smuggling by Border Distance.
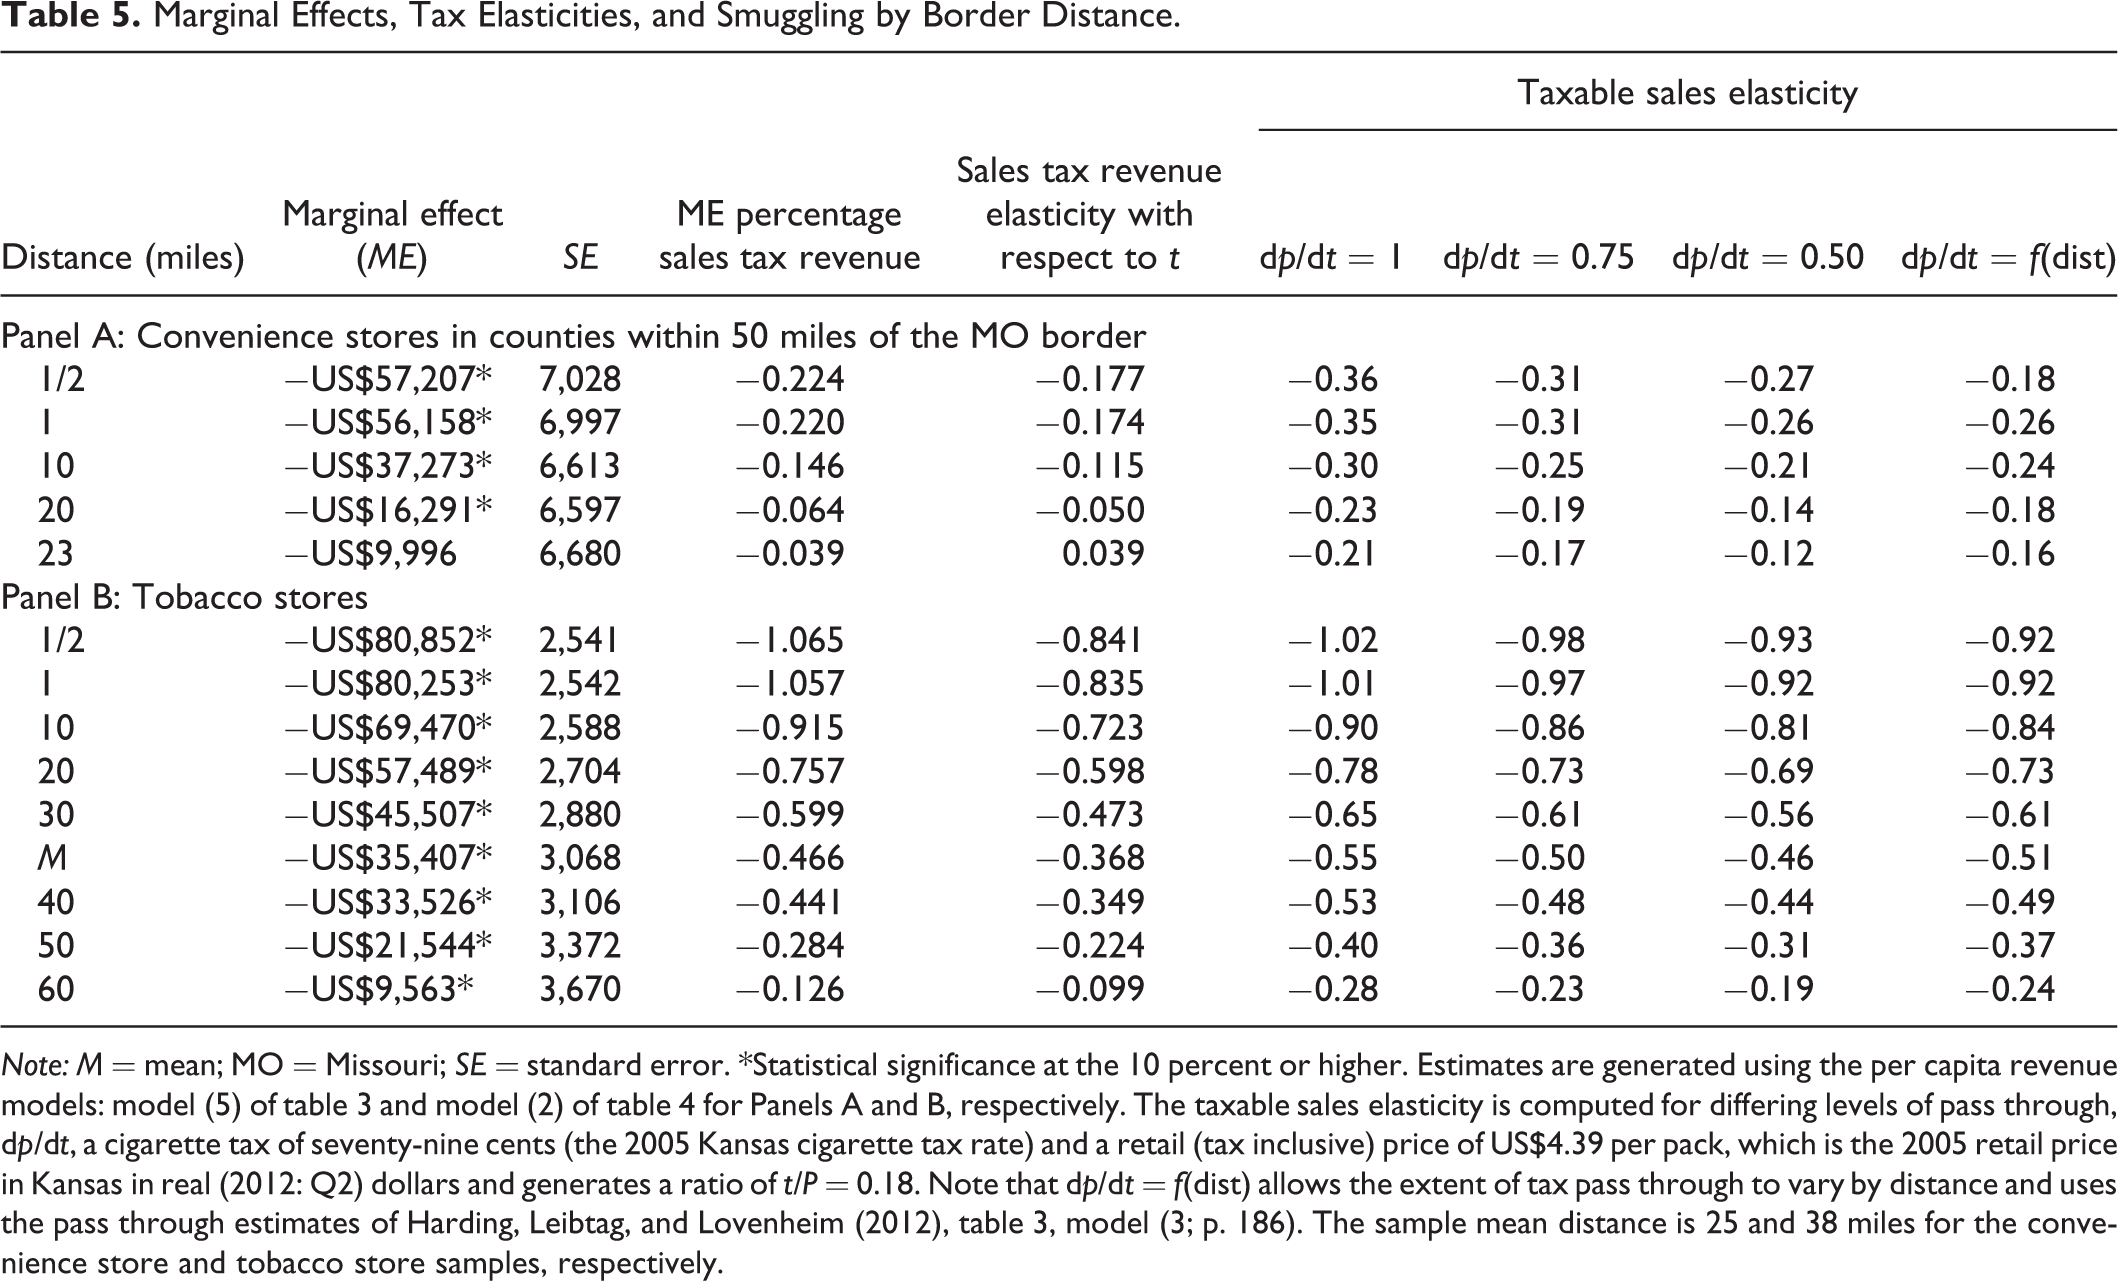
Note: M = mean; MO = Missouri; SE = standard error. *Statistical significance at the 10 percent or higher. Estimates are generated using the per capita revenue models: model (5) of table 3 and model (2) of table 4 for Panels A and B, respectively. The taxable sales elasticity is computed for differing levels of pass through, dp/dt, a cigarette tax of seventy-nine cents (the 2005 Kansas cigarette tax rate) and a retail (tax inclusive) price of US$4.39 per pack, which is the 2005 retail price in Kansas in real (2012: Q2) dollars and generates a ratio of t/P = 0.18. Note that dp/dt = f(dist) allows the extent of tax pass through to vary by distance and uses the pass through estimates of Harding, Leibtag, and Lovenheim (2012), table 3, model (3; p. 186). The sample mean distance is 25 and 38 miles for the convenience store and tobacco store samples, respectively.
Persistence of Border Revenue Loss as Distance Rises.
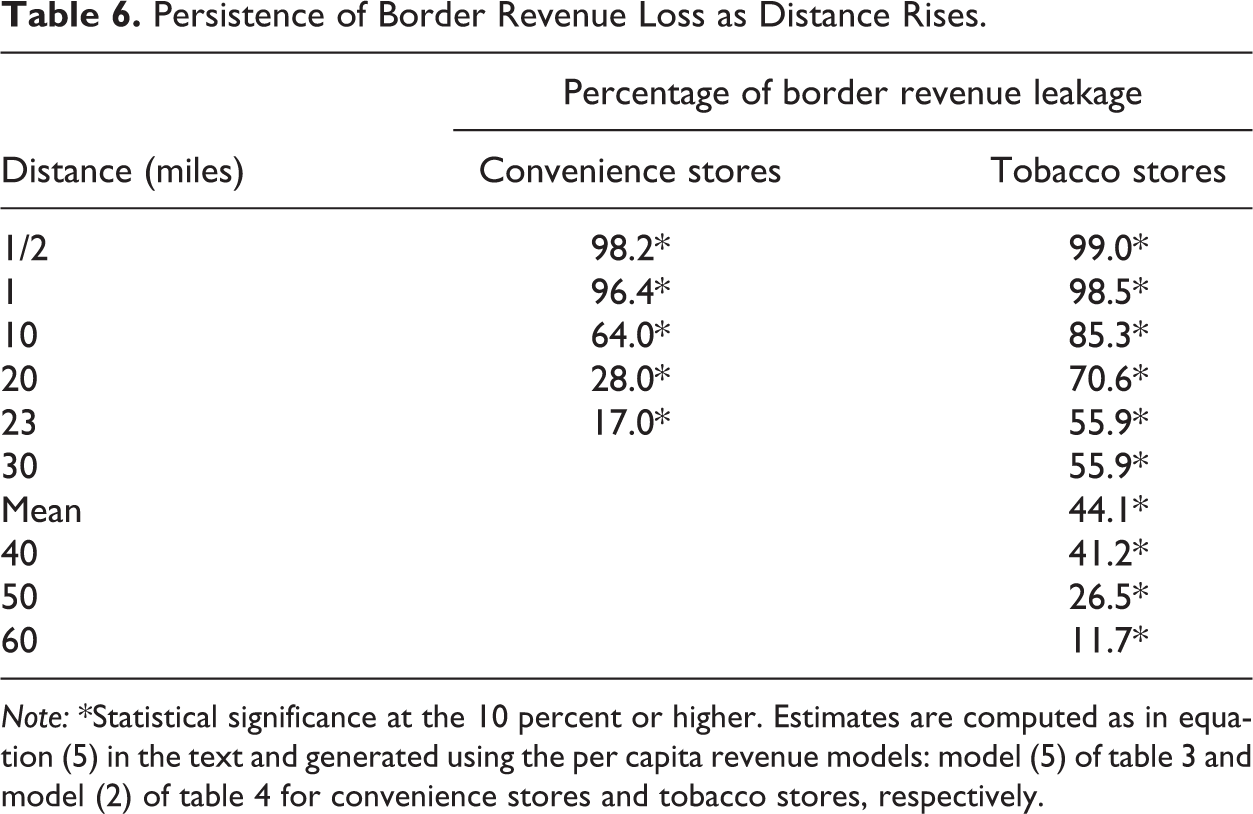
Note: *Statistical significance at the 10 percent or higher. Estimates are computed as in equation (5) in the text and generated using the per capita revenue models: model (5) of table 3 and model (2) of table 4 for convenience stores and tobacco stores, respectively.

Difference in per pack cigarette excise tax rates compared to nearest border by quarter and county. Missouri border sample.
In 2003, the TUS survey asks smokers for the state location of their cigarette purchases. Chiou and Muehlegger (2008) use these data combined with the respondent’s county of residence to estimate cross-border effects and provide a less aggregated estimation of distance effects than Lovenheim, using the Euclidean distance at the county-of-residence level to (the centroid of) the nearest county in the neighboring state. The data reveal that 98 percent of smokers drove less than 40 miles to purchase their most recent pack of cigarettes, suggesting a relatively steep tax avoidance gradient. Finally, Harding, Leibtag, and Lovenheim (2012) use Nielsen Homescan panel data in an article primarily focused on assessing the tax incidence of state cigarette excise taxes by border distances and socioeconomic status. Harding, Leibtag, and Lovenheim also estimate the effect of state cigarette excise taxes on cigarette purchases and identify a taxable sales elasticity on the full margin of −0.37, which lies between the estimates of Goolsbee, Lovenheim, and Slemrod (2010) and estimates of Lovenheim (2008). Harding, Leibtag, and Lovenheim do not derive revenue estimates, however, they do estimate the probability of a cross-state purchase controlling for tax differences and distance and find that it declines steeply with distance from a lower-tax border.
Sales Tax Revenue and the Taxable Sales Elasticity
In this section, we derive three elasticities of interest, namely the elasticity of sales tax revenue, elasticity of taxable cigarette quantities sold, and elasticity of cigarette excise tax revenue, each with respect to the cigarette excise tax rate. The effects of an increase in the cigarette excise tax rate on sales tax revenue collected from cigarettes sales can be described as twofold. A negative quantity effect arises because cigarette tax increases lead to declines in the number of packs of cigarettes sold, especially for locations close to a lower-tax border. Declines in quantities sold cause sales tax revenue collected from cigarette sales to decline as well, all else equal. A positive price effect can arise for two reasons. First, sales taxes are assessed on cigarette taxes, thus, the per pack sales tax revenue increases when the cigarette excise tax rate increases assuming some degree of tax pass through occurs. Second, when the cigarette tax rate increases, there is some evidence that smokers switch to higher quality brands (i.e., Harding, Leibtag, and Lovenheim 2012), which are higher priced, thereby increasing the per pack sales tax revenue. 7 A net positive effect is most likely to be found farther from a low-tax border, where tax avoidance activities are more costly.
More formally, let R represent the sales tax revenue generated from the sale of taxable cigarette products, t denote the state cigarette excise tax rate (levied at the wholesale level), τ represent the state ad valorem sales tax rate collected by retailers, P be the retail per pack cigarette price (which is grossed up by the wholesaler-remitted per pack cigarette excise tax), and Q be the quantity of retail cigarettes sold, then R = τPQ. Differentiating sales tax revenue with respect to the cigarette excise tax rate yields:
Equation (1) decomposes the impact of an increase in the cigarette excise tax rate on sales tax revenue into two effects: the first term is the positive retail price effect and the second term is the negative quantity effect.
Note that in equilibrium, the sales tax revenue outcome will be determined by both supply and demand factors. Cigarette demand has been modeled to be a function of prices and preferences as captured by individual characteristics (Lovenheim 2008). As discussed in Harding, Leibtag, and Lovenheim (2012) cigarette supply reflects a complicated vertical supply chain in which many tobacco farmers sell to a few large producers, who in turn sell to wholesalers operating at either the state or the substate level. Wholesalers may have substantial market power and the ability to pass increases in the cigarette excise tax rate through to retailers. Panel B of table 1 provides some cursory evidence on pass through. We see that, relative to the average national wholesale price, the average Kansas retail price increased substantially in 2002, the year that Kansas increased its cigarette tax by seventy cents per pack. The difference between the Kansas retail and the national wholesale price remains seventy cents or more above its 2001 differential through 2005, suggesting that some pass through of the cigarette excise tax increase to Kansas retail prices is likely to have occurred. A formal analysis using national data is provided by Harding, Leibtag, and Lovenheim (2012) who estimate pass through to be quite high on average, on the order of eighty-five cents per one dollar increase in the cigarette excise tax rate but diminishing with proximity to a low-tax border.
Multiplying equation (1) by t/R and simplifying yields:
Data and Empirical Methods
The data on quarterly sales tax revenue collected from cigarette retailers are provided by the Kansas Department of Revenue (KDOR). 9 To ensure anonymity, KDOR aggregated the data to the county level and only provided data for counties with a minimum of five reporting locations per retailer type. We select data for two types of cigarette retailers that are prominent sellers of cigarettes, that is, tobacco stores and convenience stores with a gas station (hereafter referred to as convenience stores). Convenience stores without a gas station are not included in the study, as these types of convenience stores are not common enough in Kansas to provide an adequate sample size. We focus on the quarter years from 2001: Q1 to 2005: Q4, since, in the last 20 years, all of the tax changes for Kansas and its neighbors occurred in this time period and by the first quarter of 2005. 10 Also obtained from KDOR are data on the state and counties’ sales tax rates. Cigarette excise tax rates are from The Tax Burden on Tobacco (2009). Annual county population and income data are from the Bureau of Economic Analysis (US BEA 2012), and we linearly interpolate to generate quarterly population and income estimates.
There are two facts that make convenience stores useful in a study of retail cigarette sales. First, 60 percent of cigarettes sold in the United States are sold at convenience stores 11 ; and second, at roughly 35 percent, cigarettes constitute a sizable portion of in-store convenience store sales (Armour 2007). In addition, there is evidence that the most common destination for smokers to buy cigarettes is a convenience store (Emery et al. 2002). 12 Anecdotal industry evidence suggests that, following the Kansas tax increases in July 2002 and January 2003, cigarette sales declined dramatically at Kansas convenience stores on the Kansas–Missouri border. 13
A caveat to using data on cigarette retailers is that such retailers may sell a variety of products, and “cross-product” effects of increasing cigarette taxes may weaken the relationship between ∊ t and ∊ R expressed in equation (2). If a change in the cigarette excise tax impacts the sale of noncigarette convenience store items, then equation (2) would need to account for the decline in convenience store sales tax revenue that arises due to fewer noncigarette products being sold when the cigarette excise tax increases. This might occur, for example, if a cigarette buyer no longer purchases a beverage at a given in-state location as a consequence of crossing the border to purchase cigarettes elsewhere when the cigarette excise tax rate rises. Not accounting for such cross-product effects may bias our estimate of the taxable sales elasticity downward; that is, failure to account for cross-product effects may make this estimate more negative than it would be otherwise. Note that gasoline is not subject to sales tax, so less gasoline being bought at a given in-state convenience store due to cross-border effects would not bias our cigarette tax estimates, but less chewing gum, soda pop, and so on, may do so. To the extent that cross-product effects arise, our estimates for convenience stores may be regarded as a lower-bound estimate, and we keep this in mind when we interpret the results for these types of sellers in the Empirical Results section. 14
Our use of data on the remittances of tobacco stores raises the possibility of a different kind of bias. While we assume that cigarettes comprise a significant portion of tobacco store sales, tobacco stores sell multiple tobacco products in addition to cigarettes, including chewing tobacco, snuff, and cigars. 15 Noncigarette tobacco products are subject to a wholesale-level tobacco tax of 10 percent in the state of Kansas but not to the cigarette excise tax. The Kansas tobacco tax is constant during the period of analysis. However, one concern is that increases in the cigarette tax may cause substitution effects, whereby smokers shift to other forms of tobacco usage. If this is the case, then our estimate of the taxable sales elasticity in equation (2) may be too small in magnitude (i.e., not as negative as it would be if we could account for substitution effects) as the loss in revenues from declining cigarette sales is offset by increasing sales tax revenues from increased purchase of noncigarette tobacco products. In this context, the estimates we report in the Empirical Results section can be regarded as an upper-bound estimate of the responsiveness of revenues and sales to changes in the cigarette excise tax rate.
While we have access to data for all of the 105 Kansas counties (that meet the minimum of five more retailers), we focus our efforts on cigarette retailers located in counties with a centroid within 50 miles of a state border. 16 While we could consider alternative ranges, we focus our efforts on the 50 mile range for three reasons. First, 70 percent of Kansans live within 50 miles of a state border, so extending the mileage outward from any one border would not significantly boost the number of counties in the study (pushing into the Kansas interior where population density is low makes meeting that five-reporting units per county requirement less likely). Second, as we note previously, in a careful study of travel behavior, Chiou and Muehlegger (2008) report that 98 percent of smokers drive 40 miles or less to make cigarette purchases, suggesting a mileage close to 40 miles to the border as a sensible range. Third, since we control for distance in miles, we can estimate effects at distances other than 50 miles in our analysis. We consider multiple distance measures including Euclidean and roadway distances, from the county geographic centroid and largest city centroid to the nearest state border.
To examine the implications of higher cigarette excise taxes for tax avoidance we estimate the following fixed effects model by retailer type:
The real relative cigarette tax rate tjt faced in a given county j is computed as the difference between the Kansas state excise tax and the excise tax rate at the nearest Kansas border to that county at time t (in 2012: Q2 dollars). Note that in Kansas there are no local cigarette excise taxes in place. Although a state’s cigarette excise tax rate does not vary at the substate level, importantly, the relative tax rate does, once one takes into account proximity to a state border, given that the neighboring state’s excise tax rate differs from the home state’s tax rate, as is in fact the case for all US states. Generating the relative tax rate faced in each county as the difference between the Kansas rate and the closest neighbor’s rate generates variation in the Kansas relative tax rate across and within counties over time. This can be seen by examining the time-varying relative cigarette excise tax rate in each county. Figure 1 provides this information for the eighteen counties with a centroid within 50 miles by roadway of the Missouri Border. 18 Figure 2 provides this information for the counties with a centroid within 50 miles by roadway of a non-Missouri border. We thus identify cross-border tax effects at the county level using the variation in the neighboring states’ excise tax rates relative to Kansas’s cigarette excise tax rate over time.
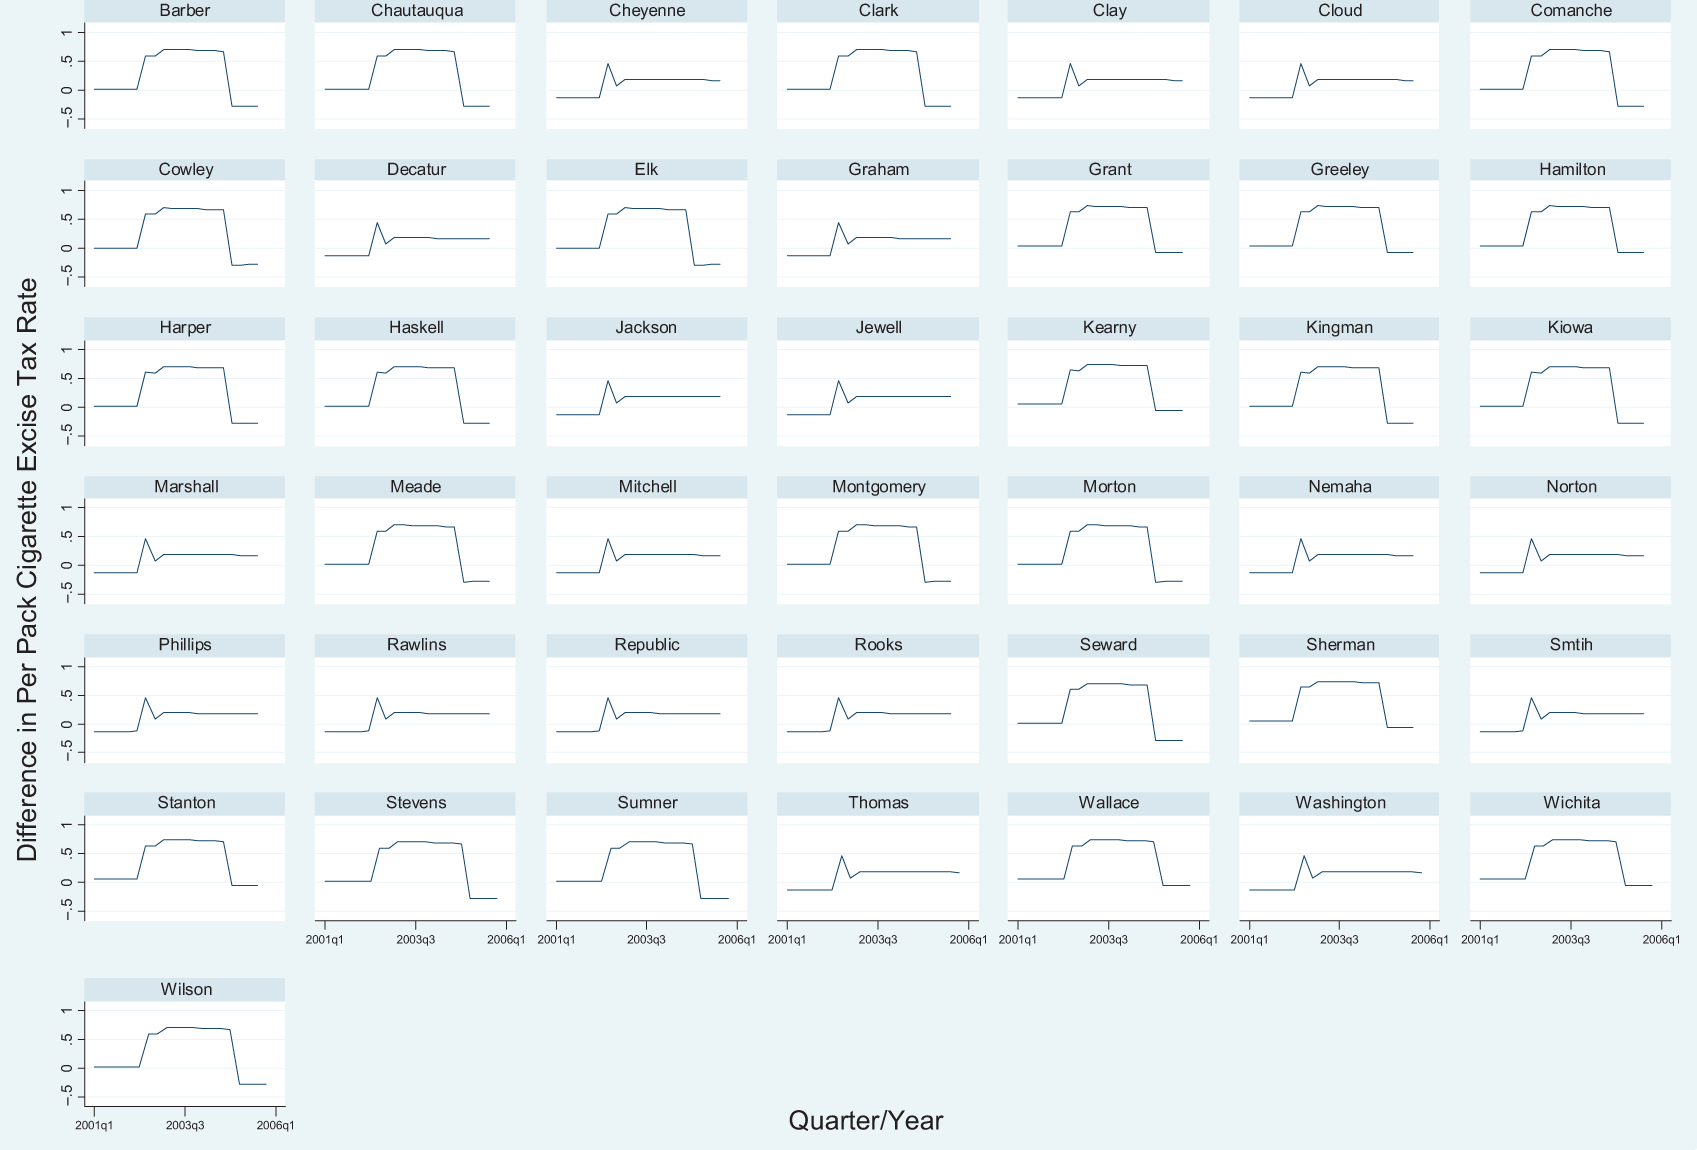
Difference in per pack cigarette excise tax rates compared to nearest border by quarter and county. Non-Missouri Border Counties only.
Referring to equation (3), for a linear model, the marginal effect of a US$1 increase in the relative Kansas cigarette excise tax rate on sales tax revenue collected on cigarette products equals:
We expect β1 to be negative and the coefficient on the interaction term, β2, to be positive: higher relative cigarette excise taxes reduce sales tax revenue, signaling a demand for Kansas cigarettes that is more elastic on the border (i.e., when Distance = 0), but this effect is mitigated by distance. As noted in the Sales Tax Revenue and the Taxable Sales Elasticity section, an increase in the cigarette excise tax rate can lead to a negative quantity effect and a positive price effect on sales tax revenue. Near the border, the negative quantity effect is expected to be larger than in the interior, due to the availability of lower priced cigarettes, and the positive price effect on the border is expected to be weaker than the price effect in the interior (Harding, Leibtag, and Lovenheim 2012).
Regarding the sign of β3 in equation (3), a positive (negative) value indicates that an increase in the sales tax rate increases (decreases) sales tax revenue collected from tobacco products. In these data, nearly all of the variation in the sales tax rate is due to cross-county variation. 19 Since Kansas counties are relatively small geographic spaces, it may be that county border crossings occurs, which would be consistent with a negative sales tax rate coefficient. On the other hand, the cigarette excise tax per pack in Kansas and its neighboring states (except Missouri) is significantly larger in magnitude than sales tax owed on a pack of cigarettes. 20 Because the sales tax per pack is a relatively small part of the consumer’s budget, small changes in the sales tax rate may not bring forth a sizeable or detectable response with regard to revenue collected on the sale of tobacco products. In this case, we expect β3 to be close to zero. 21
We estimate several specifications of equation (3) by retailer type, including models with the real sales tax revenue in logs and per capita as the dependent variables. These specifications give a nonlinear model and a linear model that correct for the population growth disparity across counties. We run models for multiple distance measures but only report the distance from the county centroid by roadway to the nearest border since the results are similar across distance measures. For convenience stores, we consider two samples, namely counties within 50 miles of any border (home to 70 percent of the state’s population) and counties within 50 miles of the Missouri border (home to 50 percent of the state’s population). In the case of tobacco stores, there are only three counties in Kansas meeting the KDOR minimum requirement of five reporting units per county. Two of these counties are within 50 miles of a border (in this case, the Missouri border). The third is Sedgwick county whose centroid is 58 miles away from the Oklahoma border. We include all three counties in the tobacco stores sample.
Empirical Results
Sample characteristics are reported in table 2. All dollar values are inflation adjusted to 2012: Q2 dollars. In both samples, there is significant variation across counties in sales tax revenues, relative tax rates, population, and income. Referring to the any border sample, notice that the average excise tax difference between Kansas and its neighboring states is forty-four cents during this time period. Average distance from the county centroid to a border in this sample is 24 miles, and the shortest distance from a county centroid to a low-tax border is only 12 miles. Convenience stores in the Missouri border sample remit significantly more sales tax revenue on average each quarter (at US$213,638 per county) than the convenience stores in the any border sample (where the average convenience store sales tax payments are US$137,973 per county). The average real difference in excise taxes between Kansas and Missouri over this time period is seventy-five cents. Referring to the summary statistics for the tobacco store sample, tobacco store retailers remit on average US$73,452 per quarter in sales tax revenue during this time period. The average distance from the county centroid to a state border is 38 miles, and the shortest distance from a county centroid to a state border is just 11.6 miles in this sample.
Table 3 reports the empirical results for convenience stores. All models control for county and quarter-year fixed effects, and we apply a cluster correction to generate standard errors (SEs) that are robust to heteroskedasticity and within-county serial correlation. The cigarette tax parameters are consistently significant in the Missouri border models (4) through (6). In these models, the key coefficients of interest are statistically significant and intuitive, with β1 negative and β2 positive, suggesting a negative association between the relative excise tax rate and convenience stores sales tax revenues that is mitigated by increasing distance from the border. The lack of significance in the any border models arises once the cluster correction is applied (the cigarette tax parameters are significant in these models without cluster correction). The heterogeneity of the any border samples noted previously may partly explain the lack of precise estimates in these models. Other results from table 3 indicate that the coefficient on income, where significant, is positive, and the sales tax rate is on average negatively correlated with sales tax revenue. 22
Table 4 reports the empirical results for tobacco store retailers. The cigarette tax parameter results are consistent with the Missouri border convenience stores’ results: increases in the Kansas relative cigarette excise tax rate negatively impact sales tax revenues on the border, and the effect is mitigated by increasing distance from the border. The results further indicate that neither the sales tax rate nor the income per capita has a statistically significant effect on the sales tax revenue of tobacco sellers. The lack of significance of the coefficient on the sales tax rate may arise because sales taxes paid on a pack of cigarettes tends to be minimal relative to the cigarette excise tax paid. In contrast, the negative effect for the convenience stores may reflect the fact that, although cigarettes are a sizable portion of in-store convenience store sales, roughly 65 percent of the total value of sales at convenience stores are from noncigarette sales (Armour 2007).
Table 5 reports the marginal effects of a US$1 increase in the relative cigarette excise tax rate on sales tax revenues, the sales tax revenue elasticity with respect to the cigarette tax, ∊ R , and the taxable sales elasticity, ∊ t , according to equation (2) and a range of pass through assumptions. Table 5 reports the SEs of the marginal effects. The convenience store marginal effects are statistically significant to a distance of 20 miles from the border. The tobacco store marginal effects are statistically significant at all distances reported. We make these computations based on the per capita revenue models, although the results have a similar pattern and magnitude across specifications. Panel A reports these estimates for the Missouri border convenience stores sample, model (5) of table 3, and Panel B reports these data for the tobacco stores sample, model (2) of table 4. Referring to Panel A, we see that, close to the border, the effect of a US$1 increase in the relative cigarette excise tax rate is estimated to reduce sales tax collections by a large amount, at 22.4 percent of revenue, but this magnitude diminishes with distance from the low-tax border, constituting only 6.4 percent of revenue 20 miles out. 23 The convenience store marginal effects are not precisely estimated beyond 20 miles from the state border, and thus we do not report an estimate at the sample average distance of 25 miles.
The last three columns of Panel A report the taxable sales elasticity computed based on equation (2), letting P = US$4.39 per pack (which is the 2005 real retail price of cigarettes in Kansas) and t = 79 cents per pack and assuming four levels of tax pass through: the first three hold pass through constant at the value given and the fourth column allows pass through to vary with distance, applying the estimates of Harding, Leibtag, and Lovenheim (2012), table 3, model (3; p. 186) to generate a value of ∂P/∂t by distance to the border. Referring to table 5 Panel A, 20 miles from the border, the taxable sales elasticity assuming full pass through equals −0.23, which is in the range of estimates reported in Goolsbee, Lovenheim, and Slemrod (2010) but somewhat less in magnitude than the average taxable sales elasticities implied by Lovenheim (2008), and diminishes in magnitude as the degree of tax pass through diminishes. We see that the taxable sales elasticity is largest in magnitude near the border, at −0.36 with full pass through, and declines with distance from the border. As we note in the Sales Tax Revenue and the Taxable Sales Elasticity section, these effects may be interpreted as a lower bound since changes in the cigarette excise tax rate may generate secondary cross-product effects.
Referring to Panel B, note that the marginal effects for tobacco seller remittances are larger in magnitude than those found in the convenience store sample and statistically significant at distances as far as 60 miles from the border. We see that the average effect of a US$1 increase in the relative cigarette excise tax rate reduces sales tax collections on average by US$35,411 per quarter, which constitutes a staggering 46 percent reduction in revenue. Varying the marginal effect by distance, we see the estimated border effect is large, with a 100 percent reduction in revenue due to a US$1 increase in the cigarette tax rate. The adverse effect of a higher cigarette excise tax on tobacco store sales tax remittances diminishes with distance from the border but remains negative 50 miles out. The last three columns of Panel B report the taxable sales elasticity computed based on equation (2), again, letting P = US$4.39 per pack and t = 79 cents per pack and allowing four levels of tax pass through. The average taxable sales elasticity computed allowing full pass through corresponds to the −0.55, which is larger in magnitude than the elasticity implied using the convenience store sample but consistent with the range implied by Lovenheim (2008). Again, the taxable sales elasticity is largest in magnitude on the border, at −1.01 with full pass through, though it is large in magnitude for even a 50 percent pass through assumption. As we note in the Sales Tax Revenue and the Taxable Sales Elasticity section, these estimates do not account for possible product substitution effects (shifting from cigarette to noncigarette tobacco usage as the cigarette tax rate rises) that would buoy location-specific sales tax revenue collections. As a result, if substitution effects are present, then these estimates can be viewed as an upper bound, and the tax responsiveness may be larger than these estimates imply.
As robustness checks, we reestimate the models in tables 3 and 4 without the income control and the results are robust to excluding income. We also considered possible lagged effects of cigarette excise tax changes, reestimating the models with a one-quarter lag on the relative excise tax rate. Our rational is that buyers may not immediately adjust to a cigarette excise tax change, and thus the revenue effects would be better identified with a one period lag. The results are very similar to the models using contemporaneous tax controls, and thus we do not report them in the article.
Tax Avoidance and Cigarette Tax Revenue Effects
Using consumption data, Lovenheim (2008) derives an estimate of smuggling and plots a smuggling gradient, the steepness of which is implied by the rate of decrease in the percentage of cigarettes consumed that are smuggled, as distance to a low-tax border rises. With revenue data, we cannot isolate a smuggling effect as in Lovenheim, since sales tax revenue loss may occur due to both a cigarette quantity effect and price effect, as can be seen from equation (1), and tax avoidance behavior includes both smoking cessation and smuggling. Smoking cessation varies inversely with the extent of border-crossing smuggling opportunity (Lovenheim). A sales tax revenue loss gradient capturing both smoking cessation and smuggling would thus be flatter than the underlying smuggling gradient as distance to the low-tax border rises. 24 While we cannot identify a smuggling gradient, our data nonetheless can be suggestive of the steepness of the slope of the smuggling gradient.
Let RS(tjt,Djt) be the sales tax revenue loss at distance Djt divided by the sales tax revenue loss at the border. Sales tax revenue loss is constructed as the difference between the predicted revenue in the presence of no tax cigarette excise tax differential, E[Rjt|0, Djt], and the predicted revenue at the sample mean tax differential,

Persistence of border revenue leakage by retailer type.
We speculate that a difference by retailer type in the persistence of revenue leakage may arise due to differences in clientele. In comparison to tobacco stores, individuals who make cigarette purchases at convenience stores may be less likely to have transportation or generally have few resources to travel lengthy distances to purchase cheaper cigarettes, which would be consistent with a steeper smuggling gradient. 25 It is interesting to note that the convenience store results are consistent with the steep gradient found by Merriman (2010) in his study using littered cigarette packs. There might be more litter related to convenience store purchases due to the relatively high volume of pedestrian traffic for these types of stores and, as a result of the pedestrian traffic, a greater incidence of litter in public areas. As specialty shops, tobacco stores, on the other hand, may tend to serve a higher income or more mobile cigarette smoker. However, we could find no research to date that examines differences in clientele by tobacco retailer to shed light on this possibility.
Finally, having a taxable sales elasticity estimate allows us to examine the implied cigarette excise tax revenue effects arising from an increase in the cigarette excise tax rate in the presence of border crossing. To our knowledge, among recent studies, only Goolsbee, Lovenheim, and Slemrod (2010) directly examine the effects of smuggling on the revenue raising potential of cigarette excise taxes. For states such as New Jersey and Louisiana, they find that the Internet access generates substantial state cigarette tax revenue leakages due to the implied Internet purchase of cigarettes. 26 We undertake a similar exercise and generate a measure of cigarette excise tax revenue leakage for border locations due to the fifty-five cent (229 percent) cigarette excise tax increase in Kansas during this time period. To do so, we generate taxable sales elasticities in a similar manner as in the data reported in table 5, adjusted for a fifty-five cent excise tax rate increase. Using the implied cigarette excise tax revenue elasticity, computed as (1 + ∊ t ), we compare the percentage cigarette excise tax revenue increase on the border to the percentage cigarette excise tax revenue increase in the presence of little or no smuggling (in the interior), all else equal. 27 In the case of convenience stores, assuming full pass through as in Goolsbee, Lovenheim, and Slemrod (2010), the 229 percent increase in the Kansas cigarette excise tax rate implies a cigarette excise tax revenue increase of 165 percent from border locations, whereas in the presence of little or no smuggling, the revenue increase is estimated at 183 percent, suggesting a drop in revenue of 10 percent due to smuggling activity. 28 The estimated cigarette excise tax revenue loss is lower if there is only partial pass through. Using the Harding, Leibtag, and Lovenheim (2012) partial-pass-through estimate yields a drop in revenue of only 4 percent. The effect is greater and the range is tighter in the case of tobacco stores, with an estimated drop in cigarette excise tax revenue due to smuggling of 53 percent and 43 percent for full and partial pass through, respectively.
Conclusion
In most US states, cigarettes are taxed twice through the usage of state cigarette excise taxes at the wholesale level and sales taxes levied on cigarettes sold at the retail level. Behavior responses to higher cigarette taxes can thus lead to revenue loss in the form of reduced cigarette excise tax collections and reduced sales tax collections on cigarette products. In this article, we are able to examine revenue effects by distance to a low-tax jurisdiction to identify cross-border leakages. We do so by modeling the impact of variation in real relative cigarette excise tax rates on sales tax revenue collections from cigarette sellers, using quarterly panel data by retailer type for the state of Kansas, and we apply these model estimates to examine tax avoidance activity by border proximity and cigarette excise tax revenue effects. We concentrate our analysis on the years 2001: Q1 to 2005: Q4, during which Kansas and three of its four neighbors enacted sizeable cigarette excise tax rate increases. Accounting for time and county fixed effects, model estimates imply that a US$1 increase in the cigarette excise tax rate reduces quarterly sales tax revenue collections by 22.4 percent from convenience store retailers at ½ mile from a low-tax border. The sales tax revenue losses are significantly higher if one considers tobacco stores, retailers who specialize in the sale of tobacco products. We estimate that sales tax revenue losses are on the order of 100 percent of revenue for those retailers located at ½ mile from a state border. We find that the sales tax revenue effects are negative on average for the sample as a whole, suggesting that a US$1 increase in the cigarette excise tax rate results in less revenue collected from tobacco retailers in the form of sales tax revenues, all else equal.
The steepness of the sales tax revenue loss gradient varies by retailer type: We find a relatively flat gradient in the case of tobacco stores, but a steeper gradient for purchases made from convenience stores. We speculate that the difference arises due to a difference in these retailers’ clientele, which could be an interesting question for future research. Our estimate of the taxable sales elasticity is −0.36 and −1.02 for convenience stores and tobacco stores, respectively, on the border (in the case of full tax pass through). At roughly the sample average distance, our convenience store and tobacco store taxable sales elasticity estimates were generally comparable with Goolsbee, Lovenheim, and Slemrod (2010) and Lovenheim (2008), respectively. 29 Using the implied cigarette excise tax revenue elasticities, we estimate the revenue loss from the fifty-five cent cigarette excise tax rate increase that occurred in Kansas during this time period. We find that the increase in the cigarette excise tax revenue for convenience store sales would have been higher by 4 to 10 percent, depending on pass through assumptions, absent tax avoidance activity. In the case of tobacco stores, we estimate that cigarette excise tax revenues would have been substantially higher, in the range of 44 percent to 53 percent, without border crossing.
This article adds to a growing literature that documents tax avoidance behavior and the implied state tax revenue leakages arising from differential taxation of cigarettes across US states. The ability of consumers to purchase at a lower-tax price than that in one’s home state, either through border crossing or through Internet purchases, suggests that requiring Internet cigarette purchases to be subject to taxation and creating interstate coordination of excise tax rates could yield significant gains in the form of higher revenues as well as diminish cigarette consumption. Future research might examine the potential for these gains and the extent to which they are positive even for the states with relatively low excise tax rates, as these states’ retailers also face growing competition from tax-free Internet sales.
Footnotes
Acknowledgments
We thank Steve Brunkan for data and insights. We thank Michael Babcock, Dong Li, John Crespi, Nathan Hendricks, and two anonymous reviewers for their valuable comments. We thank Jim Alm for guidance. We are grateful to Brenda Elsworth for industry information and Brian Mulcahy for generating GIS data.
Declaration of Conflicting Interests
The author(s) declared no potential conflicts of interest with respect to the research, authorship, and/or publication of this article.
Funding
The author(s) received no financial support for the research, authorship, and/or publication of this article.