
Abstract
Using U.S. National Institutes of Health (NIH) grant panel data, Hegde and Mowery and Hegde look at political influence at the US congressional level on the allocation of these funds. Their key finding is that members of the Labor, Health and Human Services, Education and Related Agencies subcommittee of the House Appropriations Committee and former New York Senator Al D’Amato as a member of the Senate Appropriations Committee were able to indirectly steer NIH grant money to organizations in their home states. A reexamination of their evidence does not support that conclusion.
Research by Hegde and Mowery (2008a; 2008b) and Hegde (2009) found that congressional influence plays a significant role in the allocation of National Institutes of Health (NIH) research funds. Since this calls into question the integrity of the NIH peer review process, the evidence upon which this conclusion was reached deserves reexamination.
Overview of Original Papers
The two papers present the findings from a single research effort and are discussed collectively in this article. The authors constructed a data set consisting of the two-year funding for each US organization receiving NIH extramural funding. These data were then combined with counts of Senate and House members on the appropriation committees (SAC and HAC) and Labor, Health and Human Services, Education and Related Agencies subcommittees (Senate LHHE and House LHHE) for the 98th to the 107th Congresses, covering the period from 1983 to 2002.
The authors analyzed the data using a linear regression model of the following form:
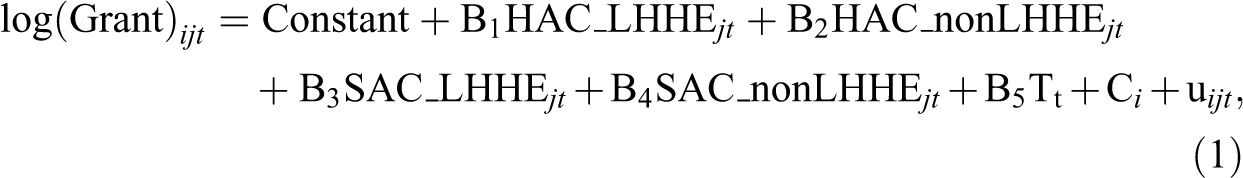
where the subscript i refers to the organization, j refers to the state in which the organization is located, and t refers to the congressional year of the grant. The dependent variable is the natural log of the grant amount to a particular organization. This is regressed on the following political variables: HAC_LHHE, the number of HAC members on the LHHE subcommittee from state j; HAC_nonLHHE, the number of HAC members not on the LHHE committee; SAC_LHHE, the number of SAC members on the LHHE subcommittee; and SAC_nonLHHE, the number of SAC members not on the LHHE committee. Other variables included in the regression are T, a trend variable, and C, a dummy variable, for each of the organizations. Beneficial political influence would be indicated by positive coefficients on the political variables.
Using Stata to run the fixed-effects regression model, the political variables HAC_LHHE and SAC_nonLHHE were found to be significant (Table A, model 1). 1 Each HAC_LHHE member and each SAC_nonLHHE represent about a 6 percent increase in NIH funding at each organization. A check performed of the sensitivity of the results to individual members of the committees found that Senator Alfonse D’Amato (R-NY), who served on the SAC (1983–1994), influenced the coefficient on the SAC_nonLHHE variable. Including a dummy variable for the Congresses in which he served on the SAC caused the coefficient on the SAC_nonLHHE variable to no longer be significant and revealed that each New York organization enjoyed on average about 28 percent more funding while he was a member. From these analyses, the authors concluded that members of the HAC LHHE and Senator D’Amato were able to steer the NIH funding to benefit organizations in their states.
Reexamination of Analysis
Data
Since a dummy variable representing New York Senator D’Amato’s time on the SAC was found to be significant, I checked New York organizations. I found that a number of organizations were represented in the data as more than one organization.
This happens for two reasons. One is due to name changes. A second is due to the separation of the medical school grants from the rest of a university. An example of the latter reason involves New York University. The organization name, New York University, shows up in the data for all ten Congresses. However, starting with the 104th Congress, a new organization shows up in the data with the name New York University School of Medicine. The NIH funding for New York University drops from US$148.1 million in the 103rd Congress to US$19.6 million for the 104th Congress, while New York University School of Medicine during the 104th Congress has US$131.8 million in NIH funding. Since this coincides with the departure of Al D’Amato from the SAC, it looks as though the Senator’s departure caused the drop in funding.
Model
The particular model used by the authors suggests that each organization in a state benefits in a proportional way as a result of membership on one of the committees. Since senators represent an entire state, it follows that their representation may show up as benefiting their entire state. In the case of members of the House of Representatives, it is less clear why their influence would extend beyond their district.
In the regressions performed, the authors use a trend variable (1 through 10) to represent the ten different Congresses. This would suggest that an organization could expect a constant percentage growth over the twenty-year time period covered in the analysis. Actual NIH funding fluctuated before and during the NIH budget doubling years (1998–2003). Using a constant growth trend rather than one that allowed for variation by Congress increases the likelihood that a bias is introduced in the model predictions. A better approach is to use a dummy variable for each of the congressional periods covered.
Results
After obtaining results identical to those published, Table A, model 2, using the data and Stata commands graciously supplied by Deepak Hegde, I first tested for serial correlation using the xtserial command in Stata, which revealed that this is a problem. 2 The Stata areg command with robust option, used by the authors, corrects for heteroscedasticity but not for serial correlation. To deal with both, Wooldridge suggests using the cluster option with the xtreg command. 3 When adjusting the standard errors (SEs) for both heteroscedasticity and autocorrelation with both the areg and xtreg (fe—fixed effects model), the xtreg version yielded slightly smaller SEs. Since the concern of this article is with the significance of the political variables, xtreg-generated results are used.
The results from the regressions with the corrected SEs (Table A, model 3) still found HAC_LHHE and SAC_nonLHHE variables to be significant. The estimated coefficients remained the same.
I then combined the data for the New York organizations (shown in appendix 1 of the online supplementary material) that were found to have name changes. The results for the regression using the “NY corrected” data (Table A, model 4) no longer found the SAC_nonLHHE variable to be significant, which had been the reason for including the Al D’Amato variable.
Since the political variables included in the model are at the state level, I checked to see the size of the effect in each state by running a fixed-effects regression model of the form:
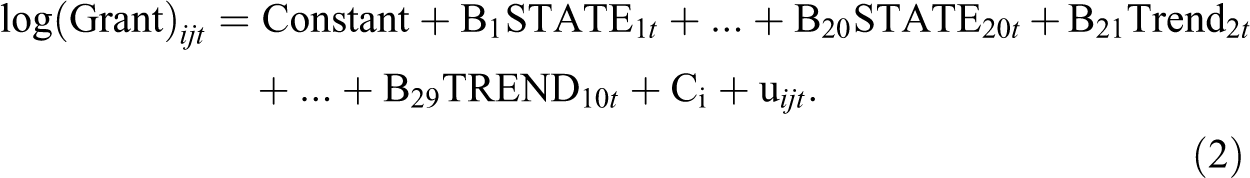
During the time period considered, there were twenty states with at least one House member on the HAC LHHE committee. The twenty STATE variables in the regression are the number of House members on the LHHE subcommittee from state j for each congressional year t.
The coefficients on the STATE variables are presented in Table C along with the SEs, which show that only the coefficient on the California STATE variable was found to be significant. The coefficients on the other eighteen states for which a coefficient could be estimated were not found to be significantly different from zero. 4 This suggests that the hypothesis of political influence is only supported by the results from California.
For most of the time period covered by the analysis, California had only one HAC LHHE member. The exceptions were the 104th, 106th, and the 107th Congresses, in which there were two. These Congresses constitute three of the last four periods included in the analysis and also include the period during which the NIH budget was doubling. Since this approximated a dummy variable for the last four periods, a California dummy variable (CA9501) for the last four Congresses (104th through 107th) was included in the regression. The results show that none of the political variables are significant (Table B, model 3), but the dummy variable CA9501 is significant.
Conclusion
My reexamination of the Hegde and Mowery (2008a, 2008b) and Hegde (2009) papers highlights three problems that can undermine the results obtained. Solid results require good data, a good model, and a reasonable interpretation of the results.
The data used for the two papers suffered from two problems that were not adequately addressed: the lack of a unique identifier to correctly identify organizations over the time frame of the study, and the fact that the political variables in New York (Al D’Amato) and California (HAC_LHHE) effectively split the data in these two states into two periods, which picked up on the slower growth in New York, in part due to data errors, and the faster growth of California. When corrections were made to the New York portion of the data and a dummy variable (CA9501) was included for the last four Congresses in California, none of the political variables were found to be significant. The model that fit the data the best contained the CA9501 dummy variable and none of the political variables (Table B, model 4).
Given that the political variables are not significant when the California portion of the data is omitted (Table B, model 2), these variables are not significant when a dummy variable (CA9501) is added in California for the last four Congresses (Table B, model 3), they are not even significant when the dummy variable CA9501 is added to the original model (constant trend) with the original and uncorrected data (Table A, model 5), and the addition of only one HAC LHHE subcommittee member in California creates the strong correlation with the disproportionate growth in NIH funding at California organizations (Table C), the question that should be asked is: what is a reasonable interpretation of these results? Was political manipulation at work or is it more likely that California organizations were in a position to benefit from the rapid growth of the NIH budget during that time period? An examination of the specific organizations in California with disproportionate levels of growth would be the place to start that inquiry.
Footnotes
Author’s Note
The idea for this article emerged from discussions with former colleagues at Health Research, Inc., who included Carmen Mannella, Andrew Reilly, Martin Sorin, and Lawrence Sturman, retired Director of the Wadsworth Center, who led the way in analyzing issues related to biomedical funding in New York State.
Acknowledgments
Special thanks go to Martin Sorin who made many valuable comments. Additional thanks go to the anonymous reviewers.
Declaration of Conflicting Interests
The author(s) declared no potential conflicts of interest with respect to the research, authorship, and/or publication of this article.
Funding
The author(s) received no financial support for the research, authorship, and/or publication of this article.
Notes
References
Supplementary Material
Please find the following supplemental material available below.
For Open Access articles published under a Creative Commons License, all supplemental material carries the same license as the article it is associated with.
For non-Open Access articles published, all supplemental material carries a non-exclusive license, and permission requests for re-use of supplemental material or any part of supplemental material shall be sent directly to the copyright owner as specified in the copyright notice associated with the article.