
Abstract
The aim of this article is to adapt definitions and tools currently used in the economic literature on poverty to individual data on tax evasion. The article presents composite indices and profiles of tax evasion based on the three I’s of tax evasion: incidence, intensity, and inequality, following the approach of Shorrocks’s study and Jenkins and Lambert’s study that proposed the three I’s of poverty. In the field of tax evasion, one stream of literature produces a potentially large amount of individual microdata using tax benefit and agent-based models: the article enriches the analysis offered by these models with indices that take into account the entire distribution of taxpayer evasion rates. Particularly, the article presents a new composite index of tax evasion that incorporates a concentration index of individual tax evasion rates. A final section shows a sensitivity analysis of tax evasion indices and profiles through numerical simulations.
Tax evasion measures are usually constructed as simple indices, such as the percentage of tax evaders, the percentage of income unreported, and the percentage of unpaid taxes. However, it is possible to borrow some definitions and graphic tools from the economic literature about poverty that can shed light on some other features of tax evasion.
Since Sen (1976), the literature about poverty measurement has derived many axioms, measures, and graphic tools that can be widely used in analyses relating to distributional issues. One important stream of literature focused on poverty indices is expressed in terms of normalized poverty gaps. In particular, it is worth recalling the three I’s of poverty (TIP) curve, defined by the components of Sen’s index: incidence, intensity, and inequality. Following this approach, Shorrocks (1995) as well as Jenkins and Lambert (1997) defined a curve examining these three I’s, called the poverty gap profile or the TIP curve. More recently, Zheng (2000), Xu and Osberg (2001), and Xu (2003) derived a synthesis of the poverty indices proposed by Sen (1976), Thon (1979), and Shorrocks (1995) from the poverty gap profile known as the Sen–Shorrocks–Thon poverty index.
In the field of tax evasion, if individual data are available, some analogies to the poverty measurement become obvious. In the same way as the ith individual of an income distribution is defined “poor” by comparing income yi
with a poverty line z
Any analysis of tax evasion, however, is more complex; in the case of poverty, the reference level is equal for all individuals in a given population, namely, the poverty line z; while in the case of tax evasion, the reference level is the true income (or the amount of owed taxes), which differs among individuals.
Therefore, while poverty gaps and incomes of the poor are ordered in the opposite way
In the field of tax evasion, individual, microlevel data are rarely available. However, agent-based models 1 and laboratory experiments 2 can potentially produce a large amount of individual data for analysis. The aim of this article is to enrich the results of these models by adapting some tools currently used in the economic literature on poverty to tax evasion measurement.
The second section presents some simple indices of tax evasion and tax compliance. The third section borrows the concept of the TIP curve and employs it to derive a family of tax evasion profiles. The fourth section presents a new composite index of tax evasion and the fifth section shows a sensitivity analysis of tax evasion indices and profiles through numerical simulations. The sixth section offers brief concluding remarks.
Definitions and Simple Indices of Tax Evasion
Tax evasion occurs when a taxpayer deliberately misrepresents the true state of his or her affairs to the tax authorities to reduce the tax liability. This behavior includes dishonest tax reporting, such as declaring less income, or overstating deductions. In general, individual tax liability depends on a definition of taxable income, that is, the difference between gross income and personal deductions, of a tax schedule and of individual tax credits. A taxpayer can try to evade by declaring a lower gross income or by overestimating tax deductions and tax credits. Therefore, the resulting tax gap can depend either on an underreporting behavior of the taxable income or on the overestimation of tax credits.
There are many possible measures of tax evasion, as we can examine either the number of tax evaders, or the amount of reported/unreported incomes, or the amount of paid/unpaid taxes. 3
Consider a society with N individuals

and
that is, by definition,

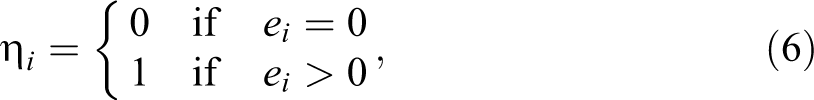
If the income tax owed is

and the individual tax evasion rate is
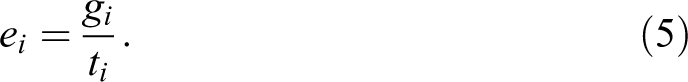
The binary variable η i can be used to identify tax evaders:
in which a value of “1” is assigned to an “evader” and “0” is assigned to a “full complier.”
The number of evaders, NE is

With these elements, we can then define:
the total amount of true taxable incomes (M) and the amount of tax evaders’ incomes (ME
):

the amount of incomes declared by all individuals (X) and by tax evaders (XE
):

and the amount of unreported income:

In the same way, it is possible to define the total amount of taxes potentially owed by all individuals

With the above definitions, it is possible to calculate some indices of tax evasion, as shown in table 1. The first-three indices can be related to a concept of incidence:
the incidence of evaders, H, that is, the proportion of tax evaders in the population (the head count ratio of tax evaders),
the incidence of evaders’ true taxable incomes, HM, that is, the proportion of true taxable income reported by tax evaders on the total amount of true income, and
the incidence of evaders’ owed taxes, HT, that is, the proportion of taxes potentially owed by tax evaders.
Incidence and Intensity of Tax Evasion and Compliance Indices.

The other four indices in table 1 are average rates of evasion and can be associated to a concept of intensity: the intensity of underreporting, the intensity of underreporting of tax evaders, the intensity of tax evasion, the intensity of evaders’ tax evasion,
In general, indices of underreporting and indices of tax evasion are different. They have the same values in case of flat tax without tax credits because in this case, incomes and taxes are proportional.
Tax Evasion Profiles
If individual or aggregated data are available, it is possible to draw a curve, the tax evasion profile, which summarizes the three I’s—incidence, intensity, and inequality—of tax evasion.
The profile represents the cumulative values of a “tax evasion variable”
In general, the profile of a tax evasion variable y can be defined as follows:

in which:
the notation
In the case of poverty, there are two possibilities, as the poverty profile can be defined by using either absolute poverty gaps or poverty gaps normalized with the poverty line.
When dealing with tax evasion, it is possible to define a series of profiles depending on the following choices:
regarding the reference variable on the horizontal axis (w): (a) cumulative population share, (b) cumulative true taxable income share, and (c) cumulative owed taxes;
regarding the tax evasion variable on the vertical axis (y):
(d) cumulative unreported income share and
(e) cumulative proportions of unpaid taxes; and
regarding the values of the proportions of the tax evasion variable:
(f) absolute values and
(g) normalized values.
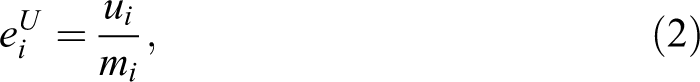
Combining the three types of choices, we can build up twelve profiles. To simplify the analysis, it is more convenient to focus firstly on the normalized tax gap profile, based on the following choices: cumulative share of owed taxes (in the horizontal axis), cumulative share of tax gaps (in the vertical axis), normalized by the total amount of owed taxes, and individuals arranged in decreasing order according to the individual rates of tax evasion.
Individual owed taxes share is defined by 
A tax evasion profile.
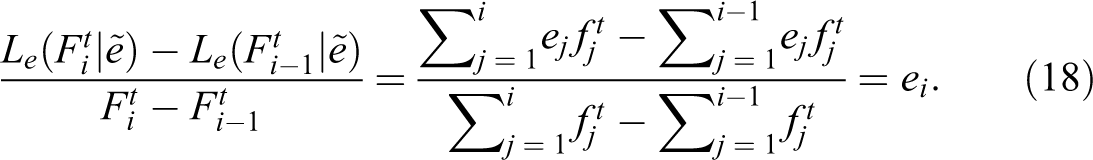
For the ith individual, the normalized tax gap share is

which is equal to the individual rate of tax evasion ei
weighted with the owed taxes share

which is a function of
For all evaders, that is, for all

and the maximum value of the profile is equal to the intensity of tax evasion, that is, the average rate of evasion for all individuals (the ordinate of point A in figure 1):

The curve starts from (0,0) and increases as subsequent tax evaders are added. Each segment represents a tax evader. For individual i, the slope of the segment is equal to his or her rate of tax evasion:
This means that segments have decreasing slopes as subsequent tax evaders have decreasing rates of tax evasion. When ei
becomes zero, subsequent individuals are full compliers and no additional evaded taxes are added; therefore, the curve becomes horizontal to the right of point A. The coordinates of point A represent two indices of tax evasion: on the horizontal axis, the dotted line shows the incidence of evaders’ owed taxes (HT), while on the vertical axis, the dotted line shows the intensity of tax evasion (
The inequality among tax evasion rates is highlighted by the concavity of the curve OAB. The slope of the dashed straight line joining the origin to point A is equal to the ratio:
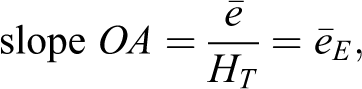
which is the average rate of tax evasion of evaders. The slope of the dashed straight line OB is equal to the intensity of tax evasion
As an example, consider the microlevel data of table 2. There are ten people with true taxable income ranging from 20 to 100. Five of them are tax evaders, and their rates of underreporting vary from 20 percent to 70 percent. With a constant tax rate of 30 percent and a tax credit equal to five (i.e.,
Example of Individual Data on Tax Evasion.
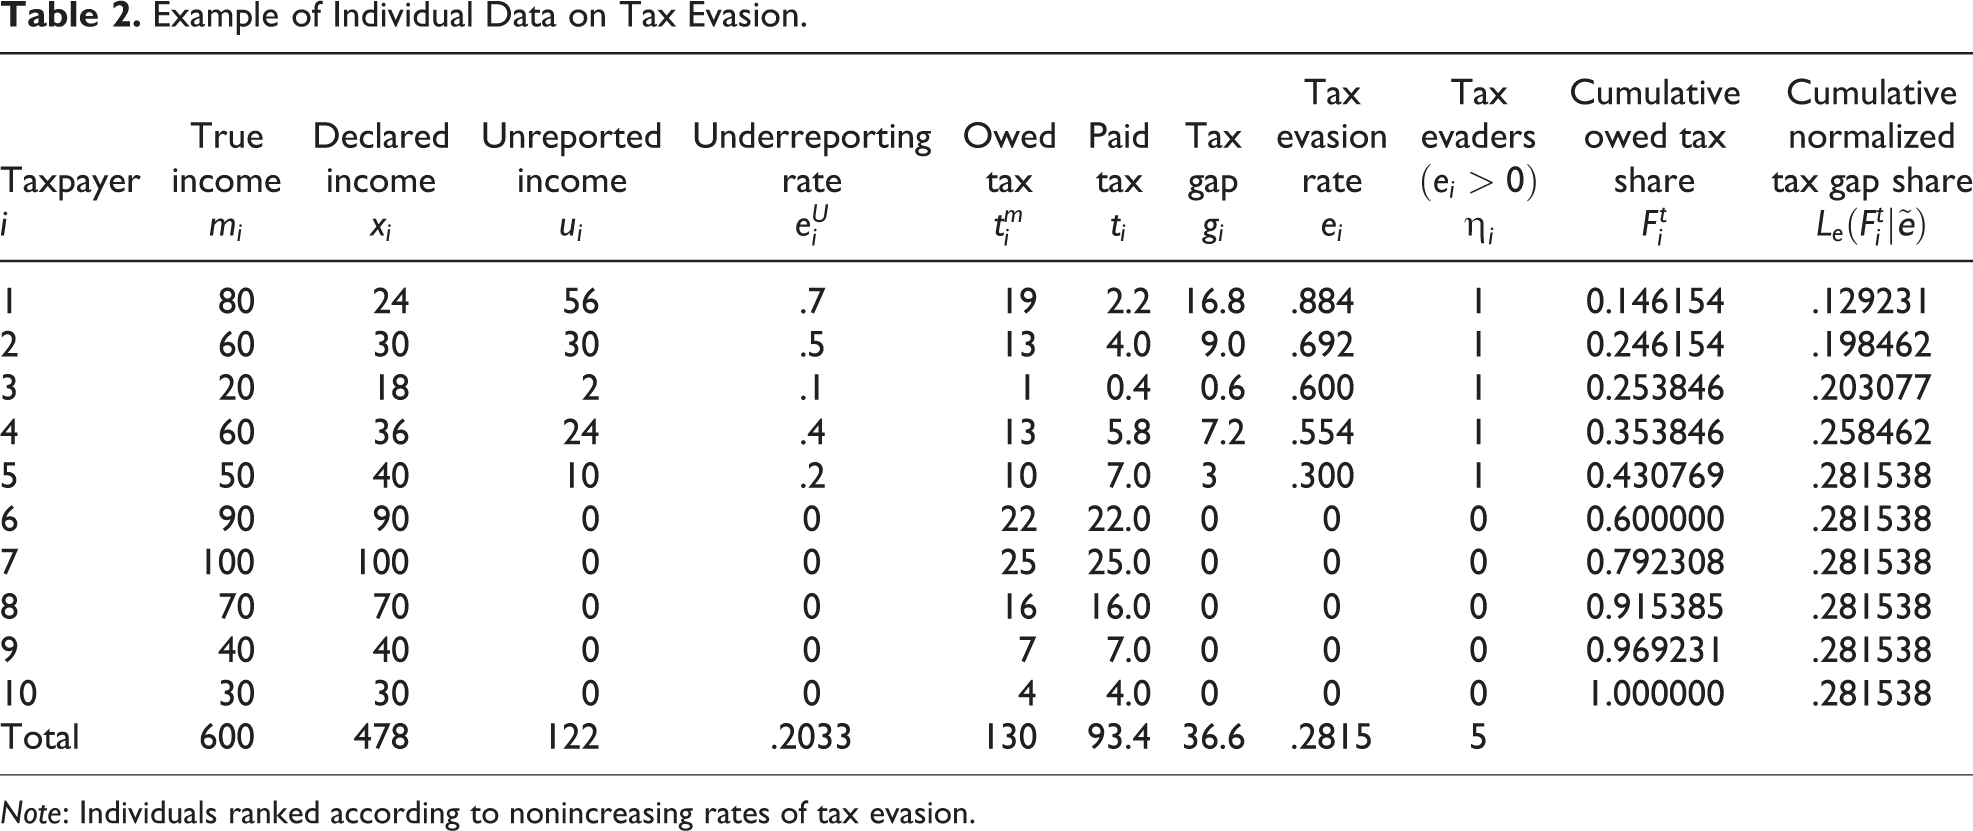
Note: Individuals ranked according to nonincreasing rates of tax evasion.
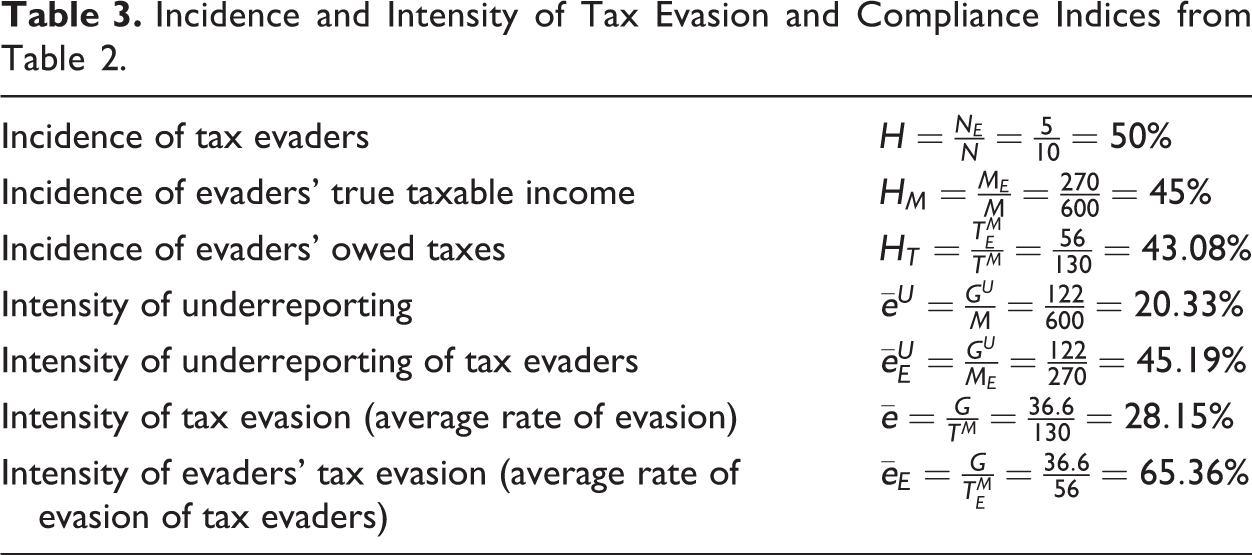
Incidence and Intensity of Tax Evasion and Compliance Indices from Table 2.
A Composite Index of Tax Evasion
A composite index of tax evasion can be derived from the normalized tax evasion profile (figure 1) by normalizing the area below the curve by the maximum value of the area.
The maximum area below a tax evasion profile is reached when “all evade all taxes,” that is, when the incidence of evaders’ income is
The tax evasion profile defined in the third section is an inverted Lorenz curve that represents the cumulative share of normalized tax gaps:
where individuals are arranged in nonincreasing order with respect to their tax evasion rates, that is,
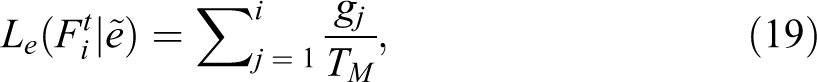
The shaded area below the profile in figure 1 can be calculated using the geometric method: with N individuals, the area is the sum of N trapezoids. For the ith trapezoid, the parallel bases are the values of the ordinates, that is,
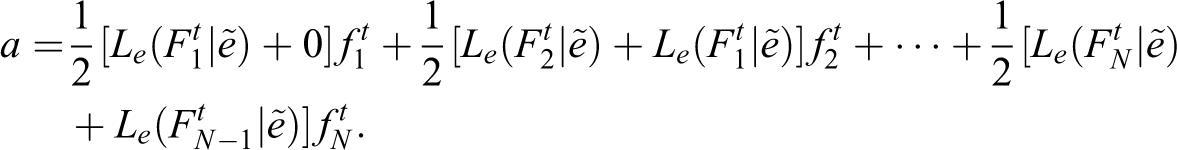
Rearranging and substituting
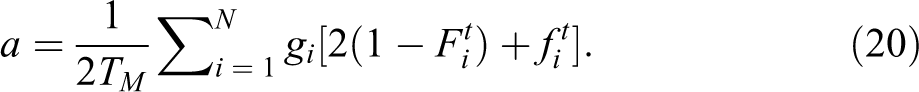
To obtain the composite index of tax evasion, we normalize the area a with respect to the maximum value of the area when all evade all taxes (equal to 1/2), therefore:

From figure 1, it is also possible to compute a concentration index of evasion using rates of tax evasion weighted by shares of owed taxes, as

Substituting equation (21) into equation (22) and solving for E, the composite index of tax evasion becomes

The concentration index changes sign when elements are arranged in the opposite order,
4
that is,

Index E has the following lower and upper limits: E = 0 if all individual tax evasion rates are 0, as in this case E = 1 if all individual tax evasion rates are 1, therefore
As

Index E incorporates the three I’s of tax evasion:
5
the incidence of evaders’ owed taxed: HT, the intensity of tax evasion among evaders: the inequality of tax evasion rates:
Since

so the incidence of evaders (H) as well as the ratio of average evaders’ owed taxes,
Using the same methodology, other profiles and indices related to tax evasion and compliance are obtained in Online Appendix 1. A welfare interpretation of the composite index of tax evasion is provided in Online Appendix 2.
Sensitivity Analysis of the Tax Evasion Index E
In order to provide an example of tax evasion profiles and indices in comparing different situations, we generate some distributions of rates of evasion by simulating numerically a society composed of individuals with different characteristics. We define the individual utility as the product of two components. A first part is a standard concave utility function of income: 7

where yi
is net income and
A second part is an individual scale factor positively linked to the attitude to comply: 8

where ei
is the tax evasion rate,

Income tax is applied at a constant rate τ and with a fixed tax credit c. The true amount of taxable income is mi
, which is not known to the government. Hence, the amount of owed tax is

If the taxpayer is not audited, the net income is

If, instead, the taxpayer’s records are inspected, the net income is

Following the standard Allingham–Sandmo–Yitzhaki 9 framework, each taxpayer chooses tax evasion rate, ei , in order to maximize the expected utility:

given the tax rate, the probability of auditing, and the fine rate.
Two tax evasion profiles are simulated. Simulation A is characterized by the lower levels of tax rate, probability of auditing and fines, but a greater disposition to comply as compared to simulation B (see table 4).
Simulated Tax Evasion Profiles.
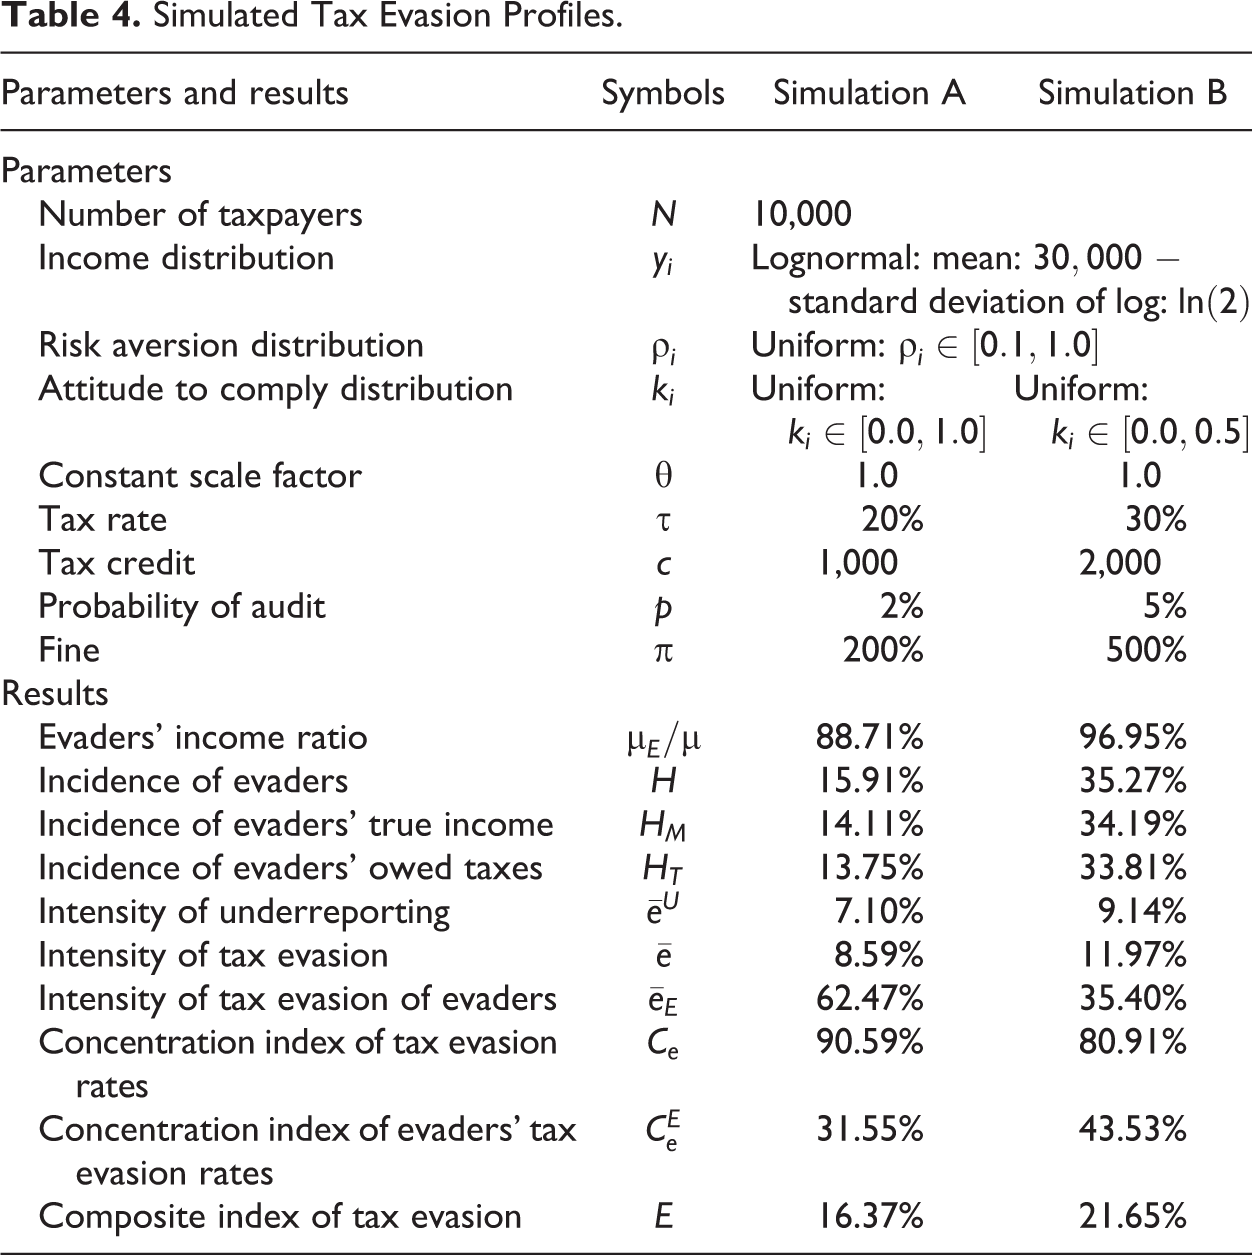
Using the terminology of Kirchler, Hoelzl, and Wahl (2008), the society described by simulation A has more “trust” and less “power” than that described by simulation B. The resulting indices and profiles are shown in figure 2. The composite index of tax evasion is E = 16.37 percent in simulation A and E = 21.65 percent in simulation B. In simulation A, incidence and intensity indices are lower than in simulation B, while the inequality of evasion rates is higher (the concentration index Ce is 90.59 percent vs. 80.91 percent).
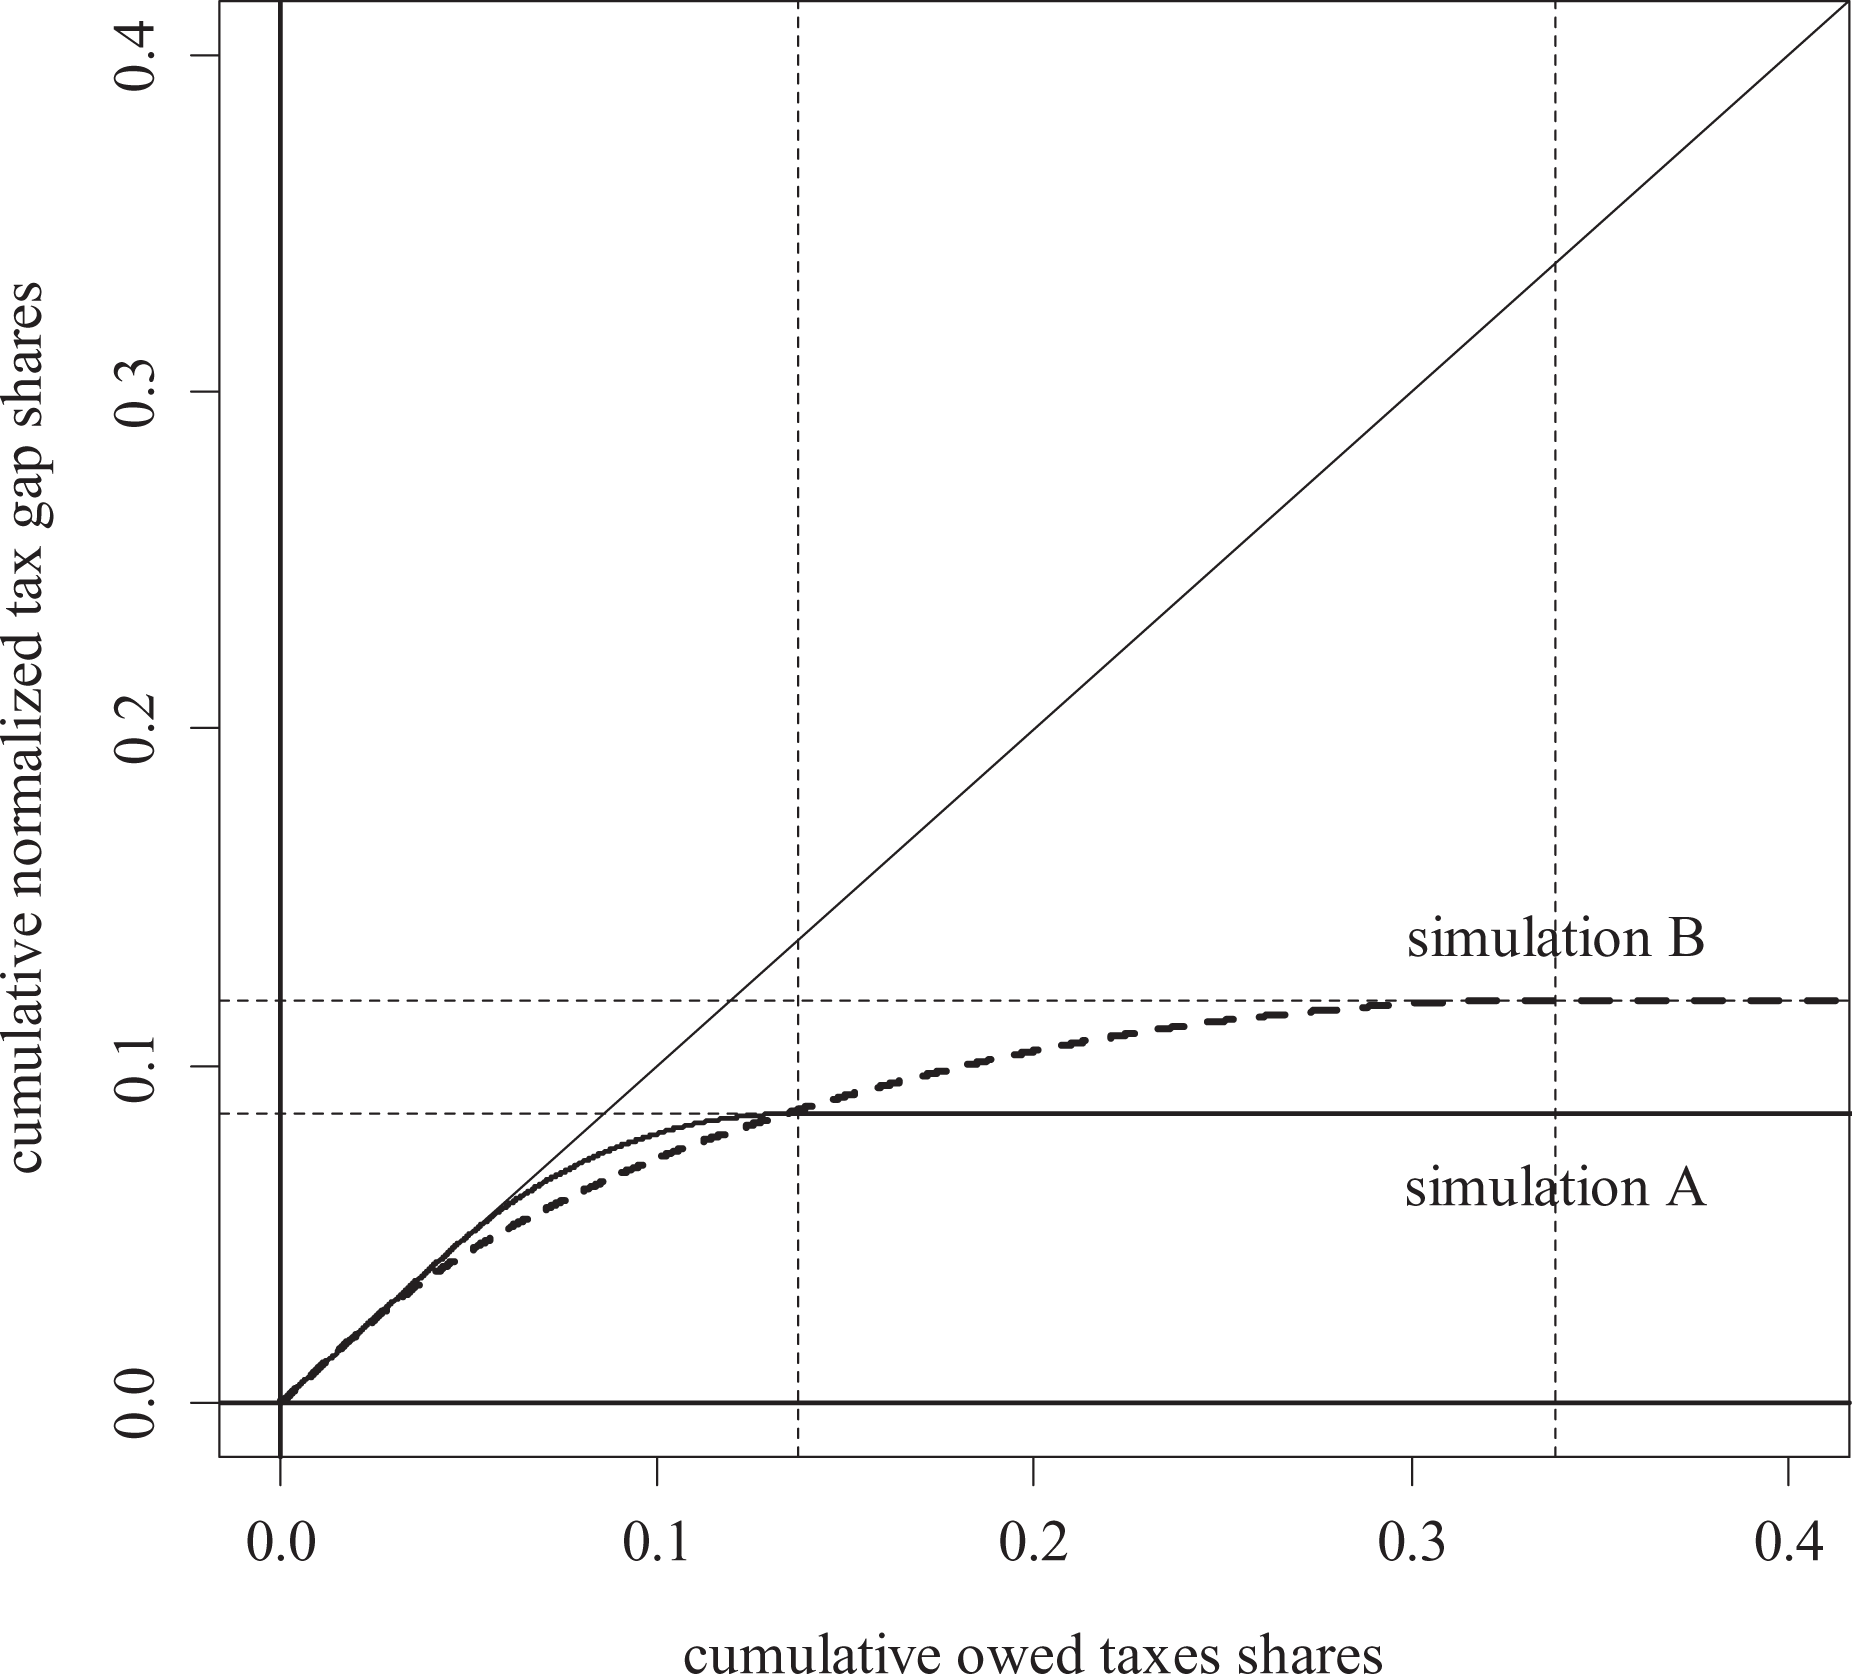
Simulated tax evasion profiles.
From figure 2, we can see that the two profiles intersect, so it would be possible to study the conditions for tax evasion dominance (see Jenkins and Lambert 1997).
To provide a better understanding of the composite index of tax evasion, a sensitivity analysis is performed by using the setting of simulation B and varying some parameters.
First of all, various distributions of income with different levels of inequality are simulated by varying the variance in the lognormal distribution in order to obtain a sequence of Gini indices from .2 to .8. The results are shown in figure 3. With increasing income inequality, the incidence of tax evaders (H) and the incidence of evaders’ owed taxes decrease (HT), while the concentration index Ce increases and the average tax evasion rate seems rather stable. The ratio of average tax evaders’ income on the overall average income decreases, so that tax evaders have progressively lower incomes. As a result, the composite index of tax evasion tends to decrease as income inequality raises.

Tax evasion indices with different income inequality.
Another simulation assesses the behavior of the composite tax evasion index as the tax rate increases (see figure 4). The composite index increases, following the incidence of evaders, the incidence of evaders’ owed taxes and the average tax evasion rate. Conversely, the index goes in an opposite direction with respect to the evaders’ average tax evasion rate and the concentration index.
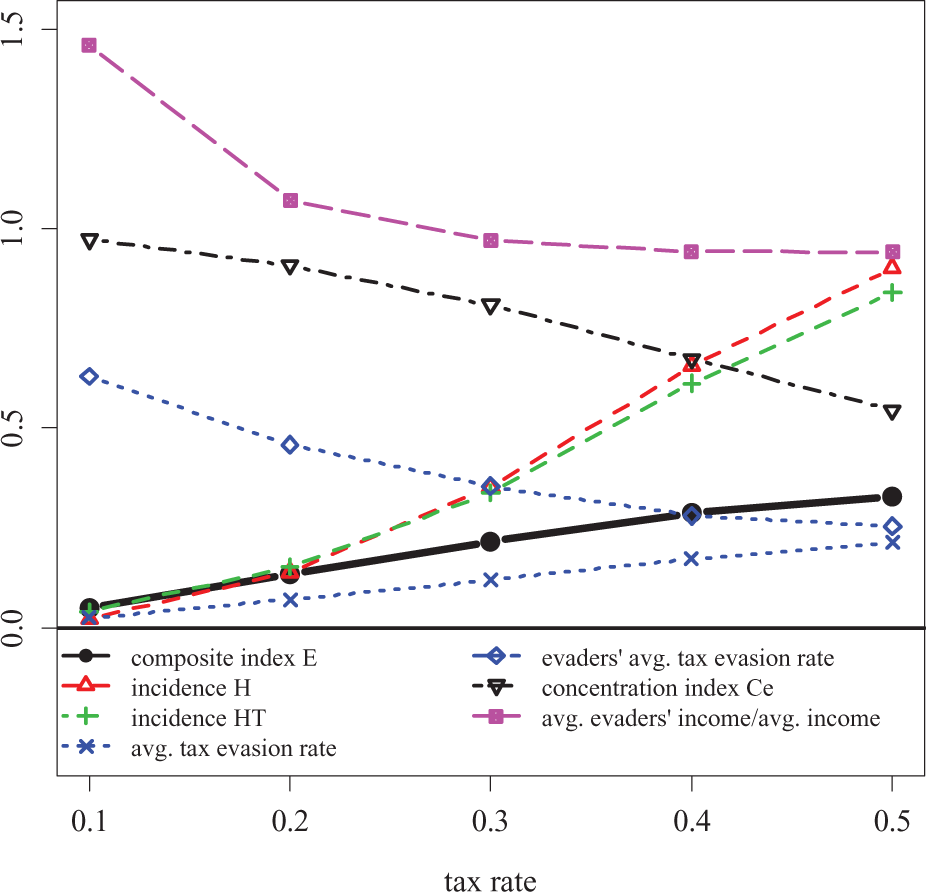
Tax evasion indices with different tax rates.
In both simulations, incidence and intensity indices of tax evasion give a rather different picture with respect to the composite index. It incorporates several aspects of tax evasion, so that it is interesting to observe them separately as well as to summarize them in an aggregate index.
Conclusions
This article proposes a family of profiles and composite indices that can help to investigate tax evasion and tax compliance. In particular, they allow decomposing the phenomenon into three main components: incidence, intensity, and inequality.
A profile and a composite index of tax evasion can be very useful when analyzing large amounts of individual level data produced by tax benefit models or by agent-based models of tax evasion, which are increasingly used in the literature.
The tax evasion profile can also be used even if few aggregate data about tax evasion are available for some taxpayers’ characteristics. For instance, if we knew that in a country, the self-employed earned 30 percent of gross national income with a tax evasion rate of 35 percent, while employees earned the remaining 70 percent and had a tax evasion rate of 5 percent, then we could easily develop a tax evasion profile and compute the average tax evasion rate (14 percent), the concentration index (45 percent), and the composite index of tax evasion (20.3 percent). 10
The composite index of tax evasion has an interesting welfare interpretation. As shown in Online Appendix 2, the index can be associated to the concept of equally distributed equivalent tax evasion rate, that is, the tax evasion rate that would generate the actual level of welfare if uniformly assigned to each taxpayer. The interpretation is that the society would be willing to accept a larger average tax evasion rate if the inequality between tax evasion rates is removed. Therefore, the usual average tax evasion index is just the minimum value of the composite index, as the presence of inequality among individual tax evasion rates modifies the social judgment about the importance of tax evasion.
Footnotes
Acknowledgments
The author would like to thank Michele Bernasconi, Paolo Pellizzari, Francesca Zantomio, the two anonymous reviewers, and James Alm for their helpful comments and suggestions.
Declaration of Conflicting Interests
The author(s) declared no potential conflicts of interest with respect to the research, authorship, and/or publication of this article.
Funding
The author(s) received no financial support for the research, authorship, and/or publication of this article.
Notes
References
Supplementary Material
Please find the following supplemental material available below.
For Open Access articles published under a Creative Commons License, all supplemental material carries the same license as the article it is associated with.
For non-Open Access articles published, all supplemental material carries a non-exclusive license, and permission requests for re-use of supplemental material or any part of supplemental material shall be sent directly to the copyright owner as specified in the copyright notice associated with the article.