
Abstract
This article evaluates whether changes in relative earnings across majors due to a federal tax reform are likely to affect college major choice. I first estimate the change in expected after-tax lifetime income due to the 1986 Tax Reform Act for 47 majors. I find that the average major experienced an increase in expected after-tax lifetime income of 6.2 percent and that the standard deviation of major-specific expected lifetime income premia increased by 6.1 percent. I estimate the impact of the change in relative earnings on the distribution of completed college majors, finding no statistically significant change in the composition of majors following the reform. Consistent with the estimation, simulations reveal that at most 0.25 percent of males completed a different major in response to the reform.
A large literature estimates the elasticity of taxable income. This literature captures mostly the short-run effects of tax changes on efficiency including changes in hours worked, form of compensation, and occupational choice. However, other less studied responses can take longer to show up in the data and have important implications for the long-run effects of tax changes on efficiency. 1 In particular, changes in the tax law may not only affect the amount of education that a person chooses to obtain, as examined by Lucas (1990) and Trostel (1993), but also the type of education pursued. For instance, in college, a reduction in marginal income tax rates should induce students to switch from majors leading to pleasant but low-paying jobs to majors leading to less pleasant but higher-paying jobs. In this article, I examine whether changes in the personal income tax law are likely to affect college major choices, using one of the largest federal income tax reforms in recent US history, the 1986 Tax Reform Act (TRA86), as a case study. In doing so, I am the first to empirically study the effect of personal income taxation on the choice of educational type.
The expected lifetime earnings of a major have been shown to be an important determinant of college major choice (Berger 1988; Arcidiacono 2004; Arcidiacono, Hotz, and Kang 2012; Wiswall and Zafar 2015a), suggesting a link between the tax law and the choice of college major. However, the current literature on college major choice uses future pre-tax earnings as a proxy for future income streams. 2 There has not yet been a study linking changes in the personal income tax law to changes in the choice of college major.
Identifying whether changes in the tax law are likely to affect college major choice is important beyond the implications it has for the long-run effects of tax changes on efficiency. Due to the perceived lack of individuals majoring in STEM subjects, there is a strong interest in policies that have the potential to influence college major choice (Altonji, Arcidiacono, and Maurel 2016). In addition, an individual’s college major has a large impact on his or her future earnings (Weinberger 1999; Arcidiacono 2004), making it important to assess the role of tax policies in choosing a major.
TRA86 was a largely regressive reform that simplified the income tax law by reducing the number of marginal tax rates and broadening the tax base. It is considered one of the largest federal income tax reforms in recent US history and, when compared to other large tax reforms such as the Tax Cuts and Jobs Act of 2017, had a very large differential effect across the income distribution. This large differential effect resulted in significant differential changes in expected after-tax lifetime earnings across majors, making TRA86 particularly suited for studying the link between personal income tax laws and college major choice. Surprisingly, despite its size, I find that TRA86 is likely to have had no significant impact on college major choice decisions.
I start by estimating the change in expected after-tax lifetime earnings by major due to TRA86. Data which would enable me to easily do so, namely, extensive survey data that contain information on individuals’ educational type and earnings for many cohorts of college graduates, are not available before 1993. To overcome this problem, I first use the 1993 National Survey of College Graduates (NSCG) to construct a distribution of college graduates across occupations by age group and college major. I then link these distributions to average after-tax incomes by occupation and age group, calculated under both the pre- and post-TRA86 tax law and with pre-TRA86 March Current Population Survey (CPS) data, to get an estimate of the change in expected after-tax lifetime earnings by major due to TRA86 for a total of 47 majors. As the number of female college graduates in both the 1993 NSCG and in the March CPS is small, I only calculate these major-specific changes for males and focus on males throughout this article.
Next, using aggregate annual data on the composition of completed college degrees of males, I assess whether TRA86 had an observable impact on college major choice. In particular, I test whether, in years following TRA86, there is a positive association between the change over time in the share of college degrees completed in a field and the TRA86-induced change in the expected after-tax lifetime earnings of that field relative to other fields. As these estimates are imprecise and potentially biased due to the presence of various confounding factors, I then also use simulations to examine how the differential TRA86-induced change in expected after-tax lifetime earnings across majors is likely to have affected the distribution of completed college majors. Lastly, I briefly evaluate the welfare effects of this simulated change in the distribution of completed college majors using the framework of Hendren (2016).
I find that the average major experienced a sizable increase in expected after-tax lifetime income of US$58,000 or, equivalently, 6.2 percent due to TRA86. Most of this increase is due to increased after-tax income in the second half of one’s working life. Not all majors benefited equally from TRA86. The amount gained varies significantly across majors from a low of US$39,000 in home economics to a high of US$97,000 in medical sciences and nursing. To further illustrate this differential impact, relative to the mean expected lifetime income across all majors the expected lifetime income premium of the major medical sciences and nursing increased from 24.5 percent to 27 percent, an increase of 10.2 percent, while the expected lifetime income premium of the major home economics decreased from −16.1 percent to −17.1 percent, a decrease of 6.2 percent. Overall, the standard deviation of major-specific expected lifetime income premia relative to the mean expected lifetime income across all majors increased by 6.1 percent from 7.49 percent to 7.95 percent.
Compared to variation in expected earnings isolated in other papers on college major choice, the mean increase in expected after-tax lifetime income due to TRA86 of 6.2 percent is sizable and comparable to the effect that graduating at different points in the business cycle can have on the first five years of labor market earnings (see Beffy, Fougere, and Maurel 2012). On the other hand, the differential effect of TRA86 across majors is many times smaller than this business cycle effect.
Despite being one of the largest income tax reforms in recent US history, TRA86 is likely to only have had a small impact on college major choice. First, I find no statistically significant association between the change over time in the share of a field and the change in the expected after-tax lifetime earnings of that field relative to other fields due to TRA86. Furthermore, the simulations show small effects of TRA86 on the distribution of completed college majors. Under conventional estimates of the elasticity of college major choice with respect to expected earnings, at most 0.25 percent of males graduating after TRA86 are estimated to have completed a different major due to TRA86. This is equivalent to around 10 percent of the average year-to-year change in the distribution of completed college majors as measured by the fraction of this year’s distribution that does not overlap with last year’s distribution. In simulations that take into account the likely low salience of TRA86, this effect is even smaller. Lastly, for a given cohort graduating after TRA86, the corresponding welfare effects are small and positive, and equal to at most 0.04 percent of the expected lifetime income tax payments of that cohort.
This article shows that personal income tax reforms can have a large effect on the mean level of expected earnings of a given level of education but are unlikely to have large differential effects across educational types within that level of education. As a result, tax reforms, including recent reforms such as the Tax Cuts and Jobs Act of 2017, are unlikely to lead to large changes in the types of education chosen. Furthermore, the results of this article imply that current short-run estimates of the elasticity of taxable income with respect to the net-of-tax rate (e.g., Saez, Slemrod, and Giertz 2012), a central parameter for calculating the efficiency losses from taxation, are not heavily understating the long-run elasticity. These current estimates would not be heavily impacted by a very small change in the composition of completed college majors in the long run as a result of a tax change.
This article proceeds as follows. The second section discusses the related literature. The third section briefly describes TRA86. The fourth section describes the data. The fifth section discusses the methodology. The sixth section presents the effect of the tax change on expected after-tax lifetime earnings by major. The seventh section discusses the estimated and simulated effect on college major choice and the eighth section concludes.
Related Literature
Personal income taxation can cause many distortions to individuals’ behavior. The distortion that has been studied most frequently is to hours of work. Other possible distortions include distortions to effort, form of pay, occupational choice, and educational choice. In terms of educational choice, both the type and level of education that an individual chooses to obtain can be distorted. The literature has mostly focused on the distortion to the level of education and ignored the distortion to the type of education. 3,4
There is a large literature on the determinants of college major choice. This literature has found the expected earnings of a major to be an important determinant (e.g., Berger 1988; Arcidiacono 2004; Beffy, Fougere, and Maurel 2012; Arcidiacono, Hotz, and Kang 2012; Hastings, Neilson, and Zimmerman 2015; Long, Goldhaber, and Huntington-Klein 2015; Wiswall and Zafar 2015a, 2015b; Altonji, Arcidiacono, and Maurel 2016; Altonji, Kahn, and Speer 2016), although less so than the consumption value of a major (e.g., Arcidiacono 2004) or individuals’ major-specific abilities (e.g., Freeman and Hirsch 2008; Stinebrickner and Stinebrickner 2014). 5 As a measure of students’ expected earnings in a major, some papers have used students’ stated expected earnings (e.g., Arcidiacono, Hotz, and Kang 2012; Wiswall and Zafar 2015a, 2015b), while others (e.g., Berger 1988; Beffy, Fougere, and Maurel 2012) have generated students’ expected future earnings under the assumption of rational expectations and with an econometric model estimated with actual future earnings data. Lastly, some papers (e.g., Long, Goldhaber, and Huntington-Klein 2015) have used population-based average earnings of college graduates with a particular major at the time that students are in college as a proxy for students’ expected future earnings in a major. All these papers have found their measure of expected earnings to be an important determinant of college major choice.
Key to the approach of this article are the results of Wiswall and Zafar (2015a, 2015b) and Long, Goldhaber, and Huntington-Klein (2015) that students’ choice of college major responds to changes in the population distribution of earnings by major. At first sight, this is not entirely obvious as many recent papers (e.g., Arcidiacono 2004; Arcidiacono, Hotz, and Kang 2012; Kirkeboen, Leuven, and Mogstad 2016) highlight that the expected monetary returns to a given major can vary dramatically across individuals because they are a function of the multidimensional ability vector of an individual. As a result, one might worry that earnings observed in the population of graduates with a particular major might not be useful to current undergraduates in helping predict their own major-specific lifetime income. The fact that population-based earnings by major do in fact matter for college major choice is key to this article as I calculate the effect that TRA86 had on average after-tax lifetime earnings by major, which will not be adjusted for self-selection into majors and will be based on the actual earnings of people with particular majors observed in the population.
In this article, I hope to add to the college major choice literature discussed above and the literature on the elasticity of taxable income mentioned in the introduction by being the first paper to explicitly consider the effect of changes in personal income taxation on the choice of educational type. This involves first considering how (changes in) personal income taxes affect the expected returns to various majors and then considering how these changes in expected returns affect college major choice patterns.
TRA86
Prior to TRA86, the federal personal income tax schedule had 14 different tax brackets and marginal tax rates that varied from a low of 11 to a high of 50 percent.
6
TRA86 reduced this to essentially two tax brackets and two marginal tax rates. In 1988, when the individual income tax law provisions were fully phased in, a taxpayer filing for instance as a single person faced a marginal tax rate of 15 percent on his first US$17,850 of taxable income and a marginal tax rate of
To compensate for the overall expected revenue shortfall as a result of these measures, TRA86 also included a number of tax base broadening measures and raised corporate income taxes. In this article, I do not consider the potential effect of these changes in corporate income taxes and only focus on the effect that the change in the federal personal income tax law had on major-specific expected lifetime earnings. TRA86 was signed into law by Ronald Reagan on October 22, 1986, and the individual income tax changes went into full effect for the tax (and calendar) year 1988. 7
Importantly, TRA86 is widely recognized as one of the largest federal income tax reforms in recent US history. For instance, Slemrod (2018, 74) refers to TRA86 as the “last time the US income tax was substantially overhauled” before the implementation of the Tax Cuts and Jobs Act of 2017 (TCJA2017). Importantly, when compared to other major tax reforms such as TCJA2017, TRA86 had a larger differential effect across the income distribution. Mertens (2018) compares various large postwar federal individual income tax reforms in terms of their impact on average marginal tax rates (AMTR) 8 at various percentiles of the income distribution. While both TCJA2017 and the Revenue Act of 1964 (RA1964) had a similarly large average effect on the AMTR when measured across the entire income distribution, the effect of TRA86 differed more across the income distribution. Under TCJA2017 and RA1964, the AMTR of the top 10 percent of the income distribution decreased by around 50 percent more than that of the bottom 90 percent of the income distribution. Under TRA86 on the other hand, the percentage point decrease experienced by the top 10 percent was close to 600 percent larger than that of the bottom 90 percent. In the context of this study, this means TRA86 had a much larger differential effect on expected after-tax lifetime earnings across majors than other major tax reforms, making it particularly suited for studying the link between the personal income tax law and college major choice.
Data
To calculate the TRA86-induced change in expected after-tax lifetime income by major, I use two data sources. I use the 1993 NSCG of the National Science Foundation to calculate a distribution of male college graduates across occupations by college major and age group. The NSCG is an extensive survey of around 150,000 college-educated individuals and has information on individuals’ occupations and educational histories. Ideally, I would have used a survey such as the NSCG from before the tax change to calculate these occupational distributions, but no such survey exists.
I also use the 1985, 1986, and 1987 (Unicon) versions of the March Supplement to the Current Population Survey. In this supplement, questions are specifically aimed at respondents’ income and labor market involvement in the previous calendar year. Two aspects of this survey are worth mentioning. First, for each individual, the survey contains information on the principal occupation of the individual in the previous year. This occupation can be linked to the occupations used in the NSCG. Second, since the March CPS is a household survey, it contains information on the sources of income and labor force involvement of all individuals in the household in the previous year. As the March CPS also contains the tax filing status of each individual, this information can then be used to impute the state and federal tax liabilities of the tax filing unit to which the individual belongs for the year on which the March CPS is based.
I impute these tax liabilities in the March CPS using version 9.2 of the National Bureau of Economic Research’s TAXSIM program. 9 This program requires twenty different inputs, which together capture the most important items that one needs to list on form 1040. 10 TAXSIM then uses the federal and state tax law of that year to calculate the state, federal, and payroll tax liabilities of the tax unit in that year. 11
Lastly, data on the number of bachelor degrees awarded by institution, field (i.e., major), gender, and year that is used to estimate and simulate the effect of TRA86 on the composition of completed college majors are obtained from the Higher Education General Information Survey prior to the academic year 1986/1987 and from the Integrated Postsecondary Education Data System (IPEDS) from 1986/1987 onward. These data are a census of the number and types of bachelor degrees awarded at all federally accredited institutions of higher education in the United States from 1983/1984 to 1996/1997. 12 The six-digit code used in these surveys to classify the field of the degree (the Classification of Instructional Programs) is highly disaggregated and distinguishes between close to a thousand fields of specialization. In this article, I distinguish between forty-seven different degree fields. 13
Methodology
Keeping individuals’ before-tax income constant, TRA86 changed the average after-tax lifetime income of a major. To calculate by how much these major-specific incomes changed due to TRA86 alone, I rely on pre-TRA86 income data from a sample of college graduates. 14 In particular, I calculate average after-tax lifetime income by major under the 1985 tax law (before the tax change) and under the 1988 tax law (after the tax change) with income data from 1985 and use the difference as a measure of the mechanical effect of TRA86 on expected after-tax lifetime income by major. By not relying on income data from after the tax change I can isolate the change in expected lifetime income that is due to the tax change alone. Using post-TRA86 income data as well is problematic because these data among other things also capture the effects that economy-wide time trends in wage growth across sectors have on major-specific lifetime incomes. 15 One limitation of this approach is that I might be slightly overstating the relative change in lifetime earnings across majors due to TRA86. By affecting the composition of completed college majors, TRA86 could have general equilibrium effects that, in the long run, could cause the before-tax lifetime earnings to decrease slightly in majors gaining the most from TRA86. 16
I use the concept of synthetic work–life earnings (SWE) to approximate expected after-tax lifetime earnings by major. This concept is used in many census publications (e.g., Julian 2012) and is an “estimate of the amount of money a person might expect to make over the course of a career” (Julian 2012, 1) based on the cross-section of people in the labor force today with the same characteristics as that person. I calculate the SWE of college major h under the tax law at time t for males as follows:


I first calculate the average after-tax income for males in age group s, with major h and under tax law t:
In the March CPS, which I use as the source of the pre-TRA86 income data, I do not observe the college major of college graduates. To construct the average after-tax income by age group and major under the two tax law regimes
Next, I use 1985, 1986, and 1987 March CPS surveys combined with NBER’s TAXSIM program to calculate the average after-tax income (from all sources) of college graduates in occupation k and age group s under the two different tax laws. I start with before-tax earnings of college graduates between the ages of twenty-five and sixty-four from the 1985, 1986, and 1987 editions of the March CPS. For each individual, I then calculate the total after-tax income of the tax filing unit to which that person belongs under both the 1985 and 1988 tax laws using NBER’s TAXSIM program. I define total after-tax income as: income from all sources (including unearned income)
23
− federal income tax liabilities − state tax liabilities
24
− 0.5 × payroll taxes.
25
One issue with
The Effect on Expected Lifetime Income by Major
Figure 1 shows how the average net-of-tax rate (calculated including state and payroll taxes) of a major varies with its 1985 before-tax SWE. The before-tax SWE of a major are calculated in the same way as after-tax SWE, but without subtracting the tax liabilities from individuals’ annual income. The average net-of-tax rate of a major equals the major’s after-tax SWE divided by its before-tax SWE. As is clear from the figure and as can be expected given the progressivity of the tax code, the transformation from before-tax to after-tax SWE by major is nonlinear, both pre- and post-TRA86. The average net-of-tax rate ranges from around 0.65 to 0.70 before TRA86 and from 0.71 to 0.74 after TRA86, and decreases with before-tax SWE. 29 On average, TRA86 caused the average net-of-tax rate across all majors to increase by around 4 percentage points from 0.681 to 0.723. 30

Average pre- and post-1986 Tax Reform Act net-of-tax rates by before-tax synthetic work–life earnings.
Figure 2 displays the TRA86-induced change in after-tax expected lifetime income by major. For each major, the total length of the bar represents the total change in after-tax SWE of that major. The various colored parts of the bars show what share of this change can be attributed to each age group. The dashed line at US$58,000 is the weighted average across all majors when we use a major’s average annual share of all degrees completed between 1983/1984 and 1996/1997 as its weight. US$58,000 represents an increase in expected after-tax lifetime income of 6.2 percent relative to the weighted average pre-TRA86 baseline level of US$930,000 across all majors. The amount gained varies significantly across majors. The standard deviation is US$9,400, and the increase in expect lifetime earnings varies from a low of US$39,000 in home economics to a high of US$97,000 in medical sciences and nursing.
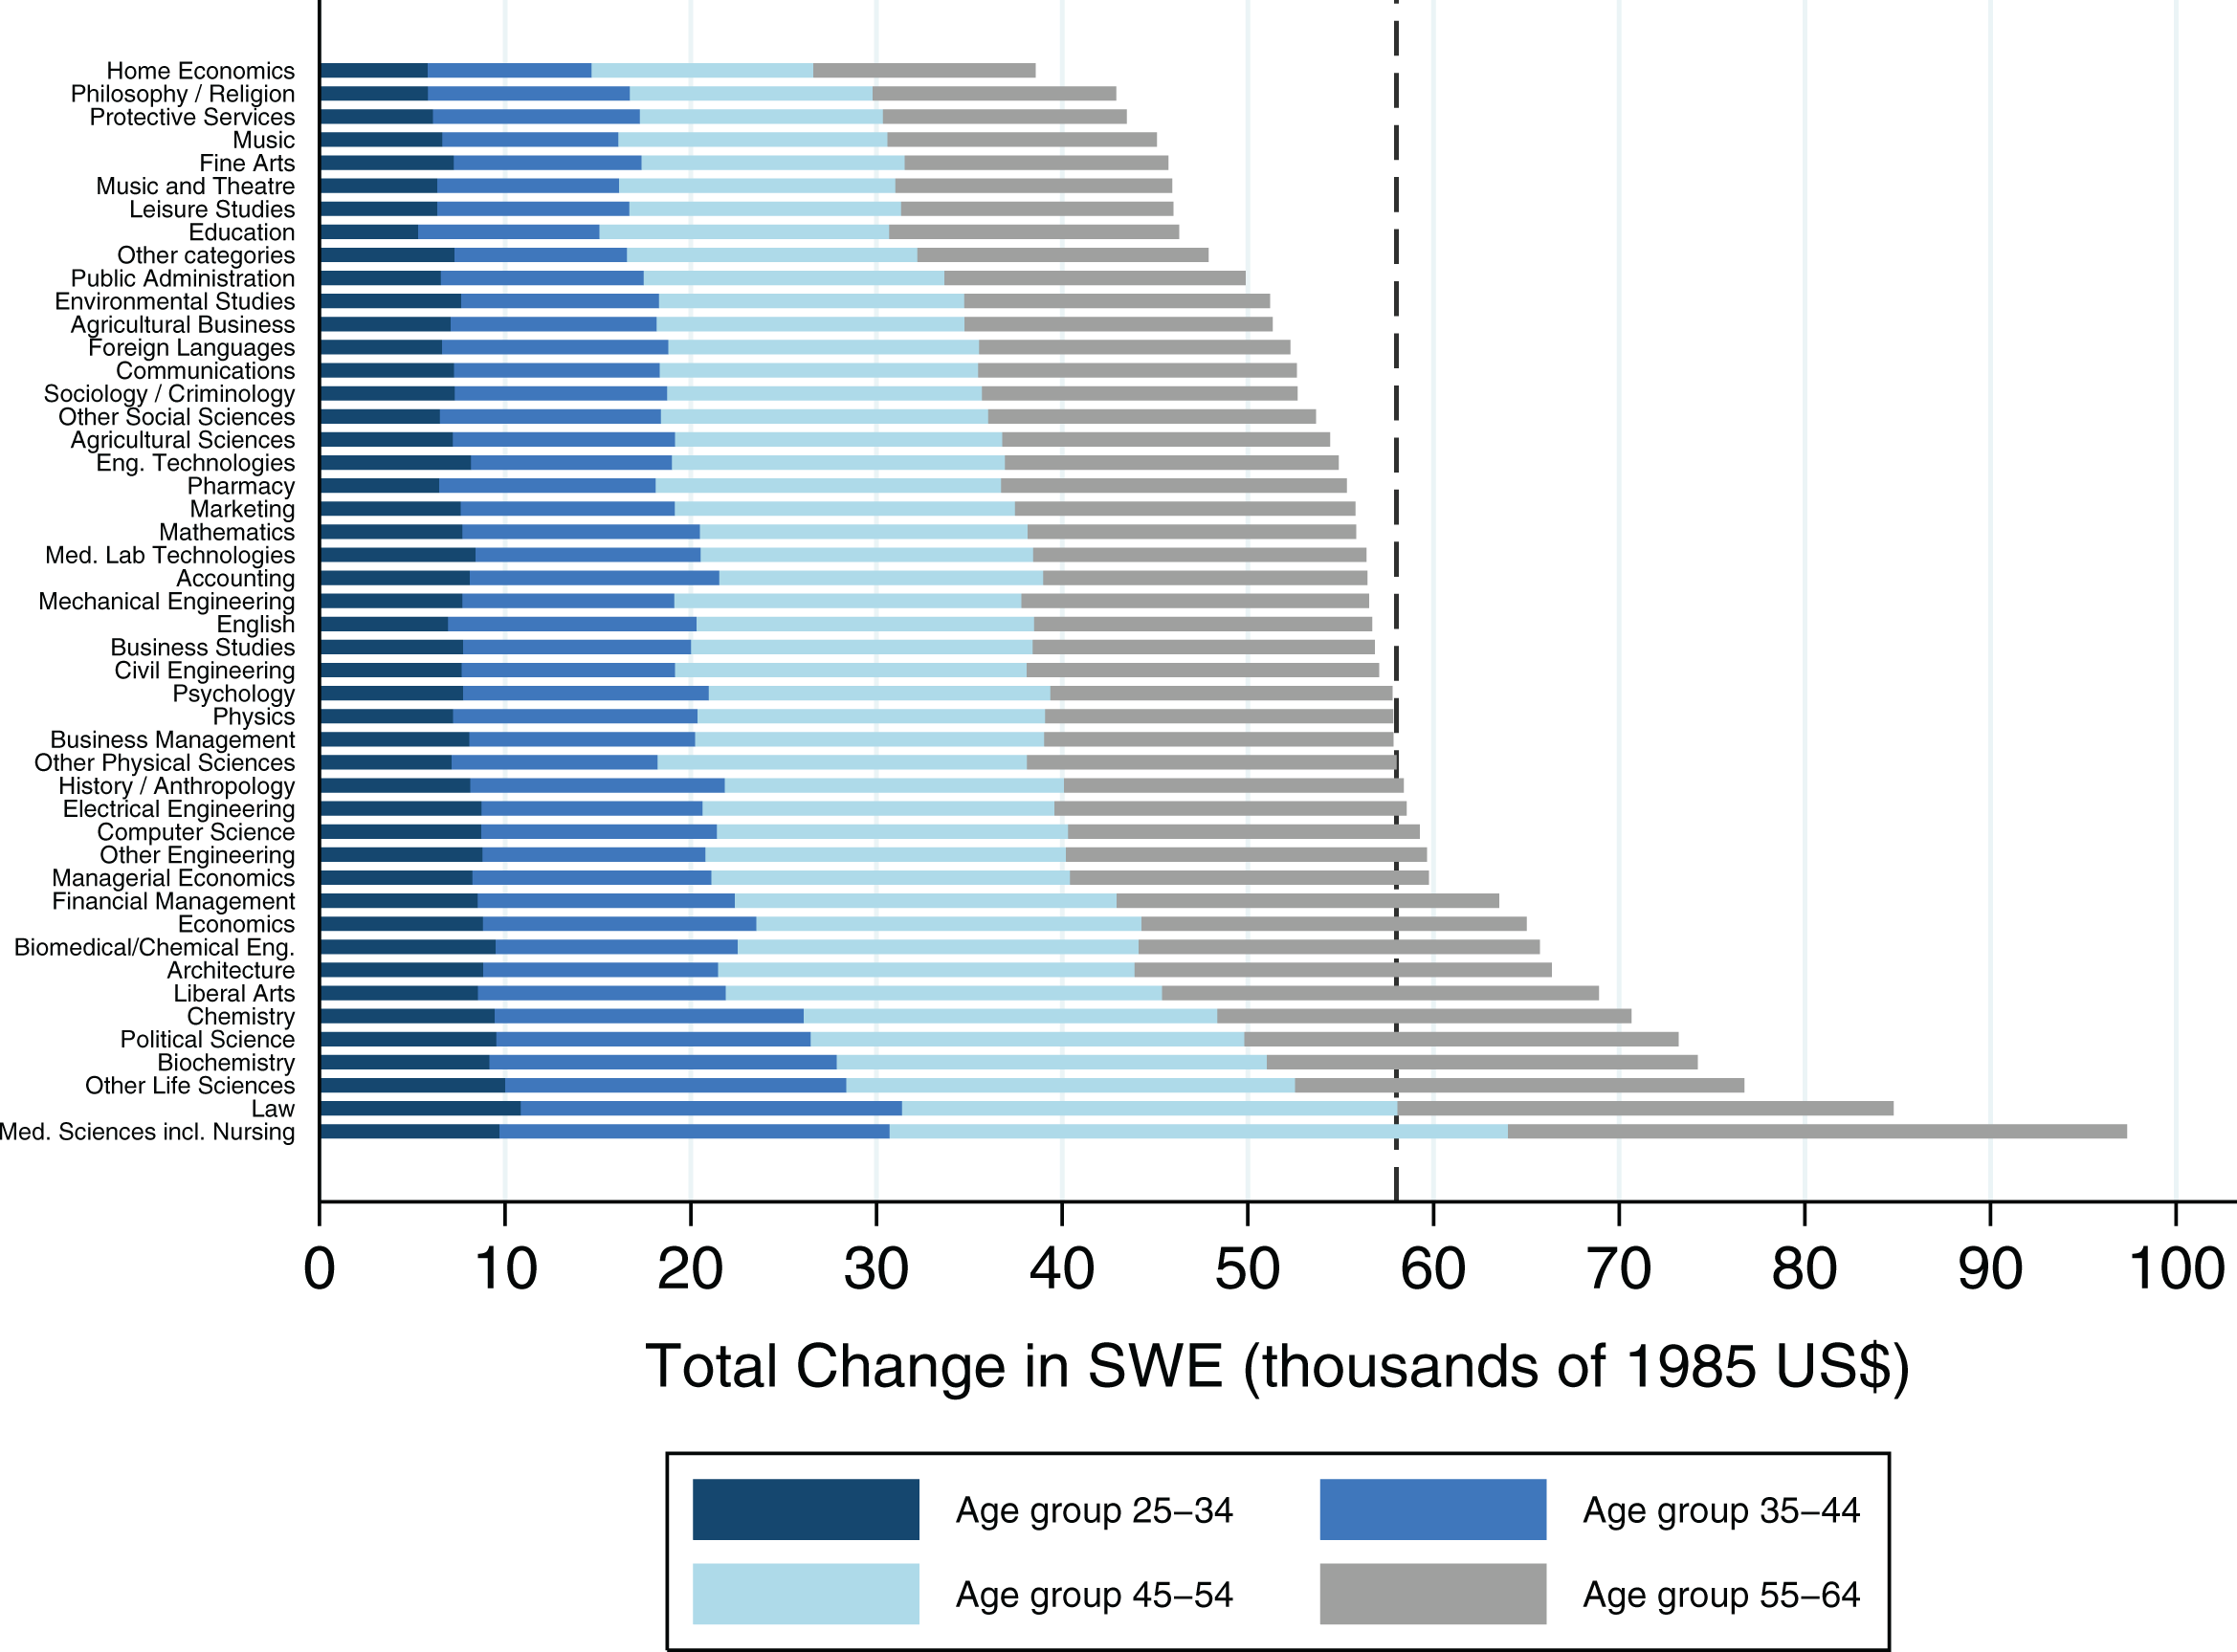
Change in after-tax expected lifetime-income (synthetic work–life earnings) by major due to the 1986 Tax Reform Act. The dashed line represents the weighted average change in SWE across all majors when we use a major’s average annual share of all degrees completed between 1985 and 1997 as its weight. When calculating SWE by major, I distinguished between three age groups: twenty-five to thirty-four, thirty-five to forty-four, and forty-five to sixty-four. To arrive at the figure above, I allocated half of the change in SWE for the age group forty-five to sixty-four to each of the age groups forty-five to fifty-four and fifty-five to sixty-four.
TRA86 most dramatically reduced top marginal tax rates. This has two main consequences. First, TRA86 affected expected lifetime earnings by major mostly by affecting expected earnings later in life. This is clear from looking at the relative size of the various colored parts of each major-specific bar. In particular, on average 65 percent of the increase in lifetime earnings by major takes place between the ages of forty-five and sixty-four, and only 35 percent takes place between twenty-five and forty-four. Second, expected lifetime earnings generally increased more for majors with higher baseline pre-TRA86 expected lifetime earnings.
Instead of focusing on absolute levels of expected lifetime income by major, most papers (e.g., Long, Goldhaber, and Huntington-Klein 2015) have instead focused on expected lifetime incomes by major relative to the mean across all majors. Before TRA86, the expected lifetime income premia of majors relative to the mean expected lifetime income across all majors varied from −19 percent in protective services to 24.5 percent in medical sciences and nursing and had a standard deviation of 7.49 percent. Due to TRA86, this standard deviation increased by 6.1 percent to 7.95 percent. The expected lifetime income premium relative to the mean across all majors increased the most for the major medical sciences and nursing. Its premium increased from 24.5 percent to 27 percent, an increase of 10.2 percent. On the other hand, the expected lifetime income premium decreased the most for the major home economics. Its premium decreased from −16.1 percent to −17.1 percent, a decrease of 6.2 percent.
To place the effect of TRA86 on expected after-tax earnings by major into context, we can compare it to variation in expected earnings isolated in other papers on college major choice. For instance, Beffy, Fougere, and Maurel (2012) look at the before-tax real monthly earnings of French university students during the first five years after leaving the educational system. They find that individuals who entered the labor market in 1998, when France experienced an economic expansion, on average earned 4.9 percent higher real wages during the first five years in the labor market than individuals who entered in 1992, when France experienced an economic downturn. The average increase in after-tax expected lifetime earnings of 6.2 percent induced by TRA86 is thus comparable to the average change in earnings induced by graduating at different points in the business cycle. 31 However, in contrast to TRA86, Beffy et al. find that the moment of graduation has very heterogeneous effects across majors. For instance, science (respectively, law, economics, and management) majors had 13.5 percent (respectively, 10.4 percent) higher earnings in 1998 than in 1992 while humanities and social science majors had 4.2 percent lower earnings in 1998 than in 1992. Beffy et al. exploit this change in relative earnings across majors over time to empirically identify the effect of expected earnings on college major choice. As TRA86 had much less of a differential impact on major-specific expected earnings, it will be more difficult to empirically detect its impact on college major choice.
In addition, the changes in expected lifetime income by major due to TRA86 can also be compared to the long-term trends in major-specific returns identified by Altonji, Kahn, and Speer (2014). Altonji, Kahn, and Speer (2014) use data from the 1993 and 2003 NSCG and from the 2009 to 2011 American Community Surveys to estimate (before-tax) wage premia for fifty-one different majors. 32 They find that the standard deviation of these major-specific wage premia increased by 13 percent from 1993 to 2011. As discussed above, TRA86 caused the standard deviation of the distribution of expected after-tax lifetime income premia by major relative to the mean expected lifetime income across all majors to increase by 6.1 percent. This suggests that, besides changes in before-tax wage premia, tax changes such as TRA86 can also significantly contribute to long-run changes in the distribution of after-tax wage premia by major.
The Effect on College Major Choice
Empirically isolating the effect of TRA86 on college major choice using available data is difficult. First, I only have data on the aggregate number of degrees completed in each major over time and cannot control for the effect on college major completions of potential changes in the composition of college graduates as a result of TRA86. 33 Also, there exists a positive correlation of 0.83 between a major’s baseline expected after-tax lifetime income relative to other majors and the percent change in this income induced by TRA86, making it difficult to isolate changes in the composition of completed college degrees that are due to TRA86 alone. 34
Given the difficulties in empirically isolating the impact of TRA86, I both estimate and simulate its effect on college major choice. First, I test empirically whether, in years following TRA86, there is a positive association between the change over time in the share of college degrees completed in a particular field and the TRA86-induced change in the expected after-tax lifetime earnings of that field relative to other fields. As these estimates are imprecise and potentially biased due to the presence of various confounding factors, I then also simulate how TRA86 is likely to have affected college major choice using estimates of the elasticity of college major choice with respect to expected earnings from the literature.
Each major experienced an increase in expected after-tax lifetime earnings of at least 4.9 percent due to TRA86. 35 Below, I analyze the impact of changes in majors’ “relative” SWE, that is, changes in majors’ expected after-tax lifetime earnings relative to the mean of these earnings across all majors. This focus on the relative earnings of majors is in line with the literature on college major choice 36 and ignores any potential change in college major choice resulting from the increase of 4.9 percent in expected after-tax earnings experienced by every major due to TRA86. In other words, the analyses below do not take into account the “income effect” of TRA86 on college major choice.
To my knowledge, given its focus on relative earnings, the literature on college major choice cannot speak directly to the implications of this income effect. There is some evidence though suggesting that taking into account an income effect will lead to smaller responses to TRA86 than when only considering changes in relative earnings across majors. For instance, Rothstein and Rouse (2011) identify the causal effect of student debt on students’ academic outcomes during college using a change in a university’s financial aid policies. They find some evidence suggesting that debt causes students to choose higher-paying majors such as engineering and economics. Although TRA86 does not directly affect student debt, the increase in all majors’ expected lifetime earnings due to TRA86 makes it more likely that students are able to pay back any debt upon graduation. As such, TRA86 could have lessened the impact of debt on student behavior and caused some students to switch away from the higher-paying majors that experienced larger increases in lifetime earnings as a result of TRA86. That is, taking into account an income effect is likely to lead to even smaller responses to TRA86 than when only considering changes in relative earnings as I do in both the regressions and simulations below.
Regression Analysis
In this section, I attempt to establish whether TRA86 had an impact on college major choice by estimating the elasticity of college major choice with respect to relative SWE using TRA86-induced changes in majors’ relative SWE. In particular, I test whether there exists an association between the percent change in the share of college degrees completed in a field in the years following TRA86 and the percent change in that field’s relative SWE due to TRA86.
In the baseline regressions, I compute the percent change in the share of a field over time using data on college major completions between the academic years of 1983/1984 and 1996/1997, and by comparing the average annual share of degrees completed in a field pre-TRA86 (until 1987/1988) and post-TRA86 (1988/1989 onward). 37 In table 1, I show the results of regressing the percent change in the average annual share of a major between the pre- and post-TRA86 periods on the percent change in that major’s relative SWE and a constant. In these regressions, each major is weighted by its average annual share between 1983/1984 and 1996/1997. 38 As discussed earlier, the composition of college graduates may have changed due to TRA86. In column (2), I therefore only use data on college major completions at the top 25 percent of colleges. 39 Students at these colleges are unlikely to be on the margin of attending and/or completing college and the composition of students graduating from these colleges should therefore be affected less by TRA86.
The 1986 Tax Reform Act (TRA86) and College Major Choice—Baseline Regressions.
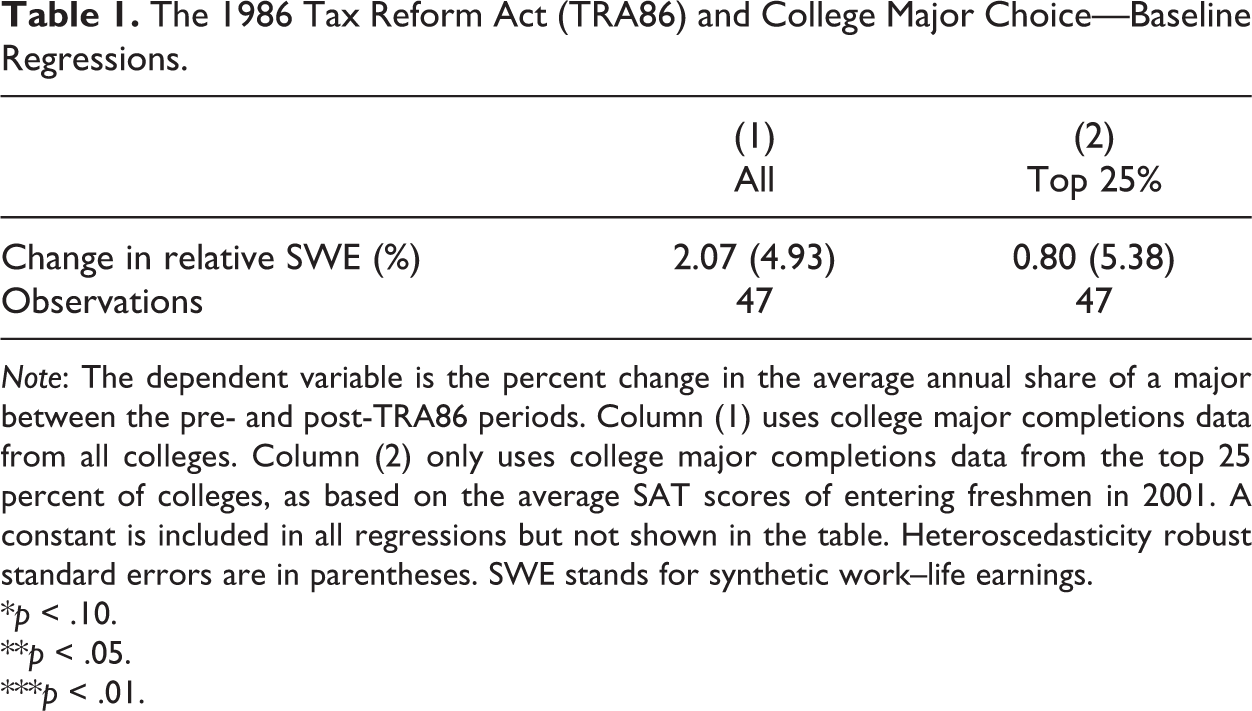
Note: The dependent variable is the percent change in the average annual share of a major between the pre- and post-TRA86 periods. Column (1) uses college major completions data from all colleges. Column (2) only uses college major completions data from the top 25 percent of colleges, as based on the average SAT scores of entering freshmen in 2001. A constant is included in all regressions but not shown in the table. Heteroscedasticity robust standard errors are in parentheses. SWE stands for synthetic work–life earnings.
*p < .10.
**p < .05.
***p < .01.
Column (1) indicates that there exists a positive but statistically insignificant association between the change in a field’s share and the change in its relative SWE due to TRA86. The estimated elasticity is smaller when only using data from the top 25 percent of colleges and remains statistically insignificant.
In addition, I can divide both the pre-TRA86 period and the post-TRA86 period into multiple shorter periods and attempt to estimate the elasticity of college major choice with respect to relative SWE separately for each shorter post-TRA86 period. Dividing the pre- and post-TRA86 periods into multiple shorter periods has one main advantage. Namely, it allows me to take into account long-term trends in college major choice by including a major-specific fixed effect
Using multiple shorter time periods, I estimate the following equation:
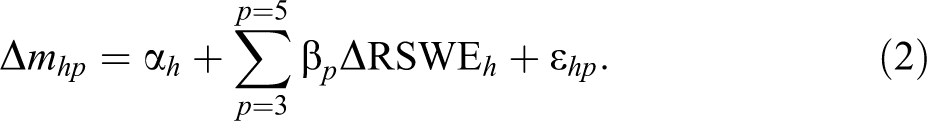
In this equation,
Again, the regression results, which are shown in table 2, indicate that there exists a positive but statistically insignificant association between the change over time in the share of a particular field and the change in the expected lifetime income of that field due to TRA86. Overall, the regression results in tables 1 and 2 provide suggestive evidence that TRA86 did not impact college major choice patterns, although the results are imprecise and large effect sizes cannot be ruled out.
The 1986 Tax Reform Act (TRA86) and College Major Choice—Panel Regressions.

Note: The dependent variable is the percent change in the average annual share of a major between two consecutive periods. The independent variable “Change in Rel. SWE (%)” refers to the percent change in a major’s expected after-tax lifetime income relative to the mean across all majors due to TRA86. Column (1) uses college major completions data from all colleges. Column (2) only uses college major completions data from the top 25 percent of colleges, as based on the average SAT scores of entering freshmen in 2001. Standard errors, clustered by major, are in parentheses.
*p < .10.
**p < .05.
***p < .01.
Simulations
Given the limitations of the regression analysis, I also simulate the effect of TRA86 on college major choice. In particular, I simulate how the actual (pre-TRA86) 1985/1986 composition of completed college degrees of males would have looked if this cohort had faced the post-TRA86 distribution of after-tax expected lifetime income by major instead of the pre-TRA86 one when choosing a major. In these simulations, I use various estimates of the elasticity of college major choice with respect to expected earnings from the literature. 41
Estimates of the elasticity of college major choice with respect to expected earnings vary widely across the literature. This is not surprising as studies on the determinants of college major choice differ in their definition of expected earnings and the number of majors they distinguish between, two key components that go into calculating this elasticity. In terms of expected earnings, some studies use population-based average earnings of college graduates with a particular major at the time that students are in college (e.g., Long, Goldhaber, and Huntington-Klein 2015) while others use students’ individual-specific expected lifetime income across majors, generated using either students’ stated expected earnings across majors (e.g., Wiswall and Zafar 2015a) or with forward-looking data under the assumption that students have rational expectations (e.g., Beffy, Fougere, and Maurel 2012; Boudarbat and Montmarquette 2009). In terms of the number of majors, most studies (e.g., Wiswall and Zafar 2015a; Beffy, Fougere, and Maurel 2012; Boudarbat and Montmarquette 2009) group individual majors into three to seven broad major fields such as “natural sciences” and “humanities/arts.” To my knowledge, only Long, Goldhaber, and Huntington-Klein (2015), who distinguish between thirty-six different majors, use a more disaggregate classification. 42
Papers that distinguish between three to seven majors and use expected earnings calculated separately for each student find small elasticities. For instance, Beffy, Fougere, and Maurel (2012) distinguish between three broad majors and estimate a sequential schooling decisions model with student-level French data in which students among other things compare the rationally expected earnings across majors. Using, as mentioned before, variation in expected earnings induced by the business cycle to identify earnings elasticities, they find elasticities ranging from 0.09 in sciences to 0.14 in humanities and social sciences. Similarly, Wiswall and Zafar (2015a) distinguish between four groups of majors 43 and use experimentally generated changes in students’ stated expected earnings across majors to identify earnings elasticities of college major choice. They find elasticities of around 0.05. 44
On the other hand, distinguishing between thirty-six different majors and using population-based average earnings of college graduates with a particular major at the time that students are in college, Long, Goldhaber, and Huntington-Klein (2015) find an elasticity of 0.67. Much like I do in this article, they calculate expected earnings by major in a given year using occupation-specific wage data from that year’s CPS and time-invariant major-occupation distributions based on data from another survey. 45 Using the same data on major completions over time from IPEDS as I do in this article, they find that over the period 1987 to 2011 a 1 percent increase in major-specific earnings relative to the mean across all majors in a particular year is associated with a 0.67 percent increase in the share of degrees completed in that field three years later.
Long, Goldhaber, and Huntington-Klein’s study (2015) is most closely related to this study as it uses nearly identical data on expected earnings and college major completions and distinguishes between a similarly large number of majors. However, Long, Goldhaber and Huntington-Klein rely on changes in actual before-tax earnings of prior cohorts of college graduates and not on expected changes in after-tax earnings induced by a tax law change. Until they materialize, expected changes in after-tax earnings are harder for students to observe and, following the literature on tax salience (e.g., Chetty, Looney, and Kroft 2009; Gallagher and Muehlegger 2011), should be less likely to affect college major choice than easier-to-observe changes in actual before-tax earnings. That is, in the short run, the elasticity most suited for the simulation exercise is likely to be lower than 0.67. 46,47
I simulate the change in the pre-TRA86 1985/1986 distribution of the number of college degrees completed by field by taking the share of all college degrees completed in a particular field in 1985/1986 and multiplying it by the TRA86-induced percent change in that field’s relative SWE, the elasticity and the total number of degrees completed in 1985/1986. 48 Table 3 provides an overview of the results of this simulation exercise for various estimates of the elasticity from the literature. 49
The 1986 Tax Reform Act (TRA86) and College Major Choice—Simulated Effects.

Note: The column “% of Cohort” refers to the simulated fraction of all individuals in the 1985/1986 cohort that complete a different major due to TRA86. The term “Average y-to-y Change” in the last column refers to the average year-to-year change in the distribution of completed college majors over the period 1984/1985 to 1996/1997 for which I have data. To calculate this year-to-year change, for each of the forty-seven majors that I distinguish between I first take the minimum of this year’s and last year’s share of all degrees completed. I then sum these minimum shares across all majors to arrive at the share of the distribution of completed college majors that remained unchanged from last year to this year.
When using an elasticity of 0.67, the simulations show that close to 1,200 individuals would have completed a different major under the post-TRA86 tax law. This amounts to 0.25 percent of all majors completed by males in 1985/1986. When using the smaller elasticities of 0.12 and 0.05, these effects are, respectively, 0.04 percent and 0.02 percent. As discussed above, due to the potentially low salience of TRA86, the most appropriate elasticity is likely to be smaller than 0.67. That is, the share of undergraduate degrees affected by TRA86 is small under all estimates of the elasticity and close to zero under estimates that take into account the potentially low salience of TRA86.
To put this effect of TRA86 in perspective, it is important to note that the distribution of completed college majors generally changes little on a year-to-year basis. For instance, when for the period 1983/1984 to 1996/1997 I compare this year’s distribution of completed college majors to last year’s distribution, I find that on average only 2.3 percent of all degrees completed this year would have been completed in a different major had last year’s distribution of completed college majors been in place this year as well. In this context, the simulated change in the distribution of completed college majors due to TRA86 that affected 0.25 percent of all degrees is equivalent to around 10 percent of the average year-to-year change in the distribution of completed college majors. When using lower estimates of the elasticity however, this effect drops to around 1 percent to 2 percent. Relative to average year-to-year changes the simulated effect of TRA86 thus remains small but does not appear completely negligible.
In figure 3, I provide a breakdown of the total simulated effect and show the simulated change in the number of college degrees completed by field when using an elasticity of 0.67. In this figure, majors are ordered by the TRA86-induced percent change in their relative SWE, with majors experiencing the largest decrease listed at the top and majors experiencing the largest increase listed at the bottom. As a result, nonmonotonic variation in the change in the number of degrees completed as we move from the top to the bottom is driven by differences in the initial number of students completing a college degree in a particular major. In terms of the absolute number of degrees completed, the major education is most negatively impacted by TRA86, whereas political sciences, other life sciences and medical sciences including nursing see the largest positive changes in the number of completions due to TRA86. Figures using an elasticity of 0.05 or 0.12 will look the same, the only difference being that the simulated changes will be 13.4 and 5.6 times smaller, respectively.
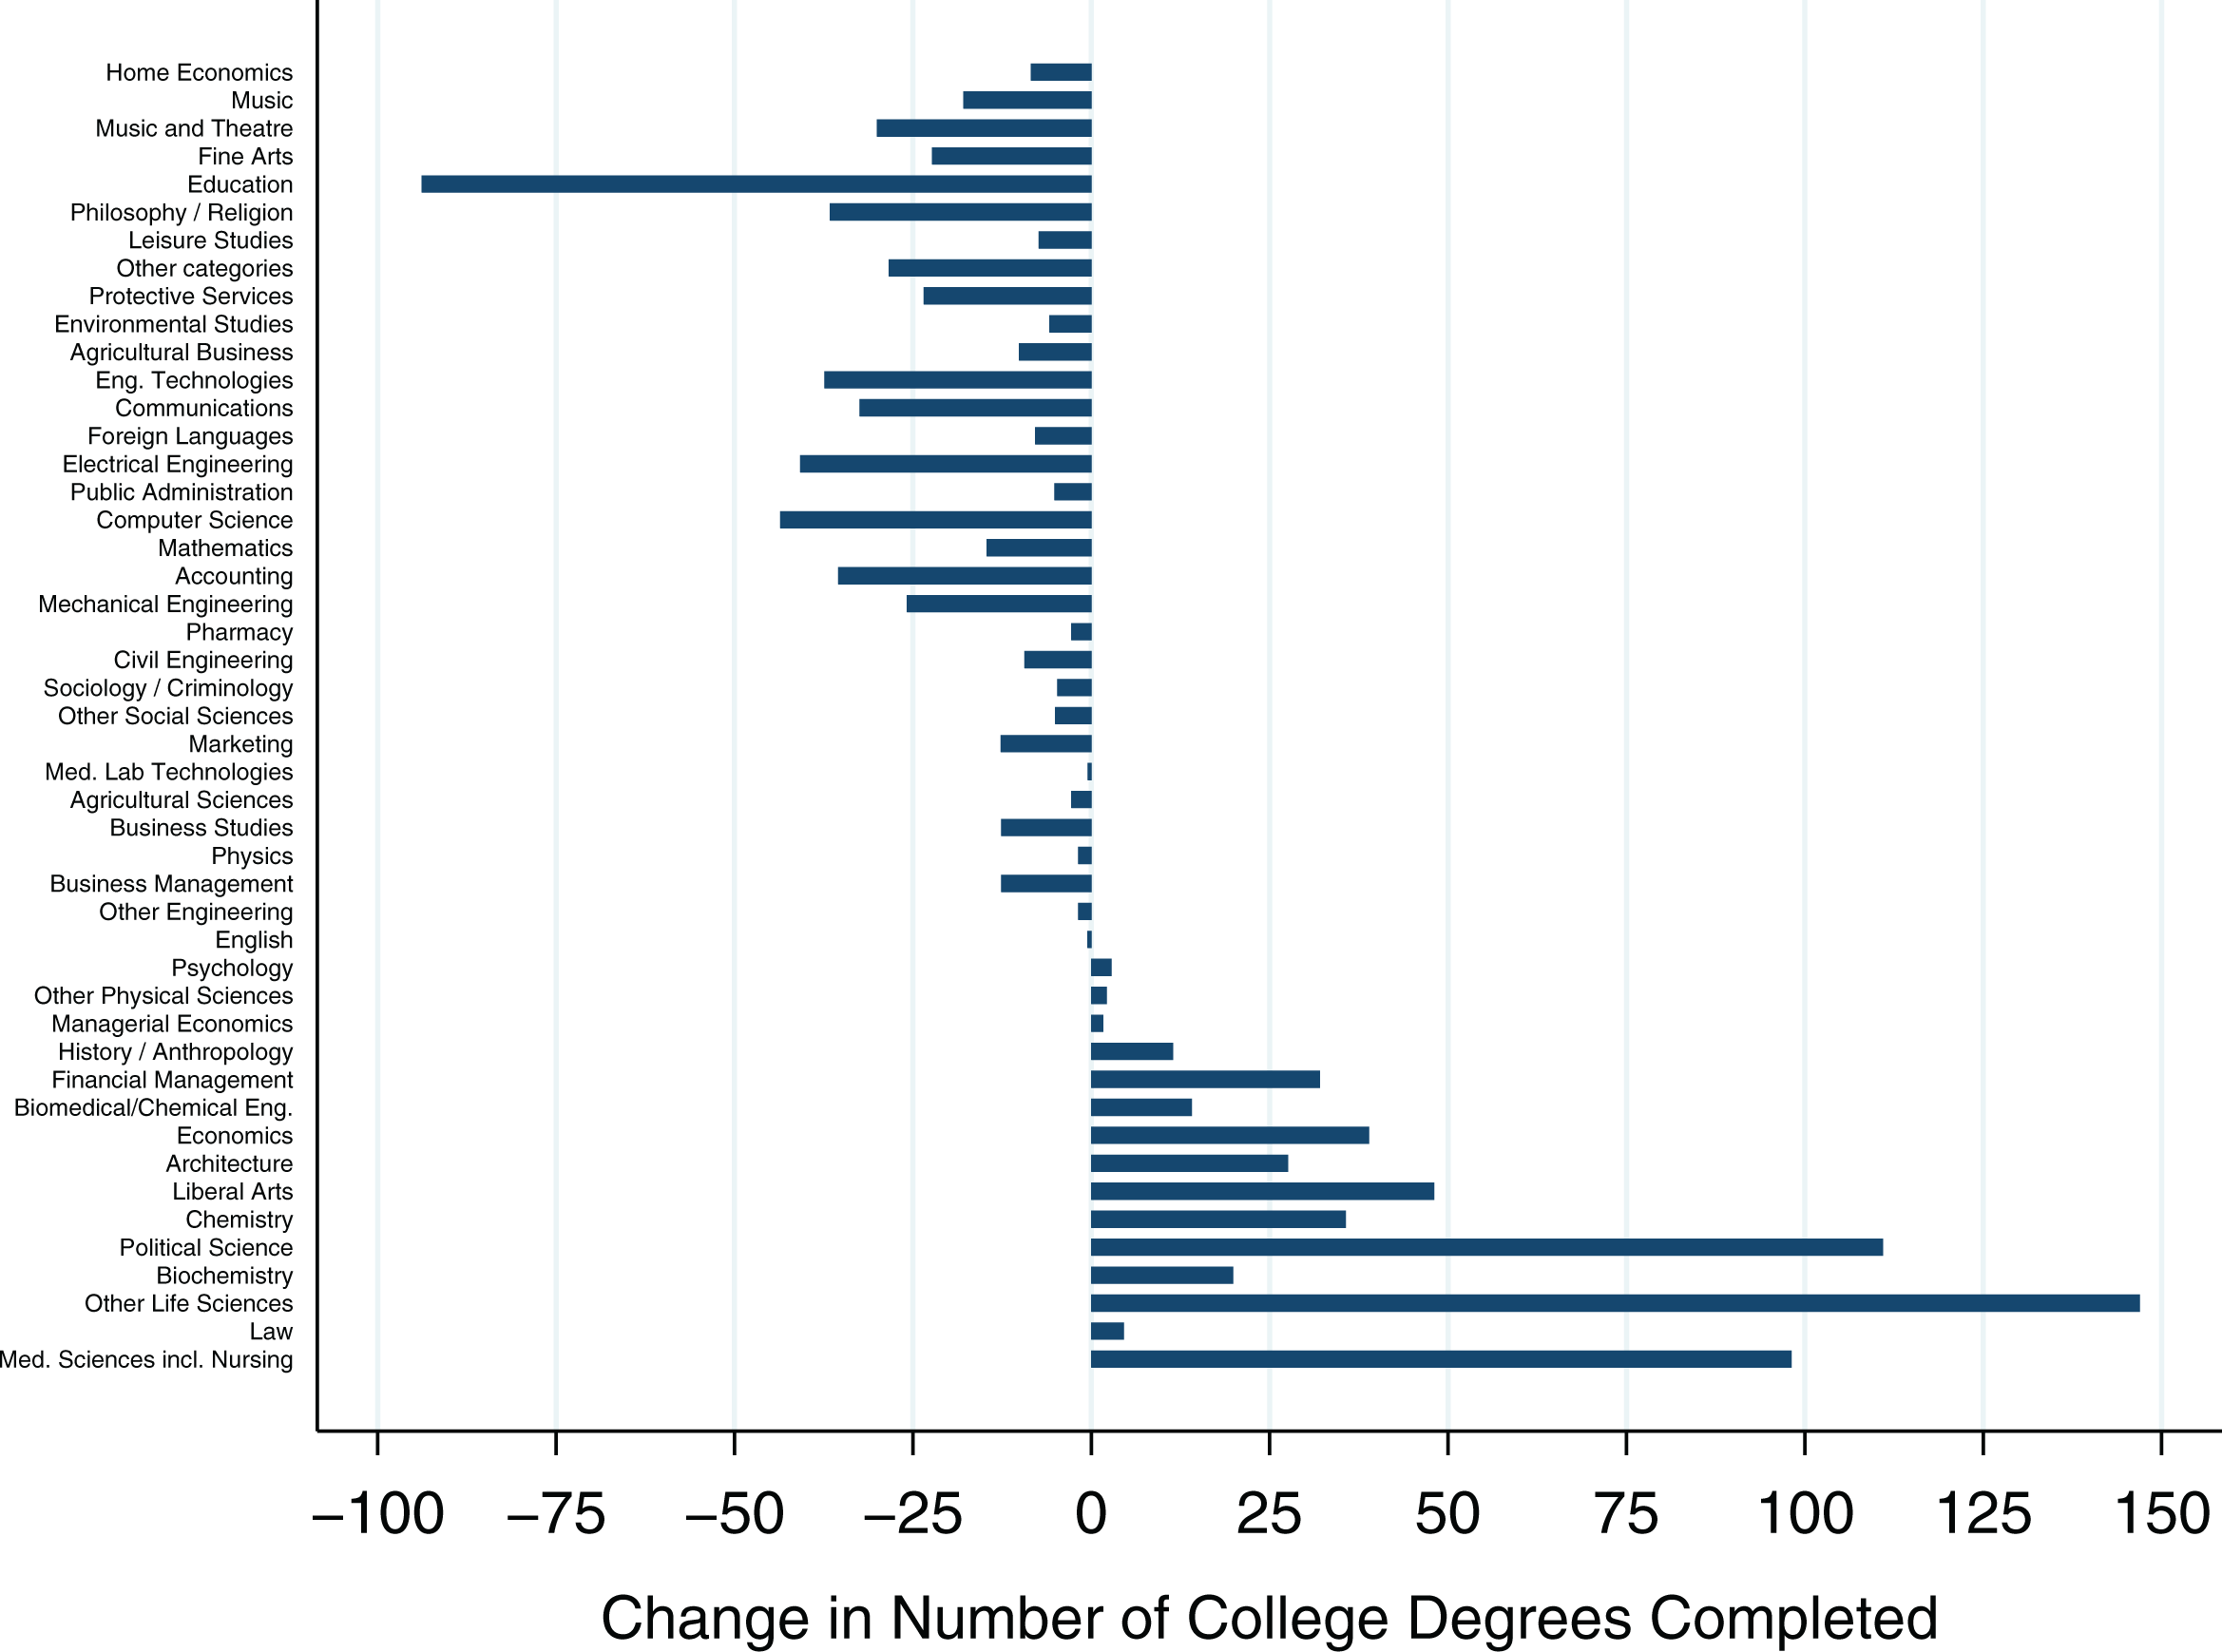
Simulated effect of the 1986 Tax Reform Act (TRA86) on the types of degrees completed by the 1985/1986 graduating cohort of males. The change in the pre-TRA86 1985/1986 distribution of the number of college degrees completed by field is calculated by taking the share of all college degrees completed in a particular field in 1985/1986 and multiplying it by the TRA86-induced percent change in that field’s expected after-tax lifetime earnings relative to the mean across all majors, the elasticity and the total number of degrees completed in 1985/1986. In this figure, majors are ordered by the TRA86-induced percent change in their relative synthetic work–life earnings, with majors experiencing the largest decrease listed at the top and majors experiencing the largest increase listed at the bottom.
Lastly, using the framework of Hendren (2016), I analyze the welfare impact of the simulated change in the composition of completed college degrees as a result of TRA86. Under some simplifying assumptions discussed in detail in Appendix A, we can approximate this welfare impact in Hendren’s framework by measuring the change in the amount of income tax that a cohort pays over their working life as a result of the TRA86-induced change in the composition of completed college majors in this cohort. To do so, I calculate average total federal and state personal income tax payments by major over a forty-year working life using the same method and data that I used to calculate major-specific SWE. I then use the change in the composition of completed college degrees simulated above to calculate by how much government tax revenue would change if this simulated change had taken place.
I find positive welfare effects equal to 62.7 million 1985 US dollars when using an elasticity of 0.67 in the simulation exercise. 50 To put these welfare gains into perspective, 62.7 million 1985 US dollars equals 0.04 percent of the expected lifetime income tax payments of the 1985/1986 cohort under the pre-TRA86 tax law. The welfare gains are thus very small relative to overall tax payments.
Despite being one of the largest income tax reforms in recent US history, TRA86 is likely to only have had a small impact on college major choice. As discussed in the third section, other major tax reforms such as TCJA2017 had a smaller differential effect across the income distribution, resulting in smaller changes in relative SWE across majors. The simulated effect of TRA86 on college major choice is therefore a likely upper bound of the effect of these other tax reforms, implying that we should not expect to observe large changes in college major choice as a result of tax reforms such as TCJA2017. More generally, income tax law reforms are unlikely to have a very large effect on college major choice. For instance, in simulation results not shown here, I find that hypothetical tax reforms twice the size of TRA86 would still have a relatively small simulated impact on college major choice, at most affecting around 0.6 percent of all college degrees. 51
Conclusion
Whether changes in personal income tax laws are likely to affect the choice of educational type, and in particular the choice of college major, has not been studied empirically. However, this is an important topic as it has implications for the welfare effects of personal income taxes and the determinants of college major choice. In this article, I combine information from the 1993 NSCG on the distribution of occupations by major and from the March CPS on average after-tax incomes by occupation to first estimate the impact of TRA86 on expected after-tax lifetime earnings by major. I then both estimate and simulate how the differential TRA86-induced change in expected after-tax lifetime earnings across majors affected the distribution of completed college majors.
I find that the average major experienced an increase in after-tax expected lifetime income of US$58,000 or, equivalently, 6.2 percent due to TRA86. Although the differences between majors are not very large, not all majors benefited equally from TRA86. The standard deviation of major-specific expected lifetime income premia relative to the mean expected lifetime income across all majors increased by 6.1 percent due to TRA86 from 7.49 percent to 7.95 percent. I find no statistically significant association between the change over time in the share of a major and the change in its expected after-tax lifetime earnings relative to other majors due to TRA86. In addition, due to the relatively small differential impact across majors, at most 0.25 percent of males graduating after TRA86 are simulated to have completed a different major due to TRA86.
This article shows that personal income tax reforms can have a large effect on the mean level of expected earnings of a given level of education but are unlikely to have large differential effects across educational types within a level of education. As a result, tax reforms, including recent reforms such as the Tax Cuts and Jobs Act of 2017, are unlikely to lead to large changes in the types of education chosen. Furthermore, the results of this article imply that current short-run estimates of the elasticity of taxable income with respect to the net-of-tax rate (e.g., Saez, Slemrod, and Giertz 2012) are not heavily understating the long-run elasticity. These current estimates would not be heavily impacted by a very small change in the composition of completed college majors in the long run as a result of a tax change.
Further empirical studies are needed to determine whether there exists a robust causal link between the choice of college major and tax reforms in the data. To do so, future studies need to address two empirical challenges, namely, changes in the composition of college graduates over time as a result of tax changes and the correlation between tax-induced changes in expected lifetime income by major and baseline levels of expected lifetime income. To address the former, one needs large individual-level data sets that contain data on the college major choices of many cohorts of college students. To address the latter, one could look to a country other than the United States in which both large regressive and progressive tax reforms have been implemented. Looking at various such tax reforms in one study would allow one to more clearly separate the impact of tax reform–induced changes in expected lifetime income from time-trends in college major completions that are correlated with baseline levels of expected lifetime income by major.
Footnotes
Appendix A
Appendix B
Appendix C
Acknowledgments
I am thankful to Roger Gordon, Julie Cullen, Julian Betts, Michelle White, Kilian Heilmann, Claudio Labanca, and the participants in the UCSD Applied Lunch Seminar and Third-Year Paper Class for very helpful comments and suggestions. I am also thankful to two anonymous reviewers, an associate editor, and the editor of the journal for their thoughtful comments and suggestions that helped improve this article substantially.
Declaration of Conflicting Interests
The author declared no potential conflicts of interest with respect to the research, authorship, and/or publication of this article.
Funding
The author received no financial support for the research, authorship, and/or publication of this article.