
Abstract
Publication bias poses multiple threats to the accuracy of meta-analytically derived effect sizes and related statistics. Unfortunately, a review of the literature indicates that unlike meta-analytic reviews in medicine, research in the organizational sciences tends to pay little attention to this issue. In this article, the authors introduce advances in meta-analytic techniques from the medical and related sciences for a comprehensive assessment and evaluation of publication bias. The authors illustrate their use on a data set on employment interview validities. Using multiple methods, including contour-enhanced funnel plots, trim and fill, Egger’s test of the intercept, Begg and Mazumdar’s rank correlation, meta-regression, cumulative meta-analysis, and selection models, the authors find limited evidence of publication bias in the studied data.
Meta-analytic reviews of research streams have increased in popularity and are currently a primary way to summarize, integrate, and synthesize areas of research (Borenstein, Hedges, Higgins, & Rothstein, 2009; Hunter & Schmidt, 2004). This allows for the accumulation of cumulative knowledge in the organizational sciences, which was once thought to be impossible (Schmidt & Hunter, 2003). Yet, there is some criticism concerning the validity of meta-analytic approaches and findings (e.g., Field, 2003; Thompson & Pocock, 1991). One criticism centers around publication bias, which exists when “the research that appears in the published literature is systematically unrepresentative of the population of completed studies” (Rothstein, Sutton, & Borenstein, 2005a, p. 1). Thus, meta-analytic researchers should evaluate the potential influence of publication bias in their analyses as this source of bias may present one of the greatest threats to the validity of meta-analytic results, conclusions (Rothstein et al., 2005a), and evidence-based practice (Banks & McDaniel, 2011). As a result, publication bias analyses are recommended or required in various scientific fields (e.g., Cooper, 2003; Higgins & Green, 2009), including the organizational sciences (American Psychological Association, 2010).
In the typical case of publication bias, studies with small samples and statistically insignificant results are suppressed (i.e., missing) from the readily available literature (Chan, Hróbjartsson, Haahr, Gøtzsche, & Altman, 2004; Dickersin, 2005; McDaniel, Rothstein, & Whetzel, 2006; Pigott, 2009; Rothstein et al., 2005a; Song et al., 2010). Thus, small sample studies, especially those with statistically insignificant results, may not be published or disseminated, which represents a situation where data (i.e., results from samples 1 ) are not missing at random (NMAR; Newman, 2009; Newman & Lyon, 2009; Schafer & Graham, 2002). Although it is possible to deal with other types of missing data (e.g., data that are missing completely at random [MCAR] or data that are missing at random [MAR]) with traditional methods, this is not true for data that are NMAR, particularly if samples or effect sizes are missing (Pigott, 2009; Schafer & Graham, 2002; Sutton & Pigott, 2005). Therefore, methods specifically designed to deal with publication bias are needed (e.g., Newman, 2009). In this article, we describe such methods and illustrate their use.
If not properly addressed, publication bias can lead to meta-analytically derived effect sizes that are misestimated, typically overestimated (Dickersin, 2005; McDaniel et al., 2006; Rothstein et al., 2005a). In addition, the mean of moderator subgroups can be misestimated, thus distorting the magnitude of moderator effects. Likewise, publication bias can distort the variance of the effect sizes and conclusions drawn from the variance estimates. Publication bias can be so severe that medical research associates this problem not only with adverse scientific outcomes, but also adverse ethical outcomes (Dickersin, 2005; Shields, 2000; Song et al., 2010). Examples of the influence of publication bias in the medical sciences are frequently reported in the popular press (e.g., Saul, 2008). Relative to research in the organizational sciences, academic journals in the medical sciences also tend to report the effects and consequences of publication bias, whether it relates to specific drugs such as Vioxx (Curfman, Morrissey, & Drazen, 2006), general drug categories such as antidepressants (Turner, Matthews, Linardatos, Tell, & Rosenthal, 2008), other drugs (Blackwell, Thompson, & Refuerzo, 2009), or medical procedures such as orthopedic surgery (Hasenboehler et al., 2007). A prime reason for the attention to publication bias in the medical sciences is related to potential patient harm (Chalmers, 2004; Rennie, 1997; Simes, 1986).
Publication bias in the organizational sciences has the potential to affect the efficacy of human resource management practices and subsequently the effectiveness of organizations. Unfortunately, meta-analytic studies in the organizational sciences tend to ignore the potential of this bias. As Table 1 illustrates, since the release of Publication Bias in Meta-Analysis: Prevention, Assessment, and Adjustments (Rothstein et al., 2005b), only 31% (33/105) of the published meta-analytic reviews in some of the most prestigious journals in the organizational sciences have addressed the issue of publication bias. 2 Furthermore, even recent articles on the feature topic of meta-analysis in Organizational Research Methods (Aguinis & Vandenberg, 2008) only addressed the issue in passing, if at all. This may well illustrate why our research and journals do not pay much attention to this topic.
Publication Bias Analyses in Selected Journals (2005 to 2010)

Note: Some of the information contained in this table was taken from Banks, Kepes, and McDaniel (2012). N MAs = number of meta-analytic reviews; PBA = publication bias assessment; subgroup = subgroup comparison by source; FP = funnel plot; t&f = trim and fill analysis; Egger = Egger’s test of the intercept; B&M = Begg and Mazumdar’s rank correlation test; CumMeta = cumulative meta-analysis; MReg = meta-regression; Other = other publication assessment methods; MM = multiple methods (i.e., paper used multiple methods in the assessment of publication bias). AMJ = Academy of Management Journal; JAP = Journal of Applied Psychology; JOM = Journal of Management; PPsych = Personnel Psychology; JAMA = Journal of the American Medical Association; ANI = Annals of Internal Medicine.
By contrast, articles in the leading medical journals tend to assess the potential of publication bias at a substantially higher rate (54/93; 58%). In addition, the leading publisher of systematic reviews in the medical sciences, the Cochrane Database of Systematic Reviews, requires that all articles address the issue of publication bias (Higgins & Green, 2009). This compares to 31% of the meta-analytic review articles in the Journal of Applied Psychology, a premier outlet for meta-analytic reviews in the organizational sciences. Furthermore, of the 31% that assessed the issue of publication bias in the Journal of Applied Psychology, the vast majority used the failsafe N method or subgroup comparisons, both of which are inadequate in assessing publication bias due to statistical and conceptual reasons (Aguinis, Pierce, Bosco, Dalton, & Dalton, 2011; Becker, 2005; Evans, 1996; Higgins & Green, 2009; Hopewell, Clarke, & Mallett, 2005; McDaniel et al., 2006; Steel & Kammeyer-Mueller, 2002). Similar caveats apply to other journals. For example, since 2005, the Academy of Management Journal published eight meta-analytic reviews and all except one used methods that are inadequate to assess the presence of publication bias, such as the failsafe N and/or subgroup analyses.
The premier journals in the medical sciences not only use more advanced methods in the evaluation of publication bias, they are also more likely to use multiple methods. One can have greater confidence in the results of such analyses when multiple methods arrive at the same conclusion. Consequently, it is clear that research published in the top medical journals pays more attention to the issue of publication bias, both in the techniques used to assess publication bias and the frequency with which the analyses are conducted.
Because meta-analytic reviews hold promise for bridging the often lamented gap between research and practice by presenting research findings in a comprehensive and convincing manner (Briner & Rousseau, 2011; Le, Oh, Shaffer, & Schmidt, 2007), it is important that meta-analysts strive to provide the most accurate estimates possible when cumulating the findings within a given research literature. The purpose of this article is to introduce and illustrate meta-analytic advances from the medical sciences regarding the assessment and evaluation of publication bias.
A Taxonomy of Sources of Samples
There are distinct types of sources for samples and research results. Table 2 contains a taxonomy of sources of samples that may be included in a meta-analytic review. The designation of sources of samples by tiers serves to differentiate the extent to which samples from these sources are readily available to meta-analytic researchers.
Taxonomy of Sources of Samples
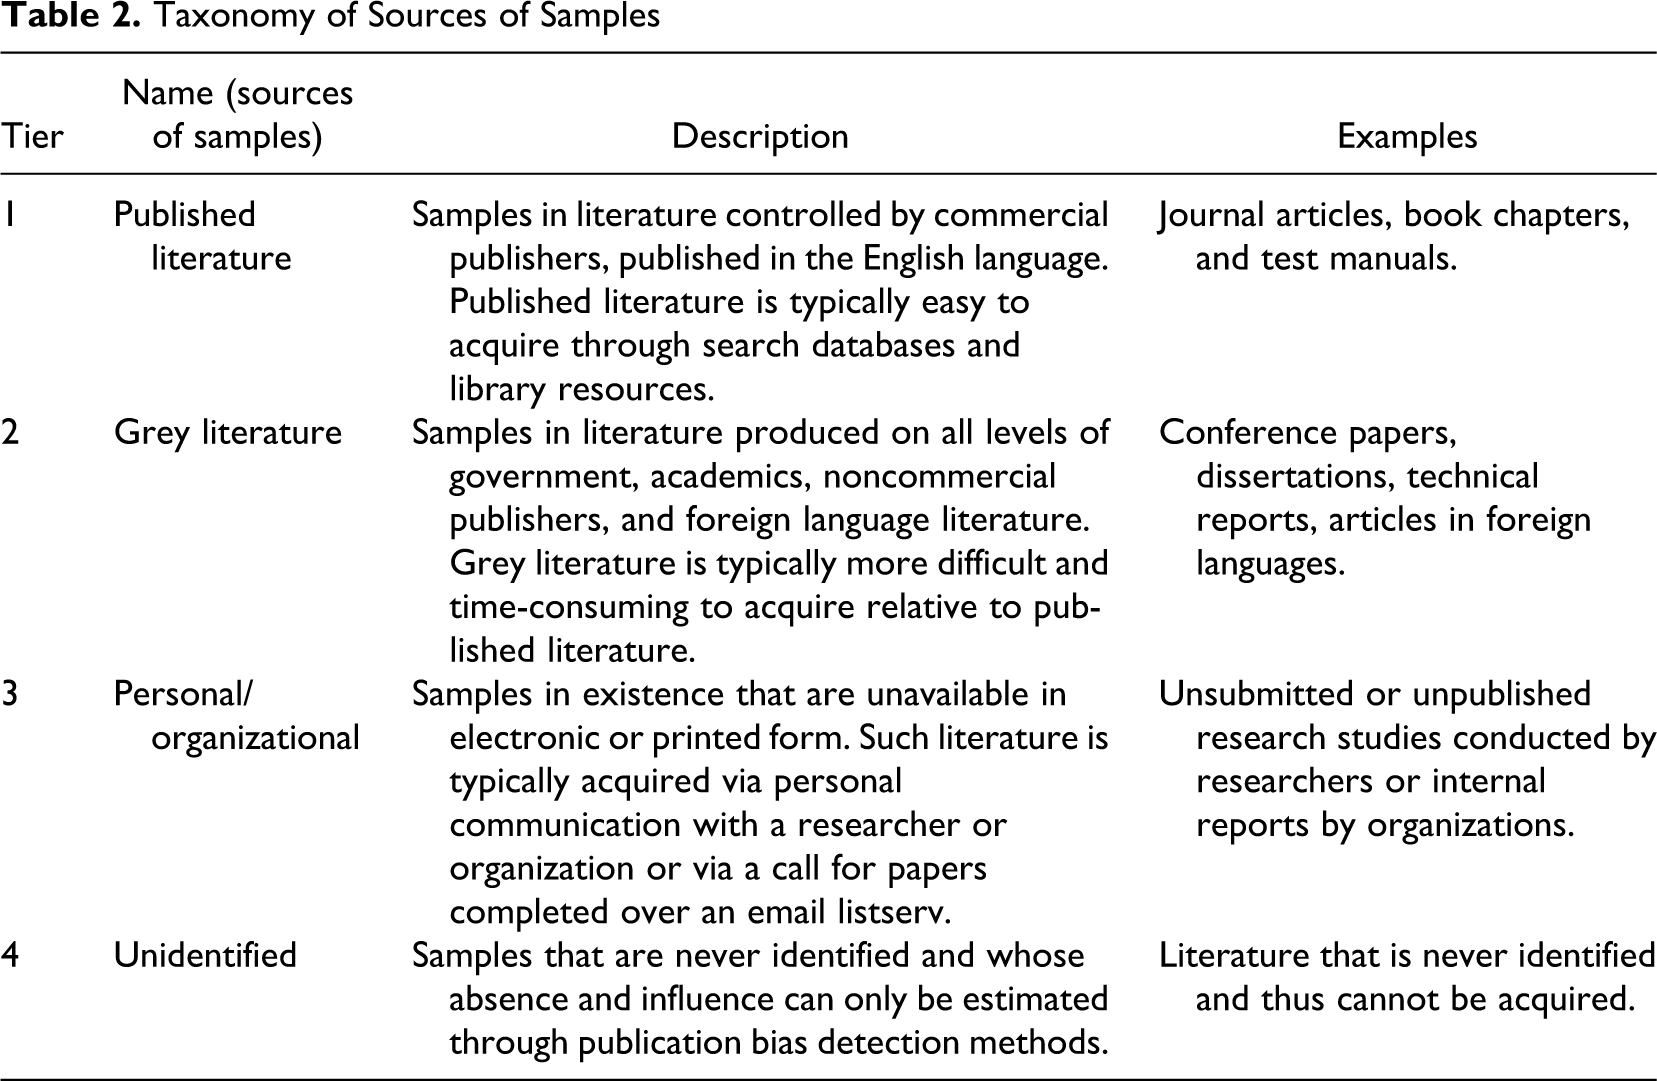
Tier 1 characterizes published literature. Examples of sources of samples from this literature include journal articles, book chapters, and test manuals. Tier 2 contains sources of samples that are categorized as grey literature, such as conference papers, dissertations, technical reports, and articles in foreign languages (Schopfel, 2006). Relative to the published literature, the grey literature is typically more difficult and time-consuming to acquire. Tier 3 specifies personal and organizational sources of samples. Samples from this tier are generally unavailable in electronic or printed form (e.g., unsubmitted or unpublished samples). Such samples are usually acquired through personal communication or via calls for papers over email list servers.
Finally, tier 4 comprises unidentified sources of samples. Although samples in this tier are not identified, they should be considered in a meta-analytic review. Their absence can affect the meta-analytic results, which can only be estimated through publication bias detection methods. Unfortunately, this is rarely done. For instance, it is not uncommon to complete a subgroup analysis of Tier 1 samples (i.e., published literature) with a combination of Tier 2 and 3 samples (i.e., grey literature and personal/organizational samples) in meta-analytic reviews. Yet, such an analysis is based on the assumption that all samples in these tiers have been identified and acquired. Most likely, this assumption is incorrect (Hopewell et al., 2005), making subgroup comparisons for the detection of publication bias limited.
A Taxonomy of Causes of Publication Bias
The potential causes of publication bias are numerous. Generally, one can differentiate between outcome-level and sample-level causes. We discuss each in the following.
Outcome-Level Causes
Outcome-level causes refer to the selective reporting of results and occur when studies “report only some of the outcomes measured and the selection of an outcome for reporting is associated with the statistical significance or importance of the result” (Song et al., 2010, p. 21). Evidence for this bias is substantial in the medical sciences (e.g., Chan & Altman, 2005; Chan et al., 2004; Dickersin, 2005; Dwan et al., 2008; Sutton & Pigott, 2005; Vedula, Bero, Scherer, & Dickersin, 2009), and there is no compelling argument indicating that the situation is different in the organizational sciences (Banks & McDaniel, 2011; Rothstein et al., 2005a; Sutton, 2005). Sources for the selective reporting of results include author decisions, the editorial review process, and organizational constraints. For instance, an author may elect not to include certain results for outcomes or subgroup analyses when submitting a study to a journal. Similarly, during the editorial review process, editors or reviewers may ask to remove specific findings to save space (Banks & McDaniel, 2011; Evangelou, Trikalinos, & Ioannidis, 2005) or because they are deemed not interesting (Trikalinos & Ioannidis, 2005).
Sample-Level Causes
Sample-level causes of publication bias denote the nonpublication of an entire sample due to either the lack of submission or the rejection of a submission (Dwan et al., 2008; Song et al., 2010). Evidence from the medical sciences indicates that the primary cause of publication bias rests with authors as they may never submit studies for publication (Dickersin, 1990, 2005). Similarly, article rejections during the editorial review process contribute to sample-level causes of publication bias, particularly if the samples used in the rejected article never become publically available. Reasons for this may include poorly framed studies, small sample size studies, statistically insignificant findings, and results contrary to conventional wisdom, theory, or trends of past research (Banks & McDaniel, 2011; Chan et al., 2004; Dickersin, 2005; Pigott, 2009; Rothstein et al., 2005a; Sutton & Pigott, 2005). Thus, authors, reviewers, and editors can prevent the publication of results from an entire sample. Organizational constraints may also lead to the suppression of complete samples, as is the case when pharmaceutical companies fail to divulge results from entire trials that do not support their claims regarding the effectiveness of a drug (e.g., Curfman et al., 2006; Dickersin, 2005).
Study identification can also be a sample-level cause of publication bias. Due to resource constraints, systematic searches may not identify all available studies and their samples or fail to identify samples from studies that are in a foreign language (Banks & McDaniel, 2011). Despite recent open access projects (Schopfel & Prost, 2009), the identification of studies in the grey literature is particularly difficult and time-consuming, which could be a prevalent sample-level cause (Hopewell et al., 2005). As evidence suggests that published samples tend to report more significant and positive findings than the corresponding grey literature (e.g., Greenwald, 1975; Hopewell, McDonald, Clarke, & Egger, 2007; Song et al., 2010), publication bias is a likely result if not all samples from the Tier 2 or Tier 3 literatures are included in the meta-analysis.
Another cause pertains to the time-lag bias as the time to publication tends to be shorter for studies with large samples and statistically significant results than for studies with small samples and statistically insignificant results (Ioannidis & Trikalinos, 2005; Stern & Simes, 1997; Trikalinos & Ioannidis, 2005). A time-lag bias can result from the Proteus effect, which denotes a situation in which studies with large and significant results are published earlier as they appear dramatic and interesting (Ioannidis, 2005; Trikalinos & Ioannidis, 2005). Thus, a time-lag bias can result in publication bias in new literature areas (Banks, Kepes, & McDaniel, 2012). However, the presence of a time-lag bias does not have to manifest itself in publication bias, particularly over long time horizons (e.g., 20-plus years), because small magnitude effect sizes may eventually become available.
In sum, publication bias tends to be caused by decisions made by organizations, authors, and the editorial review process. If a decision leads to the suppression of a particular effect size, it is an outcome-level cause, and if a decision results in the nonpublication or nonidentification of an entire sample, it is referred to as a sample-level cause (Dwan et al., 2008; Song et al., 2010; Sutton & Pigott, 2005). Whereas it is very difficult to require researchers to analyze all their collected samples as well as to write and submit a journal article that includes all results, or to compel editors to publish all results of all submitted articles, it is important to assess the potential of publication bias empirically (e.g., to assess the robustness of the meta-analytic findings). Thus, for meta-analytic reviews to be accurate, both the samples (i.e., their effect sizes) included and those left out of the analysis must be considered. Traditionally, this has not been done in the organizational sciences. Yet, other scientific fields such as medicine have made this transition. These fields developed rigorous statistical techniques to examine the potential influence of publication bias and require its assessment (Higgins & Green, 2009). The current edition of the American Psychological Association’s (2010) publication manual also recommends the evaluation of publication bias in all meta-analytic reviews. To this end, this article illustrates publication bias analyses and describes the application of statistical methods for detecting and assessing publication bias.
Methods for Detecting and Assessing Publication Bias
Partly due to the quest for evidence-based medicine, the development of advanced methods to assess publication bias took place in the medical sciences (Egger, Smith, & Altman, 2001; Rothstein et al., 2005b; Sutton, Abrams, Jones, Sheldon, & Song, 2000). In this section, we review the traditional methods and the more advanced methods for publication bias detection and assessment. We discuss why the traditional methods (e.g., failsafe N and subgroup comparisons or analyses) are inadequate for the assessment of publication bias. Then, we describe the more advanced methods to assess publication bias before illustrating their application.
Traditional Methods for Detecting and Assessing Publication Bias
Failsafe N
Originally introduced by Rosenthal (1979), the failsafe N technique attempts to estimate the number of missing effect sizes that would be needed to make a meta-analytic mean effect size estimate statistically insignificant. The technique has several critical limitations, which were discussed more than a decade ago (Becker, 1994, 2005; Evans, 1996). For instance, the failsafe N assumes that all missing effect sizes are zero, which is improbable. Also, the technique focuses on the statistical significance of an effect size rather than the magnitude of the effect. These and other limitations have led to its abandonment in many areas of science where it is not considered to be a useful indicator of publication bias (Becker, 2005; Higgins & Green, 2009). In the organizational sciences, McDaniel et al. (2006) illustrated its limitations: its failure to detect publication bias when bias was very likely present (see also Banks, Kepes, & Banks, 2012). More recently, Aguinis et al. (2011) also debunked the myth that the failsafe N analysis is an effective indicator of publication bias. Similar caveats apply to modifications (e.g., Orwin, 1983) of Rosenthal’s original failsafe N technique (Becker, 2005; Higgins & Green, 2009). Unfortunately, despite this evidence, failsafe N techniques appear to be the predominantly used method to detect the potential presence of publication bias in the organizational sciences (see Table 1).
Subgroup analyses
The second most often used publication bias detection method in the organizational sciences is the subgroup analysis (see Table 1). When used in meta-analytic reviews in the organizational sciences, subgroup analyses typically compare published literature (i.e., Tier 1) to grey literature and personal/organizational samples (i.e., Tier 2 and Tier 3). A subgroup analysis can indicate the extent to which the published literature systematically differs from the “other” identified literature (e.g., unpublished samples). However, subgroup analyses implicitly assume that each data source (e.g., published vs. unpublished samples) is represented in an unbiased way. This is an improbable assumption (Hopewell et al., 2005), particularly in the organizational sciences where research studies are unregistered. 3 Similarly, subgroup analyses cannot evaluate the extent to which publication bias exists within the analyzed subgroups; bias within the published or unpublished literature cannot be assessed. Thus, in addition to statistical problems associated with subgroup analyses (e.g., Steel & Kammeyer-Mueller, 2002), conceptually, they cannot necessarily assess the presence or magnitude of publication bias in meta-analytic reviews and their results.
Advanced Methods for Detecting and Assessing Publication Bias
Funnel plot
The funnel plot displays the magnitude of the effect size on the X axis and precision (i.e., inverse of a sample’s standard error) along the Y axis (Sterne & Egger, 2005; Sterne, Gavaghan, & Egger, 2005). Larger effect sizes are plotted on the right side and smaller effect sizes are displayed on the left side of the funnel plot. As precision is plotted on the Y axis, more precise samples are plotted toward the top of the funnel plot; less precise samples are placed toward the bottom. Because more precise samples have less sampling error (i.e., such samples have larger sample sizes and have smaller standard errors), they typically cluster toward the top of the funnel plot around the population mean. By contrast, smaller samples, which are less precise, are typically dispersed across the base of the funnel plot (i.e., these samples deviate to a greater extent from the population parameter).
If sampling error is the sole cause of variance in the sample distribution, the distribution of samples will be symmetrical (Sterne et al., 2005). However, if small samples with statistically insignificant results are absent from a data set, the distribution of samples will be asymmetric. The same pattern is unlikely to emerge for large samples as such samples are more likely to achieve statistical significance and get published (Dickersin, 2005; Greenwald, 1975; Rothstein et al., 2005a; Sterne et al., 2005). Therefore, the funnel plot can provide evidence consistent with an inference of publication bias if the distribution of samples is asymmetric.
However, in addition to sample and effect size suppression (i.e., publication bias), funnel plot asymmetry can be caused by “true” differences between large and small samples (e.g., the small sample bias; Sterne et al., 2005, 2011). In drug trials, for instance, large magnitude effects may be observed in small samples, which are typically conducted early and tend to be comprised of high-risk patients who may benefit most from the drug, when compared to large samples with less ill patients (Smith & Egger, 1994). Thus, observed differences in effect sizes between small and large samples, causing funnel plot asymmetry, can be due to reasons other than publication bias. By incorporating contour lines that correspond to typical values of statistical significance (i.e., p < .05 and p < .10), the contour-enhanced funnel plot helps to distinguish publication bias from these other causes of funnel plot asymmetry.
Figure 1 depicts three contour-enhanced funnel plots. The shades in the contour-enhanced funnel plots indicate different levels of statistical significance. The white area is where statistically insignificant effect sizes would be found. The darkest (and thinnest) areas are where marginally significant effect sizes are found (.10 > p > .05). Finally, the large light grey shaded areas are where statistically significant effect sizes lie. The distribution of samples in panel (a) of Figure 1 depicts a symmetric distribution of samples, indicating that publication bias is likely to be absent (Peters, Sutton, Jones, Abrams, & Rushon, 2008; Sterne et al., 2011). However, if small samples with statistically insignificant results are absent from a data set, the distribution of samples will be asymmetric (see Figure 1 (b)). Here, it appears that many of the potentially “missing” samples are located in the insignificant (i.e., the white) area of the distribution. This provides credence to the likelihood that the asymmetry was caused by the suppression of insignificant effect sizes, predominantly from small samples (i.e., publication bias; Peters et al., 2008; Sterne et al., 2011).
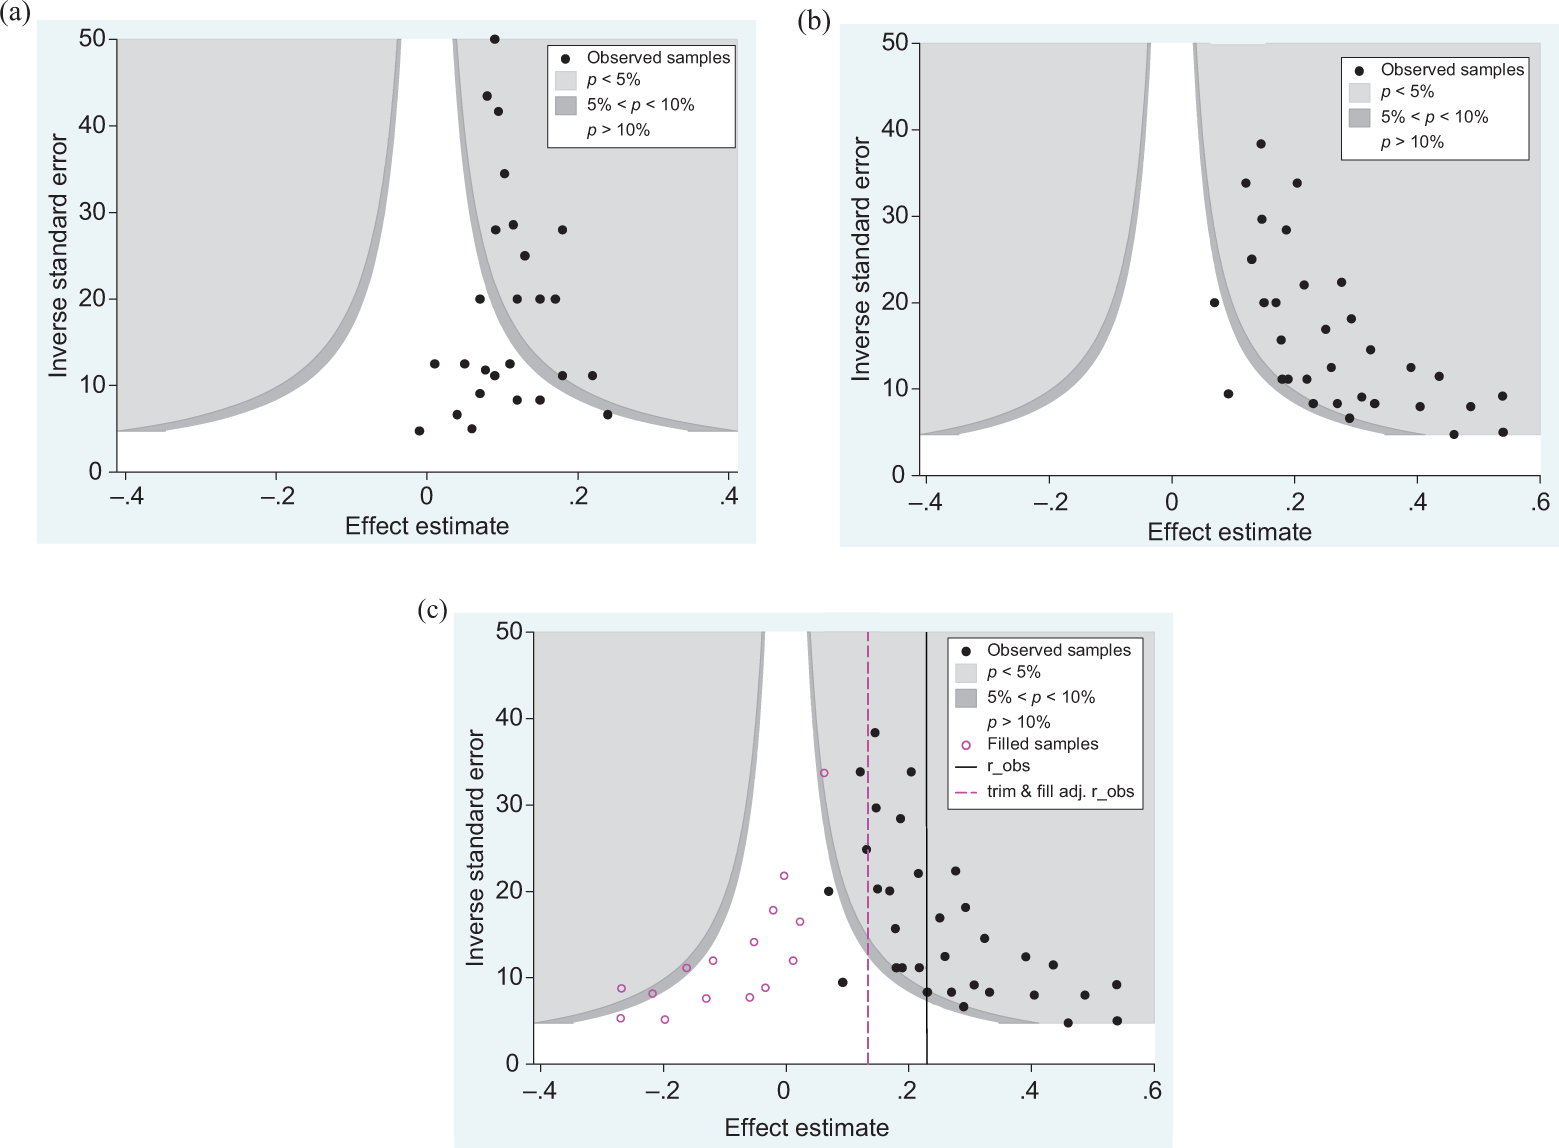
Illustrative contour-enhanced funnel plots. (a) Symmetrical funnel plot. (b) Asymmetrical funnel plot. (c) Asymmetrical funnel plot with imputed samples.
Finally, once the “missing” samples are imputed (with the trim and fill method; see the following section and Figure 1 (c)), it is evident that the imputed samples are small in size and that all except one of their effect sizes are insignificant. This provides further credence to the inference that the observed asymmetry is due to publication bias (Peters et al., 2008; Sterne et al., 2011). By contrast, if the distribution is asymmetric and “missing” samples were imputed in areas of statistical significance, evidence regarding the possibility that “true” differences between large and small samples (i.e., the small sample bias) have caused the observed asymmetry is provided (Peters et al., 2008; Sterne et al., 2011).
Trim and fill
Introduced by Duval and Tweedie (2000a, 2000b), the trim and fill method statistically evaluates the degree of symmetry in a funnel plot distribution (Duval, 2005); it assesses the extent to which the meta-analytically derived effect size would need to be adjusted due to the possible influence of publication bias. If asymmetry is present, the trim and fill method uses an iterative process to “trim” extreme effect sizes from the skewed side of the sampling distribution in the funnel plot. This procedure is repeated until the distribution of effect sizes is symmetrical. Then, the previously trimmed effect sizes are added back (i.e., “filled”) to the funnel plot with the imputed effect sizes on the opposite side needed to achieve symmetry (see Figure 1 (c)). Finally, trim and fill re-estimates the meta-analytic parameters (e.g., mean validities and confidence intervals) based on the original and the imputed data. Trim and fill is thus more informative than other methods as it estimates the number of missing samples and the mean validity in the potential absence of publication bias. Aguinis et al. (2011) have argued that it may be the best known technique for assessing the influence of publication bias.
There are three interpretation guidelines for the results of the trim and fill analysis (McDaniel et al., 2006; Rothstein et al., 2005a). First, if the meta-analytically derived mean effect size (i.e., the mean of the observed effect sizes) and the trim and fill adjusted mean effect size (i.e., the mean of the observed and imputed effect sizes) yield identical or comparable estimates, the effect size is robust to publication bias; namely, publication bias is likely to be absent or negligible. Second, if the difference in magnitude is of notable size, the effect size is unlikely to be robust. Yet, if the ultimate conclusion of the research does not change (e.g., a predictor of job performance is still valid), publication bias can be interpreted to be moderate. Finally, if the ultimate conclusion of the research changes as a result of the difference between the original meta-analytic mean effect size and the mean effect size adjusted for publication bias (e.g., a predictor of job performance is not valid), the influence of publication bias can be judged as severe.
Because the funnel plot is based on the assumption that random sampling error is the only source of variance, the accuracy of the trim and fill method is limited to the extent that the samples in the distribution are homogeneous (Duval, 2005; Sterne et al., 2005). When this assumption is violated (e.g., sex moderates the magnitude of an effect size), the trim and fill method, as any funnel plot–based method to assess publication bias (e.g., Begg & Mazumdar, 1994; Egger, Smith, Schneider, & Minder, 1997; Peters et al., 2008; Sterne & Egger, 2005), may yield incorrect results (Duval, 2005; Sterne et al., 2005; Terrin, Schmid, Lau, & Olkin, 2003). Then, trim and fill (and any other funnel plot–based method) can be performed in more homogeneous (i.e., moderator controlled) subgroups of the overall effect size distribution.
When performing a trim and fill analysis, several options are available. Generally, a meta-analysis may be completed using a fixed- or a random-effects model. 4 In the social and medical sciences, the appropriate meta-analytic estimation model is typically the random-effects model because the assumption that effect sizes are constant across samples is unlikely to be tenable (to account for between-sample variance due to moderators and other factors; Borenstein et al., 2009; Hunter & Schmidt, 2004; Sutton, 2005). Separate from the meta-analytic estimation model, the trim and fill analysis can be conducted using either a fixed- or a random-effects model. Generally, the fixed-effects model for the trim and fill process is recommended (Moreno, Sutton, Turner, et al., 2009; Sutton, 2005; Terrin et al., 2003) because research suggests that the random-effects model incorrectly adjusts asymmetry in the distribution of samples (Terrin et al., 2003) and gives too much weight to imprecise samples compared to the fixed-effects model (Sutton, 2005). In addition to the estimation method, one can also use an L or R estimator for the number of missing samples (for detailed description of the estimators, see Duval & Tweedie, 2000a, 2000b). The L estimator is generally preferred and the most commonly used approach. It is more robust, especially when the number of samples in the distribution is small (Duval, 2005; Moreno, Sutton, Turner, et al., 2009; Sutton, 2005; Terrin et al., 2003).
Cumulative meta-analysis
Cumulative meta-analysis (Borenstein et al., 2009) is an approach that sorts effect sizes included in a meta-analysis by a characteristic of interest, such as the date of publication or the effect sizes’ precision. Effect sizes are then added one at a time to the analysis, and the mean effect size is recalculated each time until all effect sizes have been added. If effect sizes are sorted by precision, the most precise effect size (i.e., the effect size from the largest sample) is added first, followed by the second most precise, and so on. This process is continued until the least precise effect size is added. As the cumulative estimate is recalculated during each iteration, the cumulative point estimates can be plotted in a forest plot. The plot can then be inspected for evidence of “drift” in the cumulative point estimate (Borenstein et al., 2009). When effect sizes are sorted by precision, a positive drift provides evidence consistent with the inference that small magnitude effects from small sample sizes are suppressed (McDaniel, 2009). When effect sizes are sorted by publication year (e.g., Lau & Antman, 1992; Lau, Schmid, & Chalmers, 1995), the cumulative meta-analysis can be used to evaluate the presence of a time-lag bias (Ioannidis, 2005; Trikalinos & Ioannidis, 2005); a negative drift from more positive cumulative point estimates to more negative estimates with the addition of more recent studies provides evidence indicative of the time-lag bias (i.e., the magnitude of the cumulative mean effect size decreases with the addition of more recent published effect sizes). In either scenario, an examination of the drift in the cumulative effect size estimate can inform conclusions concerning a potential bias and the robustness of the meta-analytically derived mean effect size estimate. The interpretation guidelines from the trim and fill analysis can then be used to determine the severity of the bias.
Correlation and regression-based methods
Begg and Mazumdar’s (1994) rank correlation test is one of several correlation and regression-based methods to detect publication bias. This test evaluates the interdependence of sampling variance and effect size by assessing the rank-order correlation between effect size and standard error (Sterne & Egger, 2005). As small sample studies with insignificant findings are more difficult to publish compared to large sample studies, regardless of their results, a significant inverse rank correlation indicates the presence of publication bias.
Egger’s test of the intercept (Egger et al., 1997) is conceptually a similar test. Yet, instead of assessing the rank correlation, precision is used to predict the “standardized effect” (i.e., effect size divided by its standard error) (Egger et al., 1997; Sterne & Egger, 2005). The Egger test is conducted using regression analysis in which the slope of the regression line represents the standardized effect (β1); bias is captured by the intercept (β0). In the case of a symmetrical funnel plot, the points of the regression line (i.e., the standardized effect against precision) will run through the origin (β0 = 0). By contrast, an intercept that is unequal to zero (i.e., β0 ≠ 0) indicates that less precise (i.e., smaller) samples have effects that differ systematically from larger samples and provides evidence suggesting that bias is present (Egger et al., 1997; Sterne & Egger, 2005).
Unfortunately, both tests, particularly Begg and Mazumdar’s rank correlation, have limited power (Borenstein et al., 2009; Kromrey & Rendina-Gobioff, 2006; Sterne & Egger, 2005). Their results may not be statistically significant if the number of samples is small, even if publication bias is present. It has thus been suggested that a statistically insignificant result is not necessarily an indication of the absence of publication bias (i.e., a significant result indicates the presence of publication bias while an insignificant one should be a reservation of judgment; Borenstein et al., 2009). To address the limited statistical power and other problems, modifications for both tests have been proposed (e.g., Harbord, Egger, & Sterne, 2006; Kromrey & Rendina-Gobioff, 2006; Macaskill, Walter, & Irwig, 2001; Moreno, Sutton, Ades, et al., 2009; Peters et al., 2006). Overall, the modified tests may not necessarily outperform the original ones, but they can under certain conditions (e.g., Harbord et al., 2006; Macaskill et al., 2001), especially when the outcome measure is the natural log of the odds ratio (lnOR) (Moreno, Sutton, Ades, et al., 2009). As a result, Sterne et al. (2011) recommended using the “normal” Egger test, unless the outcome is lnOR. However, all versions of Begg and Mazumdar’s rank correlation and Egger’s test of the intercept only assess whether bias is present and not the degree of it. Also, both tests, particularly with sufficient statistical power, may detect potentially “trivial” bias (i.e., bias that has little impact on the conclusions).
Meta-regression can also be used to assess the potential presence of publication bias (Sterne & Egger, 2005). Meta-regression, which applies the concept of multiple regression to the meta-analytic level (i.e., the sample is the unit of analysis), allows for the assessment of moderator variables as a potential cause for heterogeneity between samples when meta-analyzing the relation between two other variables of interest (Borenstein et al., 2009). Thus, publication tier or other subgroups could be examined as a potential moderator variable without the problems associated with traditional subgroup analyses (e.g., subgroup analyses may have low statistical power, are susceptible to multicollinearity, and are inconsistently affected by sample size, leading to potentially misleading results; Steel & Kammeyer-Mueller, 2002). Also, because publication bias is proportional to a sample’s standard error, one can use meta-regression to predict the effect size with precision (Doucouliagos & Stanley, 2009; Stanley, 2008; Sterne & Egger, 2005). This is similar to Egger’s test of the intercept.
Selection models
Another method for assessing the presence of publication bias is the use of selection models, also referred to as weight-function models. Originally, such models were developed by econometricians to deal with missing data at the item level (Schafer & Graham, 2002; see also Berk, 1983; Heckman, 1976). The first applications of these models to the issue of publication bias were by Hedges and colleagues (e.g., Hedges, 1992; Vevea, Clements, & Hedges, 1993; Vevea & Hedges, 1995). In general, selection models describe how the meta-analytic distribution is influenced by a selection process that affects how effect sizes are included in the observed distribution based on specific characteristics. Thus, contrary to the conventional meta-analytic model where all effect sizes in the meta-analytic distribution have a 100% chance of being included in the estimation model, a selection model estimates probability weights for inclusion that may differ from 100% (i.e., 1.0) (Hedges & Vevea, 2005; Vevea & Woods, 2005). These weights are based on characteristics of effect sizes, such as their level of statistical significance (Hedges & Vevea, 2005; Vevea & Woods, 2005). Thus, the selection model accounts for the “often implausible specification” that all effect sizes have the same chance of being observed and included in a meta-analysis (Vevea & Woods, 2005, p. 433). 5 In other words, instead of all observed effect sizes having a 100% probability of being observed (i.e., a weight of 1.0), the selection model assigns a probability (i.e., a weight) to each effect size that may differ from 1.0, depending on a characteristic such as the effect size’s level of statistical significance, when estimating the meta-analytic mean effect.
The result of the selection model is an adjusted estimate of the mean effect size that can help in assessing how the effect size model (i.e., the conventional meta-analytic model) might change as a result of the selection process (i.e., the result indicates the extent to which the meta-analytically derived mean effect size is robust to the influence of publication bias). Thus, similar to the trim and fill analysis, the results should be interpreted by the degree of change between the observed mean and the adjusted mean effect size estimate. In addition, a selection model provides an estimate of the variance component, the degree of variation resulting from drawing a sample’s population from a distribution of potential populations. A large variance component indicates substantial residual between-sample variance, which can lead to the instability of the adjusted mean effect size estimate, making it potentially inaccurate.
Unfortunately, the estimation of publication bias using selection models has been limited by data set requirements because a large number of samples is necessary to estimate the model with adequate accuracy (e.g., at least 100 samples; Vevea & Woods, 2005). Due to this limitation, an a priori selection model approach was proposed in which the nature of publication bias can be specified a priori in order to evaluate the degree to which publication bias may influence the results if the magnitude of publication bias was moderate or severe (Hedges & Vevea, 2005; Vevea & Woods, 2005). 6 Under this approach, the weights for the selection model are estimated with specific p value cut-points that are set a priori to determine the likelihood that an effect size will be observed under moderate and severe instances of publication bias (Hedges & Vevea, 2005). For instance, under an assumption of moderate publication bias, an effect size with a p value between .000 and .005 may have a 100% probability of being observed (i.e., a weight of 1.0) while an effect size with a p value between .500 and .650 may only have a 60% probability of being observed (i.e., a weight of .60). By contrast, with an assumption of severe publication bias, the same two effect sizes may have a 100% and a 35% probability of being observed (i.e., weights of 1.0 and .35), respectively (Vevea & Woods, 2005). Thus, the weights for the selection model are not estimated based on the data but set a priori. The weights (i.e., the probabilities for an effect size with any given p value of being observed) are lower under the severe selection model when compared to the moderate selection model (see Vevea & Woods, 2005, p. 435, for the specification of the weights and probabilities). Assuming the p value intervals and their weights are representative of the population of samples, this analysis provides an estimate of the mean as if the meta-analytic distribution contains all available effect sizes regardless of their size and p values under moderate and/or severe instances of publication bias. A comparison of these estimates with the meta-analytic mean permits inferences concerning the degree to which publication bias is present.
However, this a priori approach has its own limitation in that selection models are proposed independent of the data. Unlike the other advanced publication bias methods, which are dependent on the data, this a priori approach is founded on the assumption that some degree of publication bias is present (i.e., a moderate or a severe degree of publication bias). Subsequently, a direct comparison of the a priori selection model to other advanced methods, which do not assume a priori that publication bias is present, is limited. Nonetheless, the introduction of the a priori approach allows researchers to employ the selection model technique without extremely large data sets.
Table 3 provides an overview of various methods to assess publication bias. Of these methods, the traditional methods (e.g., the failsafe N and subgroup analyses) appear to be inappropriate (failsafe N) or provide only a limited assessment (subgroup analyses) of publication bias. Of the advanced methods, the contour-enhanced funnel plot is valuable for the graphical visualization of distribution (a)symmetry and thus the potential of publication bias. The trim and fill method, cumulative meta-analysis, and the selection models are the only ones that provide an assessment of the magnitude of a potential bias. Therefore, they have some advantages over the other methods.
Statistical Methods for Detecting and Assessing Publication Bias
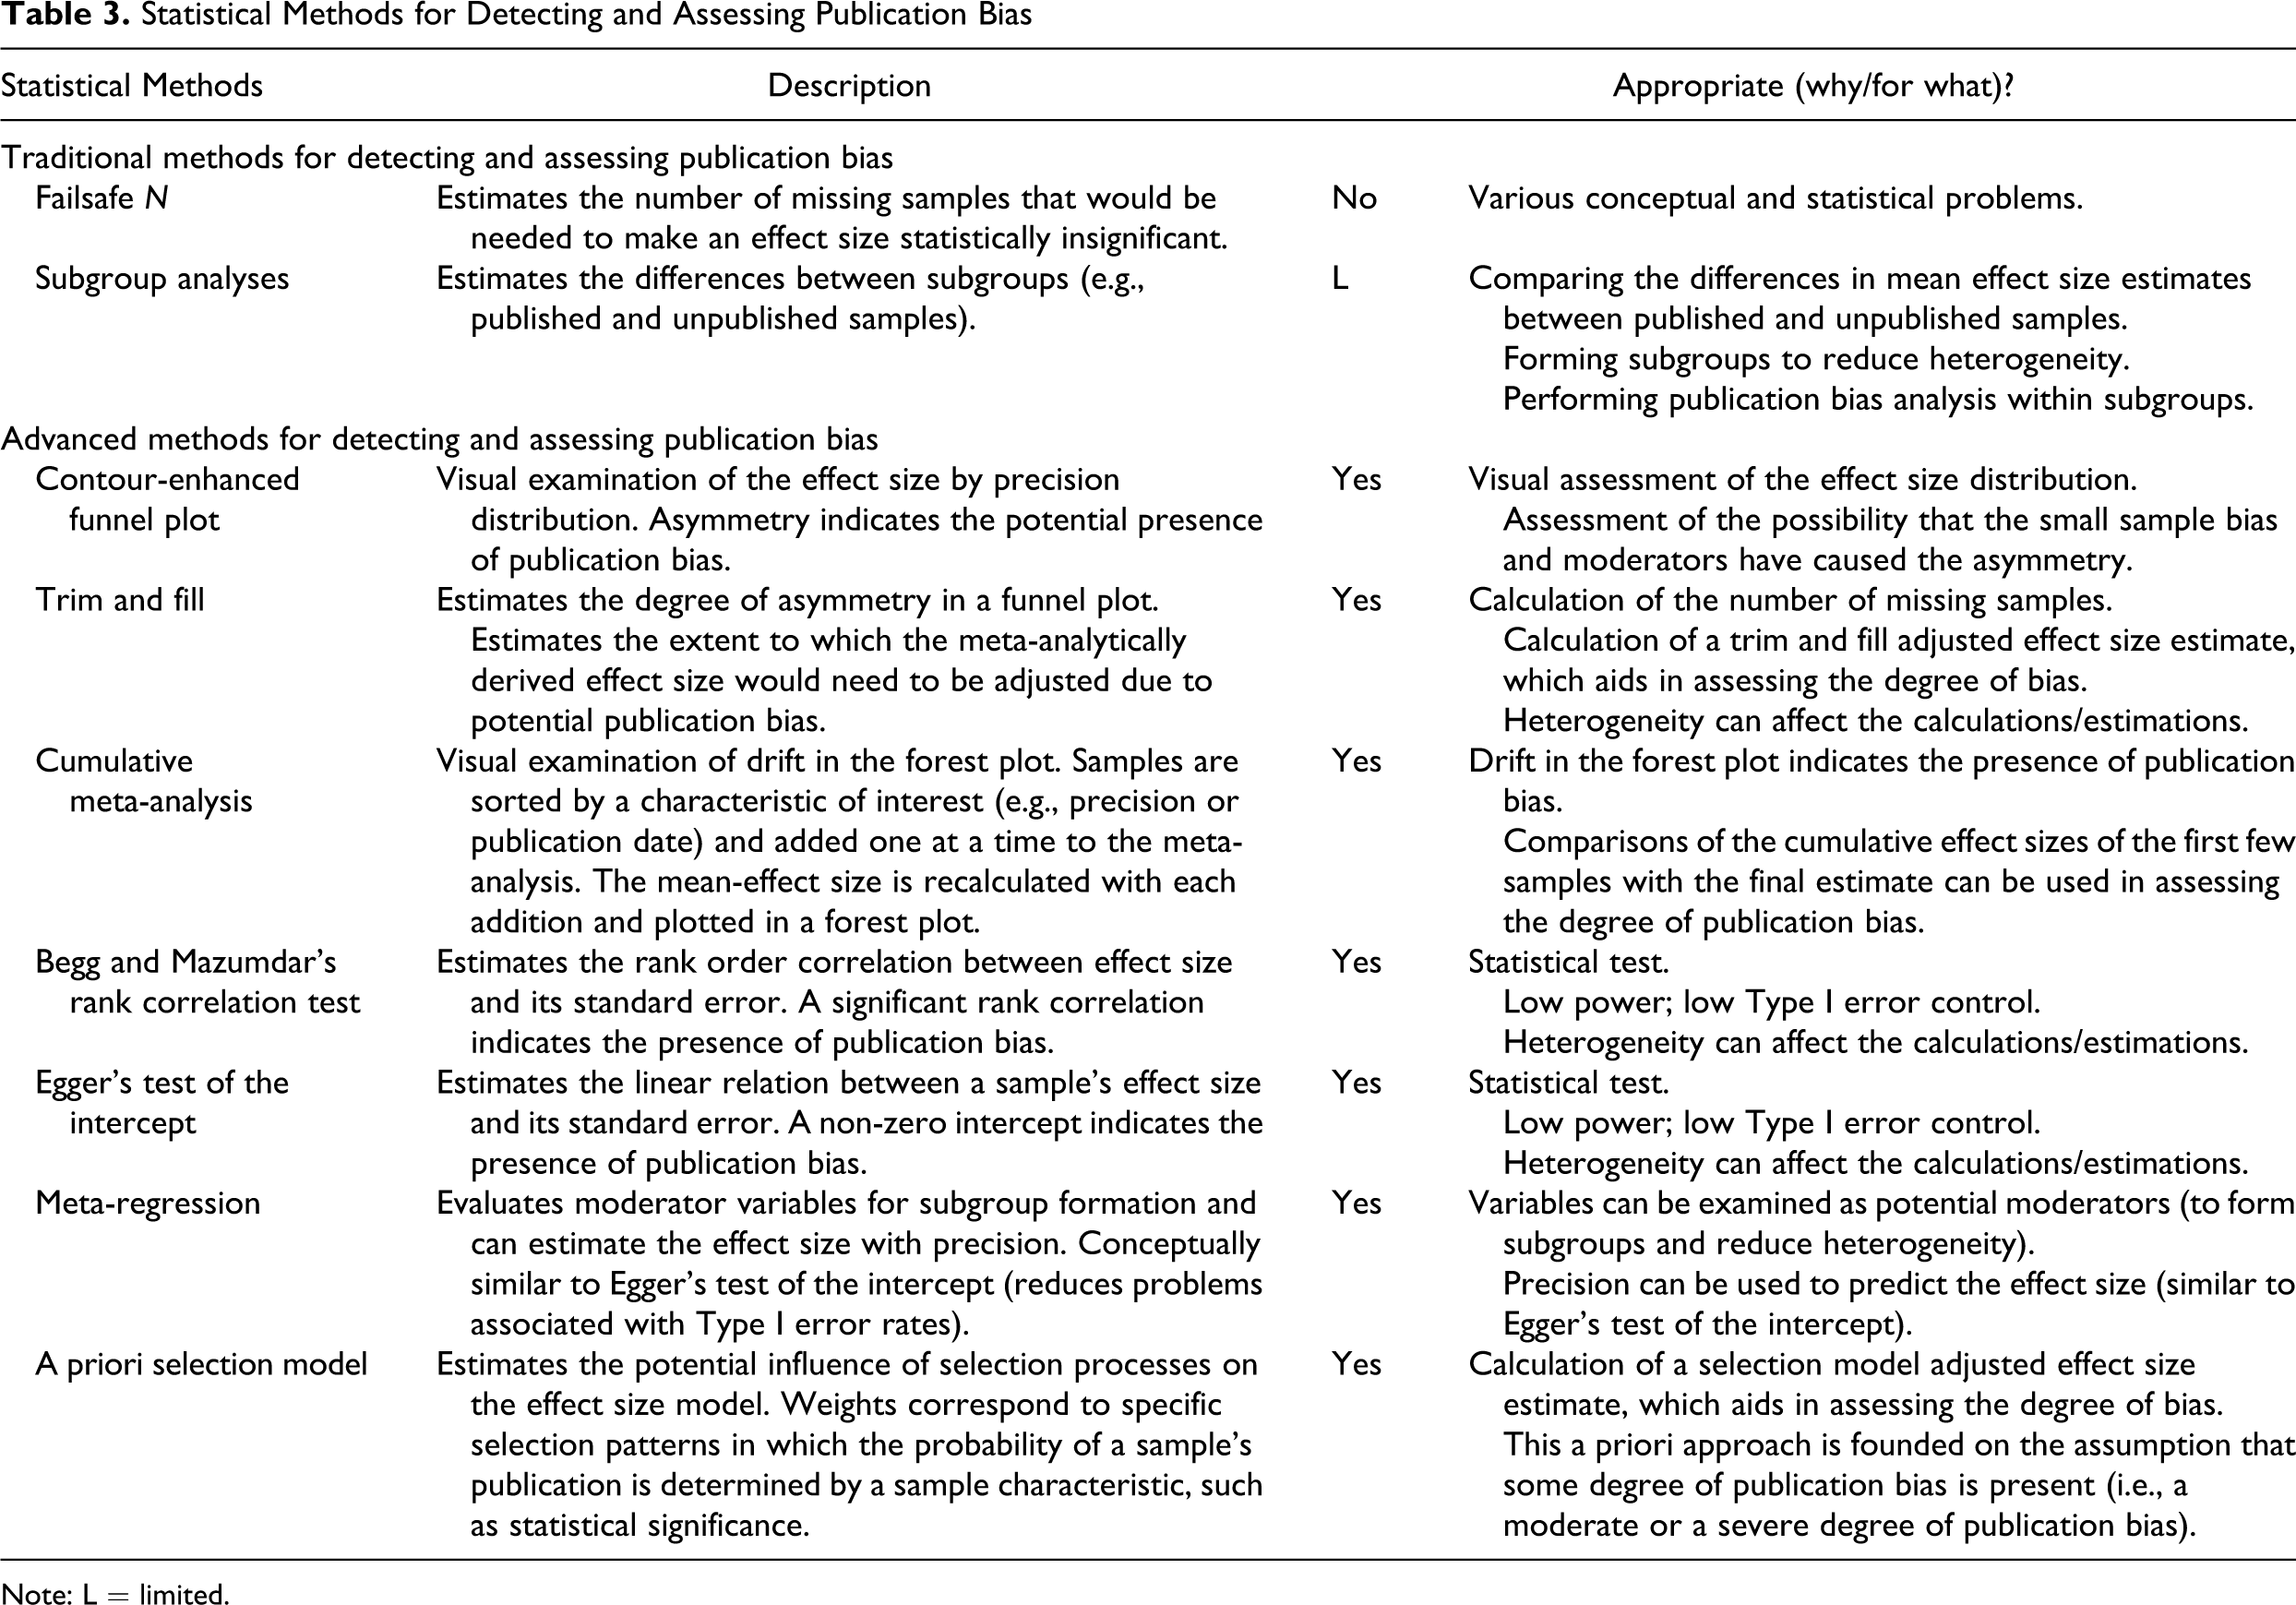
Note: L = limited.
Of the correlation/regression-based methods, Begg and Mazumdar’s rank correlation test seems to be the weakest due to its low power and limited Type I error control. The Egger test has similar problems, especially with dichotomous outcomes, but of lesser magnitude (Borenstein et al., 2009). Some modifications are available to reduce such limitations. However, all funnel plot–based methods (e.g., the funnel plot, trim and fill, Begg and Mazumdar’s rank correlation test, and Egger’s test of the intercept) are based on the assumption that heterogeneity is purely due to random sampling error. This is typically unlikely. Thus, it is important to assess the presence of moderators, preferably with meta-regression, and to perform publication bias analyses in identified subgroups that are thought to be relatively homogeneous (e.g., free of moderators). To safeguard against problems related to statistical power (Sterne et al., 2011) and second-order sampling error (Hunter & Schmidt, 2004), it is recommended to perform publication bias analyses in distributions of at least 10 samples (Sterne et al., 2011).
Unfortunately, meta-regression, cumulative meta-analysis, and selection models do not seem to have been used in the organizational sciences (for an exception for selection models, see Vevea et al., 1993). We could only find a limited number of studies in the psychology, medical, and economics literatures that have used these methods to assess the presence of publication bias (e.g., Chou, Fu, Huffman, & Korthuis, 2006; Cipriani et al., 2009; Doucouliagos & Stanley, 2009; Hedges & Vevea, 2005; Lau & Antman, 1992; Lau et al., 1995; Yang, Wong, & Coid, 2010). Thus, their effectiveness needs further evaluation.
Application and Illustration of Methods to Detect and Assess Publication Bias
Method
To illustrate the use of the advanced methods to detect and assess publication bias, we obtained the data on employment interview validities from McDaniel, Whetzel, Schmidt, and Maurer (1994). This data set was re-analyzed in the book on publication bias by Rothstein et al. (2005b; see, e.g., Duval, 2005; Hedges & Vevea, 2005; Sterne & Egger, 2005; Sterne et al., 2005). However, the analyses in the book contain a very limited number of subgroups, which were not identified through meta-regression. This, as explained, can affect the results of publication bias assessment methods (Sterne et al., 2005, 2011; Terrin et al., 2003).
Meta-Analytic and Publication Bias Assessment Approach
Analyses of the correlations were conducted using comprehensive meta-analysis (CMA; Borenstein, Hedges, Higgins, & Rothstein, 2005) to derive random-effects mean estimates and to conduct publication bias analyses (e.g., trim and fill analysis, Egger’s test of the intercept, Begg and Mazumdar rank correlation, and cumulative meta-analysis). Given that CMA is based on the Hedges and Olkin (1985) tradition of meta-analysis, the results differ slightly from meta-analyses using psychometric meta-analysis software (Hunter & Schmidt, 2004; Schmidt & Le, 2005). Contour-enhanced funnel plots were created with a modified confunnel command in Stata (Palmer, Peters, Sutton, & Moreno, 2008). 7
Meta-regressions were performed with the SAS software 8 to determine the significance of moderating variables and to identify which moderators we should use when forming more homogeneous subgroups (Lipsey & Wilson, 2001). Cumulative meta-analyses were performed by precision and year to examine the potential of publication bias and the time-lag bias, respectively. However, given that the data from McDaniel et al. (1994) span a 50-year time period, ranging from 1942 to 1992, any potential presence of the time-lag bias may be unlikely to have caused publication bias. Still, we perform the cumulative meta-analysis by year for illustrative purposes, to demonstrate how the time-lag bias can be assessed. A priori selection models were conducted in the R software package using Field and Gillett’s (2010) macro, which was adopted from Vevea and Woods (2005). 9 We use the p value cut-points for moderate and severe selection models suggested by Vevea and Woods (2005). Finally, we only assess the presence of publication bias in distributions of at least 10 samples (Sterne et al., 2011). The validity of results and conclusions from smaller distributions is questionable due to the lack of statistical power and second-order sampling error (Borenstein et al., 2005, 2009; Hunter & Schmidt, 2004; Sterne et al., 2011).
Results
Table 4 contains the results of our analyses.
10
The first column in Table 4 shows the distribution (i.e., the meta-analytic sample) analyzed. The next two columns provide general information (i.e., N and k) about the distribution. Columns 4 and 5 display the mean observed correlation and the associated 95% confidence interval (
Meta-Analytic and Publication Bias Results
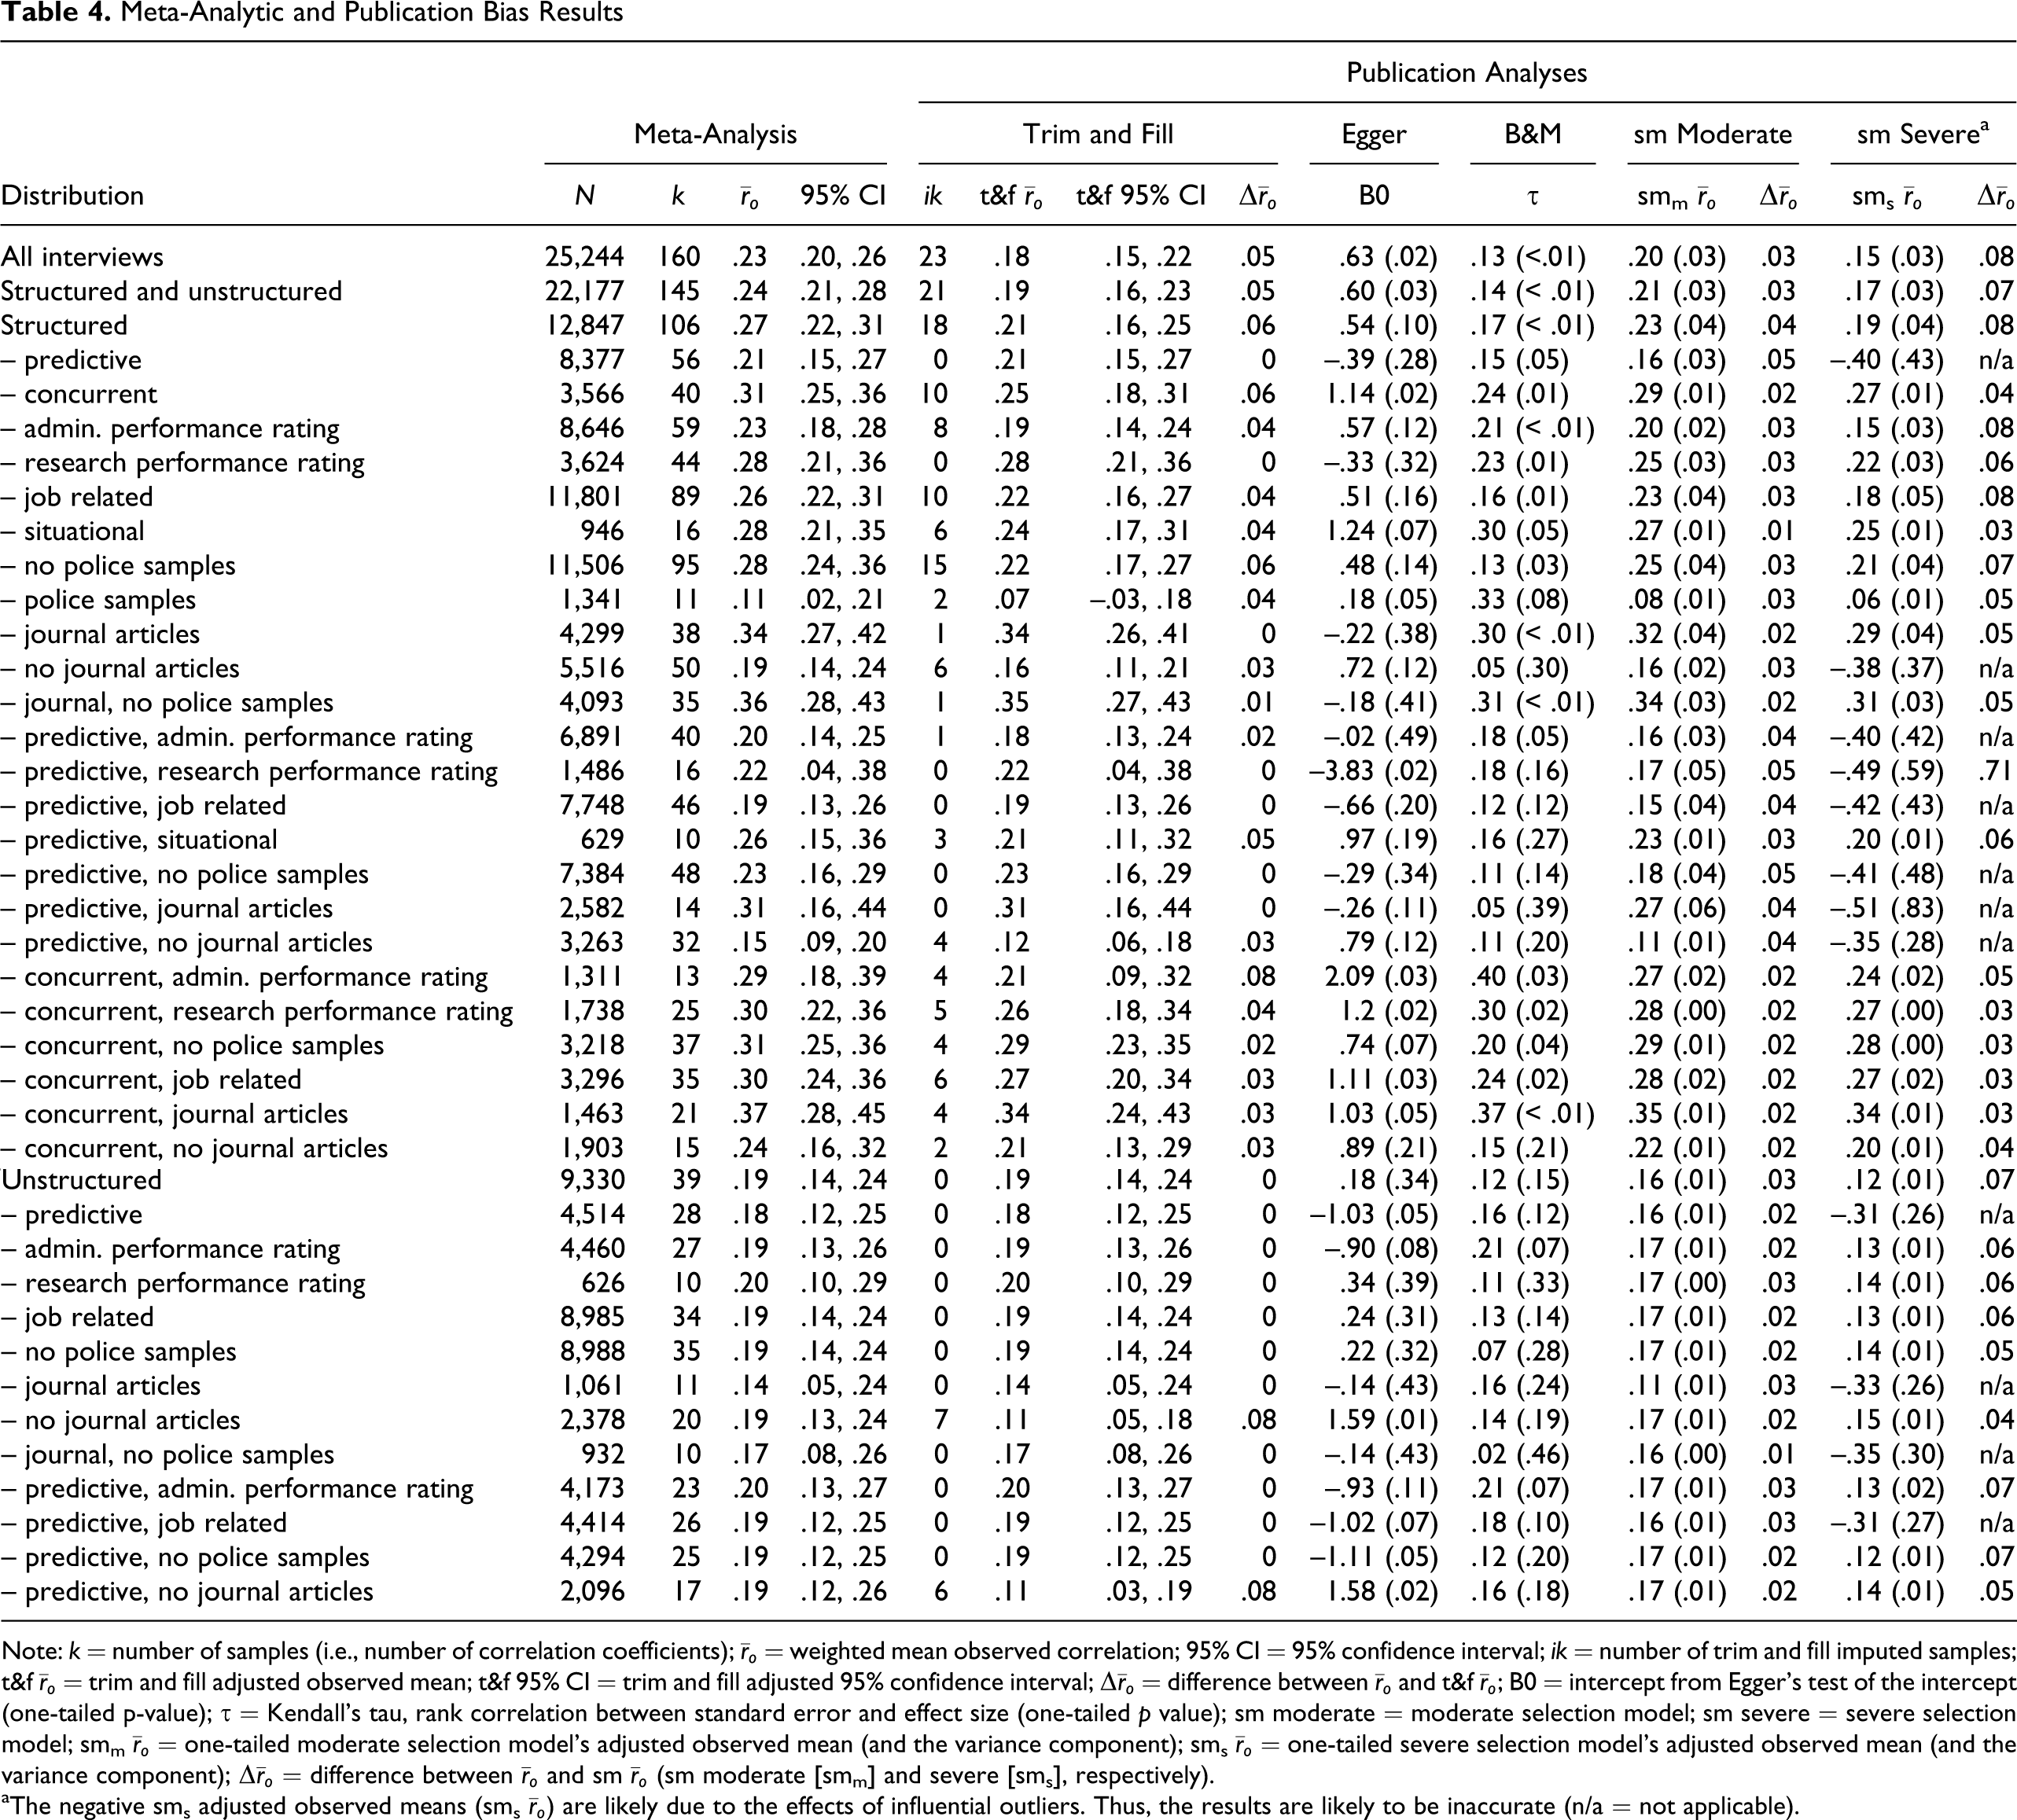
Note: k = number of samples (i.e., number of correlation coefficients);
aThe negative sms adjusted observed means (sms
Table 4 indicates that the two largest distributions (i.e., all interviews [N = 25,244, k = 160] as well as structured and unstructured interviews [N = 22,177, k = 145]) are noticeably affected by publication bias. In fact, the results of all methods in Table 4 indicate the presence of publication bias. 11 Thus, these results suggest that McDaniel et al.’s (1994) validity estimates are affected by publication bias. However, the results may be inaccurate due to moderating influences (i.e., between-sample heterogeneity). This is particularly likely for our results from funnel plot–based publication bias methods (Sterne et al., 2005, 2011; Terrin et al., 2003). Accordingly, we assessed the presence of conceptually identified moderators using meta-regression. From Table 5, it can be seen that all identified moderators except the degree of structure (i.e., structured), criterion (research), and sample size are statistically significant. Interview structure correlated highly with interview content, journal publication, and criterion purpose, and thus, its apparent insignificant effect can be attributed to multicollinearity.
Meta-Regression Results
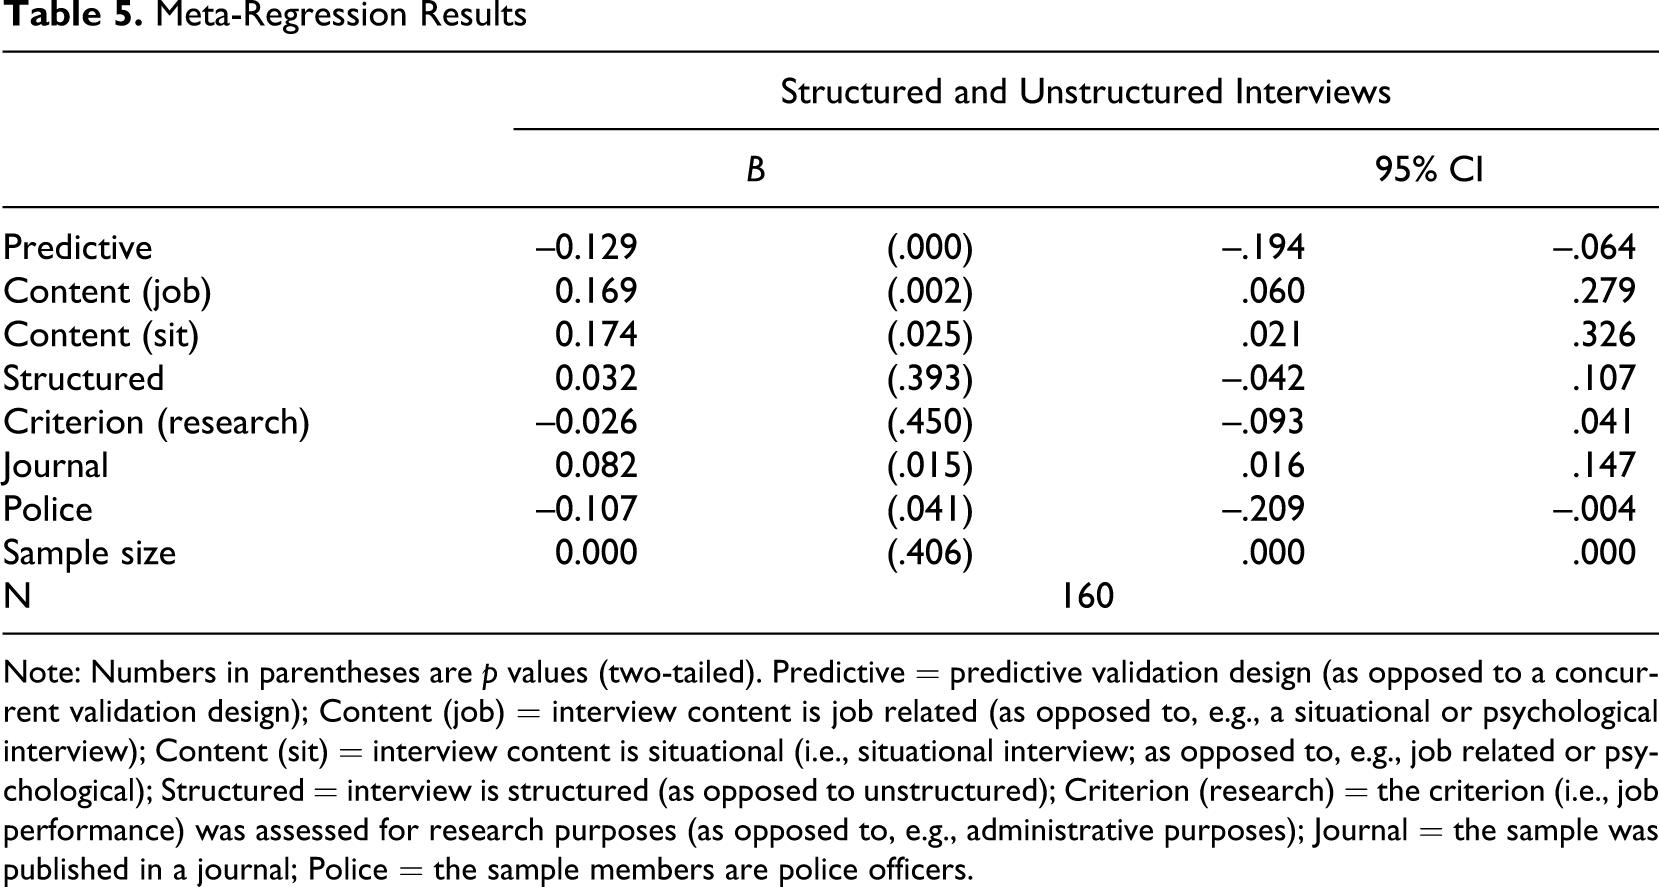
Note: Numbers in parentheses are p values (two-tailed). Predictive = predictive validation design (as opposed to a concurrent validation design); Content (job) = interview content is job related (as opposed to, e.g., a situational or psychological interview); Content (sit) = interview content is situational (i.e., situational interview; as opposed to, e.g., job related or psychological); Structured = interview is structured (as opposed to unstructured); Criterion (research) = the criterion (i.e., job performance) was assessed for research purposes (as opposed to, e.g., administrative purposes); Journal = the sample was published in a journal; Police = the sample members are police officers.
Based on these results, we formed subgroups and conducted publication bias analyses within them. We separated structured from unstructured interviews. For the distribution of structured interviews (N = 12,847, k = 106), the observed mean was .27 (95% CI [.22, .31]), which is relatively close to the one reported by McDaniel et al. (1994; i.e., .24). This disparity is due to the differences in weighting procedures between psychometric meta-analysis (Hunter & Schmidt, 2004; Schmidt & Le, 2005) and CMA (Borenstein et al., 2005, 2009). Trim and fill imputed 18 samples, leading to a trim and fill adjusted observed mean of .21 (Δ

Contour-enhanced funnel plots for selected distributions. (a) Structured interviews. (b) Structured interviews, predictive design. (c) Structured interviews, predictive design, administrative performance rating. (d) Structured interviews, concurrent design, administrative performance rating.
According to Duval (2005), a comparison of the mean observed correlation with the trim and fill adjusted mean observed correlation can help inform inferences concerning the presence of publication bias. For structured interviews, the relative difference in observed means (.27 vs. .21; a difference of .06 or 22%) is consistent with an inference of moderate publication bias. Also, the trim and fill adjusted 95% confidence interval starts at .16 instead of .22, reflecting the addition of the 18 imputed samples (ik) with effect sizes that are smaller than the observed mean. Begg and Mazumdar’s rank correlation (.17, p < .01) is significant, but Egger’s test of the intercept (.54, p = .10) is only marginally significant. The cumulative meta-analysis by precision (available from the first author) indicates some initial negative drift, counter to the common pattern of publication bias (Chan et al., 2004; Dickersin, 2005; McDaniel et al., 2006; Pigott, 2009; Rothstein et al., 2005a). However, the cumulative point estimate stabilizes relatively quickly (e.g., the cumulative point estimate after the first seven samples is almost identical to the meta-analytic estimate based on all samples), indicating that publication bias may not be present.
The assumption of a moderate one-tailed selection model resulted in an adjusted observed correlation of .23 (from .27, Δ
To remove additional heterogeneity from the distribution of structured interview validities, we separated predictive and concurrent designs. For predictive designs (N = 8,377, k = 56), the observed mean is .21 (95% CI [.15, .27]). The trim and fill analysis of this distribution indicated a symmetrical distribution and thus the likely absence of publication bias (see Figure 2 (b)). As a result, the trim and fill adjusted mean and confidence interval are identical to the meta-analytic ones. However, although Egger’s test of the intercept does not suggest the presence of publication bias, Begg and Mazumdar’s rank correlation is significant (.15, p = .05). As with the distribution of all structured interviews, the cumulative meta-analysis by precision indicates some initial negative drift in the first part of the forest plot (see Figure 3 (a)), but the cumulative estimate stabilized quickly near the meta-analytic mean estimate. Also, a comparison of the mean effect sizes of the most precise and least precise samples (the 25% most and least precise samples, respectively; N = 14, respectively) indicates that the difference is negligible (Cohen’s d = .03). Thus, the cumulative meta-analysis suggests no meaningful level of publication bias.
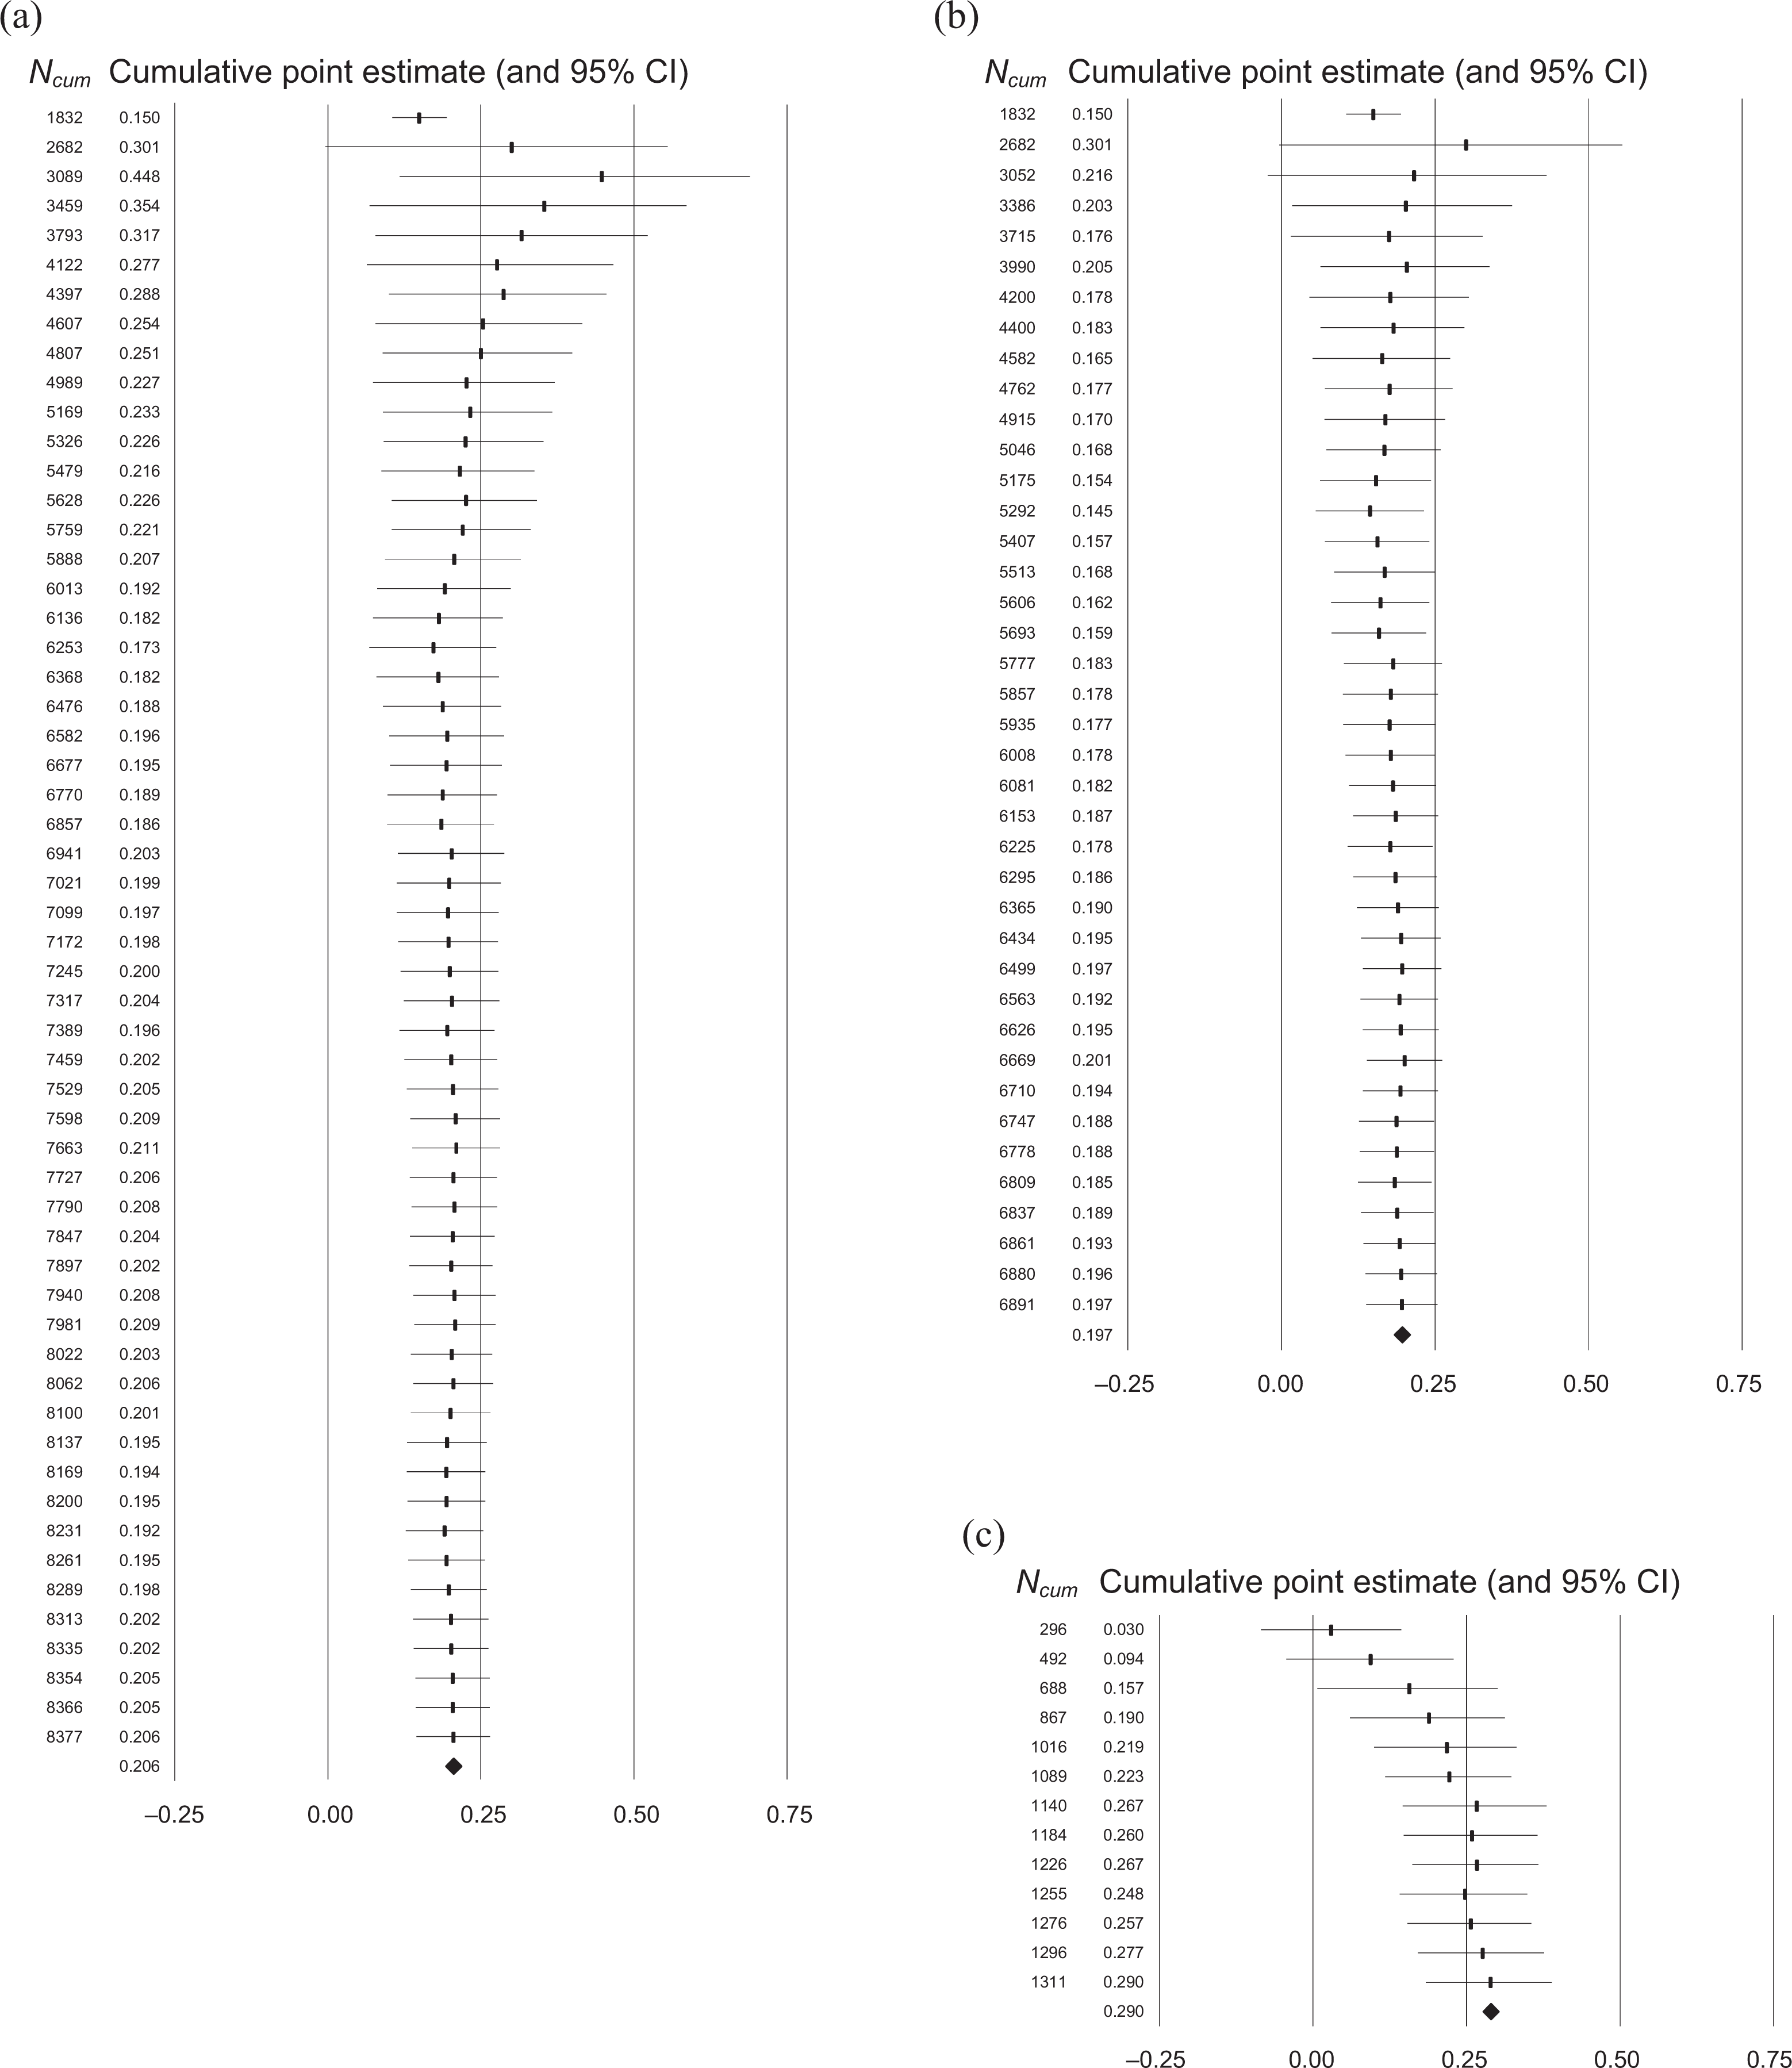
Cumulative meta-analyses by precision for selected distributions. (a) Structured interviews, predictive design. (b) Structured interviews, predictive, design administrative performance rating. (c) Structured interviews, concurrent design, administrative performance rating.
The cumulative meta-analysis by year of publication indicates some negative drift (see Figure 4 (a)). 12 The two earliest published samples (published in 1947) have a cumulative mean estimate of .67, and the first eight have an estimate of .33 (samples published before 1970), although the final meta-analytic estimate is .24. This pattern is indicative of the time-lag bias in that the earliest published samples tend to report larger effect size estimates than samples published later. Furthermore, a mean effect size comparison of the earliest and more recently published samples included in this distribution (the 25% earliest and more recently published samples [N = 8], respectively) indicates that the difference is relatively large (Cohen’s d = .41), which supports the inference of a time-lag bias. Additional analyses revealed that samples collected (or published) before 1970 have a mean effect size that is larger than the mean effect sizes of samples collected (or published) after 1970 (Cohen’s d = .51).

Cumulative meta-analyses by year of publication for selected distributions. (a) Structured interviews, predictive design. (b) Structured interviews, predictive design, administrative performance rating. (c) Structured interviews, concurrent design, administrative performance rating.
Finally, the selection model under an assumption of a moderate bias indicates an adjusted observed mean of .16 (from .21, Δ
For structured interviews with a predictive design where the job performance rating was conducted for administrative purposes (N = 6,891, k = 40), the observed mean is .20 (95% CI [.14, .25]), and trim and fill detects only minimal asymmetry in the distribution (see Figure 2 (c)). The one imputed sample is also in the light grey area (p < .05) of the funnel plot, signifying that it contains a significant effect size. The trim and fill adjusted mean and the 95% confidence interval (.18 and [.13, .24], respectively) are thus almost identical to the observed estimates, and Egger’s test of the intercept is insignificant. Only Begg and Mazumdar’s rank correlation is significant (.18, p = .05), suggesting a potential presence of bias. The cumulative meta-analysis by precision does not indicate a substantial drift (see Figure 3 (b)). Yet, a comparison of the mean effect sizes of the most precise and least precise samples (the 25% most and least precise samples [N = 10], respectively) indicates that the difference is not negligible (Cohen’s d = –.30).
The cumulative meta-analysis by year of publication for structured interviews with predictive designs and administrative performance ratings is shown in Figure 4 (b). Although the first sample has a substantially higher point estimate (.61) than the mean observed correlation (.24), the cumulative mean estimates after the third and seventh earliest published samples (.22 and .24, respectively) are very close or virtually identical to the cumulative mean once all samples are included (.24). The difference between the mean effect sizes for the early and most recent published samples (N = 6, respectively) is small to moderate (Cohen’s d = –.20). The moderate selection model yielded an adjusted observed correlation of .16 (Δ
The same holds true for most of the analyzed distributions (see Table 4). It appears as if publication bias does not affect the relation between structured interviews and job performance substantially, at least for predictive designs, once we account for moderating influences and form subgroups (see Table 4). Only for a few distributions does more than one publication assessment method indicate at least a moderate degree of publication bias. Further, even for these distributions, the evidence does not necessarily indicate a degree of publication bias that would alter the initial conclusions of McDaniel et al. (1994).
At first glance, the data for structured interviews from concurrent designs seem to be affected by publication bias. For most distributions, many publication bias methods indicate that bias is present. Yet, the differences between the meta-analytically observed mean, the trim and fill adjusted mean, and the selection model adjusted mean tend to be too small to make a substantial or practical difference. Only for one distribution (structured interviews, concurrent, administrative performance rating; N = 1,311, k = 13) is the difference quite substantial (Δ
The cumulative meta-analysis by precision supports an inference of publication bias for this distribution (see Figure 3 (c)) as the cumulative mean shows some rather severe positive drift from .03 (Ncum
= 296, kcum
= 1) to .19 (Ncum
= 867, kcum
= 4) and .29 (Ncum
= 1,311, kcum
= 13), suggesting that small sample studies with small, potentially insignificant effect size estimates are likely to be missing from the available literature. This is supported by a comparison of the mean effect sizes of the most precise and least precise samples (the 25% most and least precise samples [N = 3], respectively), which indicates that the difference is severe (Cohen’s d = –3.67). The cumulative meta-analysis by publication year suggests that the time-lag bias is present (see Figure 4 (c)). This is supported by the assessment of the difference between the mean effect sizes for the early and more recently published samples (the 25% earliest and more recently published samples [N = 3], respectively; Cohen’s d = .37). Finally, the selection models yield adjusted observed correlations of .27 and .24, respectively (Δ
For the data on unstructured interviews, most results suggest that publication bias is not a substantial problem (see Table 4). Only for two distributions (i.e., unstructured interviews, no journal articles [N = 2,378, k = 20] and unstructured interviews, predictive design, no journal articles [N = 2,096, k = 17]) do the majority of the methods indicate that publication bias is likely to be present. However, although the fixed-effects trim and fill analysis indicates the presence of publication bias for both distributions, the random-effects trim and fill did not support the findings. 15 Regardless, the overall evidence suggests that the two distributions may contain some noticeable publication bias.
Taken together, once we account for moderating influences, the data are relatively free of publication bias. As Table 6 illustrates, for most distributions, the results of the majority of the publication bias assessment and detection methods are generally in agreement, indicating that publication bias is likely to be present or that publication bias is likely to be absent or negligible. For the two largest distributions ([a] all interviews and [b] structured and unstructured interviews), although most methods indicate that publication bias is likely to be present, we suggest that the results, particularly for the funnel plot–based methods (e.g., contour-enhanced funnel plot, Egger’s test of the intercept, Begg and Mazumdar’s rank correlation test, and trim and fill), could be due to unaccounted for moderating effects (Duval, 2005; Sterne et al., 2005, 2011; Terrin et al., 2003). Out of the 40 analyzed distributions, there are only 6 instances where the publication bias detection and assessment methods tend to provide results that are in disagreement, leading to an overall “inconclusive” interpretation (see Table 6). In one of these instances, the distribution of structured interviews, moderating effects may have caused some of the results. As another example, for the distribution of structured interviews with a concurrent design and a research performance assessment, some methods (e.g., contour-enhanced funnel plot, Egger’s test of the intercept, and Begg and Mazumdar’s rank correlation test) indicate that publication bias is present. Yet, neither the selection models nor the cumulative meta-analyses suggest the presence of publication bias. Because these latter methods are less likely to be affected by between-sample heterogeneity (Borenstein et al., 2009; Hedges & Vevea, 2005), they may provide more accurate results. Also, although we found that some distributions were affected by the time-lag bias, this bias did not cause publication bias. Most likely, as expected, the 50-year time horizon of the McDaniel et al. (1994) data set ensured that even small magnitude effect sizes were eventually made available.
Summary of Publication Bias Results and Conclusions
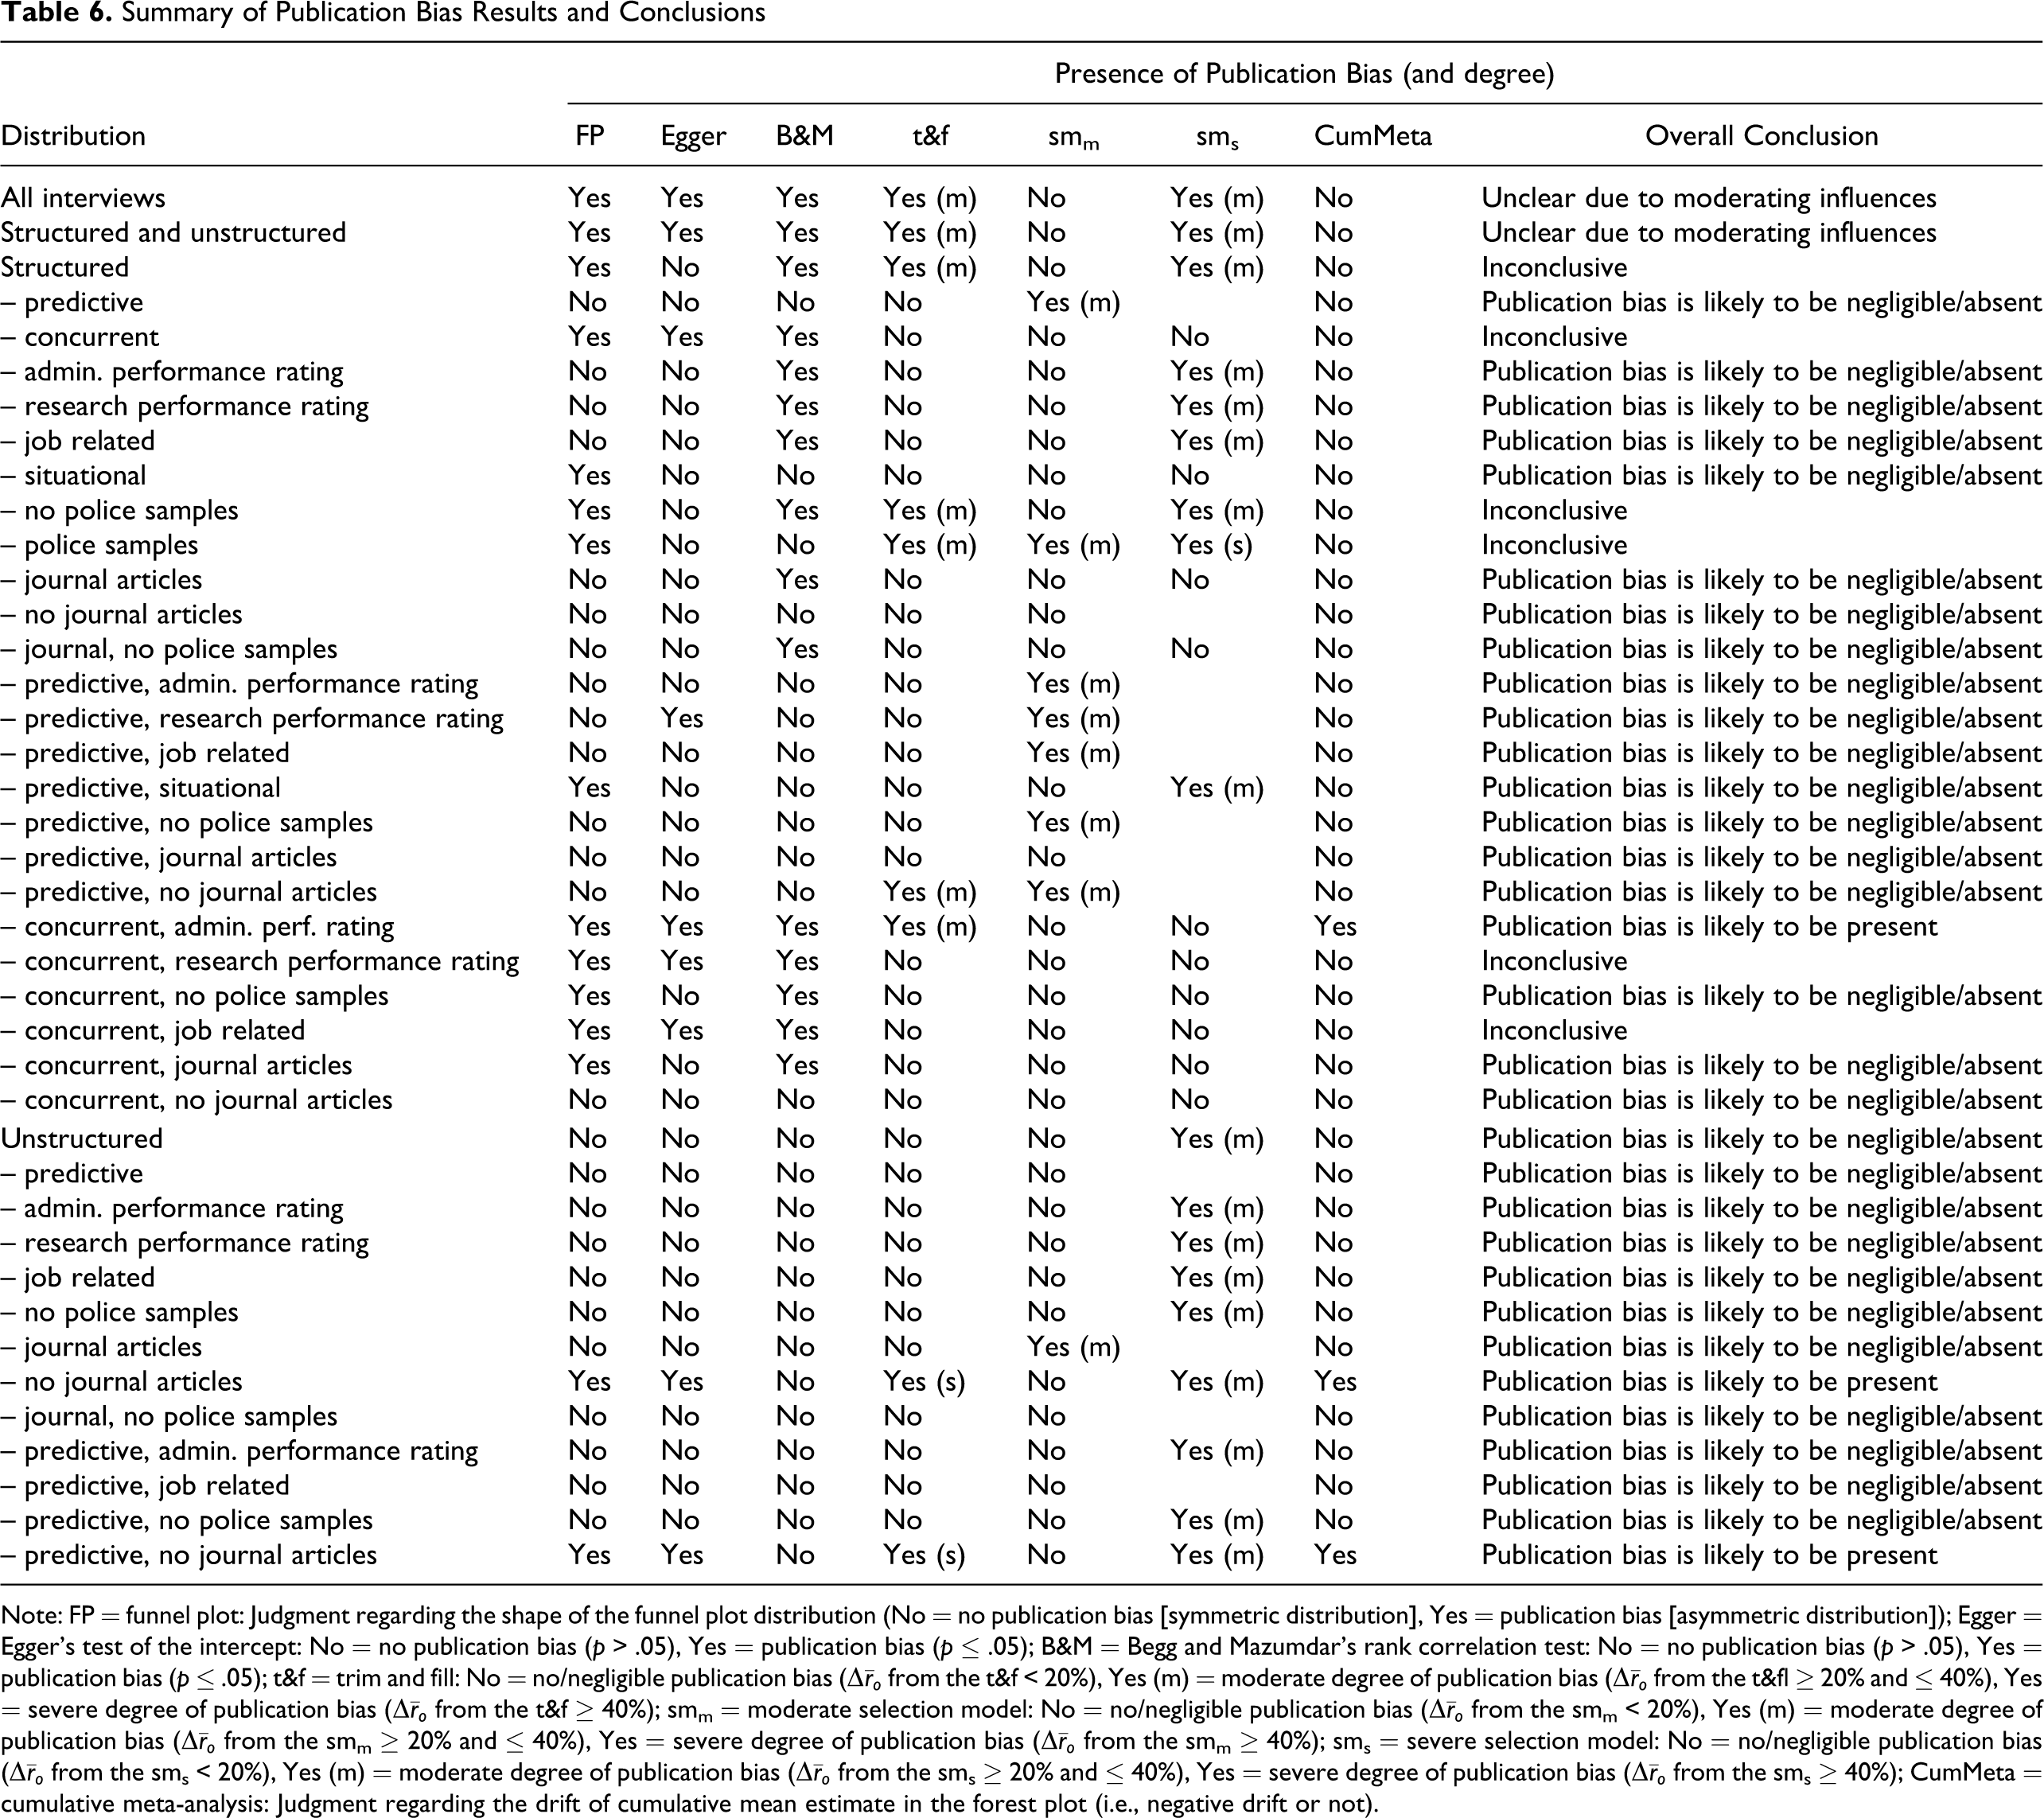
Note: FP = funnel plot: Judgment regarding the shape of the funnel plot distribution (No = no publication bias [symmetric distribution], Yes = publication bias [asymmetric distribution]); Egger = Egger’s test of the intercept: No = no publication bias (p > .05), Yes = publication bias (p ≤ .05); B&M = Begg and Mazumdar’s rank correlation test: No = no publication bias (p > .05), Yes = publication bias (p ≤ .05); t&f = trim and fill: No = no/negligible publication bias (Δ
Additionally, it is interesting that a comparison of published to unpublished (e.g., journal articles vs. no journal articles; predictive, journal articles vs. predictive, no journal articles) distributions for structured interviews indicate that published samples have substantially larger effect size estimates. This is indicative of a suppression of small effect size samples in our published literature. However, several publication bias methods failed to detect this bias. Most likely, this is due to the fact that meta-analytic distributions of the published data were symmetrical. Then, the current methods, particularly funnel plot–based ones, have difficulty detecting it. This finding highlights the value of subgroup analyses, which, although limited, are able to detect bias in this situation. It is also noteworthy that the difference between predictive and concurrent designs is substantial. For example, structured interview samples with a predictive design have a meta-analytically derived observed mean (.21) that is .10 smaller than the observed mean for samples collected using a concurrent design (.31). This pattern repeats itself for several distributions involving the type of validation design, indicating that on average, samples from predictive validation designs have smaller effect size estimates than samples from concurrent validation designs. This is counter to commonly held beliefs (Ployhart, Schneider, & Schmitt, 2006; Schmitt, Gooding, Noe, & Kirsch, 1984), but aligned with other meta-analytic results (e.g., Hough, 1998; Ones, Viswesvaran, & Schmidt, 1993), even in the employment interview literature (Huffcutt, Roth, Conway, & Klehe, 2004).
Discussion
The objective of this article was to address some of the challenges of publication bias in the organizational sciences, which range from a lack of awareness to the use of inadequate assessment methods. Because publication bias represents a situation where data are NMAR, common methods to deal with missing data are inappropriate (Chen & Åstebro, 2003; Newman, 2009; Schafer & Graham, 2002; Sutton & Pigott, 2005). We thus described methodological advances, primarily from the medical sciences, for the detection and assessment of this type of missing data (i.e., publication bias). Although information on some of these methods is readily available (McDaniel et al., 2006; Rothstein et al., 2005b), the vast majority of meta-analytic reviews in the organizational sciences seem to pay little or no attention to the possibility of publication bias (see Table 1). Furthermore, information on some methods, including contour-enhanced funnel plots, cumulative meta-analysis, selection models, and meta-regression, are even more scarce in our literature. We illustrated the use of these methods on a data set that could potentially contain publication bias (see Rothstein et al., 2005b). We hope that the descriptions and application of the methods illustrate why it is important that the organizational sciences understand and embrace these advanced methods.
Although verification of McDaniel et al.’s (1994) conclusions was not the purpose of this article, our results indicate that publication bias does not seem to have affected their conclusions. The research conclusions and practical implications are unlikely to change, whether the validity estimate for structured employment interviews is, for instance, .27 (our observed meta-analytic estimate), .23 (our estimate from the moderate selection model), or .21 (our estimate from the trim and fill analysis). The same holds true for unstructured interviews. We thus conclude that the effect of publication bias in McDaniel et al. (1994) overall is minimal (McDaniel et al., 2006; Rothstein et al., 2005a). However, there appear to be substantial differences between distributions involving samples published in journal articles and samples from other sources, indicating that sample suppression may have taken place; that is, only samples with significant effect sizes tend to get published in our journals. Therefore, effect size magnitude and significance level seem to affect the decision to submit articles for publication or to publish articles on the relation between interviews and job performance.
Limitations and Recommendations
Several of the publication bias detection methods are based on the degree of funnel plot asymmetry, and this asymmetry can be caused by factors other than publication bias (Sterne et al., 2005, 2011). Of particular issue here is the small sample bias because, technically, these methods assess whether the results from small samples are significantly different from the results from large samples. To safeguard against this and related issues, we used the contour-enhanced funnel plot, which helps to distinguish publication bias from other potential causes of funnel plot asymmetry (Peters et al., 2008; Sterne et al., 2011). Moreover, in the literature on interview validities, there appears to be no legitimate reason to assume that the magnitude of effect sizes should vary across sample sizes (i.e., no compelling reason for a small sample effect not due to publication bias). We also used meta-regression to identify moderators empirically and to form more homogeneous subgroups (i.e., to minimize the possibility that funnel plot asymmetry resulted from moderating effects; Sterne et al., 2005). Yet, it is possible that moderating effects that are currently unknown (i.e., moderating variables for which we have not controlled) might explain some of the observed funnel plot asymmetry. To alleviate some of these concerns, cumulative meta-analysis and selection models, which are less affected by moderator induced heterogeneity (Borenstein et al., 2009; McDaniel, 2009; Peters et al., 2010; Terrin et al., 2003; Vevea & Woods, 2005), provided generally confirmatory results.
Some of the methods we used (e.g., Egger’s test of the intercept and Begg and Mazumdar’s rank correlation test) have limited statistical power. Following recommendations by Sterne et al. (2011), we interpreted the results of these tests only when the number of effect sizes in a distribution was greater than 10. Nonetheless, the lack of statistical power could raise doubts regarding the results for some of our smaller distributions (Borenstein et al., 2009). Similarly, with very large distributions, these tests may indicate that publication bias is present although the practical effect could be negligible. Thus, at a minimum, these tests should be supplemented with other publication bias detection and assessment methods (e.g., trim and fill, selection models, and cumulative meta-analysis) to judge the degree or extent of the bias.
Although most results of the methods generally agreed with each other, this was not always the case (see Table 6). Quite often, at least one or two methods indicated results opposite to the other methods. The discussed problems related to the statistical power, particularly for Begg and Mazumdar’s rank correlation test and, to a somewhat lesser extent, for Egger’s test of the intercept, are likely reasons for some of the disagreements. Still, these findings beg the question of what method(s) is/are the most accurate for the detection and assessment of publication bias. Some have suggested that the trim and fill may be the most advanced technique for the assessment of publication bias (e.g., Aguinis et al., 2011). Others argued that selection models may be superior to the trim and fill and related methods (e.g., Field & Gillett, 2010; Vevea & Woods, 2005). However, selection models can yield nonsensical estimates, and research on the effect of the width of the probability intervals, including the consolidation process of the probability cut-points, is limited. To answer these questions, we need additional research, particularly simulation studies. Unfortunately, there are only a very limited number of such studies, mostly in the medical sciences (e.g., Terrin et al., 2003). Studies comparing the performance of different methods are lacking. It is quite possible that the superiority of one particular method depends on various factors (e.g., number of samples in the meta-analytic review, degree of heterogeneity, effect size variation of the primary samples, meta-analytic effect size estimate, etc.; Hedges & Vevea, 2005; Sterne et al., 2005, 2011; Terrin et al., 2003). We thus suggest that methods such as the trim and fill can be used along with selection models, cumulative meta-analysis, or other methods under varying conditions in simulation studies. Furthermore, simulation studies could consider whether the nature and/or form of the heterogeneity (Peters et al., 2010) affect publication bias results. Such studies can also explore whether relative indices (e.g., I 2 ; Higgins, Thompson, Deeks, & Altman, 2003) or absolute statistics (e.g., prediction or credibility interval; Borenstein et al., 2009; Hunter & Schmidt, 2004) are better assessments of heterogeneity and thus more informative in assessing the accuracy of publication bias results.
Until more definite evidence regarding the performance of the different methods emerges, we suggest that meta-analytic reviews incorporate multiple publication bias methods. Specifically, we recommend the use of methods that are based on somewhat different assumptions. For instance, Egger’s test of the intercept and Begg and Mazumdar’s rank correlation test are conceptually similar (Sterne & Egger, 2005). In addition, both are based on the funnel plot distribution, as is trim and fill and, obviously, the contour-enhanced funnel plot. The information from these methods may thus be somewhat redundant, and we do not recommend the sole reliance on funnel plot–based methods, particularly Egger’s test of the intercept and Begg and Mazumdar’s rank correlation, because of their discussed limitations.
Therefore, we suggest, at a minimum, (a) the use of subgroup comparisons of published and unpublished sources to account for the possibility that one or both of these distributions are symmetric, the use of two funnel plot–based methods, (b) the contour-enhanced funnel plot for a visual inspection of the distribution, and (c) the trim and fill method, because it not only assesses the presence, but also the degree of a potential bias. In addition, (d) selection models and (e) cumulative meta-analysis should be used because both are less likely to be affected by heterogeneous influences (Borenstein et al., 2009; Field & Gillett, 2010; Hedges & Vevea, 2005). Furthermore, the cumulative meta-analysis by year can be used to assess the potential of the time-lag bias. Although we did find some evidence of the time-lag bias in the McDaniel et al. (1994) data set, it did not manifest itself in publication bias. The potential for such a manifestation is likely to be greater in meta-analytic data sets on relatively new constructs and phenomena of interest (Ioannidis, 2005; Trikalinos & Ioannidis, 2005), such as conditional reasoning tests of aggression (Banks, Kepes, & McDaniel, 2012), emotional intelligence, and areas in new fields, such as entrepreneurship. Research is needed to evaluate the possibility of the time-lag bias in such literature areas. However, because the cumulative meta-analysis requires an interpretation of a graphic (i.e., the forest plot), there may be some ambiguity in the interpretation. Future research should examine the accuracy of various interpretation heuristics.
Because publication bias detection and assessment methods can be affected by heterogeneity, meta-regression should be used to identify likely moderating variables that can be used to form more homogeneous subgroups before assessing the potential presence of publication bias. However, this may not always be possible (e.g., too few samples per subgroup). Still, we recommend the use of publication bias detection and assessment methods in all meta-analytic reviews because most of these reviews are concerned with estimating the robustness and generalizability of effect size estimates. Results from publication bias methods provide valuable information in this regard. If meta-analytic researchers do not conduct such analyses, they assume, rather than empirically test, the notion that their data set is representative of all conducted samples (Vevea & Woods, 2005). Also, if heterogeneity is not worrisome enough to make a meta-analytically derived mean effect size uninterpretable, it should not universally prevent the use of publication bias methods, especially selection models and cumulative meta-analysis. Obviously, caution regarding the potential influence of heterogeneity should be expressed.
Our recommendation for the use of multiple publication bias methods is aligned with the concept of triangulation, which refers to the use of “multiple reference points to locate an object’s exact position” (Jick, 1979, p. 602; see also, e.g., Sackett & Larson, 1990; Scandura & Williams, 2000). In the context of meta-analysis, this may include the use of multiple publication bias methods to estimate the possible range of results rather than relying on a single point estimate. According to Orlitzky (2012), such an approach may be pivotal in advancing the methodological rigor in the organizational sciences. Furthermore, this approach is aligned with customer-centric reporting of results as both researchers and practitioners benefit from understanding the robustness of a meta-analytic estimate (Aguinis et al., 2010).
Prevention of publication bias
Although relatively sophisticated methods for the assessment of publication bias exist today, prevention of this bias is the best solution (Sutton, 2009). Recently, Banks and McDaniel (2011) provided some recommendations regarding this issue. A first step to minimize publication bias is a thorough systematic search of the literature. Descriptions of the literature search process in meta-analytic reviews reveals that this is not done consistently. Too often, the literature search is limited to a few electronic databases (Banks & McDaniel, 2011). Also, data from other researchers (e.g., unpublished data) can be extremely difficult to obtain (Wicherts, Borsboom, Kats, & Molenaar, 2006). Yet, only if the systematic search involves an extensive search of the unpublished literature (Tiers 2 and 3; see Table 2) can we have confidence that publication bias may be minimized (Sutton, 2009). As an example, the McDaniel et al. (1994) data set included more samples from unpublished sources than journal articles. Only because of this were we able to determine that the observed mean validity for interviews is likely to be less than .34, which was the meta-analytic observed correlation for samples of structured interviews published in journal articles. In fact, the trim and fill adjusted correlation of structured interview samples not published in journal articles is .16, which is less than half as high. Thus, the conclusions regarding the influence of publication bias would have been erroneous without McDaniel et al.’s (1994) initial literature search efforts.
Rothstein (2012) provides an excellent overview and description of a methodologically rigorous literature search, which can minimize the potential for publication bias (see also Sutton, 2009). Recent advances in electronic publishing, particularly in the medical and some natural sciences, may make the comprehensive and time-consuming endeavor more efficient. Similarly, research registries can provide significant aid in the literature search process (Berlin & Ghersi, 2005; White, 2009) because they allow the identification of prospective as well as unpublished relevant samples. Thus, such registries can provide a potentially unbiased sampling frame and the minimization of publication bias (Sutton, 2009). Regrettably, although such registries are common in some areas of science, none exist in the organizational sciences. Notably, many top-tier journals in the medical sciences may not publish studies unless their samples were registered prior to completion of the study (De Angelis et al., 2004; Laine et al., 2007).
A related issue pertains to the provision of supplementary information by publishers. Often, journal articles do not contain all possible statistical information, partly due to publishing costs and space constraints. Yet, journals in the medical sciences may provide such information online (Evangelou et al., 2005). As with research registries, this provides means to gain access to otherwise potentially unidentified samples and their effect sizes when conducting a meta-analytic review. We thus recommend that organizations within the organizational sciences (e.g., the Academy of Management [AOM] or the Society for Industrial and Organizational Psychology [SIOP]) create research registries and that journal publishers provide access to supplementary information on their web pages. This could play an important role in minimizing publication bias (Banks & McDaniel, 2011; Berlin & Ghersi, 2005). Relatedly, journal publishers may consider data release polices to make data of primary studies available some time after the publication of a study. This would allow for meta-analyses of raw data, which aids in minimizing publication bias and other biases (Stewart, Tierney, & Burdett, 2005).
Finally, given the state of the systematic search process in the organizational sciences, we recommend the development of better reporting standards to ensure transparency and replicability of the search. Aytug, Rothstein, Zhou, and Kern (2012) provided a relatively comprehensive account on the information that should be included in a meta-analytic review to ensure transparency and replicability not only of the search, but the meta-analytic review in general. This information could be submitted as supplementary material and made available online by the journal. Transparency and replicability could minimize some potential threats to the validity of the meta-analytically derived results, including publication bias, enhancing our confidence in conclusions based on the results (Cooper & Hedges, 2009; Rothstein, 2012).
Regarding the comprehensiveness of the literature search and the inclusion of samples from the grey and other literatures, some may argue that bias could be caused by the inclusion of “bad” samples and that the overall quality of samples should be judged prior to their inclusion in a meta-analytic review (e.g., Berman & Parker, 2002; Slavin, 1986). However, empirical evidence does not suggest this to be the case, which is not surprising given the causes of publication bias (e.g., Chan et al., 2004; Dickersin, 1990, 2005; Rothstein et al., 2005a; Song et al., 2010). Furthermore, quality scores can bias findings if inclusion decisions are made based on criteria that are not empirically tested (Hunter & Schmidt, 2004). There is also evidence indicating that interrater agreement of research quality judgments between even experienced evaluators is relatively low (.50; Cooper, 1998). Thus, the use of overall quality scores can yield inconsistent results, indicating that their use is problematic, particularly because of rater agreement and the heterogeneity of the quality construct.
However, this does not suggest that acknowledged poor samples should be included in a meta-analysis. Instead, sensitivity analyses could be conducted to assess the influence of potentially problematic samples (Borenstein et al., 2009; Hunter & Schmidt, 2004). More importantly, coding of publication status (e.g., published vs. unpublished study), sample type (e.g., student or employee sample), methodological characteristics (e.g., concurrent or predictive design), and other objective characteristics is clearly recommended (Lipsey & Wilson, 2001). One can then evaluate whether the coded characteristics are moderators, and publication bias analyses can be informed by knowledge of the moderators. Furthermore, the development of reliable and valid scoring rubrics for an overall quality score may be possible when objective characteristics are used in the rating procedure (Jonsson & Svingby, 2007). However, a major constraint for the development of such scoring rubrics could be that primary studies may not report all aspects of their study that should be assessed in a quality score. More stringent reporting standards for primary studies could thus be needed.
One may also argue that meta-analytic reviews are typically based on “incidental” effect sizes (i.e., effect sizes that are not the central effect size of the primary study), which could be unlikely to be subject to publication bias. Although the latter part of such a statement may be true, there is no empirical evidence for it. More importantly, the former part of the statement (i.e., meta-analytic reviews are typically based on “incidental” effect sizes) is not necessarily true. Instead, meta-analytic reviews tend to investigate the relation between constructs that are of great interest for the organizational sciences. Under this condition, all of the potential causes of sample or effect size suppression may take place, but we do not know to what extent. It is possible that certain literature areas are free of publication bias while others could be severely affected by it. This is an empirical question that our field needs to address. Similarly, it could be possible that effect sizes in particular literature streams are not NMAR, which would allow the use of more traditional methods to deal with missing data (Newman, 2009; Schafer & Graham, 2002). However, unless there is convincing empirical evidence that effect sizes are not NMAR, we discourage their use because of the severe problems with them when data are NMAR (e.g., Newman, 2009; Schafer & Graham, 2002; Sutton & Pigott, 2005).
Our recommendations are summarized in Table 7. Overall, we recommend that all meta-analytic reviews address the issue of publication bias in a comprehensive and systematic fashion. We note that this recommendation is aligned with the most recent version of the publication manual of the American Psychological Association (2010). Today’s advanced methods for the detection of this bias are readily available and can be used for virtually all effect size statistics; modified tests to better accommodate dichotomous and other statistics are also available (e.g., Harbord et al., 2006; Macaskill et al., 2001; Moreno, Sutton, Ades, et al., 2009; Peters et al., 2006). The results of these sensitivity assessments should always be reported. The confidence in meta-analytically derived validity estimates and their robustness are dependent upon the degree to which publication bias is or is not present in our literature. Advocating the use of a particular management practice based on potentially erroneous results may only widen the often lamented gap between research and practice (Banks & McDaniel, 2011; Briner & Rousseau, 2011).
Recommendations

Conclusion
Publication bias is a serious threat to the advancement of knowledge in the organizational sciences. Methodological advances employed in the medical sciences allow for a rigorous assessment of publication bias. Unfortunately, these techniques are rarely used in the organizational sciences. In this article, we described advanced methodological approaches and illustrated their use in order to demonstrate the need to evaluate the possible presence of publication bias in meta-analytic reviews. Our confidence in the validity and robustness of meta-analytic findings depend upon the degree to which publication bias is or is not assessed. We hope that this review results in the greater understanding and use of publication bias analyses in the organization sciences.
Footnotes
Declaration of Conflicting Interests
The author(s) declared no potential conflicts of interest with respect to the research, authorship, and/or publication of this article.
Funding
The author(s) received no financial support for the research, authorship, and/or publication of this article.