
Abstract
Researchers are generally advised to provide rigorous item-level construct validity evidence when they develop and introduce a new scale. However, these precise, item-level construct validation efforts are rarely reexamined as the scale is put into use by a wider audience. In the present study, we demonstrate how (a) item-level meta-analysis and (b) substantive validity analysis can be used to comprehensively evaluate construct validity evidence for the items comprising scales. This methodology enables a reexamination of whether critical item-level issues that may have been supported in the initial (often single study) scale validation process—item factor loadings and theorized measurement model fit, as examples—hold up in a larger set of heterogeneous samples. Our demonstration focuses on a commonly used scale of task performance and organizational citizenship behavior, and our findings reveal that several of the items do not perform as may have been suggested in the initial validation effort. In all, our study highlights the need for researchers to incorporate item-level assessments into evaluations of whether construct scales perform as originally promised.
Keywords
Within the social sciences, scholarly best practices for introducing a new survey instrument include reporting: extensive descriptive information regarding how original items were generated and then retained, various statistics for each item’s performance (e.g., factor loadings, item intercorrelations, Cronbach’s alpha) in one or a few samples, factor correlations, and the results of tests of conceptually derived measurement models (for more detailed discussion, see Ford, MacCallum, & Tait, 1986; Hinkin, 1998). 1 Indeed, these practices are recommended because they help to establish preliminary construct validity evidence and by extension provide some empirical basis for an instrument’s promise. Ideally, the scale would then be continuously examined and vetted in subsequent studies that either reaffirm or cast doubt on the scale’s potential (Cronbach, 1989; Nunnally, 1978).
To date, the overwhelming majority of efforts toward this goal have been aimed at only the scale level of analysis. By contrast, scholars do not always rigorously evaluate item-level properties in subsequent studies, and even when they do, the results are typically not fully reported in the actual publication (perhaps for innocuous reasons like editorial recommendations for reduced page length). This means that the evaluations of scales and items as well as the understanding of how they function are prohibited from evolving, and as a result, anyone in pursuit of such detailed item-level information must typically rely on the original paper.
This phenomenon is problematic for several reasons. First, most scale validation efforts are conducted in a single primary study, which is vulnerable to the idiosyncratic features of the sample or setting, sampling error (i.e., sample size), and measurement error (i.e., unreliability). Consequently, inter-item correlations and parameter estimates may vary across samples and result in inconsistent findings regarding whether the items actually fit the scale’s theorized structure. Second, the initial construct validation process cannot fully assess the generalizability of the initial empirical support for items as it does not (and cannot) account for all of the varied study contexts and conditions under which the scale will be used. As a result, the initial empirical support for items may only apply to the type of context (e.g., country, job type), rating source used (e.g., supervisor, self-, and peer ratings), or even the time (e.g., year) in which the initial validation study was conducted. Finally, even when inconsistent findings regarding items (e.g., low factor loadings) emerge in a subsequent primary study, it is uncertain how researchers should reconcile these findings with the initial scale development evidence. Altogether, though meta-analyses of construct scales and scale-level comparisons of nomological networks provide useful inferences of construct validity (Cronbach & Meehl, 1955), the scale-level approaches nevertheless mask important item-level issues that hinder a clear and comprehensive understanding of whether the items work as initially promised.
In the present study, we provide a blueprint for how to conduct a promising methodological technique that addresses construct-related validity concerns at the item level of analysis. Using a popular scale in the organizational sciences as an exemplar (i.e., Williams & Anderson’s, 1991, task performance and organizational citizenship behavior [OCB] Scale), we demonstrate how to combine (a) item-level meta-analytic techniques with (b) substantive validity analysis (i.e., a form of content analysis; Anderson & Gerbing, 1991) to obtain and evaluate comprehensive construct validity evidence for the items comprising a scale. Specifically, we use both techniques to produce a meta-analytic item-level correlation matrix that permits subsequent confirmatory factor analyses. This enables a comprehensive demonstration of whether items have adequate factor loadings, the fit of the theorized dimensional structure is still supported, and whether these latter issues are affected by potential moderating variables.
Williams and Anderson’s (1991) task performance and OCB scale is an important example for this demonstration for several reasons. First, issues concerning construct items frequently emerge in the OCB domain. Specifically, Dalal (2005) argued that the wording of reverse-worded (antithetical) OCB items was curiously similar to counterproductive work behavior’s (CWB) construct definition (Robinson & Bennett, 1995) and constitutive items (e.g., Bennett & Robinson, 2000). Likewise, scholars have also suggested that some of the behaviors currently labeled as OCB may be more representative of task performance (e.g., Morrison, 1994; Vey & Campbell, 2004), and vice versa. Second, since the scale’s publication, researchers have used the Williams and Anderson (1991) scale in numerous contexts and with multiple rating sources that were not included in its initial validation study, which indicates an opportunity to examine the generalizability of the scale’s underlying structure. Finally, this scale is an operationalization of two important constructs in the organizational sciences and has notable similarity to other popular scales in the extant literature (e.g., Podsakoff, MacKenzie, Moorman, & Fetter, 1990; Smith, Organ, & Near, 1983; see Organ, Podsakoff, & MacKenzie, 2006), thereby indicating that our demonstration will shed light on an important topic in the literature.
Contributions of Item-Level Meta-Analytic Construct Validation
Scale-level construct validation efforts are unquestionably important tools, but they cannot diagnose the adequacy of each item on a scale because the specific items are excluded from such evaluations. However, the items must be evaluated to determine whether and how a scale should continue to be used. Our study documents that problematic items may have low factor loadings on the theorized measurement model but that these loading issues are solved when fitting a new factor structure that differs from what was initially proposed. Thus, consideration of the items can provide direct implications and directions for the future use and analysis of the scale.
Meta-analysis is a critical tool for understanding empirical relationships without the obfuscating influences of sampling error and unreliability (Schmidt & Hunter, 2015). This points to the importance of reevaluating factor analytic evidence once a sufficient number of studies accumulate to correct sampling error variance, examine the factor structure, and evaluate whether study-level moderators influence factor loadings and model fit. Indeed, when relationships are examined in a cumulative fashion via meta-analysis, multiple primary studies representing various samples and settings are combined, allowing both the scale and its items to be understood in a more conclusive manner.
Justification for item-level meta-analytic construct validation also comes from reviewing the initial development of the Williams and Anderson (1991) scale as well as evidence from studies that subsequently used the scale. First, the original scale was validated via exploratory factor analysis (EFA) of ratings from 127 employees and their peers and supervisors. 2 No issues were noted with the reverse-worded items on the scale, but one item (“conserves and protects organizational property” [OCBO6]) was identified as potentially problematic. Given the aforementioned issues we outlined regarding single-study construct validation efforts, it is not surprising that extant primary studies using the Williams and Anderson scale provide inconsistent results regarding the items. For example, subsequent studies have included the potentially problematic item without incident (for a recent example, see Ferris, Lian, Brown, & Morrison, 2015), whereas others have found that reverse-worded items failed to load on the “correct” factors (e.g., Piccolo & Colquitt, 2006; Vogel & Feldman, 2009), and other authors removed the reverse-worded items from the scale prior to analysis. This illustrates that the initial scale validation study may provide evidence regarding the adequacy of the items that is inconsistent with what subsequent studies find (presumably using the same items and different samples and contexts).
We meta-analyze each of the relationships among the 21 items on the Williams and Anderson (1991) scale—this amounts to 231 bivariate correlations—to derive an inter-item correlation matrix that more closely converges on the population relationships among the items compared to a single primary study (Schmidt & Hunter, 2015; see also Klein, Wesson, Hollenbeck, Wright, & DeShon, 2001; Marcus, Taylor, Hastings, Sturm, & Weigelt, 2016). We then use these data (i.e., meta-analytic inter-item correlation matrix) as input for confirmatory factor analyses (CFAs) to evaluate the fit of measurement models that assign task performance and OCB items to their original labels and factors as denoted in Table 1. We use the results of the substantive validity assessment (described in the following) to reassign any mislabeled items to their new factors and determine whether model fit improves.
Williams and Anderson’s (1991) Task Performance, OCBI, and OCBO Items.

Note: Items followed by (R) indicate that a reverse-worded item that was reverse-coded before analysis; Task = task performance; OCB = organizational citizenship behavior; OCBI = organizational citizenship behavior toward individuals; OCBO = organizational citizenship behavior toward organization; CWB = counterproductive work behavior or withdrawal.
aThese items were judged to be conceptually consistent with both task performance and OCB definitions but were empirically consistent with the OCB factor. We note that items perceived as representing CWB or withdrawal in the substantive validity analysis should not be used as a standalone measure of CWB or withdrawal
Overview of Guidelines for Substantive Validity Analysis
In Figure 1, we illustrate the general steps involved in a substantive validity analysis. We note that prior works (e.g., Anderson & Gerbing, 1991; Hinkin, 1998; Hinkin & Tracey, 1999; Schriesheim, Powers, Scandura, Gardiner, & Lankau, 1993) describe various approaches to evaluating the content of items, so we do not detail that here. Rather, we focus our description on the steps researchers can take to select and articulate the construct definitions and select the sample for the assessment. The general purpose of substantive validity analysis is to evaluate each item on the extent it is judged to represent intended and unintended constructs. The results can be used to (a) demonstrate whether each item is judged as conceptually consistent with its intended construct and (b) determine the factor loading assignments for the revised factor models tested via the meta-analytic data. Importantly, substantive validity analysis evaluates the conceptual match between constructs and their operationalizations (Schriesheim et al., 1993) and reveals if items on a scale more closely correspond with the definition of an alternative construct.
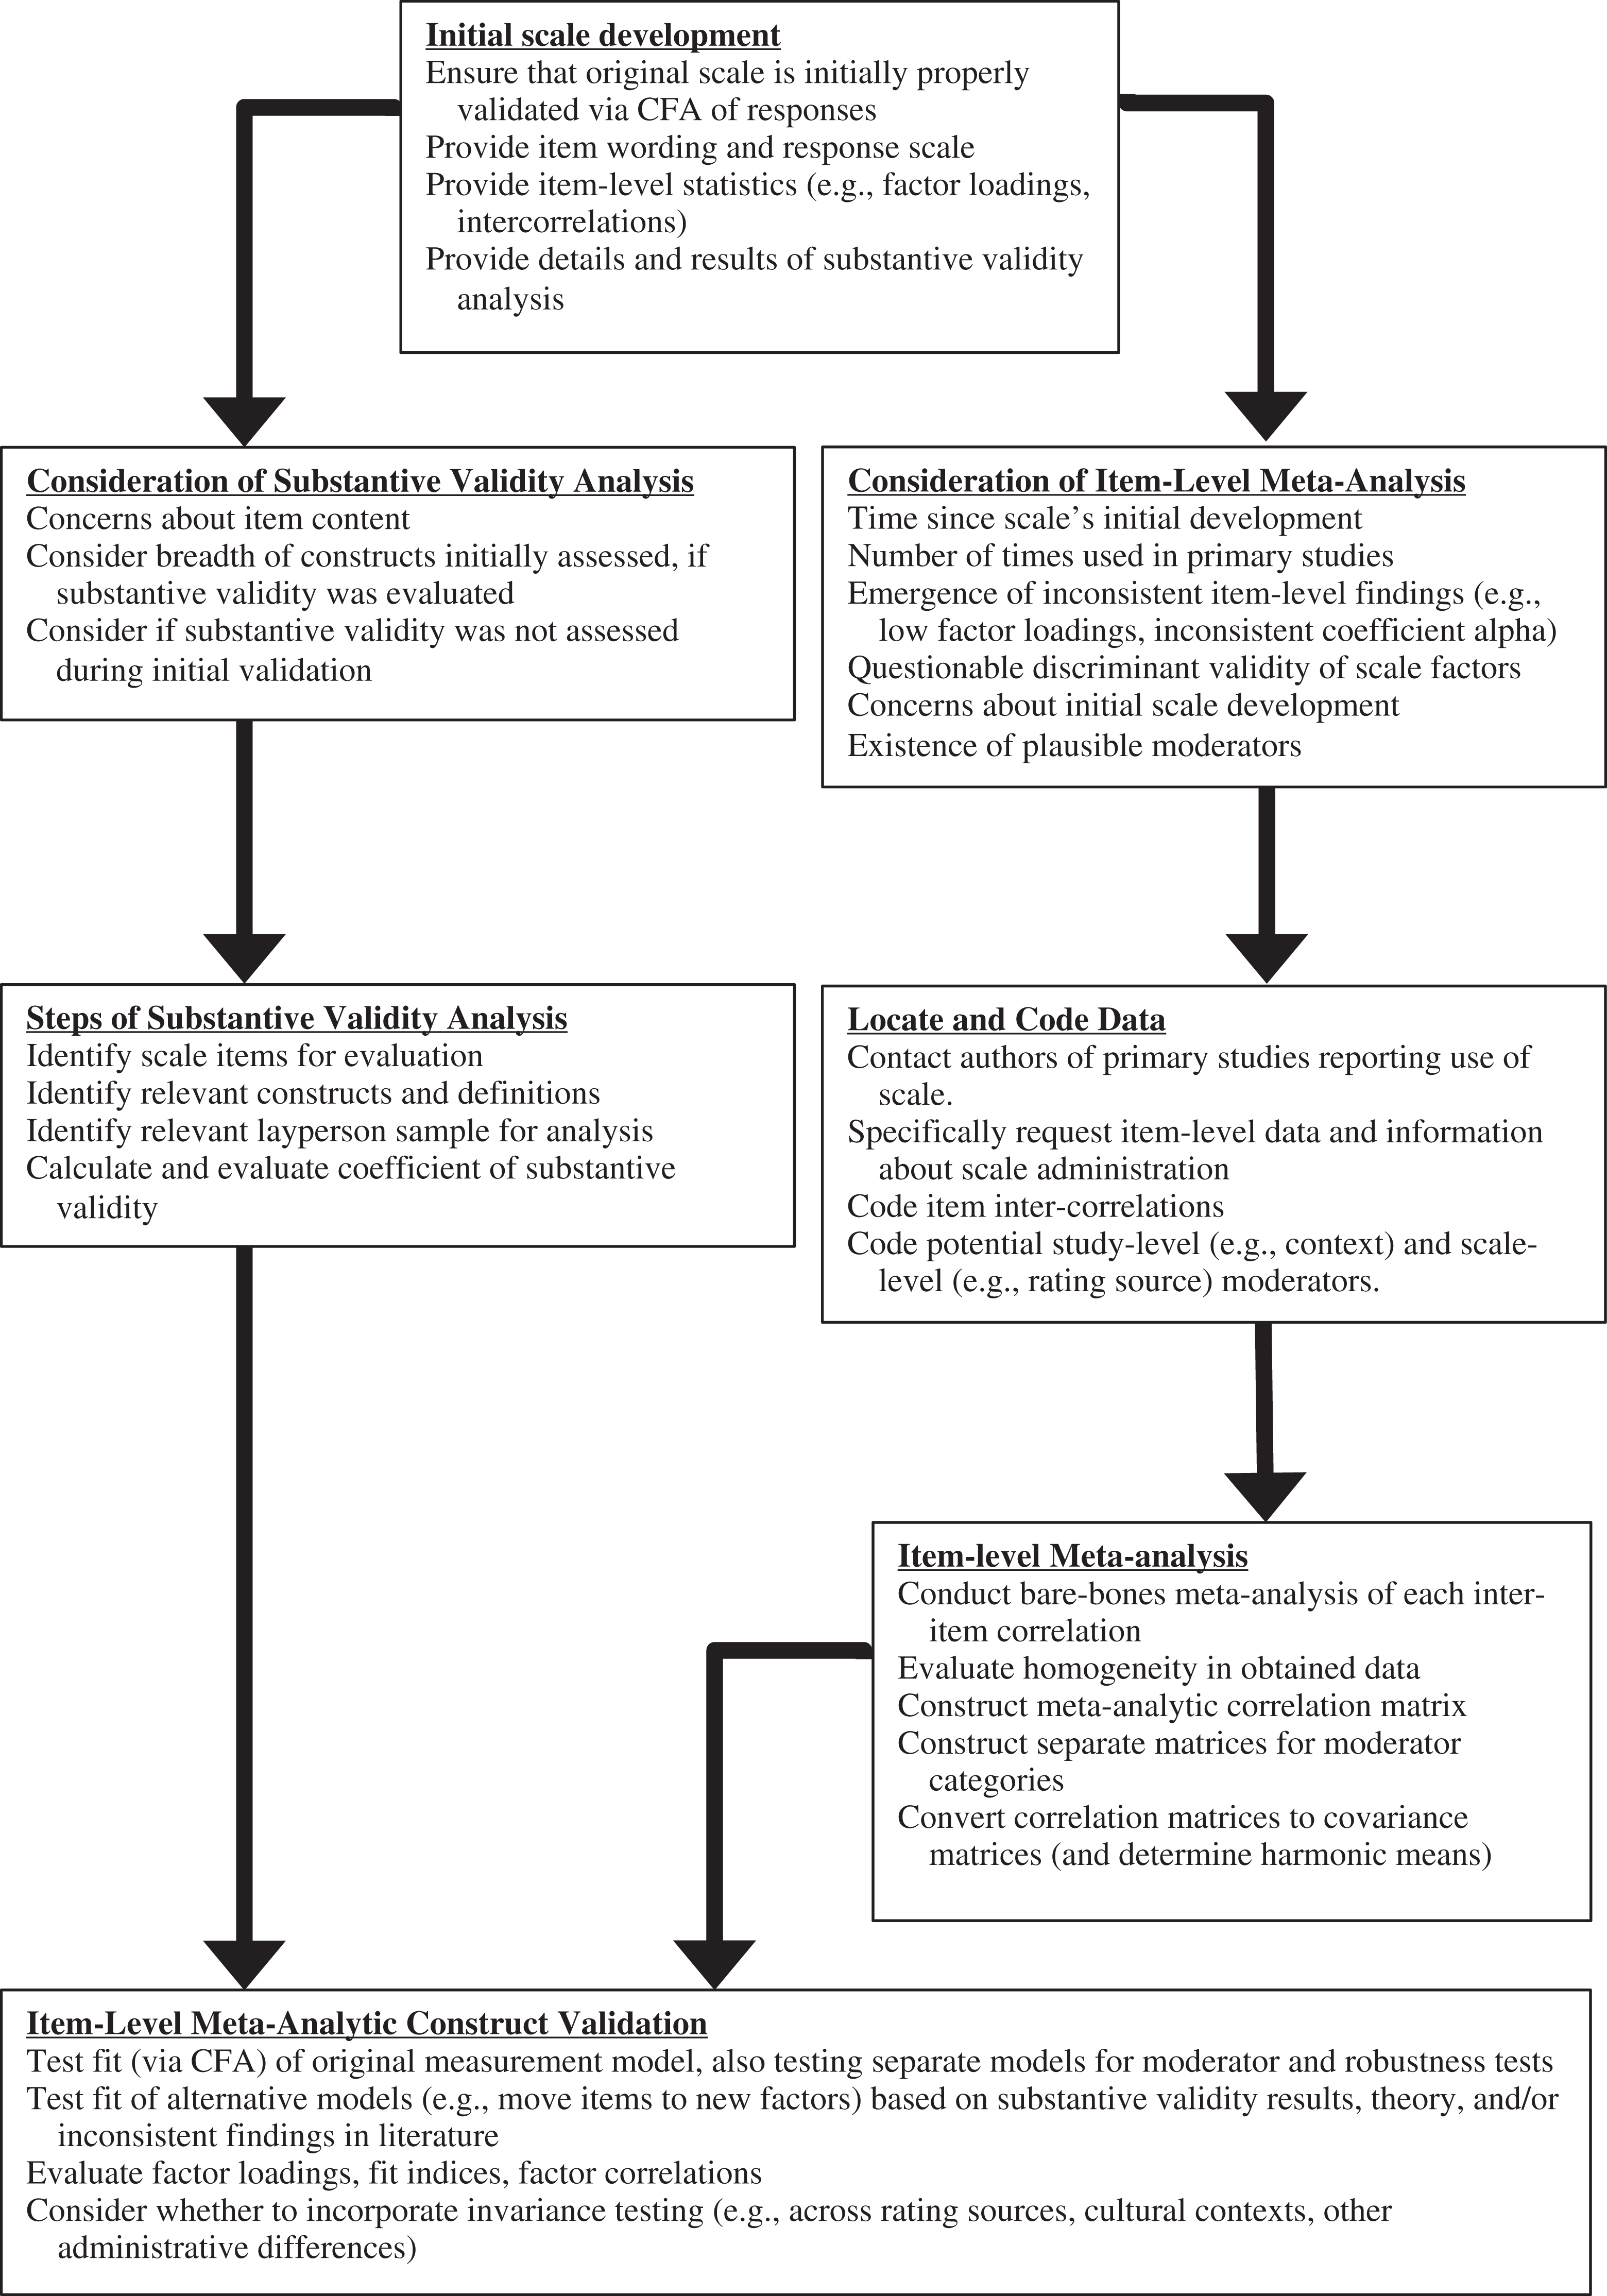
Illustration of steps for conducting item-level meta-analysis and substantive validity analysis for subsequent confirmatory factor analysis
Step 1: Identify Relevant Constructs and Definitions
The first task of the substantive validity assessment is to select the constructs and definitions that are to be used for the evaluation. Specifically, researchers should identify the definition of the construct that the scale’s items are intended to represent as well as those the items are not intended to represent. First, to identify the intended constructs, it is important to start with the initial scale development paper. For example, the scale’s authors may specify the construct the items were developed to assess and may also provide definitions of these constructs. However, if a definition is not provided in this scale development paper, then it may be necessary to conduct a literature search to identify the construct’s definition, either from the scale author’s prior work or from the literature on the construct itself (i.e., not necessarily written by the scale’s authors).
To identify unintended construct definitions, first consider whether there is a construct that the items may better match. There may be an ongoing discussion in the literature about potential unintended constructs the items may represent. If not, then consult literature both inside and outside of the relevant domain and make subjective judgments to determine potential unintended constructs. Once unintended constructs have been identified, researchers can follow the same steps described previously to develop construct definitions.
In general, the definition used in the substantive validity analysis should be close to the original definition in the literature. However, if there are concerns about whether a sample will comprehend the definition, one solution would be to have an independent sample rate the extent to which they understand the definition; the sample could also provide qualitative comments to aid its understanding.
Step 2: Identify Relevant Sample for Substantive Validity Analysis
The next important decision is the type of sample to obtain for the substantive validity assessment. Substantive validity assessments require that respondents only evaluate the content of the item and not their own enactment of the behavior, which means that biases germane to a performance rating (e.g., leniency and social desirability) are not likely present. Additionally, respondents only need to have the ability to read items and definitions and make judgments about their match (Schriesheim et al., 1993). Anderson and Gerbing (1991) described that the nature of a substantive validity assessment—matching items to construct definitions—required judges who were “representative of the main study sample and population of interest” (p. 734). The authors also described the matching task as “less effortful for the judges, in keeping with their nonexpert character” (p. 734). As a result, substantive validity assessments are appropriately and effectively completed by non-experts, with samples of approximately 20 individuals being appropriate (though there is no definite standard for the size of the sample; Anderson & Gerbing, 1991).
One argument could be that it is more appropriate to have subject matter experts complete the substantive validity assessment. However, this depends on the purpose of the substantive validity assessment. Experts are likely to have more exposure to the items and/or construct definitions and, subsequently, provide ratings based on assumptions or familiarity rather than the item content itself (Schriesheim, Eisenbach, & Hill, 1991). If the purpose of the substantive validity assessment is to evaluate the judgments from people who will most likely encounter the item, then non-experts should be used for the assessment. Indeed, the value of substantive validity assessments lies in the degree of homogeneity in the perceptions and judgments regarding item content. For example, in the case of the present study, if most respondents perceive an item to represent CWB and not OCB, then this demonstrates that the item is conceptually consistent with the construct definition of CWB.
Step 3: Analysis of Substantive Validity Data
After data collection, the data should be converted to an item-level file such that the data for each item are in a separate row. The next step is to determine the number of times the item was perceived to represent each one of the construct definitions. Using Anderson and Gerbing’s (1991) guidelines, the next step is to compute the different substantive validity indices. The proportion of substantive agreement (psa ) is simply the proportion of respondents (out of total respondents) who judged the item to represent the intended construct. Next, the coefficient of substantive validity (Csv ) should be computed to determine the extent to which each item was judged to match one construct over the other construct definitions. Importantly, this index accounts for the number of times an item was judged to represent an unintended construct in addition to the intended construct. This index is computed for each item using the following formula:

In the formula, nc is the number of times an item was judged to represent its intended construct (e.g., an item on an OCB scale that was also perceived in the substantive validity assessment to match OCB); no is the largest number of times an item was judged to represent an unintended construct (e.g., an item on an OCB scale that was judged numerous times to match CWB). This quantity (nc – no ) is divided by the total number of individuals who evaluated the item. Thus, Csv values can range from 0 to ±1.00 and are interpreted as follows: (a) Csv values approaching zero signal an ambiguous item that was perceived to represent multiple constructs; (b) large, positive Csv values indicate an item consistently perceived to represent the intended construct; and (c) large, negative Csv values indicate an item consistently perceived to represent an unintended construct.
These coefficients should also be tested for statistical significance using binomial tests. In line with Anderson and Gerbing (1991), critical Csv values should be computed to determine whether an item was perceived to significantly represent a construct over the others. The null hypothesis is that there is a 50% chance that an item would be perceived as representing either nc or no , and binomial tests determine the critical number of times an item would need to be sorted to either nc or no to reject this null hypothesis. The binomial test is based only on nc and no , so multiple binomial tests have to be conducted to account for the range of possible values of nc + no . The critical number of sorts (p < .05) to either nc or no needed to reject the null hypothesis is labeled m and used to calculate the critical Csv with the following formula:

As mentioned previously, the value of m depends on the number of respondents who perceived an item to represent the intended construct (nc ) or one unintended construct (no ). This means that each item could potentially have a different critical Csv . For example, for an item with nc + no = 20, m = 15 (p = .021), which means the critical Csv = 0.50, p < .05. The critical Csv is influenced by sample size—as the sample size increases, the critical Csv can become rather small. Thus, researchers can evaluate both (a) the construct to which each item was most frequently assigned and (b) whether the item’s Csv was statistically significant.
Overview of Guidelines for Item-Level Meta-Analysis and CFA
The purpose of the item-level meta-analysis is to cumulate item-level data to form a meta-analytic correlation matrix that is used for measurement model testing. We illustrate these steps in Figure 1 and describe them in the following.
Step 1: Locate and Code Data Using Scale of Interest
The most important step of the item-level meta-analysis is locating samples that used the particular scale. Searching for item-level data for a specific scale requires literature search techniques that are different from scale-level meta-analysis (Klein et al., 2001). Whereas typical meta-analytic processes require a literature search of papers to find effect sizes among variables of interest, item-level meta-analysis requires locating the inter-item correlation matrices for each of the samples using the scale of interest. Thus, the first step is to conduct a literature search of the work citing the original scale using online literature databases for published and unpublished literature (e.g., ABI/Inform, ProQuest, and PsycINFO). Then, evaluate the method and results sections of each paper to determine whether the scale was actually measured. If so, evaluate the correlation matrices and appendices to determine whether the authors provide item-level descriptive statistics and intercorrelations. This is not usually the case, so the critical solution is to develop a list of the authors of identified papers (along with their contact information) and personally request their item-level data. Specifically, the following information should be requested from authors, at a minimum: (a) the inter-item correlation matrix, (b) each item’s mean and standard deviation, and (c) the item wording and corresponding variable label (in order to locate each item in the correlation matrix). The item-level raw data for the items can also be requested (and the same statistics can be calculated). In addition to searching online databases and conference programs, it is important to post requests for item-level data on listservs and other scholarly forums.
Once the item-level data are obtained, the next step is to code each correlation. For example, in an Excel file, each tab could pertain to a single correlation (e.g., correlation between Item 1 and Item 2) and should also include the relevant items’ respective mean and standard deviation. For each coded correlation, researchers should also code any relevant sample- or study-level information (e.g., rating source, study context, publication year) for potential moderator analyses.
Step 2: Item-Level Meta-Analyses and Creation of Meta-Analytic Correlation Matrix
Once data are coded for each inter-item correlation, the next step is to meta-analyze each correlation. Researchers should use bare bones meta-analysis to estimate inter-item population correlations from the observed sample size weighted correlations and the estimated variance of correlations across the samples (Schmidt & Hunter, 2015). If researchers have identified moderators, then it is important to conduct separate meta-analyses of the data comprising the different moderator categories. For example, since we evaluated rating source (self-rated vs. supervisor-rated) as a moderator in this study, we meta-analyzed the self-rated correlations separate from the supervisor-rated correlations.
Each inter-item meta-analytic correlation fills an overall meta-analytic correlation matrix that is used for the subsequent CFA. The next step is to convert the meta-analytic correlation matrix into a covariance matrix using the sample size weighted standard deviations. The final step is to determine the harmonic mean of the covariance matrix to serve as a constant sample size for the correlations included in the analyses (Shadish, 1996; Viswesvaran & Ones, 1995). We note that depending on moderator tests, a separate covariance matrix and harmonic mean need to be computed for each moderator category (e.g., separate covariance matrix and harmonic mean for self-ratings vs. supervisor ratings).
How to Evaluate Homogeneity
A typical meta-analysis also provides evidence regarding the homogeneity of the effect sizes across primary studies (Schmidt & Hunter, 2015). Thus, it is important to note here that these analyses can and should be conducted as part of an item-level meta-analysis. In addition to testing for the existence of moderators specified a priori (which we describe in the following), conducting a file drawer analysis will evaluate the extent to which the meta-analytic effect sizes are vulnerable to availability bias. Specifically, researchers can estimate the necessary number of samples with null results that would bring the observed meta-analytic effect size down to a specified value. As an example of what this means for item-level meta-analysis, if we find that correlations among task performance items range from .50 to .75, we can determine how many samples with null findings it would take to bring each correlation down to .10. The next step would be to use the formula:

and for each item enter the k (number of samples),
Step 3: CFA
Researchers can conduct the CFAs after constructing the relevant meta-analytic covariance matrices. The first measurement model to be evaluated should represent the original factor structure of items from the scale, such that each item loads on its originally specified factor. Similar to the sequence of CFAs conducted in an original scale development paper, measurement models can also be fitted to evaluate the discriminant validity of factors. For example, if a scale was originally posited as containing two distinct factors, the measurement models should directly test this by comparing the fit of a two-factor model with a more parsimonious single-factor model.
There are many ways to evaluate the models. First, evaluate the magnitude of each item’s factor loading across the different models to determine whether loadings increase on revised models. Additionally, models should be evaluated using several indices of model fit, including chi-square, the Comparative Fit Index (CFI), the Non-Normed Fit Index (NNFI), the root mean square error of approximation (RMSEA), the standardized root mean square residual (SRMR), and the Akaike Information Criterion (AIC). Non-nested models are generally compared by evaluating the AIC values, where lower AIC values indicate relatively better fit than models with larger AIC values (Kline, 2005). To compare nested models, researchers should calculate the chi-square difference statistic to evaluate whether the change in overall fit was statistically significant.
Examination of Moderators
If researchers have identified moderators that may influence the fit of measurement models, then this should be evaluated as part of the CFA model testing. First, the 95% confidence intervals around each inter-item correlation for the different moderator categories can be evaluated for their degree of overlap. Q statistics may also be computed to estimate the degree of heterogeneity in sample correlations (Hedges & Olkin, 1985). Next, researchers can use multigroup CFA (e.g., where each group is a moderator category) to evaluate whether the measurement model is invariant across different moderator categories. Using Vandenberg and Lance’s (2000) guidelines for testing measurement invariance, researchers can test a configural invariance model, in which only the form of the model or scale structure (e.g., number of factors) is constrained to be equal across groups, followed by a more restrictive metric invariance model, in which not only is the model structure constrained to be equal across groups, but the factor loadings are constrained to be equal for each moderator category as well. The fit of the configural and metric invariance models should be evaluated using the same set of fit indices described previously.
Step 4: Combining Substantive Validity and Item-Level CFA
Finally, if the substantive validity analysis reveals that some of the items on the scale were judged to represent unintended constructs, then the next step is to verify these findings via CFA. To do so, the substantive validity results can be used to reassign items to new factors. In some cases, this could simply mean that items are moved to a factor that already exists in the original scale. However, if the substantive validity results show that items should load on a new factor, then the researchers should test modified measurement models that include this new factor. The researchers can further evaluate discriminant validity of factors in the revised models using the same process described in Step 4. Importantly, the same invariance testing procedures should be used to evaluate whether the revised measurement models are invariant across moderator categories as well.
Empirical Example: Williams and Anderson’s (1991) Task Performance and OCB Scale
Background
The Williams and Anderson (1991) scale was developed to measure two dimensions of OCB: (a) interpersonal target OCB (OCBI), or behaviors that benefit individuals (e.g., helping others), and (b) organizational target OCB (OCBO), or behaviors that more directly benefit the organization (e.g., protecting organizational resources). The authors also developed a scale to measure task performance (i.e., in-role behavior) so as to evaluate discriminant validity (Organ et al., 2006). There are several examples demonstrating that items used to measure OCB and task performance may refer to constructs other than what they are supposed to represent. First, scholars have observed that some behaviors labeled as OCB (e.g., attendance and following rules) may more closely represent required task behaviors. As one example, Stone-Romero, Alvarez, and Thompson (2009) argued that employees likely consider OCBO actions such as “arriving to work on time” and “following the rules” to be work behaviors that are mandatory and not ones they have much choice in enacting (e.g., Kamdar, Mcallister, & Turban, 2006; Kwantes, Karam, Kuo, & Towson, 2008; Morrison, 1994; Tepper, Lockhart, & Hoobler, 2001; Vey & Campbell, 2004).
Researchers have also suggested that the reverse-worded items used to measure OCB may refer to unintended constructs. 3 Specifically, reverse-worded OCB items may actually be judged to be conceptually similar with the definition of negative work behaviors given that OCB and CWB are often defined and regarded as opposite forms of behavior (Sackett, Berry, Wiemann, & Laczo, 2006). Additionally, if respondents interpret reverse-worded OCB items as measuring negative work behaviors, then response patterns specific to these items may lead these items to form a negative work behavior factor that is separate from OCB. The discussions regarding reverse-worded items in the performance domain have centered on OCB (see Dalal, 2005; Spector, Bauer, & Fox, 2010), but we note that task performance items have been missing from this conversation. Thus, we extend these arguments for OCB and expect that reverse-worded items used to measure task performance (see Table 1) may yield the same issues as reverse-worded OCB items.
Part 1: Substantive Validity Assessment
Method
We evaluated each item on the Williams and Anderson (1991) scale on the extent to which it was judged to represent the definition of the intended construct (i.e., task performance or OCB) as well as the definitions of constructs they were not intended to represent (i.e., CWB and withdrawal). The results of this assessment were expected to (a) demonstrate whether each item was conceptually consistent with its intended construct and (b) determine the factor loading assignments for the revised factor models tested via the meta-analytic data in the second part of our demonstration.
Participants
Participants were recruited from Amazon.com’s Mechanical Turk website, which is an online subject pool where participants complete tasks and surveys for payment. We obtained a sample of 101 employed participants from the United States. Respondents were 56% male and had an average age of 34.98 (SD = 12.25). Almost half of the sample had a bachelor’s degree (45.45%), while 22.22% had a high school diploma, 14.14% had an associate’s degree, and 13.13% had a master’s degree. Over 70% of the sample were White (73.74%), while 13.1% were Black, 7.07% were Asian, and 5.05% were Latino. Participants reported working an average of 38.38 hours per week (SD = 8.77) and had average job tenure of 6.74 years (SD = 6.43) and average organization tenure of 4.98 years (SD = 4.35). We included two quality control items (e.g., “please select ‘task performance’”) to identify distracted respondents and removed 2 individuals from our analyses, yielding a final sample of 99 individuals.
Procedure
Participants were provided with a brief overview of the task and instructed to read the four construct definitions (which were always presented on the screen) and decide which one definition best fit each of the 21 items. The construct definitions of task performance, OCB, CWB, and withdrawal were developed from the organizational literature on each construct and were as follows: Task performance: Performance of the activities and behaviors that are recognized by formal reward systems and part of the requirements that are described in job descriptions. Task performance reflects the degree to which an employee meets the requirements of his or her individual role or job. Organizational citizenship behavior: Performance of individual behavior that is discretionary and not explicitly recognized by the organization’s reward system. However, over time and across employees, these behaviors result in a more effective organization. Citizenship performance includes behaviors that directly benefit either (a) the organization in general or (b) specific individuals and as a result indirectly contribute to the organization. Withdrawal behavior: Behaviors that individuals engage in to avoid their work role or minimize the time spent on their specific work tasks while retaining their current organizational membership. These behaviors could include being late or absent or taking extended breaks. Counterproductive work behavior: Voluntary behavior that violates significant organizational norms and in so doing threatens the well-being of the organization, its members, or both. The deviance may be directed or targeted at either (a) the organization or (b) members of the organization.
The items for the assessment are listed in Table 1. Importantly, items were presented in their original wording to ensure that item content was evaluated in its commonly administered form.
Analysis
We first created an item-level file that contained all of the items along with the number of times the item was perceived to represent one of the four construct definitions. Then, we calculated Anderson and Gerbing’s (1991) coefficient of substantive validity (Csv ) to determine the extent to which each item matched one construct over the other construct definitions. We also computed critical Csv values to determine whether an item was perceived to significantly represent a construct over the others (p < .05). Because the critical Csv is influenced by sample size we evaluated both (a) the construct to which each item was most frequently assigned and (b) whether the item’s Csv was statistically significant when determining the factor loading for the subsequent CFA. On the basis of these criteria, we designated items as having (a) substantive validity for the posited construct (these items retained their original factor assignment in the subsequent CFA), (b) substantive validity for a non-posited construct (these items received a new factor assignment in the CFA), and (c) ambiguous substantive validity (these items received two possible factor assignments, which was to be evaluated in the CFA).
Results
Item-level results are presented in Table 2. In the “perceived construct” columns are the number of respondents who perceived the item as representing one of the listed constructs. On the basis of the most frequently perceived construct and the Csv index (see right-most column), we determined the “assigned construct,” which will be used for the subsequent CFA.
Results of Item-Level Substantive Validity Assessment.

Note: N = number of respondents; Nc = number of judges who perceived the item as intended; No = number of judges who perceived the item as an unintended construct; Csv = coefficient of substantive validity; TP = task performance; CWB = counterproductive work behavior; OCB = organizational citizenship behavior. We note that items perceived as representing CWB or withdrawal in the substantive validity analysis should not be used as a standalone measure of CWB or withdrawal.
*p < .05.
First, we found that respondents perceived five of the seven items used to measure task performance as intended. That is, the content of five of the items used to measure task performance was perceived to represent task performance (average Csv = .75). However, the two reverse-worded task performance items, “neglects aspects of the job he/she is obligated to perform” (Csv = –.60) and “fails to perform essential duties” (Csv = –.35), were most frequently classified as withdrawal, not task performance. Both of these Csv values were significant, indicating that these items were more often perceived to represent negative work behaviors and not task performance.
Next, of the 14 items used to measure OCB, we found that 9 of these items were perceived to represent the intended construct (average Csv = .51). As one example, the item “takes time to listen to coworkers’ problems and worries” had a Csv = .75, indicating the respondents viewed this item as representing OCB. Our findings also revealed that two OCB items were judged to be ambiguous. Specifically, the item “attendance at work is above the norm” had a Csv (0.01) that was near zero and was not statistically significant. We found that the sample was nearly split in classifying this item as either OCB (45%) or task performance (44%). Additionally, the item “gives advance notice if unable to come to work” had a low Csv (–.12), which, despite being significant, suggested it was judged only slightly more often as representing task performance. Therefore, to further investigate the effect of these ambiguous items, we test alternative CFA models where these items loaded on an OCB factor and then on a task performance factor (see Part 2, described in the following).
Finally, the substantive validity assessment showed that each of the reverse-worded OCB items, “complains about insignificant things at work,” “takes undeserved breaks,” and “great deal of time spent with personal phone conversations,” were classified as withdrawal (average Csv = –.67). Each item’s Csv was significant, indicating it was more often judged to represent a negative work behavior and not OCB.
Our findings demonstrate that the content of many of the items on the Williams and Anderson (1991) scale were judged to be conceptually consistent with the intended construct but that other items were either ambiguous, meaning they were judged to reflect at least two constructs, or mislabeled, meaning that they were judged to represent an unintended construct. Next, we describe the steps to conduct an item-level meta-analysis to evaluate the relationships among the full set of 21 items. We then combine these findings to evaluate several meta-analytic measurement models to determine whether CFA model fit improves when items are reassigned to the construct they are judged to represent. 4
Part 2: Item-level Meta-analysis and CFA
Method
Overview
As described previously, the item-level meta-analysis and CFA were conducted in two parts. The first part consisted of locating the necessary item-level data from multiple studies and then using meta-analysis to combine the inter-item correlations and create a 21 × 21 item-level correlation matrix. In the second part, the item-level meta-analytic correlation matrix was converted to a covariance matrix, which was the input for the subsequent CFA. We subsequently tested several measurement models regarding the underlying factor structure of the task performance and OCB items.
Item-Level Meta-Analysis
Locating Item-Level Data
We first obtained a database of primary studies citing Williams and Anderson (1991) by conducting a cited literature search in the ABI/Inform Index, PsycINFO, and Social Sciences Citation Index databases. We searched the method section of each obtained study to determine whether the authors had actually administered the Williams and Anderson (1991) scale. None of the obtained primary studies provided the item-level information or data necessary for our analyses. Therefore, we personally attempted to contact the authors of the obtained studies by sending an email requesting: (a) an inter-item correlation matrix, (b) item-level means and standard deviations, (c) the order in which the items were administered, and (d) the rating source (i.e., self, supervisor, or coworker). We contacted 124 authors regarding data—26 provided relevant data, 28 no longer had access to the data, and 70 did not respond (this also includes authors who were unable to be located due to missing or invalid emails).
In total, data comprising 27 independent samples (8 self-, 20 supervisor-, 4 coworker-rated) were obtained representing a variety of respondents and work contexts. We were only able to include self- and supervisor-rated samples in our analyses. The studies from which the samples were obtained are denoted with an asterisk in the reference list. Study-level sample sizes ranged from 90 to 570 (M = 216.29; SD = 137.46), but sample sizes also varied across the items. For example, 17 samples measured only task performance, and 8 samples measured both behaviors. Finally, of the obtained samples, 23 were published, and 4 were from unpublished data sets, and each sample was based on employees in a field setting. Each sample was coded for (a) correlations among each of the items in the scale, (b) sample size, (c) the item-level means and standard deviations, and (d) the rating source of the behavior.
Meta-Analysis
We conducted bare bones meta-analyses of the relationships among each item using the procedures outlined in Schmidt and Hunter (2015; Hunter & Schmidt, 2004). Corrections for unreliability were not made because of the use of item-level rather than scale-level correlations. Each inter-item population correlation was estimated using observed sample size weighted correlations and the estimated variance of correlations across the samples (Schmidt & Hunter, 2015).
Meta-Analytic CFA
We first converted the obtained 21 × 21 meta-analytic correlation matrices (i.e., self- and supervisor-rated) into covariance matrices by combining each correlation matrix with sample size weighted standard deviations. Due to the variation in sample sizes of our obtained samples, we adopted the harmonic mean of the covariance matrix (self = 1,889; supervisor = 1,686; Shadish, 1996; Viswesvaran & Ones, 1995).
We first evaluated measurement models using the original structure and labels of items stated in Williams and Anderson (1991). Then, we evaluated a series of revised measurement models in which each item loaded on the factor (i.e., construct label) it was judged via substantive validity to most frequently represent. For example, OCB items that were classified as CWB or withdrawal were reassigned to the negative work behavior factor representing CWB and withdrawal. We evaluated the measurement models using LISREL (Jöreskog & Sörbom, 1993) and several indices of model fit (described previously).
Results
Measurement Model Evaluation (Original and Revised)
The inter-item meta-analytic correlations are presented in Table 3. The values in the upper diagonal of Table 3 represent the supervisor-rated meta-analytic correlations, while the values in the lower diagonal are the self-rated meta-analytic correlations. The CFA factor loadings for each model are presented in Table 4, and the fit indices for the self- and supervisor-rated CFA models are presented in Table 5.
Meta-Analytic Correlations Among Task Performance and OCB Items.

Note: Numbers in upper diagonal are the meta-analytic correlations among supervisor-rated items, and numbers in lower diagonal are the meta-analytic correlations among self-rated items. All meta-analytic correlations are significant at the p < .01 level; k indicates the number of studies in which the item was used. The harmonic mean for supervisor-rated and self-rated items are 1,686 and 1,889, respectively. task = task performance; ocbi = organizational citizenship behavior toward individuals; ocbo = organizational citizenship behavior toward organization.
Confirmatory Factor Analyses: Factor Loadings for Measurement Models.

Note: task = task performance; ocb = organizational citizenship behavior; ocbi = organizational citizenship behavior toward individuals; ocbo = organizational citizenship behavior toward organization; CWB = counterproductive work behavior.
Meta-Analytic Confirmatory Factor Analysis Results.

Note: Task = task performance; OCB = organizational citizenship behavior; OCBI = organizational citizenship behavior toward individuals; OCBO = organizational citizenship behavior toward the organization; df = degrees of freedom; CFI = Comparative Fit Index; NNFI = Non-Normed Fit Index; RMSEA = root mean square error of approximation; SRMR = standardized mean square residual; AIC = Akaike Information Criterion.
For self-ratings, we first tested measurement models depicting the original labeling and structure of items. A single-factor model (χ2 [df = 189] = 3,943.02, CFI = .89, NNFI = .88, RMSEA = .10, SRMR = .08, AIC = 3,0336.48) demonstrated marginal fit to the data, as did a two-factor model (comprising task performance and OCB factors; χ2 [df = 188] = 299.67, CFI = .92, NNFI = .91, RMSEA = .09, SRMR = .09, AIC = 29,395.13). Williams and Anderson’s (1991) original three-factor structure (task performance, OCBI, and OCBO) provided a comparatively better fit to the data (χ2 [df = 186] = 2,478.72, Δχ2 = 520.95 [Δdf = 2, p < .05], CFI = .93, NNFI = .93, RMSEA = .08, SRMR = .08, AIC = 28,878.18).
We next tested a revised three-factor model in which the items that were consistently classified as CWB or withdrawal in the substantive validity analysis were reassigned to a separate negative work behavior factor. Thus, this revised three-factor model comprised task performance, OCB, and negative work behavior factors. For self-ratings, this revised model considerably improved model fit compared to the three-factor measurement model that was based on the original scale structure. Specifically, the chi-square statistic decreased from 2,478.72 to 1,625.05, while the CFI increased from .93 to .96, NNFI increased from .93 to .95, RMSEA decreased from .08 to .06, SRMR decreased from .08 to .05, and AIC decreased from 28,878.18 to 28,024.52. Because these models were not nested, we compared the AIC values (ΔAIC = 853.67), which indicated that the revised three-factor model fit better than the original three-factor model. This model included the ambiguous OCBO items “Attendance at work is above the norm” and “Gives advance notice if unable to come to work” loading on OCB. When these items loaded on the task performance factor, the model showed slightly worse fit (χ2 [df = 186] = 1,787.17, CFI = .95, NNFI = .95, RMSEA = .07, SRMR = .06 AIC = 28,186.63 [ΔAIC = 162.11]), which indicated that these items should load on the OCB factor and not the task performance factor.
We also examined each item’s factor loading for the original versus revised models and found that reassigned items had larger factor loadings on the new factor compared to the original factor. For example, as shown in Table 4, the two reassigned task performance items (e.g., “neglects aspects of the job he/she is obligated to perform”) originally loaded .16 and .17 onto the task performance factor, but these loadings increased to .66 and .62, respectively, when they loaded on the new negative behavior factor. Similarly, the reassigned OCBO items (e.g., “takes undeserved work breaks”) had factor loadings of .37, .41, and .53 on the original OCBO factor, but these loadings increased to .51, .55, and .63, respectively, on the new negative behavior factor. Thus, the patterns of item factor loadings also support the revised models.
Next, we tested a revised four-factor model in which OCB was split into separate OCBI and OCBO factors. This revised four-factor model resulted in further improved model fit compared to the revised three-factor model. Specifically, chi-square dropped to 1,260.69, while CFI increased to .97 and NNFI increased to .95, RMSEA dropped to .06, SRMR decreased to .04, and AIC dropped to 27,666.15. This difference in chi-square was significant (Δχ2 = 1,218.05 [Δdf = 3, p < .05]), indicating that the four-factor revised model fit significantly better than the three-factor revised model. Thus, for self-ratings, the revised four-factor model in which reverse-worded items were reassigned to a negative work behavior factor provided the best fit to the data compared to any of the model specifications based on the original labels.
As shown in Table 5, we tested these same models using supervisor ratings. For the original factor structure, the three-factor measurement model (i.e., task performance, OCBI, and OCBO) provided a marginal fit to the data (χ2 [df = 186] = 2,106.87, CFI = .966, NNFI = .96, RMSEA = .08, SRMR = .06, AIC = 20,814.87). However, similar to self-ratings, the revised four-factor measurement model with reassigned items yielded considerable model fit improvement. Specifically, the chi-square decreased from 2,106.87 to 1,162.96 (Δχ2 = 943.90 [Δdf = 3, p < .05]), the CFI increased from .97 to .98, NNFI increased from .96 to .98, RMSEA decreased from .08 to .06, SRMR decreased from .06 to .04, and AIC dropped to 19,876.97. We also evaluated each item’s factor loading (see Table 4) and found that each reassigned item had a factor loading that was larger for the revised factor compared to the original factor. For example, the reassigned task performance items both had loadings of .54 on the original factor, but they increased to .68 and .69 on the negative work behavior factor. Thus, item-level meta-analytic CFA demonstrated that the original factor structure suggested by Williams and Anderson (1991) is not the best fitting measurement model for the items. Rather, a revised four-factor model that accounts for each item’s substantive validity yielded the best-fitting model. 5 A summary of the results for the items is presented in Appendix A.
Moderator Analysis: Rating Source as an Example
As noted previously, an important contribution of an item-level meta-analytic CFA is the ability to evaluate whether the factor structure and item factor loadings are affected by moderators. 6 Therefore, we evaluated whether our findings were moderated by the use of self-ratings or supervisor ratings to rate the items. Specifically, we evaluated the extent to which these measurement models were invariant across rating sources. As noted previously, these procedures can be used to evaluate the moderating influence of many types of categorical moderator variables (e.g., publication type, year, study context, industry). We followed the recommendations outlined by Vandenberg and Lance (2000) and tested a (a) configural invariance model and (b) more restrictive metric invariance model. We note that the same harmonic means for the CFA (self = 1,889; supervisor = 1,686) were used for invariance testing.
The results of the measurement invariance tests are presented in Table 6. First, we used multigroup CFA to test configural measurement invariance and evaluate whether the 21 Williams and Anderson (1991) items loaded on the same revised four factors for both self- and supervisor ratings. We expected that the chi-square statistic would be significant given the large sample sizes due to the use of meta-analytic harmonic means (χ2 [df = 366] = 2,422.29), but the remaining fit indices evaluated provided support for configural measurement invariance of the revised four-factor scale (CFI = .98, NNFI = .97, RMSEA = .06, SRMR = .04, AIC = 2,787.85). This indicates that the revised four-factor structure (with no additional constraints) is supported for both supervisor and self-ratings.
Moderator Analysis: Measurement Invariance Across Rating Sources.a,b

Note: df = degrees of freedom; CFI = Comparative Fit Index; NNFI = Non-Normed Fit Index; RMSEA = root mean square error of approximation; SRMR = standardized mean square residual; AIC = Akaike Information Criterion; n is the harmonic mean for each rating source; k indicates the number of studies in which the item was used.
aConfigural measurement invariance is a model in which no restrictions other than the form of the model are imposed across subgroups.
bMetric measurement invariance is the same model as partial measurement equivalence with the addition of equality constraints on the factor loadings for each item.
The next step was to test metric invariance to determine whether the actual factor loadings were the same across supervisor and self-ratings. That is, this step further tests whether the relationships between factors and items are the same across rating sources. A multigroup CFA model was tested with additional equality constraints for the factor loadings across groups. The chi-square statistic was again significant as expected (χ2 [df = 387] = 2,606.25), but the additional fit indices also provided support of metric invariance (CFI = .98, NNFI = .97, RMSEA = .06, SRMR = .08, AIC = 2,957.69). Indeed, the fit indices did not drop substantially from testing the configural to the metric invariance model.
Evaluation of Homogeneity
We also evaluated the extent to which the sample effect sizes were homogenous, meaning that they could be regarded as representing the same population effect size (Schmidt & Hunter, 2015). We conducted a file drawer analysis to evaluate the number of primary studies with null correlations needed to bring the mean correlation down to a specified magnitude. For this example, we evaluated the robustness of OCBI-OCBO correlations given their large magnitude. We found that for the self-rated data, inter-item correlations among OCBI and the remaining OCBO items (i.e., not reassigned to CWB) ranged from .20 to .36. However, the average correlation of OCBI items with the reassigned OCBO items (i.e., new CWB items) was .15. Thus, we evaluated whether the relationships among remaining OCBI and OCBO items could “easily” be brought down to the magnitude of relationships OCBI items had with an ostensibly distinct construct (i.e., CWB). We conducted 28 separate file-drawer analyses for each possible item correlation (using the formula described previously). Specifically, we recorded for each self-rated inter-item correlation: (a) the original k (ranging from 9 to 14), (b) the original average correlation (ranging from .20 to .36), and (c) the new correlation (we used .15). The analysis indicated that between 3.6 (correlation between OCBO7 and OCBI3) and 16.47 (correlation between OCBO1 and OCBI2) null primary studies would bring the mean effect size down to .15. The results for the supervisor-rated data were parallel to self-ratings.
Discussion
It is premature to conclude the scale development process after only one or a few primary validation studies as the initial evidence that supports and validates the use of scale items may not be as robust when the items are used in varied contexts and with diverse samples. Unfortunately, the items are not usually the focus of subsequent empirical studies using the scale, which makes it difficult for researchers to identify and evaluate whether critical details about a scale’s items—factor loadings, factor structure, and the generalizability of both—actually function as initially promised. The purpose of this study was to illustrate the importance of considering the items when comprehensively (i.e., meta-analytically) evaluating a scale’s performance. Our analysis demonstrated that some of the items on Williams and Anderson’s (1991) task performance and OCB scale were judged via substantive validity analysis to represent constructs other than task performance and OCB and, importantly, that the best fitting factor structure was different from what was initially proposed and validated. Indeed, our findings suggest that the current understanding of the steps constituting scale development be amended to encourage more attention to how the items perform beyond the initial validation effort.
The more commonly employed scale-level meta-analyses are without question important tools for understanding nomological network relationships as well as how such relationships are influenced by scale- and study-level moderators. However, meta-analytic construct validation studies (e.g., Hoffman, Blair, Meriac, & Woehr, 2007; LePine, Erez, & Johnson, 2002) are unable to determine how the actual items influence the underlying factor structure or, more importantly, inform alternative models that fit the data better. Findings from our study indicate that meta-analysts should also strive to incorporate an item-level focus in order to more thoroughly understand whether a construct’s operationalization remains a valid representation of the construct.
Recommendations for and Implications of Item-Level Substantive Validity and Meta-Analytic Approaches
The recommended steps for scale development should be expanded to include meta-analytic examinations of the items once the scale is in use. Indeed, as we illustrate in Figure 1, there are several important reasons to meta-analytically evaluate the empirical evidence about scale items, including concerns about: (a) the discriminant validity of scale factors, (b) the substantive validity of the scale’s items, (c) the empirical fit of the scale’s items (e.g., low or varying factor loadings or coefficient alpha), or (d) the initial scale development effort. This is certainly not an exhaustive list, but should these or other concerns exist and enough data have accumulated for meta-analysis, then we recommend an item-level meta-analysis. This may mean that item-level meta-analytic construct validation studies can be conducted after a scale has been administered in enough independent samples to meta-analyze all of the inter-item correlations, which will likely take several years.
Although the purpose of this demonstration was to illustrate the steps researchers can take to validate scales that are already in use, we note that the approaches we describe (item-level meta-analytic CFA, substantive validity) could also be conducted as part of the initial scale development process. Indeed, if a scale development paper provided empirical support for the underlying measurement model and factor loadings that was based on numerous samples (e.g., presumably obtained from different contexts, industries, rating sources), researchers would have greater confidence that the scale is likely to work as promised. It follows that we also recommend that scale developers consider adapting prospective meta-analytic procedures (e.g., Berlin & Ghersi, 2005) by hypothesizing potential moderating variables that may change the initial understanding of the scale. This could provide researchers with a protocol for the variables to include with the scale items and eventually allow for the use of meta-analysis to evaluate the influence of the moderator.
There are numerous issues that may arise as part of the item-level evaluation. For example, we described how researchers can ascertain the extent to which the item-level sample data are homogenous or reflect the same population. If researchers find evidence of heterogeneity (variance of population effect sizes is greater than zero; Schmidt & Hunter, 2015; or Q-statistic, Hedges & Olkin, 1985), it is important identify possible sources. First, identify whether the heterogeneity can be explained by additional moderator variables. Second, determine whether the heterogeneity is caused by primary second-order sampling error (Schmidt & Hunter, 2015). That is, if the total sample size is small, this can confuse the understanding of whether the item-level sample data represent the same population effect size. In our demonstration, we were only able to obtain a small number of samples for some item pairs. Thus, evidence of heterogeneity for these particular items may not indicate the existence of moderators but rather, the need for additional data. This also signals the importance of conducting a file-drawer analysis to illustrate the vulnerability of obtained effect sizes to additional null findings.
We identified moderator variables on the basis of noted issues with the Williams and Anderson (1991) scale. However, the set of moderators we examined (i.e., rating source) was not exhaustive, and we must note additional general variables that may influence item-level effect sizes in future meta-analyses of other scales. For example, if the scale’s items were initially subjected to a substantive validity analysis or another type of content validity analysis, then researchers could correlate the item-level indices (e.g., substantive validity coefficient) with items’ factor loadings. Researchers should also consider moderator variables pertaining to the match between (a) the initial scale validation study and (b) subsequent primary studies using the scale. For example, researchers should evaluate if characteristics of the validation sample (e.g., demographic characteristics, country, industry) are similar to or different from each subsequent primary study. In addition, researchers should consider the match of the item administration features across studies. Researchers may take license in the number of scale items administered, type of response scale, type of rater, number of response scale anchors, language, and item wording. It is important to evaluate whether these adjustments influence the meta-analytic measurement model.
In our study, for example, we found that some of our obtained samples administered both task performance and OCB items, whereas others focused on only one of the dimensions. We evaluated whether these administrative differences influenced the results by creating separate correlation matrices for samples that measured the items comprising both dimensions and those that measured the items for only one of the dimensions and then tested the same measurement models we described previously. We found that our results were the same for both of these conditions. We report the results of these analyses in Appendix C.
Our previous discussion of primary second-order sampling error highlights a limitation of our demonstration. Though Williams and Anderson (1991) has been cited over 3,000 times, 7 we were only able to obtain item-level data from 27 independent samples. One reason for this was the amount of time since the scale’s initial publication in 1991—many authors we contacted were willing to help but no longer had data that were over 20 years old. We suspect this will be a recurring challenge for others seeking to conduct similar analyses. Nonetheless, the challenges associated with obtaining item-level data are outweighed by the important benefits of item-level meta-analytic construct validation studies. To aid future cumulation efforts, we encourage scientists and journals to consider providing more data registries where researchers can provide their item-level data for further analysis. Additionally, it is important that journal editors require scale developers to provide detailed item-level statistics in published studies or ensure that such data are made easily available to those who will use the scale in the future. In any case, the necessary insights that can be gained via item-level meta-analytic CFAs can only be realized if they are based on comprehensive data provided by the researchers.
Item-level meta-analytic CFA also enables researchers to further evaluate alternative explanations for the CFA results. For example, one plausible explanation for the issues pertaining to reverse-worded task performance and OCB items is that these items should load on their originally specified factors but also on a method factor that is uncorrelated with the task performance, OCBI, and OCBO factors. Indeed, demonstrating that this measurement model does not fit better than the revised model that introduces a new trait factor (e.g., CWB) is important. As illustrated in Appendix D, we tested these models with our meta-analytic data and found that the four-factor revised models (with trait factors) fit the data better than the original three-factor model with an additional uncorrelated method factor.
We provide detailed instructions for how the item-level meta-analytic CFA (and substantive validity analysis) can be conducted, which makes it easier for scholars to use these techniques to evaluate the existence and effects of similar item-level issues. As one example, organizational commitment scholars have also grappled with the use of reverse-worded items on affective commitment scales (Magazine, Williams, & Williams, 1996; Merritt, 2012), indicating that item-level meta-analytic CFA would be useful. The use of reverse-worded items represents only one potential item-level issue affecting the fit of measurement models as scales may have myriad other operationalization issues in need of item-level meta-analytic examination.
An important follow-up question from our results is whether the changed dimensional structure also changes the relationships task performance, OCBI, and OCBO have with their respective nomological networks (e.g., job satisfaction, organizational commitment). This was an important question we hoped to address in our study, but we found that the primary studies we obtained did not include overlapping sets of correlates. Additionally, assessing how the reassignment of items influenced nomological relations requires item-level data among the focal constructs and nomological correlates. Future research seeking to conduct item-level meta-analysis should request and collect the item-level data required to construct an item-level meta-analytic correlation matrix comprised of all desired constructs.
Finally, our substantive validity assessment follows recommendations from Anderson and Gerbing (1991) and, accordingly, uses (via crowd-sourcing) a cross-sectional sample of lay employees rather than experts. This strengthened our approach since we were able to obtain perceptions of item content from individuals who are likely to encounter these items in practice. Nevertheless, it is important to consider whether lay persons differ from scholarly experts in perceptions of item content. Though Schriesheim et al. (1991) contended that experts were likely to be biased by their knowledge of the constructs, this ultimately stands as an important empirical question for future research. The substantive validity analysis signals a need to more thoroughly evaluate respondents’ perceptions of item content. This has certainly been described in prior research (e.g., Hinkin, 1998; Hinkin & Tracey, 1999; Schriesheim et al., 1993), but we assert the importance of considering a broader range of competing constructs when evaluating items.
Implications for the Williams and Anderson (1991) Scale
Our empirical demonstration revealed that the original factor structure for the items on the Williams and Anderson (1991) scale was not wholly supported. Specifically, the item-level meta-analytic CFA corroborated the results of the substantive validity analysis—reverse-worded task performance and OCB items belong on a new negative work behavior factor. Importantly, we demonstrated that this revised factor structure held for both self- and supervisor ratings. As a next step, it will be important to evaluate whether the revised factor structure is invariant across other moderator types, such as publication status, industry, job types, and other relevant variables. As we mentioned, we did not obtain adequate data on moderator categories for each of the 231 correlations in our meta-analytic correlation matrix. However, as these data become available, it will be important to further assess invariance. We emphasize that these reverse-worded items should not be used as a standalone scale of withdrawal or CWB as they do not adequately cover the construct domain as defined (e.g., see Robinson & Bennett, 1995). Future research is needed that clarifies if and how these reverse-worded items are to be used moving forward. Nevertheless, our findings demonstrate that these items are not appropriate for use on task performance and OCB scales.
Similarly, as the items “attendance at work is above the norm” and “gives advance notice if unable to come to work” were ambiguous, this indicates that it is important to consider removing these from the Williams and Anderson (1991) scale as well. Indeed, these findings suggest that overlapping items may constitute an important reason why task performance and OCB often display questionable empirical distinctiveness (e.g., Hoffman et al., 2007). As a result, our findings regarding the items reflect important confirmation that the concepts of task performance and OCB are somewhat intertwined. To continue to understand the similarities and distinctions between task performance and OCB without the influence of overlapping items, we recommend that researchers evaluate whether and how results change when the ambiguous items are removed versus retained.
Researchers may encounter situations in which they have administered the Williams and Anderson (1991) scale in a local validity study and found that the best-fitting measurement model differed from this study’s measurement model that was supported via meta-analytic data (see Table 5). Indeed, this study demonstrates that results from a single sample will likely vary considerably from results obtained with meta-analysis. Thus, if this happens, it raises an important dilemma for researchers: Which measurement model should be used with the primary study data? To be clear, this is a delicate issue that requires more future attention by the larger research methods field.
One suggestion is to conduct empirical Bayes meta-analysis (e.g., Brannick, 2001; Newman, Jacobs, & Bartram, 2007) to compare the item-level correlation matrices from the local and meta-analytic data and subsequently evaluate whether the local data (despite fitting a different measurement model) nevertheless fit the established population parameters suggested by the meta-analysis. In Bayesian terms, the inter-item correlation matrix we present in Table 3 would serve as the prior distribution (i.e., estimates the population effect sizes), and the local validity data would comprise the likelihood distribution (i.e., provides a new estimate of the population effect sizes). Combining the prior and likelihood distributions would produce a new distribution—termed the posterior distribution—that yields an updated estimate of the effect size and variability. If this estimate from the posterior distribution is statistically significant, then the likelihood distribution is valid. We note that researchers using empirical Bayesian methods to compare local data to our meta-analytic data would need to use the random effects model (Brannick, 2001) and would also have to evaluate each inter-item correlation in the matrix in order to determine whether the data obtained from the local validity study indeed generalizes. To our knowledge, Bayesian analyses have not yet been applied in this manner to a large meta-analytic correlation matrix. Thus, future research is needed that develops clear guidelines on these techniques so that researchers can more quickly determine how to use their local study data.
Finally, we emphasize that our findings are not intended to condemn the use of Williams and Anderson’s (1991) scale. On the contrary, our findings suggest that authors should use many of the items but organize them in line with the revised four-factor structure for analysis. Indeed, given the common use of the items, researchers likely need to make only minor modifications to analyze the items in a reorganized, substantively valid manner. Furthermore, given that the Williams and Anderson (1991) items are similar to other existing scales (e.g., as shown in Table 7, of the 14 original OCB items from the Williams and Anderson scale, 7 are also measured in either the Smith et al., 1983, or Podsakoff et al., 1990, OCB scales), we expect that our findings also apply to similar OCB scales in the literature, although this remains an empirical question requiring additional research and attention.
Match Between Williams and Anderson’s (1991) Items and the Wording of Published Organizational Citizenship Behavior Items.

Note: Items followed by (R) indicate that a reverse-worded item that was reverse-coded before analysis.
Conclusion
Though initial scale validation papers are expected to document the empirical support for each item’s inclusion on the scale, the focus on items usually ends once the scale is in use. This study demonstrates the need for greater attention to items as the scale is reexamined, particularly via meta-analysis. We provided step-by-step instructions for conducting item-level meta-analysis and substantive validity analysis and for combining these techniques for meta-analytic CFA. These techniques are critical for evaluating the initial scale development processes, improving construct measurement, and understanding the evolving construct validity evidence for the scale.
Footnotes
Appendix A
Appendix B
Appendix C
Appendix D
Authors’ Note
A previous version of this article was presented at the 29th annual meeting of the Society for Industrial and Organizational Psychology. The authors wish to thank Chuck Hulin, Dan Newman, Jim Rounds, and PhD students in Psychology 598 at UIUC for their helpful and insightful comments on a previous draft.
Declaration of Conflicting Interests
The author(s) declared no potential conflicts of interest with respect to the research, authorship, and/or publication of this article.
Funding
The author(s) received no financial support for the research, authorship, and/or publication of this article.