
Abstract
While many disciplines embrace the possibilities that Big Data present for advancing scholarship and practice, organizational and management research has yet to realize Big Data’s potential. In an effort to chart this newfound territory, we briefly describe the principal drivers and key characteristics of Big Data. We then review a broad range of opportunities and risks that are related to the Big Data paradigm, the data itself, and the associated analytical methods. For each, we provide research ideas and recommendations on how to embrace the potentials or address the concerns. Our assessment shows that Big Data, as a paradigm, can be a double- edged sword, capable of significantly advancing our field but also causing backlash if not utilized properly. Our review seeks to inform individual research practices as well as a broader policy agenda in order to advance organizational and management research as a scientifically rigorous and professionally relevant field.
Keywords
Throughout history, in one field after another, science has made huge progress in precisely the areas where we can measure things—and lagged where we can’t. The result, over time, has been that we know a lot about the things that are closer to our size, our altitude, and our spot in the universe—and less about things that are hard to reach, hard to dig up, and hard to quantify. What we know has a bias, in other words, and is biased in favor of what we can measure.
The aforementioned trends have given rise to Big Data, an elusive notion whose meaning varies strongly depending on the context it is used in (Diebold, 2012; Ward & Barker, 2013). In general, Big Data are portrayed as the intersection of new generations of technology (i.e., computational power and pervasiveness), unprecedented algorithmic architecture (i.e., identifying patterns via potent data sets), and mythology (i.e., imbuing findings with an aura of truth and objectivity) (boyd & Crawford, 2012). Beyond inspiring many dystopian accounts in popular culture (e.g., Eggers, 2014), this ubiquity of data is changing the scale and scope by which scholars can empirically address important societal questions, including those relating to organizational and management scholarship (OMS) and practice.
In the scholarly domain, Big Data endeavors are based on the premise that “data is the intermediate representation of science. Science—the surest path to objective knowledge about how to improve society—is impossible unless you’ve turned reality (atoms) into data (bits)” (Olson, Awadallah, Hammerbacher, & Cutting, 2012, p. 5). In other words, data become a function of any entity: person, group, organization, place, service, product, device, file, and any object that has a material or conceptual reality. Relatedly, “all processes, whether they are produced by human effort or occur spontaneously in nature, can be viewed as computations” (Wolfram, 2002, p. 715). Therefore, the key proposition of Big Data for the social sciences can be summarized as “the ability to understand the patterns of human life by analyzing the digital traces that we leave behind” (Pentland, 2009, p. 75; also see Giles, 2012).
Unfortunately, most managerial conversations appear to focus on the role that these digital traces play in matters of commerce (e.g., business intelligence; Chen, Chiang, & Storey, 2012; Dinter et al., 2015) or privacy (e.g., intelligence services, Lyon, 2014; identity theft, ITRC, 2014). In contrast, there have been relatively few social science dialogues about the potential of Big Data to understand and improve the human condition (Savage & Burrows, 2007), especially in relation to work (for exceptions, see Guzzo, Fink, King, Tonidandel, & Landis, 2015; Tonidandel, King, & Cortina, 2015). Thus, the time seems ripe for OMS to embrace the opportunities presented by Big Data to further evolve into a theoretically and professionally relevant discipline (George, Haas, & Pentland, 2014).
To this end, we review a broad range of opportunities and risks associated with Big Data that are relevant for OMS and then provide guidance on how to embrace the former and address the latter. Before doing so, we briefly highlight the key drivers and characteristics of Big Data. Overall, we hope that our review helps inform individuals’ research practices and institutions’ broader policy agendas.
Characterizing Big Data
Thanks to the increasing efforts to digitize the past and record the present (J. Anderson & Rainie, 2014), there are unprecedented opportunities to generate, access, and link data. Big Data then is a broad yet useful term, indicative of a nascent paradigm that connects scholars, practitioners, and policymakers from across disciplines on the basis of techniques, beliefs, and practices that underlie new types of data-intensive research, insights, and practices. What qualifies as Big Data depends on the nature, scope, and operationalization of the real-world phenomenon under investigation, the contemporary benchmarks of computational capabilities (e.g., processing, storage, bandwidth), and the appraisal of what a given community of practice (e.g., genomics vs. social science) considers conventional. Laney (2001) provides a useful perspective in this regard by suggesting three central characteristics (the 3 Vs): volume, variety, velocity (see Figure 1). Accordingly, Big Data can be defined as observational records that may be exceptionally numerous, highly heterogeneous, and/or generated at high rate and systematically captured, aggregated, and analyzed to useful ends.

Key characteristics of Big Data (based on Claverie-Berge, 2012).
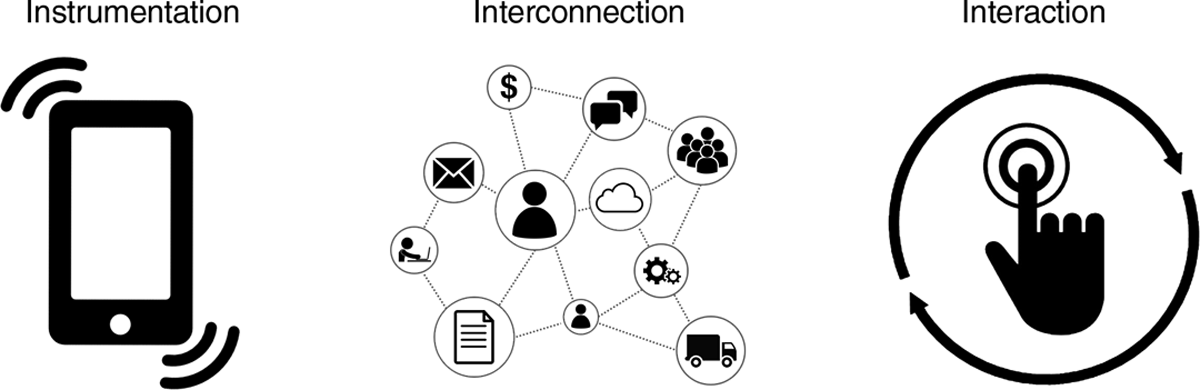
Generally, Big Data are fueled by exponential gains in computing performance, hardware miniaturization, rapidly declining costs, and network ubiquity (Castells, 2011; Mack, 2011). In more specific terms, the drivers of Big Data are instrumentation, interaction, and interconnection (see Figure 2).
Key drivers of Big Data.
Instrumentation
Every physical entity and space is interspersed with information, but humans’ accuracy in capturing it is limited by their time and attention (Ashton, 2009). However, recent developments in sensors and actuators have allowed those technologies to become affordable, mobile, and thus pervasive, thereby allowing researchers to dependably detect and transmit environmental qualities. Across all dimensions of life and work, an ever-increasing array of embedded instruments sense and emit an ever-growing spectrum of data modalities.
Interaction
Entities exert an influence on the substance and form of a given activity (e.g., communication; Bucy, 2004; Jacko, 2012). The growing embeddedness of technology in work and life has transformed these inherently temporal interactions into ordered records about time, sequence, and reciprocity. Such records encompass organizations, systems, employees, and customers as well as their operations, behaviors, decisions, and transactions.
Interconnection
Entities engage in activities such as communication, collaboration, and the creation and consumption of content, all of which traverse devices, locations, hierarchies, and temporal constraints. As computational machinery logs activities (e.g., cloud collaboration; Foster, Zhao, Raicu, & Lu, 2008), it offers interconnected records on users, services, and content that form networks with nodes, edge weights, and auxiliary information (Han, Kamber, & Pei, 2011).
Big Data in Organizational and Management Research
In OMS, the act of gathering, analyzing, and interpreting Big Data is, by and large, unfamiliar territory. Thus, there is a need to inform researchers in this field so that they can competently decide whether and how to devote their attention and resources to this prospect. However, it first needs to be stated that developing an absolute classification of Big Data’s strengths and weaknesses is not feasible: Any assessment strongly depends on the interactions between a given research question and the accompanying data or paradigm. For this reason, not all the issues covered in this review apply to any particular Big Data set or research question. Thus, in the following, we speak only of potential opportunities and potential risks, some of which naturally interrelate. Indeed, Big Data can sometimes seem to present with an opportunity and a risk simultaneously.
For the sake of simplicity, we structure our review along the 3 Vs of Big Data: volume, variety, and velocity, which we also briefly introduce at the beginning of each section (see Table 1 for an overview). Sometimes, an opportunity or a risk can be fed by more than one V; in these cases, we sort the respective opportunity or risk under the most impactful V. We sought to highlight such issues by discussing interrelated opportunities and risks in close proximity to one another. Finally, we conclude each discussion with some ideas and recommendations on how individual researchers or the field in general could exploit the potential of Big Data and address the related concerns.
Summary of Potential Opportunities and Potential Risks of Big Data for Organizational and Management Scholarship, Organized as Discussed Under the Most Impactful V.

Volume
Volume describes the number of observations under investigation: It is a function of the unique entities or records examined (N) and the amount, nature, and frequency of their observed characteristics or parameters (p). Big Data sets are the result of many records (tall data), many parameters per record (wide data), or both (massive data). Some illustrations include: 4.2 million research papers were associated with a few parameters, such as research fields, authors, and universities (tall data; B. F. Jones, Wuchty, & Uzzi, 2008); a sample of 66 day traders created more than 1 million stock trades and more than 2 million instant messages (wide data; Saavedra, Hagerty, & Uzzi, 2011); and 30,328 employees produced 114 million dyadic email communications in four months (massive data; Kleinbaum, Stuart, & Tushman, 2013). Such high-volume data sets invite a range of potential benefits and pitfalls.
Opportunity for Universal Inferences
Researchers may use high-volume data to examine full populations (e.g., N = all employees and customers), which has gained traction in domains such as economics (Einav & Levin, 2014). Where this is not feasible or sensible, a high volume of cases may still allow scholars to identify near-universal or truly representative samples (e.g., Resnick, 2016). For OMS, such tall data can bypass the shortcomings of convenience or otherwise selective samples, which often carry systematic bias (e.g., self-selection, domain neglect) (Bamberger & Pratt, 2010). In addition, it has been argued that OMS undersamples and underpublishes research on, for instance, wage earners, frontline workers, contractors, or marginalized groups (Bergman & Jean, 2015). In contrast, the permeation of data-generating technology at all levels and types of work facilitates investigations to be inclusive of a myriad of workforce segments (e.g., blue- and white-collar workers and regular and nonstandard employment groups).
Accordingly, Big Data can transcend the usual samples and afford OMS with a more inclusive empirical assessment and theoretical understanding of workplace experiences and domains, which can then be broadly applied across people, jobs, industries, and cultures. As a result, OMS may contribute more evidence-based insights to topics of societal importance such as income inequality, work automation, and immigration across different relevant but often underrepresented populations (Green & Dalal, 2016). Where it makes sense for the research question and assuming ethical obligations can be met, we encourage researchers to explore how Big Data can help maximize the external validity and utility of their findings through truly representative samples, if not population-level data
Risk of Biased Sampling
Of course, even if one has access to a massive sample (e.g., N = millions), it may not be necessarily representative of the full population, and thus any analyses are subject to sampling problems. An enormous sample (e.g., 75% of the population) that is biased is less informative and more potentially misleading than a small (e.g., 3% of the population) but representative sample.
Relatedly, we must acknowledge that a significant portion of the world remains relatively or completely offline (Armenta, Serrano, Cabrera, & Conte, 2012). Although the majority of those 4 billion disconnected people reside in developing countries, this issue also disproportionately affects rural or low-income areas in all parts of the world as well as the elderly and the (digital) illiterate (Sprague et al., 2014). By relying on Big Data, OMS may risk incorrectly representing workers who do not own or operate through “smart” devices (Lerman, 2013) and may continue to generate insights that disproportionally reflect Western societies that are educated, industrialized, rich, and democratic (WEIRD; D. Jones, 2010).
This issue of representation also applies to areas with high online penetration. For instance, an analysis of the locations of thousands of tweets sent during Hurricane Sandy would suggest the storm originated from downtown Manhattan. However, people in New Jersey, where the storm actually hit, were simply unable to use Twitter because of power outages and limited cellular access. Although large and rich in content, these data failed to convey a realistic insight (Grinberg, Naaman, Shaw, & Lotan, 2013).
Even without such exceptional circumstances, people may not engage in activities that ultimately produce Big Data on the basis of political orientations, technological attitudes, and religious beliefs (Hargittai & Hinnant, 2008). On a similar note, one has to consider what people are volunteering when they submit information in the Big Data realm. For instance, public social networks, whether private (e.g., Facebook) or professional (e.g., LinkedIn), may have high penetration rates with respect to population but do not necessarily reflect people’s lives or professions (boyd & Marwick, 2011; Chou & Edge, 2012; Tufekci, 2014; Zhao, Grasmuck, & Martin, 2008). Similarly, some workers and groups may refuse to provide genuine contributions to organizational intranets and enterprise social networking services (e.g., Yammer), if they contribute at all.
Furthermore, some online data may originate from sophisticated automated systems pretending to be human. Serving commercial or political interests, these robots, or bots, seek to generate marketable terrain or capitalize on the attention paid to trending topics. Indeed, such programs may automatically copy existing profiles or fabricate new ones, instigate web searches, produce content, respond to human queries, and infiltrate devices (Crampton et al., 2013; Furnas & Gaffney, 2012; Hua & Sakurai, 2013; Karim et al., 2014)—all of which may systematically distort data and the subsequent inferences about human activity.
To mitigate data bias, researchers need to define the key aspects of the population, setting, and procedures. From there, they should thoroughly consider potentially confounding variables that can arise from the socio-technical context that might have enabled the data, such as device-population penetration (e.g., the gyroscope sensor measuring physical activity may not be available in cheaper smartphones, which are presumably used more in low pay/low skill jobs). Formal theory should be applied alongside “common sense” to ascertain the conditions under which a sampling approach may render a phenomenon unobservable. We recommend that scholars understand and describe the external validity of Big Data in methodological terms like range restriction and omitted variables bias (Landers & Behrend, 2015). When making generalizing claims, researchers should delineate the data origin and consider who was potentially systematically excluded, less visible, untruthful, or not real.
Opportunity to Enhance Effect Detection and Model Granularity
All things being equal, systematic effects are harder to detect with fewer data points. However, Big Data provide a number of direct and indirect avenues for strengthening diagnostic efficacy. Foremost, increasing the number of data points is often the easiest way to boost a test’s statistical power. Small samples (N) often constrain the questions one can ask or weaken the probability of correctly rejecting the null hypothesis (i.e., Type II error; Murphy, Myors, & Wolach, 2014). This issue of small data quickly presents a severe limitation in OMS, especially when researchers seek to model complex relationships between multiple factors and their interactions (Murphy & Russell, 2016; Scherbaum & Ferreter, 2009). That is, many organizational phenomena “have their theoretical foundation in the cognition, affect, behavior, and characteristics of individuals, which—through social interaction, exchange, and amplification—have emergent properties that manifest at higher levels” (Klein et al., 2000, p. 15). Creating robust models of such multilevel phenomena requires ample N and p at different levels, or even multiple observations (p) of the same occasion or action, which in aggregate outperform any single observation (Epstein, 1979; Fishbein & Ajzen, 1974).
Indeed, research has demonstrated that a high-volume data set can have more predictive power thanks to more cases (N) and more features (p); this holds across various, real data sets and even for relatively simple, linear models (Junqué de Fortuny, Martens, & Provost, 2013; Perlich, Provost, & Simonoff, 2003). This is because “certain telling behaviors may not even be observed in sufficient numbers without massive data [as only] in aggregate such rare-but- important behaviors make up a substantial portion of the data, due to a heavy tail of the behavior distribution” (Junqué de Fortuny et al., 2013, p. 216). In other words, with ever more data available, each data point provides a little more information about the target concept. In turn, one becomes more confident that something is indeed akin or different to something else.
As such, Big Data allow small but important phenomena to become the subject of more quantitative investigations. Such granularity can greatly assist researchers in more confidently identifying minor segments in their own right as part of an ontology, such as when clustering (e.g., identifying subpopulations), classifying (e.g., assigning observations), or detecting anomalies (e.g., outliers) (Fan, Han, & Liu, 2014). For instance, OMS still does not understand what “makes” star performers (e.g., extremely productive software engineers, world-class athletes; Aguinis & O’Boyle, 2014), but more data points on more cases may be able to empirically reveal what unites them.
Moreover, in the wake of limited resources (e.g., time, money), researchers must often waver between having breadth (N) or depth (p) in their investigations. High-volume data counteract this problem, allowing researchers to investigate with both breadth and depth, often using the same amount of resources (Antenucci, Cafarella, & Levenstein, 2013). For instance, traditional field data collection in OMS is often constrained to relatively few variables, and the resulting data sets seldom contain nonfocal information. In contrast, Big Data with a large volume (p) can help address omitted variable bias, offering auxiliary information that can be used to test for alternative causes z that potentially drive change in the focal variable y.
Alternatively, Big Data could help identify sound instrumental variables to overcome the challenges inherent in data endogeneity—a practice common among economists (Antonakis, Bendahan, Jacquart, & Lalive, 2010).
Relatedly, OMS considers randomized experiments to be the gold standard in estimating causal relationships as potential confounding factors equally affect treatment and control groups (Highhouse, 2009). However, this also begets issues of practicality, ethicality, or external validity. As an alternative, experimental conditions may be emulated in the field by using large N and p to construct precisely controlled matched groups (e.g., via Mahalanobis’s distance, propensity scoring) that can have exceptional treatment-control ratios (e.g., 1:5; Hersh, 2013). For instance, when investigating the causality of developmental experiences (e.g., webinar on leadership), researchers may use Big Data to match individuals (e.g., managers) into groups with highly similar covariate distributions, based on features relating to educational history, work experience, and network (e.g., sourced from LinkedIn).
Additionally, researchers may gain greater analytical efficacy with large data volume by withholding data for test-retest validation purposes. With their smaller number of observations, conventional data sets seldom allow researchers to hold out many, if any, data points for validation modeling. Relatedly, hypotheses testing and reviewing (e.g., by the investigator or manuscript reviewers) may identify important issues that require reanalysis, which can demand additional data collection that may be costly or constrained (e.g., survey fatigue). By contrast, Big Data with many records (N) may be split, while continuous data (p) may be treated as a permanent holdout sample that allows one to swiftly validate a model alongside iterative research approaches for refining and fitting models (Kogan, Alles, Vasarhelyi, & Wu, 2014).
Opportunity to Discover
For the most part, OMS largely confines its interests to preconceived hypotheses (Locke, 2007; Spector, Rogelberg, Ryan, Schmitt, & Zedeck, 2014). However, Big Data can contain analytical value that exceeds any a priori conception (e.g., Einav & Levin, 2013). Phenomenon-driven, exploratory approaches may not precisely explain why something is happening, but they can identify (ir)regularities or shed light on boundary conditions, thereby generating novel questions (Woo, O’Boyle, & Spector, 2017). The recent establishment of the Academy of Management Discoveries journal is a testament to researchers’ role to illuminate “substantively important yet poorly understood phenomena concerning management and organizations [through] a convincing empirical case…, warranted by their data” (Van de Ven, 2013).
With Big Data, the discovery process may be aided by integrative, computational approaches that automate the construction and fitting of models from nonparametric data as well as some of the model description (The Automatic Statistician, 2014; Birnbaum, Hammond, Allen, & Templon, 2014; Lloyd, Duvenaud, Grosse, & Tenenbaum, 2015). For instance, association rule learning describes a class of approaches that identify mechanisms driving the co-occurrence of signal sets. To illustrate, a rule may return the probability that x appears without y or the likelihood of z being present when x and y appear together (Hahsler, 2015). Other domains use these “if-then” rules, for example, to generate product recommendations: buys {milk} → suggest {bread} or is {male} buys {diapers} → suggest {beer}. Surprisingly, the OMS toolkit does not yet include association rule learning. However, by drawing on feature-value combinations contained in human resource management systems (Stone & Dulebohn, 2013; Woo et al., 2017), scholars could identify all rules that have {absent day} as a consequence and {overtime} as an antecedent or otherwise connect the queries to identify associated rules linked to possible features such as {building temperature} {customer sentiments} {free lunch}.
Association rules can be developed using data where any conceivable attribute is determined to be either present or absent. These approaches typically involve three fundamental steps: (a) identifying frequent patterns, (b) constructing association rules from frequent patterns, and (c) identifying meaningful association rules (Zhang & Zhang, 2014). Depending on the data, research question, and analytical approach chosen, these steps can be largely computationally autonomous (unsupervised machine learning), or they can require substantial human expert knowledge and guidance (supervised machine learning). The logical power underlying associative rule learning may be further used to identify and discriminate between necessary but not sufficient variable states in relation to some phenomenon of interest (necessary condition analysis; Dul, 2016).
Beyond numerical data, researchers can also make discoveries using massive textual data (e.g., large text corpora, millions of status updates). For instance, open vocabulary analysis can use multiword sequences (n-grams; Norvig, 2009) to produce self-organizing semantic maps, which can then reveal concept clusters and their taxonomic relatedness (Halevy, Norvig, & Pereira, 2009; Janasik, Honkela, & Bruun, 2008; Weichselbraun et al., 2009). Such natural language processing approaches utilize the richness and authenticity of the raw material to identify themes and categories. In this way, it is possible to avoid organizing the phenomenon into prior conceived schemes and lexica that may more reflect the biases of the classifier rather than the reality that produced the data (Schwartz et al., 2013). For instance, OMS may draw on natural language contained in thousands of email or instant messages to contrast the attitudes of an organization’s upper echelon with those at the frontline, track employees’ mood developments as a consequence of discrete corporate or economic events, or characterize change in workers’ social identity as a function of promotion, mentorship, or parenthood.
In essence, Big Data fuel phenomenon-driven research, which aligns with extant calls to action (Hambrick, 2007; D. Miller, 2007; Orlitzky, 2012) for OMS to increasingly engage in inductive and abductive reasoning. The intent is not to engage in a theory-free analysis of mere correlation (see C. Anderson, 2008) but to form an unconstrained conceptual view through “the reporting of facts…that lack explanation, but that, once reported, might stimulate the search for an explanation” (Hambrick, 2007, p. 1350). In other words, even though correlation is not causation, the former may be taken as suggestive of the latter, and that domain knowledge can form the basis for plausibly identifying concepts, theorizing abstractions, and disentangling effects that are deemed important (abduction, induction; Bamberger & Ang, 2016). We consequently argue against presenting post hoc theorizing as tests of a priori hypotheses (Cortina, 2016; Kepes & McDaniel, 2013); instead, we recommend that researchers log and openly explicate the (often messy) discovery process and how it unfolded.
Naturally, we do not seek to diminish the contributions of traditional methods or advocate against them. The Big Data paradigms offer a variety of techniques for description and discovery that by design accommodate nonlinearity, interaction terms, high-dimensionality, and cross-validation, among other concerns. These techniques are typically summarized as un/supervised machine learning and include: cluster detection, pattern recognition, random forests, and artificial neural networks (see overviews by Goodfellow, Bengio, & Courville, 2017; James, Witten, Hastie, & Tibshirani, 2013; Oswald & Putka, 2015). While the field of machine learning is growing quickly and constantly developing new techniques, there are no perfect methods free of any limitations or assumptions. Naturally, choosing the most appropriate approach depends on the problem and data at hand, which is beyond the scope of this article.
Another approach to discovery involves the graphic portrayal of deviation, correlation, magnitude, ranking, distribution, proportion, spatial relationships, change over time, or a combination of these (Friendly & Denis, 2008; C. Yu, Yurovsky, & Xu, 2012). The premise of data visualization entails compressing large and often complex amounts of information into a sufficiently small space that suits human cognition (Sinar, 2015; Tufte, 2001). Additionally, some meaningful insights from Big Data may require direct and intuitive portrayals more than relatively simple descriptive indices. For example, geo-located entities on a map, such as firms, can be combined with histograms, while personality profile clusters can be represented in multidimensional space and annotated with content from interviews.
The technical side offers a plethora of options in this regard. The statistical package R features a growing community and a powerful open-source ecosystem that can help realize many analytical propositions (Culpepper & Aguinis, 2011). Other potent options include workflow-oriented platforms such as RapidMiner and KNIME, the programming language Python, or the Mathematica-based hybrid Wolfram Language, which links functional and rule-based programming alongside symbolic computation.
We will refer to R throughout the present article as there is an ever-growing array of add-on packages that offer reproducible code, reusable functions, documentation, and sample data. Indeed, there are already numerous R packages relating to machine learning. For instance, the R packages arule and n-gram, respectively, allow one to analyze association rules and word sequences in a corpus. For more insight into these packages, scholars can turn to the Journal of Statistical Software, which often publishes articles describing new R packages; the CRAN task overview (cran.r-project.org/web/views), which provides a helpful directory sorted by topic; or an annotated starter collection for OMS produced by Tonidandel et al. (2016).
To assist researchers in visually describing Big Data, we draw attention to some seminal literature on the meaningful conversion of data into graphics (Bertin, 1981; Cairo, 2012; Tufte, 1997, 2001, 2006), the R packages ggplot2 and arulesViz, and the ongoing environmental scans on data visualization tools (see keshif.me/demo/VisTools).
Risk of Spurious Relationships
By applying regular frequentist methods to very large data sets, researchers will often falsely reject the null hypothesis (i.e., Type I error; Ioannidis, 2005) and thereby seem to uncover many significant relationships that are actually spurious (Fan et al., 2014). In other words, the sample correlation will appear to be high, but the variables will not be correlated on substantive grounds. To illustrate, even with just 100 parameters, one can compute 4,950 correlations (=100 × 99/2). At a significance level of .05, one can assume that about 247 of these correlations occur simply by chance. By way of illustration, an intentionally “blatant example of totally bogus application of data mining” (Leinweber, 2007) showed that the S&P 500 stock index was correlated with butter production in Bangladesh (R 2 = .75, Leinweber, 2007; Vigen, 2014). These issues are not new, but the increased statistical power of very large data sets magnifies the problem and probability of finding too many trivial relationships when discovering or seeking to falsify hypotheses.
Generally, researchers should use the analytical procedures that provide the greatest efficacy for what is being studied (Buchanan & Bryman, 2007). Accordingly, we do not advocate one best way; instead, we allude to approaches that can help establish a sense of importance for identified relationships.
We start by addressing null hypothesis testing. Some have suggested that researchers should not simply adopt conventional and arbitrary p values such as .05 or .01 but instead use and report a more precise probability value between 0 and 1.00 (Aguinis et al., 2010; Nickerson, 2000). This latitude requires researchers to responsibly establish such a threshold a priori based on the specific research goals and associated theory. Alternatively, the Holm-Bonferoni method may be used to maintain an overall Type I error bound when making multiple comparisons (Aickin & Gensler, 1996). This procedure sorts all p values m from smallest to largest and then sequentially rejects all hypotheses characterized by p values that are smaller than an increasingly critical threshold. Specifically, if the first p value is greater than or equal to α/m, the procedure is stopped, and no p values are considered significant. Otherwise, the first p value is declared significant and the next p value is contrasted with α/(m – 1). The procedure loops through until a given p value is greater than or equal to its respective threshold. Researchers can then report their decisions to reject or confirm.
Instead of selecting the most important variables, researchers might adopt an alternative approach that involves removing less important variables. The class of penalized regression extends multiple regression by implying a constraint on the values of prediction. To reduce a model’s complexity, the researcher must set tuning parameters that determine a penalty function: The sum of the absolute values of the regression coefficients cannot exceed that specified value. As a result, this approach will set a number of marginal predictor coefficients to nil and thereby reduce the total amount of predictors to some desired, interpretable state. Granted, the theory and practice of penalized regression remains an area of continuous development: The considerable advances that have been made all come with their own assumptions and limitations relating to ease of implementation and computational requirements (Farcomeni, 2008). We encourage researchers to familiarize themselves with Lasso (least absolute shrinkage and selection operator; Tibshirani, 1996), elastic net (Zou & Hastie, 2005), OCMT (one covariate at a time multiple testing; Chudik, Kapetanios, & Hashem Pesaran, 2016), and the R package glmnet.
Still, the adequacy of null hypothesis testing has been often questioned (Krantz, 1999; Schwab & Starbuck, 2009), to the point that some journals have abandoned its use (Trafimow & Marks, 2015). We too propose that OMS move beyond the ritualistic binary logic of null hypothesis testing, particularly in cases involving Big Data, and add point estimates of effect sizes alongside their confidence intervals. While this is no panacea, determining the magnitude and variance of effect sizes can be useful for estimating the empirical certainty of effects. Given that meta-analytic research demonstrates that the engrained evaluation thresholds of effect sizes “bear almost no resemblance to findings in the field” (Bosco, Aguinis, Field, & Pierce, 2015, p. 439), it is also crucial to contextually construct and rationalize what may be deemed a small, medium, large, or simply meaningful effect. Researchers should evaluate their effect sizes using benchmarks related to the phenomenon, context, and data generation (Bosco et al., 2015; Bosco, Uggerslev, & Steel, 2014), especially in light of the sometimes substantive practical implications of their work (e.g., a 1.2% productivity gain can equate to $2 million in additional revenue; Aguinis et al., 2010).
Risk of Analytical Dilemmas
Some statistical principles used in OMS were designed around making inferences from relatively small data sets and may be inappropriate for analyzing Big Data characterized by high dimensionality: many parameters (p) per case (N). For instance, sensors may emit thousands of signals on one phenomenon, potentially outputting more parameters than there are distinct, meaningful characteristics for a concept. Using such a high-dimensional raw data matrix may be computationally or inferentially intractable. Moreover, when an analysis depends on the estimation of many parameters, the estimation of errors can accumulate to the point that this error-induced noise dominates the true signals required for effect detection and model estimation (Fan et al., 2014; Silver, 2012).
In a similar vein, increasing dimensionality can inflate the volume of the (imaginative geometrical) space so quickly and considerably that the available massive data can, contrary to intuition, become quite sparse. This occurs when most parameters associated with a given record are zero or not true. For example, consider employees (N) who are associated with tasks and customers (p); however, a given employee is only associated with a relatively tiny portion of the organization’s total number of tasks and customers. Consequently, the vast majority of p are missing or unobserved. Even when accounting for such issues by analytical means (i.e., zero-inflation), the data may become so thin that reliable comparison and statistical significance testing are rendered unfeasible. At first glance, this scenario may seem akin to missing at random (MAR); however, imputing these “missing” variables with estimated values is not recommended as it would introduce an unfounded bias. Taken together, this “curse of dimensionality” presents a challenge whereby adding further data (i.e., N) to support significance testing often entails adding more dimensions (p), which leads to sparser data (Clarke et al., 2008; Verleysen & François, 2005).
In such cases, it can be sensible to reduce dimensionality while preserving as much information as possible. Yet, the process of identifying key features and finding low-redundancy structures for the best signal-to-noise ratio often requires some automated variable selection (e.g., when using exploratory factor analysis to develop a scale). For instance, researchers may, on the basis of some threshold value, opt to remove columns (p) from the Big Data matrix when they exhibit little useful information due to disproportionally missing values (missing values ratio), relatively little variance (low variance filter), or very similar trends (high correlation filter).
Random projections can be an effective means of reducing high-dimensional data into structures of lower complexity. With little oversight, the original high-dimensional raw data matrix can be projected onto (i.e., multiplied with) a lower-dimensional matrix of random data. The ensuing data matrix is comparable with those resulting from traditional approaches, such as principal component analysis, which are often computationally prohibitive when dealing with a very large amount of parameters (Bingham, Bingham, Mannila, & Mannila, 2001).
To identify the best predictors for some target attribute, researchers can use machine learning algorithms such as random forests. In brief, a random forest operates by constructing multiple decision trees against a target attribute. Every decision node is thus a condition on a single parameter that splits the data set into two so that similar response values end up in the same set. The approach then uses the mean prediction (regression) of the individual trees to find the most informative subset of features (Liaw & Wiener, 2002).
We encourage researchers to consider the aforementioned approaches when dealing with high- dimensional data so as to build models free of biases and unwanted noise. While the reviewed approaches have no substantial history in OMS and are not failsafe, they are conceptually and operationally relatively simple, with R packages provided for random projections, RPEnsemble, and random forest, vsurf. Other techniques can require more algorithmic customization and handle particular data problems in more sophisticated ways, such as parallel factor analysis, tensor decomposition, naive Bayes, or focused generalized method of moments (Fan & Liao, 2014; Kolda & Bader, 2008; Li, Ling, & Wang, 2015; Mardani, Mateos, & Giannakis, 2015).
Variety
Variety describes the heterogeneity of data modalities that are open for investigation; it is a function of the many autonomous sources and means by which reality manifests in the digital realm. For starters, the deployment of mobile multipurpose devices cuts across all dimensions of life and work and proliferates the production and consumption of content data such as text, graphics, and video (Chamorro-Premuzic, Winsborough, Sherman, & Hogan, 2016). Meanwhile, algorithms log data on user interaction, search queries, and click streams, just to name a few. Data sources essentially emerge from all the technological permutations of systems associated with communication, mobility, production, commerce, and construction (J. Anderson & Rainie, 2014; Swan, 2012). These can encompass sensors that may be stationary, wearable, ingested, or implanted (Chaffin et al., 2015; Choi, Kim, Cha, & Ha, 2009; Poon, Lo, Yuce, Alomainy, & Hao, 2015; Tunçalp & Fagan, 2014; Zhong & Xiao, 2015). The resulting data may relate to space (e.g., location, proximity, acceleration, three-dimensional orientation), time (e.g., date, time, weekday, milliseconds), physiology (e.g., body temperature, pulse, blood pressure, respiration, oxygen level, electrodermal activity), kinetic (e.g., touch, gestures, posture, step count), expression (e.g., speech, gaze, mimicry), ambience (e.g., light, sound, temperature, precipitation, humidity, wind, barometric pressure, sunshine, UV radiation, pollution), and data about data (e.g., information on data object features and relations).
Observations might come in quantifiable metrics or text strings that are directly machine-consumable. Graphics, video, or audio data are encoded, at best, in standardized file formats. Relationships between entities are described in network- or graph-oriented databases (Simmen et al., 2014). Sensor data can exist in raw feeds, while some data have to be scraped from idiosyncratic data containers (Loukides, 2010). This variety in media and formats may be categorized along a continuum of structured, semi-structured, and unstructured data. Structured (or relational) data describe the kind of information that can be neatly organized in a matrix of columns and rows. Semi-structured data may be found in documents, where elements and composition are described through some markup language. Unstructured data represent information contained in, for example, graphics or personnel records. Granted, it is not those files or their code that lack the structure but rather that their anatomy does not conform to typical relational data models (i.e., columns and rows). It is estimated that up to 85% of an organization’s data are semi- or unstructured (Troester, 2012). For OMS, this variety gives rise to a number of opportunities and risks.
Opportunity to Triangulate
Much data generation in OMS relies on a small number of techniques with inherent limitations (Podsakoff, MacKenzie, & Podsakoff, 2012), including questionnaires (e.g., miscomprehension, information bias), interviews (e.g., social desirability), laboratory experiments (e.g., external validity, demand character), and archival data (e.g., nonresponse/selection bias). However, science often demands that we discount our sensory experiences and established “truths” once we uncover new means for generating evidence. Taking this axiom to heart, OMS had already adapted new developments for its toolkit (e.g., neuroscience; Becker, Volk, & Ward, 2015; Volk & Köhler, 2012) and can continue this trend with the Big Data paradigm, which affords triangulation by means of different measures and methods that can complement more traditional approaches. In this way, scholars may be able to increase the efficacy of their findings (Denzin, 1970).
Rarely does a singular metric fully represent a concept of interest. However, the increasing range of autonomous data sources and modalities engenders multiple levels of abstraction and different perspectives about a given target concept; this can potentially produce a combined effect that is greater than the sum of the separate effects. To illustrate, stress plays a crucial role in employee health and performance (Danna & Griffin, 1999). To enhance the accuracy and reliability of measuring stress, scholars could triangulate behavioral metrics derived from mobile phone activity (call logs, SMS logs, proximity data), weather conditions (temperature, pressure, total precipitation, humidity, visibility, wind speed), and survey data (Big Five personality traits) (Bogomolov, Lepri, Kessler, Pianesi, & Pentland, 2014).
Furthermore, many phenomena produce both quantitative and qualitative data and thus can be investigated accordingly. That is, whether a study results in qualitative, quantitative, or both types of data may simply depend on the type of measurement device deployed. Consequently, there may not be a “method-divide” (Johnson & Onwuegbuzie, 2009) between “small” qualitative and “large” quantitative data sets. For instance, language is self-descriptive, personal, and affect-laden and thus a meaningful marker of personality and cognitions as well as a mediator of social processes as they occur at work (Pennebaker, Mehl, & Niederhoffer, 2003). Moreover, linguistic content and style are present in conversations, emails, and status updates, to name a few. Qualitative means may thus be applied to understand the nature, construction, and categories of an investigated phenomenon. Quantitative means may assist in understanding the validity, variety, and distribution of those categories as well as their inter- and intrarelationships with the phenomena of interest. Indeed, by using massive language data from social media, such methodological triangulation has meaningfully stitched together feature extraction, correlational analysis, and visualization to study personality (Schwartz et al., 2013), human development (Kern et al., 2014), and positivity (Eichstaedt et al., 2015).
In essence, the Big Data paradigm affords OMS with more choices (Buchanan & Bryman, 2007). We recommend that researchers shift from engrained methodological uniformity to an open mindset that draws on complementary and overlapping modes for more holistic representations of reality and reasoning. As noted, multiple lower-order signal sources may be aggregated to form a more efficacious higher-order measure of a construct, with the caveat that researchers must ensure that the signal sources do not conceptually conflict in terms of their reflective or formative logic (Edwards, 2011). Consider the aforementioned issue of employee stress levels: Scholars could further enhance measurement precision by including data on articulated sentiments, voice pitch, movement, body language, heart rate, skin conductance, blood pressure, and so on—some of which may be collected via the slew of common wearables such as activity trackers or smart watches. We encourage researchers to deeply explore a phenomenon by triangulating unobtrusive and explicit measures in a symbiotic manner (e.g., text data from Linkedin, Twitter, Facebook, Yammer, or Slack alongside self-report survey data; Schwartz et al., 2013) or through a multistudy approach (e.g., a study with massive N to establish support for key hypotheses alongside an experimental study with relatively small N to control for confounding factors; Van Quaquebeke & Giessner, 2010).
Opportunity to Capture In Situ Signals
Researchers typically investigate organizational phenomena by conceptualizing constructs whose existence must be inferred from more observable actions or features (Morgeson & Hofmann, 1999). The Big Data era affords more unobtrusive and faithful measures (Webb, 1966) that can address methodological limitations where “people have not always done what they say they have done, will not always do what they say they will do, and often do not even know the real causes of the things they do” (Baumeister, Vohs, & Funder, 2007, p. 397).
As alluded to earlier, systems and sensors embedded in entities and the environment can quantify ever-growing arrays of analog phenomena and events that are of importance to OMS, such as sociability, alertness, stress, customer contact, and work breaks (Ye, Dobson, & McKeever, 2012; Z. Yu, Zhou, & Nakamura, 2013). The means to capture these data are either not detected or are accepted as part of the natural environment by those being observed while they go about their normal lives (Hill, White, & Wallace, 2013; Orbach, Demko, Doyle, Waber, & Pentland, 2015; Vinciarelli, Pantic, & Bourlard, 2009). This can produce more “honest signals” (Pentland, 2008) that mitigate methodological issues of reactivity and response bias.
Many human behaviors are automatic and result from cognition, affect, needs, values, and attitudes that are un- or subconscious and largely unavailable for or misinterpreted by means that involve conscious self-reporting (Bing, LeBreton, Davison, Migetz, & James, 2007). Existing means of capturing such implicit phenomena (Bowling & Johnson, 2013) typically cannot be administered in situ, such as when subjects are engaged in their work duties. However, researchers may still yearn to capture what occurs outside of individuals’ consciousness, control, and deliberation when investigating, say, conflict during decision making at work. For instance, the affect as information framework posits that affective arousal influences modes of learning and thinking (Storbeck & Clore, 2008). To this end, one could operationalize affective arousal via physiological reactions in employees (e.g., pulse, skin conductance; Becker & Menges, 2013) and information-seeking via visuospatial attention on their computer screens (e.g., eye fixation, gaze patterns; Gottlieb, Oudeyer, Lopes, & Baranes, 2013; Hoffman & Subramaniam, 1995).
We argue that the time has come for OMS to adopt technologies capable of sampling the minutiae of human activity as it occurs in authentic contexts. Recent studies on team evolution (Kozlowski, Chao, Chang, & Fernandez, 2015) and leadership emergence (Chaffin et al., 2015) support this call, although wider adoption appears minimal in OMS. Earlier we alluded to the spectrum of potential data sources and modalities, and we encourage researchers to actively explore these options—starting, for instance, with their own wearable devices or by using or coding apps that draw on existing sensors. Researchers may capture eye gaze using the inbuilt cameras of smartphones and laptops and track pulse via wearable activity trackers and smart watches. Other options involve proprietary socio-metric badges, which are wearable devices that can sample data on speech, physical activity, and relative proximity to other devices (Chaffin et al., 2015).
Likewise, researchers might capitalize on man-in-the-middle platforms (e.g., Apple ResearchKit), which offer a unified framework for device-enabled, large-scale data collection efforts. These platforms provide informed consent procedures, survey and sensor data collection functionalities, modules for integrating third-party apps and sensors, encrypted data storage and transmission, and the possibility of reaching billions of people, at least in principle. While such platforms are mainly used for medical research, it is easy to envision studies at scale using in situ signals that reflect kinetic, physiological, acoustic, and visual phenomena to operationalize phenomena relevant to OMS, such as cognitive workload (Hörmann et al., 2016), stress (Sioni & Chittaro, 2015), or learner engagement (Aslan et al., 2014).
Risk of Deceiving Data Quality
Most phenomena of interest are analogue or qualitative, and science often quantifies them for the sake of further analysis (e.g., latent construct questionnaire items). The resulting data are thus not objective but the result of human-designed operationalizations. OMS has well-established principles regarding the extent of trustworthiness by which data sanction certain inferences. If data quality is poor, then assumptions behind models and findings will be flawed, and the decisions they drive will be faulty.
Of course, data quality is neither a new topic nor a defining feature of Big Data. Still, the high uncertainty that accompanies new forms of data generation creates a renewed need to examine whether what is measured (a) sufficiently corresponds with the declared real-world phenomenon (i.e., validity) and (b) if it demonstrates sufficiently similar results under stable conditions (i.e., reliability). In the domain of Big Data, there is a reasonable concern that observations may not always have a meaning assigned to them and may not produce dependable data. For instance, Twitter users do not align their tweets with psychological frameworks of affect (e.g., overlooking ironic inflection), and a swipe card may be forgotten at home while the owner is at work (e.g., falsely indicating sick days).
Even sensors built for a particular measurement purpose may not produce sufficiently accurate or reliable data. For instance, device components such as microphones may differ in their sensitivity (Chaffin et al., 2015), which can produce dampened or extreme signal ranges. On a similar point, studies also suggest that the inter-device reliability for common activity trackers is generally high for normal step count and sleep duration; however, problems arise at slow walking speeds (underestimation) and vigorous physical activity (overcounting) as well as for estimating sleep efficiency (=time in bed/time asleep) (Evenson, Goto, & Furberg, 2015; Mantua, Gravel, & Spencer, 2016). Such discrepancies may not be problematic for common device usage, but they could reflect a substantial bias in the between-device variability that is a systematic function of some other quality. For instance, more expensive wearables may produce significantly sounder data than their cheaper counterparts. Under identical conditions, then, a wealthy worker would be considered relatively more vocal, active, or rested than a poorer employee.
In a related vein, data may be facilitated and constrained by the inherent technological and institutional structures in play. That is, the algorithms underlying sensors (e.g., emotion recognition), Internet services (e.g., search), interfaces (e.g., user input), or data selection (e.g., Application Programming Interfaces) may represent idiosyncratic and proprietary “black boxes.” In other words, they may feature subtractive methods that affect the nature, range, accuracy, and completeness of available data (Berry, 2011; Vis, 2013). These algorithms may not be well documented, and they are prone to change because of forces that affect the data vendor (e.g., technological progress, market competition; Lazer, Kennedy, King, & Vespignani, 2014a, 2014b).
Another bias may arise when the inclusion of a case in a sample depends on the variable being examined (Tufekci, 2014). For instance, when researching job satisfaction through social media data by means of hashtag selection (e.g., all tweets with #hatemyjob), those observations are selected on the dependent variable and the basis of self-selection by the sender. This excludes other cases and likely limits external validity.
Some argue that exactitude is more important for small data sets, where every data point is critical and ought not to bias the analysis, than enormous data sets, which supposedly allow for some imprecision (see Mayer-Schönberger & Cukier, 2014). We disagree with such general claims: For certain research questions, particular levels of validity and reliability may suffice, while other research demands higher degrees of trustworthiness. Generally, we would like to remind researchers that new methods for deriving empirical constructs cannot override the foundational principles of social science.
Specifically, establishing internal validity—so that a given measure meaningfully corresponds to the intended construct of interest—retains absolute primacy. First, constructs of interest must be unequivocally defined; otherwise, it will be impossible to link them to distinct metrics or modalities (Kozlowski et al., 2015), not to mention determine whether they are the cause or the effect of the measure (Edwards & Bagozzi, 2000). Second, researchers need to explicate the theoretical and technical underpinnings of each possible data point that renders the phenomenon of interest: What is recorded? How is it recorded? When is it recorded? Where is it recorded? Who is recorded? The ensuing description may be subjected to review by domain experts (Hinkin, 2005) and those with potent technological expertise. Third, novel measurement approaches may be cross-validated with established instruments that map onto the same conceptual space, such as published psychometric questionnaires (Hill et al., 2013; Wuchty & Uzzi, 2011). Similarly, researchers may want to calibrate a measurement approach by having selected participants perform scripted actions or using known true scores (ground truth; Boyd et al., 2015).
Reliability may be determined by forming probabilistic inferences, which entails quantifying data quality dimensions such as completeness, correctness, and timeliness (Heinrich, 2009; Kaiser, 2010). However, reliability is more a function of the nature and type of data sources used to operationalize a construct, so principles of assurance and remedial are more idiosyncratic. For instance, to reduce risks of inter-device variability, researchers could determine the baseline levels for each device. Or, to increase the measurement reliability of a sensor, researchers could reduce its random error effects by averaging multiple data points taken over time so that values will converge on a more robust score (Chaffin et al., 2015).
Opportunity for Perspective and Reconciliation
Every event and object is associated with a given time, place, and space: “situational opportunities and constraints that affect the occurrence and meaning…as well as functional relationships between variables” (Johns, 2006, p. 386). Context describes the “stimuli and phenomena that surround and thus exist in the environment” (Cappelli & Sherer, 1991, p. 56) that are also “above those expressly under investigation” (Mowday & Sutton, 1993, p. 198). Quantitative OMS does not yet sufficiently recognize and appreciate context (Johns, 2006): In fact, many theories in OMS can effectively assert why relationships exist but cannot determine when they apply (Guzzo, 2015). By its nature, Big Data involves or can be connected to data about data to raise contextual awareness. Explicitly, metadata can be understood as a class of co-occurring data points with supplementary information on a given data object. For instance, for organizational document files, metadata can include records about who (created it), when, where, how (it was created, accessed, edited), and what (it shows). The metadata in emails, for example, contain statements about the subject, length, recipients of the message, and attachments, among other elements. Accordingly, metadata often comprise data about time, location, and particular associations with other entities. Metadata may also include tags describing key attributes relating to the nature and meaning of a data object for situating it within structures such as taxonomies (hierarchies) or ontologies (groupings). By example, tags for a picture can range from predefined vocabulary (e.g., me, work, thumbs down) to flexible statements (e.g., me bored at work).
As such, metadata assume two general forms: Macro-metadata might be understood as the more “global” information associated with an entity or case (N) and as such may be obtained across multiple data sets or could help link data sets (e.g., user profile, age, orientations, connections). Micro-metadata might be understood as the “local” information obtained as part of some record (p) and as such is more descriptive about the data object itself (e.g., time, location, and user associated with a value that reflects a phenomenon of some sort). We consider metadata exceedingly useful for OMS. The research question determines whether metadata either manifest as or interact with the focal variables. For instance, researching the flow of knowledge and effect of work-integrated learning is challenging because of the often spontaneous and informal nature by which they manifest (e.g., information search, peer communication). Scholars can utilize employees’ shared properties to link their activities and habits from across an organization’s disparate IT systems (e.g., email, phone, inter- and intranet, training platforms, building security). This can then produce a rich network topology that is more than the sum of its parts (e.g., identifying information sources and trajectories that lead to innovation). The sociodemographic and relationship data originally carried as metadata may then be used to adjust entities’ relative contribution to the phenomena of interest (Christakis & Fowler, 2013).
Relatedly, much network analysis describes complex structures by somewhat static means of centrality, density, assortativity, or subsets (Robins, Pattison, Kalish, & Lusher, 2007). More recent advances have inspired the family of exponential random graph models, which dramatically improve the ability to conduct joint inference on dependence, such as analyzing the generative processes that give rise to patterns in networks (transitivity) or the distribution of possible outcomes for a given specification of a model (Goodreau, Kitts, & Morris, 2009).
More data make these approaches more robust as they test multiple sets of possible alternative networks with similar or dissimilar structural features. For example, an organizational system may be modeled as an information network that contains a set of object types, such as [manager, support-agent, customer, problem, advice, devices], along with a set of relation types, such as [used-for] between calls and problems, [have] between customer and problem, and [interactions] between customers and manager (Han, 2012). Metadata can link these records and add meaningful information about, for instance, the processes underlying the formation of customer problems, expert employees, and relationships inherent to such network structures.
Finally, OMS deals with an ever-growing web of knowledge, which also increasingly amalgamates multiple distinct elements that behave nondeterministically or nonlinearly, with the phenomena of interest residing in those elements’ relationships, complementarities, and configurations (P. Anderson, 2008; Greckhamer, Misangyi, Elms, & Lacey, 2007; Greckhamer, Misangyi, & Fiss, 2013). In other words, depending on the context or how elements are arranged, the same set of causal factors can lead to different outcomes, and perhaps even opposing effects (multifinality), while diverse causal factors can lead to the same outcome (equifinality). Such multiplex phenomena (e.g., organizational success, careers, creativity) largely resist simple reductionist analyses. To illustrate, studies find conflicting effects for gender, type of employment contract, and level of motivation on work-related learning outcomes (Kyndt & Baert, 2013). In these cases, researchers may reconcile contradictory findings by using metadata to organize seemingly uniform data into various classes that have distinct properties of their own. In this way, they can establish meaningful boundary and trigger conditions for both the applicable theories and phenomena of interest.
Risk of Privacy Breach
The ever-expanding variety of data describes more detailed aspects of life and living. Big Data have enabled a dramatic leap in our ability to extract a person from data, but at the expense of privacy: people’s ability to control their own conception and its expression. Much data are sensitive, and there are substantial risks associated with how data are protected and used. Breaches in data flow und use, with or without malicious intent, can cause serious harm to individuals and organizations (Richards & King, 2013). Problematic consequences may arise from identity disclosure (e.g., power asymmetry, stigma, control), identity distortion (e.g., false profiling, risk fallacy), or identity abuse (e.g., fraud, security override). Detailed profiling can lead to discrimination in housing, pricing, education, employment, and access to credit, among other areas (CEA, 2014). Meanwhile, technological and commercial developments have far outpaced the existing legal and normative frameworks that govern matters of privacy and ethics (Bohannon, 2015; de Montjoye, Radaelli, Singh, & Pentland, 2015).
The structures that determine what OMS can and cannot do largely stem from dealing with samples that were generally small, contained, and aware of the data collection. To ensure the privacy of study participants in those conventional studies, quasi-identifiers such as name, birthdate, address, telephone number, email address, and Social Security number were typically removed from the data set. In this way, researchers avoided making inferences about actual people or linking additional information to these records.
As the amount and variety of recorded information about individual grows exponentially, personally identifiable information becomes the data (Narayanan & Shmatikov, 2010). That is, “any information that distinguishes one person from another can be used for re-identifying anonymous data” (p. 26). Some illustrations: Anonymous hospital discharge records were re-identified by joining them with a public voter database using common demographic attributes (Seeney, 2002). Using only the network topology, researchers re-identified the anonymized users of a social media service by linking auxiliary information from a different and independent social network (Narayanan & Shmatikov, 2009). Of course, data may be used for very different purposes, including privacy invasion via inference. Motion sensor data, originating from a smartwatch worn on a wrist, has been shown to reveal the user’s keypad- entered passwords and PINs (Beltramelli & Risi, 2015). Easily accessible digital records of behavior (Facebook likes) have been successfully used to predict sexual orientation, ethnicity, religious and political views, personality traits, intelligence, happiness, use of addictive substances, parental separation, age, and gender (Kosinski, Stillwell, & Graepel, 2013). These “feasibility demonstrations” use only public data and a few sources and thus only scratch the surface of what is considered possible (Anthes, 2015).
In addition, there is an ever-growing list of incidents whereby some unauthorized entity gained access to protected data relating to political orientation, health condition, employment history, sexual pursuit, purchase behavior, communication records, and much more (Wheatley, Maillart, & Sornette, 2016; List of Data Breaches, n.d.). Whatever the original intent, the result is the release of confidential information that will almost always exist somewhere.
The seriousness of these issues cannot be overstated. Researchers must understand that any feature that is reasonably decisive or stable across time and contexts and for which the corresponding data attributes are sufficiently numerous and fine-grained may be used to isolate an entity with high probability (e.g., demographics, consumption preferences, social connections, locations, voice, walking, typing, vocabulary, circadian rhythm, search histories, transportation choices, web browsing). That is, seemingly disparate, ostensibly anonymized data sets may be linked to heterogeneous information networks that permit semantic queries and enable inference and re-identification (Bizer, Heath, & Berners-Lee, 2009; Garfinkel, 2015; Han, Sun, Yan, & Yu, 2012). In short, the probability of establishing personal identity only increases with more available data. Of course, those consequences may be unfathomable or unintended when the data are collected, which aggravates the privacy concern.
By consequence, Big Data substantially redefine the premise of informed consent and participation. Ethical research generally warrants that human subjects have to consent to be included, particularly when affected by an experiment or intervention that involves some risk. However, about 700,000 people were unaware when their social network provider, Facebook, placed positive or negative posts and images in their news feeds to gauge whether this information would affect emotions (Kramer, Guillory, & Hancock, 2014). On the same note, much academic research uses data from social networks or intranets without user consent. Although such data may be public or within a corporation’s legal boundaries, the users may not consider themselves to be subjects in a research study (boyd & Marwick, 2011; Zwitter, 2014). Likewise, increasing amounts of employee monitoring (Moussa, 2015), alongside legislations that grant some governments copious data access, may spur people’s suspicions regarding Big Data schemes and incline them to resist any nonessential data collection. After all, Big Data and sophisticated algorithms may generate insights that can be far more revealing than simply giving names and addresses. For instance, a work phone and as such its geospatial and communication data are often owned by the employer: These data may be put to good use (e.g., autosuggest meetings based on proximity), but they may also enable inferences about workers’ health (e.g., repeat visits at a hospital), when they are (and are not) working, or what they do after hours.
Equally, since OMS deals with individuals and institutions, it is worth noting that organizations may increasingly claim a right to privacy for business purposes or to protect their members and stakeholders (Pollman, 2014). Something as harmless as social network analysis on a pool of professionals may generate insights into some firm’s commercial and political activity or be used to identify key individuals (i.e., informal leaders) for breaking a labor strike. Under these issues, OMS faces several risks, not to mention many important and unanswered questions, regarding the changing paradigm of privacy, security, and ethical conduct (see Data & Society Research Institute, 2014; Lane, Stodden, Bender, & Nissenbaum, 2014). Employing Big Data while continuing to use established guidelines will eventually produce some breach of security or privacy that can negatively backfire on OMS as a field and hinder its future prospects. Yet, institutional review boards are not, at present, likely aware of the full spectrum of privacy risks, nor are they sufficiently adept at assessing and advising Big Data research. As such, they may greenlight questionable research, or alternatively, they may mitigate risk by incapacitating Big Data collection and analysis in a blanket fashion and thereby stifle great research potential (Zwitter, 2014). Further layers of complexity arise when considering the various jurisdictions and their different legal rules and interpretations about data ownership and consent as they apply to the investigators and those researched.
To promote privacy-friendly Big Data practice, we summarize some topical thinking and propose eight guiding principles that supplement more established administrative, physical, and technical safeguards (Altman, Wood, O’Brien, Vadhan, & Gasser, 2015; Dwork & Roth, 2014; Greenwood et al., 2014; Hewson et al., 2013; Information Commissioner’s Office, 2012; Lane et al., 2014; Richards & King, 2014; Stopczynski, Pietri, Pentland, Lazer, & Lehmann, 2014; WEF, 2011).
First, privacy does not mean all data have to stay private. It means there are clear legal, statuary, and social rules that govern data owners’ control about how and by whom their data may be collected, used, and disclosed.
Second, there may be exclusive or shared Big Data ownership. Ownership may be assigned to the entity described by the data (e.g., an employee), the entity that captured these data (e.g., the employer), or the multiple entities that created the data (e.g., employees’ interactions).
Third, data require transparency and control. Data owners must be given the opportunity to comprehend the deductions and predictions their data might enable and become fully aware of and exercise control over who can access, use, aggregate, edit, and share their data.
Fourth, mechanisms of informed consent are desirable yet not always achievable. Data owners must understand this when they opt in a data collection as well as be able to opt out and dispose of their data. It is arguably thus more meaningful to consider regulations on data use than on data collection.
Fifth, different types of data carry distinct levels of sensitivity and risks that can be delineated as such: (a) volunteered data, which are created and explicitly shared by an entity (e.g., social network status); (b) observed data, which are unobtrusively captured by recording the actions of an entity (e.g., location data via cell phones); and (c) inferred data, which are generated through analyzing volunteered or observed information (e.g., personality profiles).
Sixth, data that are shared can remain partially private. The binary conception of privacy can be circumvented by multimodal, interconnected Big Data records, which can take on intermediate states along a continuum of privateness and sharedness. For instance, one data object (e.g., email content) may remain confidential while another data object (e.g., email metadata) may be disclosed.
Seventh, raw data may be obfuscated in the following ways: removing variables, removing records, recoding variables into less specific values (e.g., actual age and postcode into coarser classes with range values), randomly perturbing values (e.g., replace time stamp within 14 days of the true date), suppressing rare value combinations as missing, replacing observed values with the mean of a small group of units, swapping values of variables across pairs of records, and adding random noise that leaves the mean of the distribution unchanged, among others.
Eight, computational means can decrease privacy risks. In addition to storing data on secure systems and limiting access, investigators can utilize a system in the middle that separates data from query (e.g., independent computational environments for physiological raw data, identifiable participant information, and analyses). Techniques can also: watermark a data set so it becomes traceable, set expiration dates beyond which some or all data become inoperative, process data on the generating device to transmit aggregate results only, and homomorphic encrypt the raw data while allowing the performance of some operations.
Ultimately, we want to highlight that OMS cannot rely solely on past principles when using Big Data. Arguably, sharing one’s private data for scholarly OMS may represent a relatively trustworthy option when compared to corporate and governmental Big Data schemes. Scholars have little to gain from abusing data but a lot to lose (e.g., their career; Fitzgerald et al., 2007), and so OMS has the distinct opportunity to model what constitutes good Big Data privacy practice.
Risk of Capability Lack
On the broadest level, successful Big Data research requires: domain, data, analytical, and project management expertise (Williford & Henry, 2012). This is particularly true when the variety and unstructured nature of data modalities increase. Some of the knowledge and skills needed to theorize, design, capture, store, link, clean, transform, analyze, visualize, interpret, and communicate some types of Big Data may be considered atypical in the OMS community, save for a few polymaths who possess all these skills. The means that are considered the bare minimum for Big Data analyses in other disciplines (e.g., Bayesian methods; R) appear to have gained little traction in the OMS community. Meanwhile, few publications suggest the use of high-dimensionality reduction, coding, machine learning, or complex data visualization (Culpepper & Aguinis, 2011; Kruschke, Aguinis, & Joo, 2012; Zyphur, Oswald, & Rupp, 2014). To compound matters, our examination of a random sample of OMS-related PhD program curricula suggests scarce coverage of Big Data topics, arguably to the detriment of those junior scholars whom OMS develops.
To realize the benefits of Big Data for OMS, scholars need to develop and/or seek certain capabilities through cooperation. However, many of the educational and career-related structures of the OMS community are poorly conducive to what is needed to upskill and collaborate in ways that experiment with and establish a new scientific paradigm (De Rond, 2005; A. N. Miller, Taylor, & Bedeian, 2011). Thus, researchers interested in Big Data will likely need to initiate collaborations that not only transcend the usual disciplinary boundaries (e.g., computational sciences, physics, media studies) but also exceed the typical size and configuration of research teams (i.e., >1.8 authors per OMS paper; Acedo, Barroso, Casanueva, & Galán, 2006; Phelan, Ferreira, & Salvador, 2002; Wuchty, Jones, & Uzzi, 2007). This may align with neither idiosyncratic conventions of author sequence nor pressures to publish in predefined, discipline-valued journals (Judge, Cable, Colbert, & Rynes, 2007), both of which drive promotion for many academics. Researchers interested in Big Data may be further hampered by the available resources for professional development (e.g., time and funds to develop new skills post-PhD) as well as the conventions of job requirements and hiring practices (e.g., computational-oriented scholars and technical staff in management departments). In sum, the current state of available competencies, alongside the potential drawbacks to realizing them, might make Big Data an unattractive proposition for OMS.
To ameliorate this issue, we propose a range of countermeasures that rest on principles of learning and collaboration. First, individual scholars should engage in self-directed learning to develop their Big Data craftsmanship. Some foundational and advanced pedagogical resources and best practices are available through an increasing array of massive open online courses and vendors (e.g., Coursera, edX, MITx, Udacity). These courses address problem solutions (e.g., text mining, visualization), programming (e.g., R, Python, Java), and database skills (e.g., SQL, NoSQL). Also, they are often domain-agnostic, taught with a practical orientation by renowned experts, and accessible at little or no monetary cost.
As such, we further suggest that researchers expand their reading lists and conference schedules to identify functional approaches. Inspiration can be found throughout the disciplines (e.g., statistics, economics, computer science) and their associated domains (e.g., machine learning, visualization, database management). Some of this literature originates in the various events and outlets of organizations like the Institute of Electrical and Electronics Engineers (IEEE) and the Association for Computing Machinery (ACM).
Second, we call on the various leading consortia tasked with advancing research methods (e.g., CARMA, ICPSR, ECPR, ACSPRI), the professional associations (e.g., AOM, SIOP, APA, EAWOP), and the business schools and industrial-organizational psychology programs to become more deliberate and systematic about a Big Data training agenda for the current and next generation of OMS scholars (Aiken, West, & Millsap, 2008; Putka & Oswald, 2015). The leaders of these institutions should initiate working groups to expedite professional development, facilitate the sharing of resources and methods in reusable formats, promote privacy codes of conduct, and invite experts from other fields to hold keynotes and workshops at our established conferences. We further contend that such developmental experiences shall not manifest as optional add-ons that are primarily chosen by the technically “gifted.” Instead, OMS will benefit immensely by cultivating an integral literacy rooted in organizational, statistical, and computational substance.
Third, collaborations are becoming both increasingly important and difficult. The literature that underpins the present article clearly shows that innovative applications of the technical Big Data paradigm to nontechnical phenomena correlate with multiple authorship. Indeed, innovation arises “when scholars in one area take the time to become familiar with research conducted in another area and then incorporate key ideas from outside their disciplines” (Kirkman, Gibson, & Kim, 2012, p. 811). In doing so, scholars may realize that research problems can be quite similar from a data perspective even if they appear disparate on substantive grounds. OMS must embrace the technological and analytical expertise present in computational sciences, physics, astronomy, and biology as well as commercial and governmental entities. Because of the significant human element in Big Data research, researchers should draw on the useful literature on team building and team learning to coordinate complementary skill sets, heterogeneous mental models, and communication (e.g., Day, Gronn, & Salas, 2004; Edmondson, Bohmer, & Pisano, 2001; London & Sessa, 2007).
Fourth, OMS should borrow or buy external expertise. For instance, researchers could turn to Internet freelancing marketplaces (e.g., upwork.com, freelancer.com, elance.com; Aguinis & Lawal, 2013) and contract with individuals who can provide missing capabilities, such as programming or visualization. Researchers may also crowdsource capability and creativity by means of a competition, whereby Big Data and problem description define an open challenge (Franzoni & Sauermann, 2014). Such competitions may incentivize participants through money and/or reputational gain, appear on online platforms that attract global attention and extensive analytical talent (e.g., Kaggle), and focus on particular communities (e.g., PhD students, journal readership) (Goldbloom, 2010). Such approaches may have little history in OMS and may not always be compatible with privacy considerations; however, they have been successfully used to improve recommendation systems (Bennett & Lanning, 2007), explore massive mobile phone data (Laurila et al., 2013), and improve on scholarly efforts to model HIV drug reactions (Carpenter, 2011).
Fifth, our wishes for the next decade include an OMS community that assimilates and advances the epistemological and methodological means on Big Data. As an applied field, OMS has often borrowed from other domains yet also invested in the ongoing development of certain approaches (e.g., structural equation modeling). We encourage researchers to translate approaches from others disciplines to the language and mental models of the wider OMS audience including how-to articles on modular and reusable processes and tools, critical tests about the robustness and accuracy of methods and assumptions, systematic comparisons with more traditional approaches, best practice documentation, and so on.
Velocity
Velocity describes the speed at which data under investigation accumulate; it is a function of the rate by which a phenomenon is quantified or sampled into a digital object and then transmitted and retrieved. Reality may be converted into data in real time, sources may emit an incessant flow of data, and data streams can be constant or variable with daily, seasonal, and event-triggered peak loads (Troester, 2012). In investigations or applications where time is limited, data latency (i.e., the lag between data generation and its availability for processing) can be critical. In short, much Big Data arise from continuous recording, and the rate of data flow affects the means by which data need to be handled and analyzed.
Opportunity for Time-Series and Causal Analysis
Most organizational, group, and individual phenomena are temporal in nature, perhaps even comprising nonrecursive relations (Ancona, Goodman, Lawrence, & Tushman, 2001). Ongoing observations of discrete events with temporal ordering can further our understanding of what happens, when it happens, how it happens, and potentially why it happens (Roe, 2008). Yet, the corresponding research into topics such as self-regulation, leader emergence, group dynamics, pay, and so forth is often constrained by limited available observations (e.g., cross-sectional, two time points), which provide an inaccurate abstraction of reality (Mitchell, James, & James, 2011).
The Big Data era affords data sources that can sample parameters without end and at unprecedented rates, resulting in longer time-series with reduced intervals between signals. This in turn facilitates more nuanced examinations of direction, magnitude, frequency, speed, and points of change associated with a particular phenomenon, such as when modeling nonlinear trajectories (Collins, Gibson, Quigley, & Parker, 2015). Time-series decomposition approaches can further split complicated (and sometimes arbitrary-seeming) time-series data into components, each representing one of a latent pattern’s underlying categories, such as trends, seasons, cycles, lags, phases, rhythms, and trigger events in organizational life (Huang et al., 1998; West, 1997). This generates a greater number of definite functions that can be described mathematically and visually and so be used to explore or test episodic structures.
Time-series can also support causal claims, which require that x precedes y temporally. Much of the data underlying OMS to date are static or their resolution is too low to establish if x is a cause of y (e.g., supervisor mood → subordinate mood) or vice versa (e.g., subordinate mood → supervisor mood); instead, the respective inferences largely rely on conceptual reasoning. While many temporally ordered observations do not inherently demonstrate causality and require further conditions (i.e., a reliable association between x and y not driven by z; Kenny, 1979), they provide an incomparably stronger empirical basis for testing whether (a) certain values of time-series x reliably precede certain values of time-series y and (b) the reverse is not supported (Granger causality; Kalimeri, Lepri, Kim, Pianesi, & Pentland, 2012).
More generally, the analyses of time-dependent co-occurrence may use full-information or decomposed time-series data, depending on the conceptual lens. Thus, they may draw on the respective raw data or computed composite values that describe some time-series feature or pattern. The analyses of time-series interdependencies must consider time t as a new dimension (N × p × t) and hence may use autocorrelation, which describes the correlation of a signal with itself across a number of time points in a given series. Vector autoregression can estimate the linear interdependencies among multiple time-series by expressing each variable as a linear function of its own past values and the past values of all other variables. For instance, workers’ negative mood at work might predict higher subsequent team conflict, whereas less prior team conflict might predict more subsequent positive individual mood. In such an autoregression, variance decomposition may subsequently be used to estimate the contribution of a given variable to the other variables (Hamilton, 1994).
In general, Big time-series Data may be considered similar to other Big (static) Data, though the temporal dimension amplifies some opportunities that we would like to briefly highlight. Time-series clustering approaches, for instance, may be used to organize temporal data into homogeneous groups with maximized within-group similarity and between-group dissimilarity (e.g., identifying work teams with similar behavioral patterns or trajectories). High-dimensional or sparse time-series data may be made useful by compressing it using both intrasignal and intersignal correlations. Time-series data may be used for multilevel modeling, whereby concepts at different levels of abstraction temporally predicate concepts at other levels (e.g., individual-level emergent states → team-level outcomes). The analysis of temporally ordered, high-resolution signals may be used to truly understand reciprocal causation or feedback loops (e.g., supervisor mood → subordinate mood → supervisor mood, and so on). Time-series data may also facilitate discovery approaches for establishing precedence structures. For instance, association rule learning may identify regular sequences of events or threshold values in a time-series that precede other time-series features, such as {negative mood in email} {negative mood in email response} → {conflict} or {different department membership} {regular break times together} → {innovation} (Mueen, 2014).
Given these possibilities, we encourage researchers to sample the mundane and special events at frequencies that permit new analytical resolution and more robust inferences. Temporal observations from sensors and systems provide OMS with opportunities for “experience sampling on steroids.” The stats package in the R base configuration offers several useful functions for time-series analyses, including decomposition. More specific packages are available for visualizing sequence data (TraMineR), analyzing seasonality (bfast), and conducting nonlinear autoregression (tsDyn).
Risk of Computational Restraints
Despite unprecedented technological progress in many fields, more data are continuously being produced than can be stored, and more data are being stored than can be processed (Jagadish et al., 2014). The hardware and software necessary to handle transmission, storage, and processing are determined by the data: specifically, the number of cases (N), number and nature of associated parameters (p), and the frequency by which they are sampled per unit of time (t). And it is time that creates the computational challenge: how quickly one expects an operation to complete or how often or long a signal shall be recorded. For instance, more than 4 million items are shared on Facebook each minute (Domo, 2016; Internetlivestats, 2016), each of them containing text, graphics, and/or video, alongside metadata that log the various interactions with each item. However, whether the signals are to be captured for a few seconds or several months depends on the research problem. For example, analyzing the metadata of organizational emails will require significantly less computational capacity than analyzing the respective content. Accordingly, Big Data may require technologically intense infrastructures that contemporary OMS is not equipped for.
If it is not feasible or sensible to store or process all possible data, then some of the following approaches may be useful. First, and in line with principles of purposeful sampling, it may be sufficient to capture N < all and/or p < all. Moreover, unless real-time detection is acute (e.g., breach of cooperation; Shanabrook, Cooper, Woolf, & Arroyo, 2010), scholarly research may not need to analyze Big Data continuously or immediately. Instead, a Big Data snapshot of some length, which can be retrieved post hoc in more efficient manner, can suffice. Also, the algorithms underlying sensors may be configured so that data are only transmitted under certain conditions (e.g., deviation from baseline, detection of an exceptional event). Afterward, retrieved data may be processed into new data products that can then be more easily stored and analyzed (e.g., compressed to lower resolution, aggregated to a higher level of abstraction; Jacobsen, Levchuk, Weston, & Roberts, 2014; Loukides, 2010). Instead of bringing the Big Data to the investigator’s computational machine, some or all of the analytical code may be pushed to where the data are stored. For instance, algorithms may be executed on remote servers (e.g., distributed processing frameworks such as Hadoop) or made a part of the data source (e.g., a research app analyzing data on a participant’s mobile device).
The computational requirements range from low-cost legacy hardware and standard tools to high-cost super-computing and platforms that outstrip conventional OMS infrastructure and involve high entry costs (Jacobs, 2009; Singh & Reddy, 2014; Witte et al., 2013). Academics seeking more potent computational capacity may be able to access their institutional colleagues’ existing infrastructure(s) in disciplines such as information technology, physics, biology, astronomy, and others already dealing with Big Data for prolonged periods. Furthermore, it is not always necessary to own the infrastructure; it can be more economical to rent servers, support, and tools for the time they are needed. Such solutions often afford an elastic approach, whereby the infrastructure and pricing models dynamically grow with the requirements—for instance, ensuring reliable app-server communication when the number of study participants grows by some magnitudes (e.g., Amazon Elastic Compute Cloud).
In sum, the computational requirements will always grow alongside the opportunities to generate Big Data, which may cause a Big Data opportunity to expand beyond its usefulness. However, the scale of this issue depends largely on what researchers want to do. Computational requirements are essentially a function of the research problem, its operationalization, and mitigating mechanisms, which will vary in their ease of implementation.
Opportunity to Make Research More Practical
The real value of a model is its predictive validity: “What is going to happen next?” Research shows that organizational adoption of data-driven decision making significantly and positively influences firm performance (Brynjolfsson, Hitt, & Kim, 2011). In particular, data that are connected over time lend themselves to craft and test algorithms (i.e., recipe, rubric) that can predict a high outcome score relating to some future behavior or value (Provost & Fawcett, 2013). For instance, tweets may be used to infer public sentiments (Asur & Huberman, 2010) or the changes that will occur in the stock market (Bollen, Mao, & Zeng, 2011), both of which may be used to predict employee mood. Granted, models that identify and integrate influential entities, variables, and processes to predict some event or outcome are not new. Yet, the availability of constant data offers unprecedented opportunities for even sharper predictions, especially for practical OMS.
A key goal of OMS is improving organizational practice. The extent and causes by which this is (or is not) achieved comprise long-standing debates (Rynes, Bartunek, & Daft, 2001).
Much criticism is framed as either a problem of knowledge transfer (i.e., dissemination, communication), distinct forms of knowing (i.e., research and practice produce different kinds of knowledge), or a gap in applied knowledge production (i.e., how scholars define their purpose and relationship with the communities) (Van De Ven & Johnson, 2006). We do not seek to position the Big Data paradigm as the cure-all for the research-practice gap; rather, we contend that it can help build more bridges if understood as a problem-based methodology that aligns well with the challenges of practice.
A simplified illustration: When addressing a phenomenon, such as employee turnover, as an outcome, traditional OMS would theorize a model of antecedents, operationalize them as latent constructs, collect most data once through questionnaires, examine model fit, discuss findings, and speculate about the unexplained variance. An approach informed by the Big Data paradigm may start out with the same underlying theory but then operationalize antecedents on the basis of pervasive data and examine model fit. Additionally, investigators may engage supplementary means to uncover additional data that could be used to modify the model beyond previous conceptions and maximize the explained variance. The benefit of this approach is its acknowledgment of an open system where the used data are created in and for the “real” world. Conceivably, organizations may start to use models from scholarly OMS to monitor their modus operandi and drive decisions, thereby turning prediction into action. These predictive approaches have gained traction in several domains (Meisel & Mattfeld, 2010), such as in the medical arena where at-risk patients can be identified in real time (AHRQ, 2014; Makam, Nguyen, Moore, Ma, & Amarasingham, 2013). In a related vein, engaged OMS could draw on employee behaviors (e.g., office arrivals, keystroke metrics, lunch-break patterns, overtime behavior, Internet surfing) and staff connectivity (e.g., internal and external networks and opportunities) to predict absenteeism, attendance, and turnover (Hausknecht & Li, 2015; Tunçalp, 2015).
To alleviate the OMS research-practice divide and help the field become more relevant outside of academia, we encourage practitioners and researchers to utilize and share the same Big Data objects that impact both worlds. At the same time, we must forewarn that even good models cannot perfectly predict the future as the real world changes in unanticipated ways. However, investigators may enhance accuracy, generalization, and theory by drawing on ever-more continuous data (Raeder, Stitelman, Dalessandro, Perlich, & Provost, 2012).
Utility Illustrations
Next, we briefly illustrate the utility of the Big Data paradigm for OMS by converging some of our central points on, by example, challenges inherent in personnel research and practice. For instance, research has established the substantial predictive validity of personality profiles toward work performance, success in specific occupations, and more (Barrick, Mount, & Judge, 2001). Accordingly, personality scores are highly useful in OMS as predictor or control variables and for selecting and managing personnel in applied purposes.
Considering data generation, the measurement of personality is dominated by rather long batteries of psychometric items (e.g., options for the International Personality Item Pool range from 60 to 300 items), which can lead to respondent fatigue, thereby limiting the collection of auxiliary data or biasing ratings toward socially desirable characteristics (e.g., disagree with “I tend to be lazy” to convey a positive impression). Other assessment procedures (e.g., interviews) can also carry bias (Oosterhof & Todorov, 2008) and high costs (e.g., interviewers’ time), which limits their scalability for large amounts of applicants or research participants.
Recent research has demonstrated how scores for personality constructs can be derived from in situ signals such as vocabulary choice (e.g., frequency of articles, auxiliary verbs, affective processes; Kern et al., 2013; Schwartz et al., 2013), facial appearance (e.g., pixel information–based variance of local face regions; Hu et al., 2017; Rojas, Masip, Todorov, & Vitria, 2011), meeting behaviors (e.g., conversational activity level measured by z-scored percentage of speaking time; Staiano, Lepri, Subramanian, Sebe, & Pianesi, 2011), and online profiles (e.g., size and density of egocentric networks, amount of accounts alongside frequency and length of posting, number of followers and following; Youyou, Kosinski, & Stillwell, 2015; Youyou, Stillwell, Schwartz, & Kosinski, 2017).
Standard technology allows scholars to automatically, consistently, and unobtrusively generate such data trough text fields and video (e.g., job application app). It is also possible to scrape such information from the web (e.g., rvest, Rfacebook; Landers, Brusso, Cavanaugh, & Collmus, 2016). Often, what follows is coined the data wrangling challenge: the conversion of the raw data into states suitable for meaningful manipulation, modeling, and visualization. Wrangling involves operations that, for instance, join, arrange, group, summarize, separate, delete, or pivot data points so each variable is a column, each observation is a row, and each type of observational unit is a table (“tidy data”; Wickham, 2014). Many fundamental data processing functions exist in R (Braun, Kuljanin, & DeShon, 2017), while more efficient code and easier syntax are provided by tidyr and dplyr or open-source tools such as OpenRefine.
Next, investigators can train an artificial neural network to associate the nonlinear raw data features (p) with informative personality values, labels, or classes via generated or existing ground truth data comprising both input and corresponding output variables (e.g., myPersonality, Kosinski, Matz, & Gosling, 2015; MAPTRAITS, Celiktutan, Eyben, Sariyanidi, Gunes, & Schuller, 2014). Subsequently, one may use this triangulation model to process any amount of new, unlabeled cases (N) to estimate their personality scores at low cost and with reduced social desirability distortions.
Further analyses may employ random forests to map those personality scores alongside other individual differences and match them against important organizational variables such as job performance or voluntary exit. After training the model with data relating to past and current employees, it can rank-order job applicants by their propensity to perform well or voluntarily leave an organization. Yet, its “black box” nature is typically not particularly informative about the underlying mechanisms. This can be problematic in practice when defining strategies to entice and manage talent, as managers have to ensure that no re-encoded bias or discrimination leads to adverse impact (Morris & Dunleavy, 2016) while perhaps being required to explain algorithmic decisions to applicants (e.g., European Union General Data Protection Regulation 2016/679). It also does not advance OMS in understanding what makes a good hire. To better understand complex dependencies, investigators may remove extraneous parameters and reveal ranked subsets of the most relevant predictors (e.g., mean decrease accuracy) or otherwise identify interactions, predictors with nonlinear effects, and those that cause multiple outcomes to covary (e.g., multivariate tree boosting; P. J. Miller, Lubke, McArtor, & Bergeman, 2016).
This abbreviated example illustrates how Big Data can be useful for improving some often uncertain and opaque organizational processes and outcomes (e.g., inform personnel selection and management) and potentially uncover conceptually what would not be achieved through more conventional approaches (e.g., hierarchical configuration of multiple moderators, representative latent class ontologies). Importantly, as personality profiles inferred from seemingly innocuous job applications or study participants can be used to manipulate people (Hirsh, Kang, & Bodenhausen, 2012), investigators are reminded of the ongoing privacy failures whereby described Big Data become a liability that needs to be actively managed.
Disciplinary Inertia and Ways Forward
The writer William Gibson once observed that the future is already here—it is just unevenly distributed. This is evident in the domain of Big Data, which has received significant attention in other scholarly disciplines, the commercial world, and the public but has thus far inspired little intellectual discourse or empirical progress in OMS. Arguably, OMS may risk a growing insignificance if it does not engage with Big Data, with opportunities dispersing to more engaged fields such as information technology, computational social sciences, marketing, the digital humanities, and ultimately the private sector. The influence of OMS may wane as it is marginalized and bypassed by those it seeks to serve: the work organizations and their stakeholders, who generate ever-more Big Data and shift to being primary producers of work-related research (Ones, Kaiser, Chamorro-Premuzic, & Svensson, 2017).
History clearly suggests that every civilization, industry, or organization must embrace the maximum level of technology to maintain a competitive advantage or simply avoid falling behind (Porter, 1990). Indeed, historical reviews of scientific revolutions argue that research communities continuously developed more specialized equipment to investigate ever-more specialized questions, and those who ignored the revolutionary paradigm were read and bred out of the profession (Kuhn, 1970). For instance, new instrumentation such as the telescope and microscope invited massive scholarly and social shifts by augmenting our view of reality and allowing us to identify previously overlooked features, which spurred more conclusive investigations (H. J. Miller, 2010).
As the adoption of new ideas and practices seldom occurs naturally (Ashkanasy, Becker, & Waldman, 2014; Val & Fuentes, 2003), we would like to provide some overarching considerations regarding the paramount function of academic publishing. As alluded to, the Big Data paradigm might break with some conventions relating to data generation, analysis, and interpretation. As a result, the act of reporting research that incorporates substantial conceptual, statistical, and computational components may become so complex and extensive that it creates spatial, format, and temporal limitations (Bruns, 2013). On the one hand, OMS has become a rigorous discipline, as evidenced by the comprehensive method sections demanded by many of its journals. On the other hand, the relatively recent and ongoing advances regarding Big Data may require a publication to cover a lot more technical and methodological ground—in addition to the already lengthy sections relating to theory and discussion.
For instance, the code used to create or process data may be so central that it can be thought of as part of the data itself and therefore must find some representation in the publication. Thus, a single article may need to explain the purpose, function, benefits, and drawbacks of the means employed for data generation (e.g., sensors), data transformation (e.g., dimensionality reduction), data analysis (e.g., machine learning), and data visualization (e.g., graph rendering). The current infrastructure does not appear adequately prepared to accommodate the tools, code, and output of Big Data.
This is especially problematic in OMS as the legacy of print journals means that the conventional article format is still the dominant avenue for disseminating findings. This hinders output that would benefit from more dynamic or even interactive features for a “greater understanding of the nature of the data set and of the analytical processes involved in examining it than is possible with a small number of static graphs in a conventional paper” (Bruns, 2013). Dynamic visualizations could draw on multiple dimensions (e.g., semantic networks), temporal relationships (e.g., complex change), and spatial activity (e.g., entity mobility). Indeed, print-based structures cannot draw on live observations to produce findings that are most relevant within a limited time period, such as informing current issues, events, or crises (Antenucci et al., 2013; Moat et al., 2013). At present, even ideal cases of publishing OMS in journals will take several months—too long and too removed for certain research to inform contemporary, temporal phenomena (e.g., Fox, 2006).
On a different point, journals increasingly adopt data transparency polices that mandate original data (e.g., no overlapping variables) and data sharing—well-intended but thorny propositions. Big Data increase the propensity of overlapping variables, which could preclude multipurpose usage of precious data. And the moment Big Data are shared with, for instance, publishers and editorial boards, liabilities with severe implications arise for those in control, such as when genetic-behavioral information relate not to mice but to human workers.
Correspondingly, editors and reviewers in the OMS domain may not have the expertise and resources to authoritatively assess Big Data publications (Bruns, 2013). Certain algorithms, tools, data sets, and statistical principles may not align with typical disciplinary backgrounds. Naturally, emerging fields and practices have few accepted standards; the ensuing freedom that researchers find is matched by the challenge that reviewers face in assuring scholarly rigor. On this point, there is a danger that with fewer critics available to properly assess a study, authors may use esoteric language (e.g., math, code) as a way to trick reviewers into perceiving their findings as accurate and truthful (Dumbill, 2012).
Altogether, OMS can rob itself of future opportunities and its own relevance through entrenched strictures. To address those risks, we argue that OMS must become proactive and apply imagination, creativity, ambition, and risk taking. Journals may commission Big Data studies from researchers with a related track record and instigate a range of special issues. There may be calls for submissions that apply Big Data to particular organizational phenomena, existing theoretical and empirical conflicts, and applied scenarios that await practical solutions. For instance, an issue could be dedicated to a particular research domain, walking the reader through a number of case studies that address: What can Big Data uncover that more conventional approaches do not? What measurement and analyses approaches can be used, and what are the challenges and solutions? What issues arise in relation to Big Data access, reporting, and privacy, and how are these dealt with? Additionally, journals may solicit contributions that focus on a particular methodological arena of the Big Data paradigm, such as discovery in data, novel analytical approaches, and privacy protection. We also see value in holding visualization challenges that invite graphical portrayals of substantive organizational phenomena as a function of Big Data (e.g., NSF VIZZIES, 2014).
We argue that the aforementioned will spur inventiveness, create fruitful discourse, showcase new potential, and illuminate possible avenues for further OMS. We also believe that editorial boards can use these opportunities to gain experience and experiment with contributions, formats, and policies that diverge from current conventions, attract new reviewers with Big Data expertise, update the necessary infrastructure, and appeal to a broader audience.
Other entities linked to scholarly OMS may be tasked with addressing disciplinary inertia. Universities ought to have a distinct interest in facilitating multidisciplinary research collaborations on Big Data, particularly if the existing capabilities are merely distributed across campus. We argue that those institutions that can empower their own scholars to cross-pollinate ideas and means have an advantage over those that need to bridge those silos more formally across institutions. For instance, to stimulate Big Data research, business schools may act as cross-faculty matchmaker, organizing industry-research grassroots partnerships, providing specific seed funding, adapting their recruiting strategies, and facilitating postgraduate summer camps—all of which can lead to more publications, improved reputations, and novel OMS.
Besides, OMS may have exhausted its relevant low-hanging fruits and should be prepared for future insights to cost more. The Big Data paradigm is already inspiring profound transformations in other research communities (e.g., biomedical, NIH, 2012; physics, NSF, 2014), which are boosted by large-scale support that enables improved infrastructure, collaboration, and training. OMS needs to explicitly seek and advocate for designated support and funding to rapidly facilitate Big Data literacy, partnership, and innovation. We encourage researchers to investigate innovative grant applications and industry partnerships that will provide resources.
Synthesis and Concluding Thoughts
The Big Data era is happening, bringing with it massive, multimodal, and temporal data. In this paper, we looked at Big Data as a nascent paradigm driven by various factors that characterize our modern world. We then analyzed the potential opportunities and risks arising for OMS based on the volume, variety, and velocity of Big Data. We also provided a range of ideas on how to leverage the opportunities while mitigating some of the risks.
We argue that Big Data represent an opportunity to expand the way OMS is conducted, interpreted, and communicated. The paradigm carries the promise of improving some predicaments in our traditional research zeitgeist, which at times can be too limited, inefficient, and even untrustworthy. Big Data are not only compatible with formal theory, causal inference, and traditional methodology, but they can reveal remarkable vistas about the means by which reality can be accessed and analyzed.
For all of its promise, Big Data also invite substantial uncertainties, risks, and challenges. As collateral, the tectonic changes relating to privacy and what is technologically possible cannot be entirely foreseen. The elusive and technical nature of this new era can bring bias and inertia, while some structural and institutional limitations can cripple the largest opportunities.
Our assessment shows that Big Data, as a paradigm, can be a double-edged sword, capable of significantly advancing our field but also causing backlash if utilized improperly. The field may find itself in a downward spiral in the wake of inadequate scholarly leadership, stagnant technological capability, and a perpetual myopia and structural inertia. At the same time, OMS has very strong theoretical and methodological foundations that have favorably affected organizations and people. Thus, we believe our field has a responsibility to apply these virtues to Big Data rather than simply leave this unclaimed potential to more technocentric yet less substantive disciplines. We conclude that the costs and risks are considerable but are outweighed by the opportunities to advance the field.
Many of the discussed prospects, challenges, and means are interrelated and unfold their power in combination—our article yields multiple directions for future work. Specifically, we encourage researchers to employ Big Data to extend current theory, resolve substantive debates, and provide new directions (Becker, Cropanzano, & Sanfey, 2011). These efforts may involve (a) innovative applications of the Big Data paradigm to understand and improve organizational phenomena and (b) the development of fundamental theories, methodologies, and technologies that make such Big Data approaches more viable.
Our last point is this: Matters of organizational behavior and management, which generally align with the “soft” sciences (Ferguson, 2015; Lilienfeld, 2011), affect billions of people—and yet the field has not given rise to universal laws similar to those that underpin the so-called “hard” sciences. The dilemma often faced is that OMS lacks the demarcation, unity, and legitimacy to demand the same degree of recognition, support, and influence that the “real” sciences (e.g., physics, biology) receive. We are not alone in believing such perceptions are flawed and that they negatively affect the advancement of organizational and management scholarship and practice (“A Different Agenda,” 2012; Fanelli, 2010; Hedges, 1987; “In Praise of Soft Science,” 2005). Indeed, dark matter, electrons, and the placebo effect cannot be directly measured, but their existence and properties are inferred through ever-more precise data and analyses. Good science simply transforms good theory into sound operationalizations and then makes robust inferences through meticulous observations and analyses. Thus, this is the time to think about properly wielding the Big Data sword to transform organizational research into organizational science. Think Big.
Footnotes
Acknowledgements
Special thanks go to Russel Funk at the Carlson School of Management, University of Minnesota; Darja Miscenko, Maastricht University; Fabiola Gerpott, Jacobs University Bremen; the two anonymous reviewers and ORM Associate Editor James M. LeBreton for their valuable comments on an earlier version of the paper. Additional thanks go to the UWA Business School for hosting the second author in his sabbatical during which the idea for the present article was conceived.
Declaration of Conflicting Interests
The author(s) declared no potential conflicts of interest with respect to the research, authorship, and/or publication of this article.
Funding
The author(s) received no financial support for the research, authorship, and/or publication of this article.