
Abstract
We provide a follow-up treatment of Nye and Sackett’s (2017) recently proposed dMod standardized effect-size measures for categorical-moderation analyses. We offer several refinements to Nye and Sackett’s effect-size equations that increase the precision of dMod estimates by accounting for asymmetries in predictor distributions, facilitate the interpretation of moderated effects by separately quantifying positive and negative differences in prediction, and permit the computation of nonparametric effect sizes. To aid in the implementation of our refinements to dMod, we provide software written in the R programming language that computes Nye and Sackett’s effect sizes with all of our refinements and that includes options for easily computing bootstrapped standard errors and bootstrapped confidence intervals.
Nye and Sackett (2017) recently derived a class of effect-size measures to quantify categorically moderated effects. These new dMod effect sizes summarize interactions in a consistent metric across studies, are easier to interpret than R2 values from regression models (see Nye & Sackett, 2017, for a discussion of the difficulties of using R2 as an effect size for interactions), and provide an intuitive way to detect categorical moderation without significance testing. We build on Nye and Sackett’s equations and introduce several refinements that increase dMod’s versatility and ease of interpretation.
We begin with a brief summary of Nye and Sackett’s (2017) methods as context for the present work, followed by a discussion of updates to dMod effect sizes. These updates include (a) adjustment factors to offset bias that results from violating distributional assumptions, (b) directional effect sizes to separately quantify negative and positive differences in prediction between two groups’ regression lines, and (c) nonparametric versions of the dMod equations for use with observed distributions of predictor scores. Our review of Nye and Sackett’s dMod equations is meant to provide minimally sufficient context for the presently proposed updates; we encourage readers to consult Nye and Sackett (2017) for detailed information about dMod.
Nye and Sackett’s (2017) dMod Effect-Size Measures
Nye and Sackett’s (2017) dMod effect-size measures facilitate the comparison of two regression models: one model regressing Y on X for each of two categorically different groups.
1
The interpretation of dMod effect sizes is similar to the interpretation of Cohen’s d, except that dMod summarizes differences between distributions of predicted scores rather than distributions of observed scores. A dMod effect size indicates the weighted average difference in prediction between a referent regression model (e.g., a model summarizing data from a majority or control group) and a focal regression model (e.g., a model summarizing data from a minority or experimental group), scaled in terms of the referent group’s criterion standard deviation (
Table 1 arrays all of the equations that will be discussed in this article, including Nye and Sackett’s (2017) formulations of the dMod equations (lightly modified to be in slope-intercept form). Nye and Sackett’s (2017) dMod_Signed effect-size measure (see Equation 1a) represents the weighted average net difference in prediction between two models across an operational range of predictor scores. A positive (negative) sign for dMod_Signed means that focal-group criterion scores predicted from the focal-group regression model are, on average, lower (higher) than focal-group criterion scores predicted from the referent-group regression model.
Compendium of Parametric and Nonparametric dMod Formulas.

Note: X represents values within the range of observed focal-group predictor scores; X is bounded by the minimum and maximum possible scores in the focal group.
Eq. No. is the formula’s equation number for in-text reference.
f2 is the normal-density function for the focal group’s unrestricted predictor scores.
The subscripts of the integrals for
When subgroup regression lines cross within an operational range of predictor scores and one computes dMod_Signed, positive and negative differences in prediction will cancel out because the signed effect size summarizes the net difference in predicted criterion scores. For example, if two groups’ regression lines cross at the focal group’s mean predictor score when the predictor is normally distributed, positive and negative differences would completely cancel out and dMod_Signed would be zero. In settings such as this, dMod_Signed would fail to suggest the existence of a moderated effect. To overcome this, Nye and Sackett (2017) created an unsigned effect size, dMod_Unsigned, that quantifies differences between subgroup regression lines without allowing signed differences to cancel out (see Equation 2a). As an unsigned index of an effect, dMod_Unsigned is useful when one wishes to quantify the overall magnitude of a moderated effect and the net direction of predicted differences between groups is not relevant to one’s research question.
Nye and Sackett (2017) offered two supplementary effect sizes that facilitate the interpretation of dMod_Signed and dMod_Unsigned. The dMin (see Equation 3) and dMax (see Equation 4) effect sizes indicate the smallest and largest absolute-value differences, respectively, between groups’ regression lines. By computing dMin and dMax, one can easily communicate the range of differences that were used to compute dMod_Signed and dMod_Unsigned and identify whether subgroup regression lines cross within the operational range of predictor scores (an occurrence signaled by a dMin equal to zero that is paired with a nonzero dMax).
We refer readers to Nye and Sackett (2017) for more information about dMod_Signed, dMod_Unsigned, dMin, and dMax. The remainder of this article will describe our refinements to dMod.
Refinements to Nye and Sackett’s (2017) dMod Effect-Size Measures
Our suggested refinements include (a) adjustments to dMod to reduce bias from modest violations of distributional assumptions, (b) special cases of dMod_Signed that quantify directional differences in predicted criterion scores, and (c) nonparametric methods for computing dMod effect sizes. We introduce each of these refinements in the sections that follow.
Modifications to Reduce Bias From Modest Violations of Normality
A subtlety of the dMod effect-size measures that makes them particularly well-suited for use in operational settings is that one can integrate differences in prediction within a finite range of scores (i.e., one need not integrate the infinite normal distribution if one is studying predictor scores that span a bounded operational range). However, when dMod requires integration involving a finite minimum value and/or a finite maximum value, the cumulative density within that range may fall short of unity by a nontrivial amount due to departures from normality. A cumulative density smaller than 1 indicates that the dMod effect size one has computed may differ from what one would have obtained if one’s operational distribution of scores were indeed normally distributed. We propose a simple adjustment to dMod_Signed and dMod_Unsigned to offset this bias; we describe an even more effective adjustment later in the article, but the logic of the initial refinement described below is necessary to lay the groundwork for the more advanced method.
Integrating over a finite distribution can result in a biased dMod effect size unless one rescales the effect size by the sum of the weights generated by the normal-density function (i.e., the cumulative density). The problem of integrating over a finite distribution of scores is analogous to algebraically computing a weighted average (i.e.,
When integrating a dMod function over a finite range of predictor scores, an option for addressing a cumulative density smaller than one is to simply divide the dMod effect size by the cumulative density of scores within the operational range. For example, if the operational range of scores includes 95% of the theoretical normal distribution, dividing the dMod effect size by .95 will rescale the weights to account for the fact that scores outside of the operational range are impossible to achieve and that 95% of the theoretical distribution represents 100% of the distribution of possible scores. An adjustment factor that implements this correction is incorporated in Equations 1b and 2b and we recommend using these updated equations over Equations 1a and 2a. The gains in precision from using our corrections are likely to be small in most settings, but the corrections will consistently attenuate the bias from minor violations of normality. Unless otherwise noted, all subsequent mentions of dMod_Signed and dMod_Unsigned in this article will refer to Equations 1b and 2b, respectively.
In formulating our updated version of dMod_Unsigned in Equation 2b, we have further reduced bias by modifying the way in which the sign is removed from differences in prediction. Although Nye and Sackett’s dMod_Unsigned formula (Equation 2a) accomplishes the advertised goal of removing the sign from differences in prediction, it does so in a way that slightly alters the meaning of the resulting dMod_Unsigned effect size relative to the meaning of the dMod_Signed effect size (Equation 1a). Under the radical in Equation 2a, one only squares the differences between regression lines and does not square the density weights. Due to the fact that only the differences between regression predictions are squared (rather than squaring the products of the differences and densities), the square root of the product under the radical does not result in an absolute difference like one might expect. Over the range of predictor scores, taking the square root of the unsquared densities in Equation 2a alters the proportional weight given to each predictor score: Scores toward the middle of the distribution receive too little weight and extreme scores receive too much weight. See Figure 1 for comparisons of the distributions of raw and square-root densities, as well as the corresponding distributions of proportional weights. As absolute differences are the intuitive metric for unsigned differences, dMod_Unsigned should be computed using Equation 2b rather than Equation 2a.
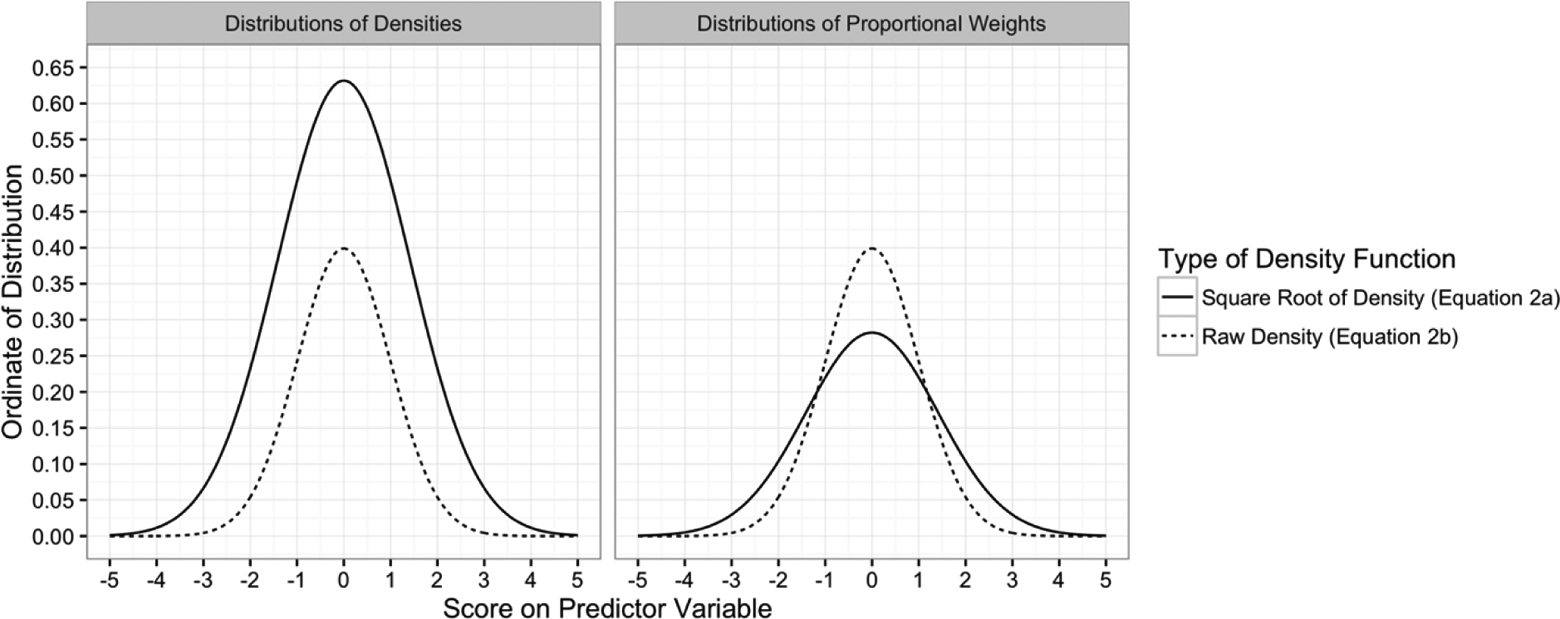
Comparisons of the distributions of densities and square roots of densities for the normal distributions used in Equations 2a and 2b, respectively. Distributions of proportional weights were computed by dividing the density associated with each predictor score by the corresponding cumulative density. Comparison of the figure panels reveals that taking the square roots of densities distorts the weight given to each predictor score, whereas using raw densities does not.
A limitation of Equations 1b and 2b is that they assume that violations of normality are symmetric, with similar effects on the low and high ends of a score distribution, but this not likely to be the case in all settings. We present methods that account for asymmetric violations of assumptions after first introducing our directional dMod effect sizes.
Separate Effect Sizes for Positive and Negative Differences in Predicted Criterion Scores
The dMod_Signed and dMod_Unsigned effect sizes are useful for quantifying effects that are moderated by a categorical variable. However, some categorically moderated effects occur in domains in which the regions of negative and positive differences in predicted criterion values have substantive importance. An example of this is predictive bias from the industrial and organizational psychology literature. Predictive bias occurs when assessment scores predict performance differently as a function of one’s protected-class status (e.g., one’s sex or race). For example, a biased test might predict lower performance for Black job applicants when the White (referent group) regression model is used to make predictions than when the Black (focal group) regression model is used. If predicted criterion scores are
The dMod_Signed and dMod_Unsigned effect sizes both combine directional differences in prediction into a single effect size, which can occasionally make it difficult to interpret the precise form of an interaction. Nye and Sackett (2017) suggested that dMod effect sizes could be computed over any meaningful range of predictor scores, which means that one could compute separate dMod effect sizes within any segments of a distribution that are of interest to one’s research question. In our use of dMod effect sizes to quantify predictive bias, we have found it informative to break dMod_Signed into two directional effect sizes. We propose an effect size called dMod_Under that only quantifies differences in prediction in the score range where negative differences in prediction occur (dMod_Under is the standardized average of differences in prediction for all
The dMod_Under and dMod_Over directional effect sizes are useful for isolating the magnitudes of negative (i.e.,
Based on our recommendations for rescaling dMod_Signed and dMod_Unsigned by the cumulative density of predictor scores, Equations 5 and 6 include adjustment factors that rescale the effect sizes by the ratio of the cumulative density from integrating the infinite normal distribution to the cumulative density from integrating over operational scores (i.e., the ratio of the sum of the theoretical weights to the sum of the actual weights). In general, the adjustment to the dMod_Under and dMod_Over effect sizes is more appropriate than making a global correction to the dMod_Signed and dMod_Unsigned effect sizes as we did in Equations 1b and 2b. This is because the separate corrections made to dMod_Under and dMod_Over capture the possibility that violations of normality are asymmetric and differentially impact regions where
We note that our corrections for nonunity cumulative densities do not perfectly correct for abnormalities in the distribution of actual predictor scores. However, they offer a relatively simple way to approximate the effect size of interest. If deviations from the assumed normal distribution are substantial, use of normal-density weights will result in effect sizes of questionable validity. When deviations from normality are great and one has access to the actual distribution of predictor scores, we recommend computing dMod using nonparametric equations.
Nonparametric Methods for Computing dMod Effect Sizes
The dMod equations discussed thus far have assumed that there is an underlying parametric function that describes the distribution of predictor scores. This assumption is not always reasonable and there may be settings in which researchers wish to use observed frequencies as weights when they compute dMod. To compute nonparametric versions of all of the effect-size measures described above, we recommend using Equations 9 through 14 in Table 1. These equations provide standardized weighted averages of the differences in predicted criterion scores between referent and focal models using frequencies of observed focal-group scores as weights. These equations are direct algebraic analogs of their parametric counterparts listed in Table 1; if the observed data are normally distributed, the results from corresponding parametric and nonparametric procedures should agree within a reasonable margin of error.
Our notation for the nonparametric formulas implies that one is using a frequency distribution as weights, but it is also possible to perform this procedure with raw data directly. If X is a vector of the focal group’s observed scores in which each entry represents a case, one can simply compute the average of
These nonparametric versions of dMod will be appropriate only if one can reasonably assume that the population to which one seeks to generalize will follow approximately the same distribution as the observed frequencies. If the sample used to derive the weights is atypical of the population of interest, these nonparametric equations will only be suitable for describing differences in prediction in the sample and will not be useful for making generalizations.
Empirical Examples
To illustrate the impact of our refinements, we analyzed a data set from the GATB validation project that substantially overlaps with the data set analyzed by Nye and Sackett (2017) in terms of the occupational groups represented. We computed unstandardized regression models for all of the occupational groups reported by Nye and Sackett that were represented in our version of the data set (see Nye & Sackett, 2017, for information on how these occupational groups were identified). Table 2 presents comparisons of the effect sizes computed using Nye and Sackett’s equations and using our revised equations. Some results with large proportional differences in Table 2 are associated with very small raw differences, but other differences (e.g., raw differences of .07 and .08 for dMod_Unsigned, associated with proportional differences of 24.14% and 18.18%, respectively) are of magnitudes that could impact interpretations of effect sizes and complicate comparisons of effect sizes across contexts. The majority of the differences from using the revised equations came from our use of absolute values in computing dMod_Unsigned, which illustrates that the differences between the weight distributions depicted in Figure 1 can have noticeable, practical impacts on effect-size estimates.
dMod Effect Sizes Computed for Selected Occupational Groups in the GATB Validation Database.

Note: Equations used to compute all tabled effect-size estimates are displayed in Table 1. The occupations listed in this table are those for which we could match the occupational groups analyzed by Nye and Sackett (2017) to cases in our version of the GATB data set. Sample sizes for millwrights and typists differ from the sample sizes reported by Nye and Sackett (2017) because we included all individuals in the data set whose Dictionary of Occupational Titles (DOT) codes matched with these occupations’ DOT codes. All effect sizes were computed using unstandardized regression models for congruence with how the effect sizes are computed in practice; thus, the effect sizes computed here using Nye and Sackett’s equations may differ from the effect sizes computed from standardized data reported by Nye and Sackett (2017). Raw difference = Nye and Sackett equation – revised equation. Percentage difference = (Nye and Sackett equation – revised equation) / revised equation × 100.
Discussion
In this article, we have outlined several refinements to Nye and Sackett’s (2017) dMod effect-size measures that we discovered during our use of these effect sizes. Our goal has been to update readers on methods for computing dMod effect sizes and to share the progress that has been made since the concept of dMod was first introduced.
As a supplement to this article, we have produced software to compute dMod effect sizes. Our software is written in the R programming language (R Core Team, 2017) and is part of the “psychmeta” R package (Dahlke & Wiernik, 2017). The general-purpose “compute_dmod” function computes parametric and nonparametric dMod effect sizes from a raw data set and can compute corresponding bootstrapped uncertainty statistics. We also offer functions for computing dMod from descriptive statistics and regression coefficients without raw data.
We have found dMod effect-size measures to be informative for interpreting moderated effects and we hope that our modifications to Nye and Sackett’s (2017) equations will encourage more researchers to use dMod. Our open-source software’s compatibility with all common operating systems will support the use of these effect-size measures in future research.
Footnotes
Acknowledgments
The authors would like to thank Christopher D. Nye for his helpful comments on an early version of this article.
Declaration of Conflicting Interests
The author(s) declared no potential conflicts of interest with respect to the research, authorship, and/or publication of this article.
Funding
The author(s) received no financial support for the research, authorship, and/or publication of this article.