
Abstract
While rating-scale-based assessments have been shown to be useful for measuring a variety of workplace-relevant constructs, assessment length and response distortion present practical limitations on their use. We describe a new type of measurement method termed rapid response measurement (RRM) in which stimuli are presented on a computer screen one at a time in rapid succession and respondents are asked to quickly provide a dichotomous response. Two personality assessments using RRM were developed and reliability and validity evidence across four independent samples were evaluated. Both RRM assessments showed adequate reliability, even at short test lengths, with acceptable levels of convergent and discriminant validity with traditional survey-based measures. Analyses based on a within-participants design indicated that the RRM was significantly more difficult to fake when instructed than was a survey-based measure of personality. The second RRM was related to several aspects of job performance. While initial results show promise, further research is needed to establish the validity and viability of the RRM for organizational and psychological measurement.
Likert-type rating scales and similar self-report measures have been ubiquitous for the measurement of workplace-relevant constructs for decades. Likert-type scales are commonly used for measuring attitudes, attributes, and traits clearly relevant to behaviors in the workplace. For instance, a wealth of research suggests that individuals vary on levels of stable personality traits (e.g., conscientiousness, agreeableness, etc.) that are related to important workplace outcomes such as job performance, teamwork, job satisfaction, and employee turnover (Barrick & Mount, 1991; Oswald & Hough, 2011; Tett & Christiansen, 2007). However, the utilization of Likert-type assessments in workplace settings presents practical challenges. Attempts to measure some constructs (such as personality) according to established theories often generate lengthy assessments (Oswald & Hough, 2011) that may prove boring, fatiguing, and demotivating for applicants and incumbents to complete (Ackerman & Kanfer, 2009; Ryan & Ployhart, 2000). Furthermore, applicants often engage in disingenuous behavior during the pre-hire selection process. Callahan (2004, p. 220) notes that resume fraud has “reached crisis proportions in recent years,” and self-report Likert-type survey personality assessments are easily and often manipulated by applicants who wish to present themselves as favorable to organizations (Birkeland, Manson, Kisamore, Brannick, & Smith, 2006; Oswald & Hough, 2011; Rosse, Stecher, Miller, & Levin, 1998; Sjöberg, 2015; Tett & Christiansen, 2007; Vecchione, Dentale, Alessandri, & Barbaranelli, 2014). Widespread faking of personality assessments has led some to question their usefulness in the employee selection context (e.g., Morgeson et al., 2007) and others to call for innovation in measurement methods to better mitigate faking effects (e.g., Barrick, Mount, & Judge, 2001).
To address the challenges of assessment length and faking with self-report Likert-type surveys such as personality assessment, we present a new method called rapid response measurement (RRM), which utilizes the rapid presentation of stimuli in a computer-based format. This article describes initial efforts to develop and validate two RRM-based assessments: a Big-Five personality assessment and an additional assessment assessing more narrow workplace-relevant constructs. We compare the Big Five RRM under honest and “fake-good” conditions to that of a traditional Likert-type personality measure and examine correlations between the other RRM and aspects of job performance.
Overview of Rapid Response Measurement Method
RRM is a new type of measurement method that differs from Likert-type survey measures and is a general methodology with potential applications to the measurement of multiple constructs. RRM presents individual stimuli to test takers on a computer screen, one at a time, in rapid succession. Respondents then indicate one of two responses to the stimulus by pressing one of two keys on the keyboard, at which point the next stimulus is immediately presented. In order to facilitate this process, respondents first undergo a training period in which they learn to associate responses to the keys on the keyboard. This article focuses on the use of RRM to measure personality. In the RRMs described here, the stimuli presented sequentially are personality adjectives and the possible responses are “like me,” which is associated with the i key on the keyboard, and “not like me,” which is associated with the e key. During the assessment period, the RRM captures (a) the stimulus administered (e.g., personality adjective), which is either positively or negatively keyed and associated with a given construct, (b) the nature of the response (e.g., “like me” or “not like me”), and (c) the response latency (speed) associated with the response. To this extent, the RRM serves as a high-speed adjective checklist with two primary differences; response latency is captured, and the demand characteristics of the assessment promote a rapid response style. The latter is achieved via instructions that indicate the respondent should make a response as quickly as possible, by the immediate presentation of the next adjective as soon as a response is given, and via an on-screen warning if responses take more than 2.5 seconds to provide a response.
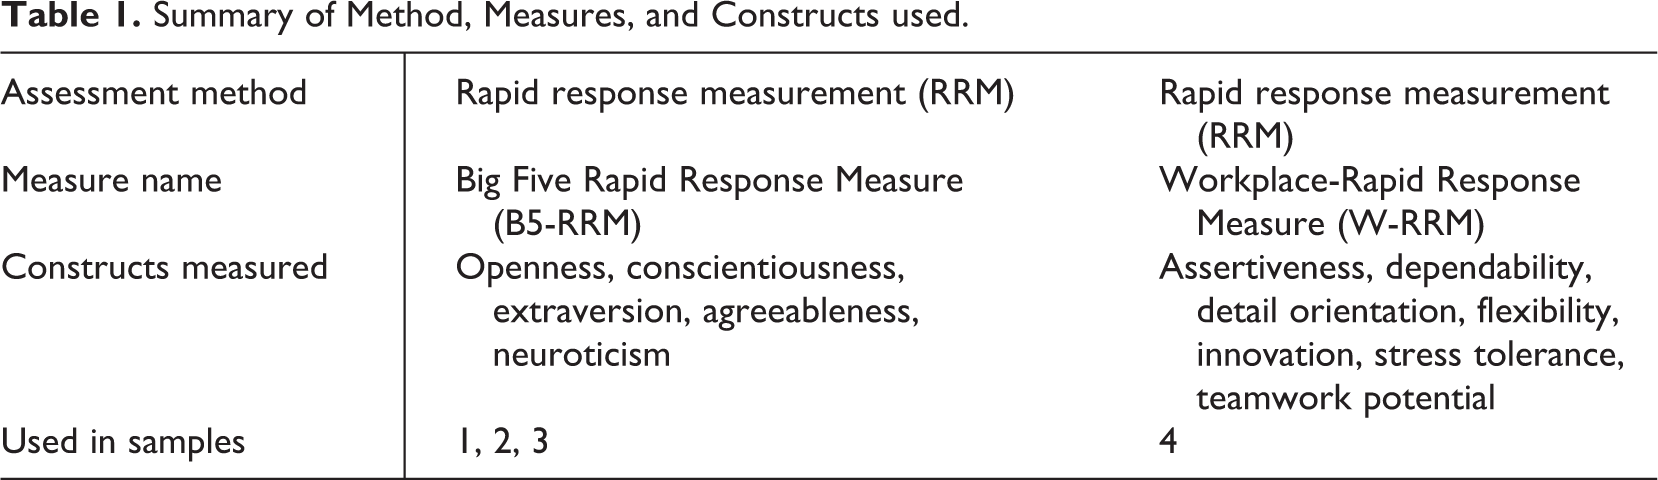
We describe the development and validation of a measure of Big Five personality factors that we call the Big Five Rapid Response Measure (B5-RRM). The B5-RRM is freely available for academic researchers and constitutes one of a potentially large number of applications of the more general RRM. In this study, we also present results for the Workplace Rapid Response Measure (W-RRM), which was developed to assess more specific workplace-relevant personality traits. Table 1 provides an overview of the assessments and constructs measured via RRM in the studies conducted.
Summary of Method, Measures, and Constructs used.
Challenges With Personality Measurement in Organizational Research
In recent decades, there has been a growing consensus around an accepted model of personality (Oswald & Hough, 2011; Tett & Christiansen, 2007) such that the Big Five (Norman, 1963) and Five Factor Model (FFM; Costa & McCrae, 1992; Digman, 1990) have become ubiquitous in modern research and practice (Barrick et al., 2001; Costa & McCrae, 1992; Oswald & Hough, 2011). While a full review of the development of the Big Five and FFM is beyond the scope of the present article, researchers eventually settled on the following factors: openness to experience (O), conscientiousness (C), extraversion (E), agreeableness (A), and emotional stability/neuroticism (N; Digman & Takemoto-Chock, 1981; Goldberg, 1990; Norman, 1963; Saucier & Goldberg, 1996; Tupes & Christal, 1992). While criticisms of the Big Five exist (see Block, 1995; Schneider, Hough, & Dunnette, 1996) and alternative factor structures have emerged (i.e., the HEXACO model; Ashton, Lee, & Goldberg, 2004), the Big Five has dominated personality measurement since the 1990s (Barrick et al., 2011; Oswald & Hough, 2011), largely utilizing Likert-scale self-report measures (e.g., the NEO-PI; Costa & McCrae, 1992; Goldberg, 1999; Goldberg et al., 2006; International Personality Item Pool, n.d.).
While consensus has built around the Big Five personality factors, practical hurdles continue to limit organizations’ ability to utilize personality assessment. One restriction regards test length, as “elaborate [personality] theories might specify more constructs than time allows for their appropriate measurement” (Oswald & Hough, 2011, p. 153). Indeed, Big Five–based assessments can contain up to 300 items and take 30 to 40 minutes to complete (Costa & McCrae, 1992; Goldberg et al., 2006). As long survey instruments can be boring and demotivating for respondents (Ackerman & Kanfer, 2009; Ryan & Ployhart, 2000) and selection procedures have an impact on applicants’ perceptions of hiring organizations (Ryan & Delany, 2010), there is a need for improved assessment efficiency without sacrificing reliability and validity. For this reason, several workplace-relevant assessments use subsets (i.e., specific facets) of the Big Five or custom measures that are shorter and only loosely based on the Big Five. The length and time required for completion makes personality a good candidate for assessment via the RRM.
A second practical challenge regards the widely discussed issue of applicant faking (see Ellingson, Sackett, & Hough, 1999; Ones, Viswesvaran, & Reiss, 1996; Rosse et al., 1998). While some have downplayed the impact faking has on test validity (Hogan, Barrett, & Hogan, 2007; Ones et al., 1996), others conclude that faking occurs rampantly (Birkeland et al., 2006; Oswald & Hough, 2011; Rosse et al., 1998; Sjöberg, 2015; Tett & Christiansen, 2007; Vecchione et al., 2014), threatens the validity of inferences organizations can make about personality assessments, weakens relationships between assessment scores and performance criteria, and can decrease the quality of hiring decisions (Komar, Brown, Komar, & Robie, 2008; Mueller-Hanson, Heggestad, & Thornton, 2003; Rosse et al., 1998). Describing the overreliance on traditional self-report questionnaires that are easily manipulated, Barrick et al. (2001) wrote, “The time to explore alternatives in earnest has come” (p. 26). In the years since Barrick et al.’s call, researchers have expanded inquiry to investigate forced-choice survey formats (Knapp, Heggestad, & Young, 2004; Stark, Drasgow, & Chernyshenko, 2008), conditional reasoning measures (Bing, LeBreton, Davison, Migetz, & James, 2007; James, 1998), third-party ratings of personality (Mount, Barrick, & Strauss, 1994; Oswald & Hough, 2011), and measures of implicit personality (Back, Schmukle, & Egloff, 2009; Vecchione et al., 2014). In this study, we examine the extent to which the RRM is susceptible to faking in comparison with a Likert-type personality assessment.
Comparisons With Other Approaches
The RRM shares characteristics with other approaches to assessment. In particular, the response format and the use of response latency is similar to the implicit association test (IAT). The IAT involves a paired comparison process in which a stimulus of interest is presented along with category labels. For instance, the words “me” and “others” are paired with items from a bipolar attribute (e.g., “shy” vs. “sociable”). IAT scores are computed as the difference in response time for correct responses when different categories are paired together (e.g., when the same key is hit for either “me” and “shy” vs a condition in which the same key is hit for “me” and “sociable”). There have been several IAT approaches to Big Five personality measurement (e.g., Back et al., 2009; Grumm & von Collani, 2007; Schmukle & Egloff, 2005; Steffens & König, 2006; Vecchione et al., 2014). Findings from these studies indicate that IAT measures of personality typically show low or modest correlations with explicit (i.e., Likert-type scale) measures of the same trait (see Greenwald, Poehlman, Uhlmann, & Banaji, 2009, for a meta-analytic review) and relate to outcomes somewhat differently (e.g., Back et al., 2009). These results have led authors of the Big Five IAT to purport that the constructs measured by the IAT are implicit personality traits that are qualitatively different from explicit personality traits measured via Likert-type items (Schmukle & Egloff, 2005). Previous personality IATs have been shown to be useful in predicting some aspects of job performance (Vecchione et al., 2014), though they sometimes have lower than desirable reliability and somewhat poor discriminant validity (e.g., Vecchione et al., 2014). Schnabel, Asendorpf, and Greenwald (2008) noted that one difficulty with IAT development is matching the positive/negative valence associated with the paired response, which can be difficult for personality constructs.
There are two important differences in the RRM and the IAT. First, the RRM does not use a paired categorization format. Adjectives are presented and are categorized as “like me” or “not like me” by the respondent, and there is no response considered “correct.” Furthermore, responses are collected without being paired with other stimuli and there is no need for a trait being assessed to have equally positive and negatively worded adjectives. The RRM looks somewhat more similar to variants of the IAT such as the Go-No Go Association Task (Nosek & Banaji, 2001) or the single category IAT (Karpinski & Steinman, 2006), though the scoring and format differ considerably from those as well. A second important difference between the RRM and the IAT is that the RRM does not purport to measure an unconscious or implicit aspect of personality. That is, convergent validity is expected between the RRM and Likert-type ratings of the same traits. The RRM is more similar to a high-speed adjective checklist than measures of implicit constructs.
Other researchers have also utilized response latency in interesting ways. Researchers in the 1970s conducted several studies on item response latency primarily as a way to judge the psychometric properties of items (Stricker & Alderton, 1999). More recently researchers have investigated response latency associated with Likert-type items. For instance, Akrami, Hedlund, and Ekehammar (2007) found that response latencies were faster for NEO Personality Inventory (NEO-PI) items when respondents were very low or very high on the trait being measured. Komar, Komar, Robie, and Taggar (2010) presented traditional Likert-type personality items yet set a time limit for test as a whole in order to create a “speeded” version. They found that timing the test resulted in lower social desirability, but only for participants lower in cognitive ability. Ranger and Ortner (2011) used an item response theory approach to incorporate response latency for traditional Likert-type items into the response model. They found that some additional efficiency was gained by incorporating response latency. The RRM differs from these methods as well in that adjectives are administered rather than full sentences and some adjectives are administered repeatedly. The scoring of the RRM also differs considerably from the approaches described above.
Scoring and Response Latency
There are many potential methods with which to score the data collected via RRM. In this study, we used response latency associated with each adjective to weigh responses such that faster responses garner more weight than slower responses. Response latency may be a meaningful indicator of the strength of the relationship between the adjective presented and the participant’s self-schema. Previous work on personality testing and social cognition suggests that the response process involves comparing items to a network of self-knowledge or self-schemata (Markus, 1977; Rogers, 1981). The relevance of information presented to a respondent to his or her self-schemata systematically influences the speed of response (Kuiper, 1981; Markus, 1977). There has been considerable empirical support for response latency as a valid indicator of schemata such that responses to items consistent with self-schemata are associated with faster latencies than those that are not (e.g., Holden & Fekken, 1993; Holden, Fekken, & Cotton, 1991; Holden & Hibbs, 1995; Holden & Kroner, 1992; Holden, Wood, & Tomashewski, 2001; Kuiper, 1981; Markus, 1977; Popham & Holden, 1990). Thus the response latencies associated with the personality adjectives administered with RRM can be used as a weight such that faster responses should be considered as more closely related to respondents’ sense of self and therefore should be more influential in computing trait scores. 1
Other Potential Applications
While we investigate the application of the RRM to personality assessment via the use of “like me” and “not like me” response options, RRM could potentially be used to assess many other constructs and attitudes. For instance, semantic differential rating scales typically ask the respond to evaluate an attitudinal object on a number of items with contrasting anchors. While any of a variety of items can be developed, there are some well-established scaling items that may be readily adapted to the RRM. Osgood, Suci, and Tannenbaum (1957) identified three factors (evaluation, potency, and activity) with associated pairs of stimuli that may fit well within the RRM framework. For instance, the evaluation factor could include pairs “good/bad,” “happy/unhappy,” “positive/negative,” and so forth. One potential workplace-relevant example could focus on leadership and ask the respondent to rate the leader on a number of items that use opposing anchors such as “strong/weak,” “decisive/indecisive,” “good/bad.” In this example, the response options of “like me” and “not like me” could be replaced with “my supervisor” and “not my supervisor” and a string of adjectives related to aspects of leadership could serve as the stimuli to be presented. The constructs assessed could be unidimensional or could be multidimensional as desired. For instance, different aspects of leadership performance could be presented and scored as independent constructs if desired. Stimuli could also be single adjectives or very short phrases could also serve as stimuli (e.g., “good communicator”). Stimuli may also be repeated in the RRM for instances in which there are relatively few novel stimuli available.
Unlike other methods, the RRM does not require pairs of contrasting items and lends itself well to a number of existing measures that use relatively short items for stimuli. For example, the Job Descriptive Index (JDI; Balzer et al., 1997) includes a number of dichotomous items used to describe aspects of job satisfaction. The JDI includes both an overall “Job in General” scale as well as various facets of job satisfaction and stimuli to be rated are typically single adjectives (e.g., “excellent”) or short phrases (e.g., “better than most”) that would lead themselves to RRM administration. In cases such as this one, the RRM would typically speed up the assessment process but otherwise use items previously validated.
Research Questions
This study seeks to evaluate the basic psychometric properties of the B5-RRM and W-RRM to ensure that RRM is viable for personality measurement. Any new measure should exhibit positive psychometric qualities. Accordingly, we pose the following research questions (RQs): RQ1: Do the B5-RRM and W-RRM demonstrate adequate reliability? RQ2: Do the B5-RRM and W-RRM demonstrate evidence of convergent validity such that RRM traits correlate with Likert-type measures of the same traits? RQ3: Do the B5-RRM and W-RRM demonstrate evidence of discriminant validity such that traits show nonsignificant and/or low magnitude correlations with Likert-type measures of other traits? RQ4: Do the B5-RRM and W-RRM demonstrate criteria-related validity evidence such that traits show significant correlations with relevant workplace and self-report criteria?
In addition to these basic questions associated with validation, we examine several RQs associated with faking. RQ5: Are correlations with social desirability and impression management lower for the B5-RRM than Likert-type measures of the same traits? RQ6: Is the B5-RRM more difficult to fake than Likert-type measures of the same traits? RQ7: Are response latencies slower when respondents are asked to fake compared to conditions in which they are asked to respond honestly?
Method
This article describes a series of analyses using four independent samples including two RRM-based assessments. There were common data analytic goals for all four samples, as well as some common measures and analyses (though there were also goals and measures unique to each sample). For sake of clarity, results are presented by analysis rather than by sample. For instance, reliability results for all samples appear before describing the results unique to a particular sample.
RRM Scoring
For all samples, negatively keyed items are reverse scored and item scores are computed as the response (–1/+1) times the response latency weight (computed as 2,500 minus the response latency in milliseconds). These item scores are then averaged across items to compute the trait score. 2
Sample 1
A total of 73 undergraduates enrolled in an introductory psychology course at a large southeastern (U.S.) university participated in the study. Demographic data were not collected, but similar samples are typically around 60% female, with a majority of respondents reporting White as their primary racial identity.
Measures
Likert-type personality
The International Personality Item Pool (IPIP; Goldberg, 1999; Goldberg et al., 2006) version of Goldberg’s (1992) Big-5 Factor Markers was used as a Likert-type measure of personality to examine convergent and discriminant validity. Twenty items per factor (100 items total) were administered in random order and a 7-point strongly disagree to strongly agree response option scale was used.
B5-RRM
The B5-RRM was conducted in a series of trials composed of blocks. In the first block, participants practiced categorizing stimuli so that they were comfortable with the interface. The second block was a learning trial in which participants were presented with the words “like me” and “not like me” in random order and were instructed to categorize each into the relevant category in which “like me” was associated with the i key (right hand) and “not like me” was associated with e key (left hand). Subsequent blocks administered adjectives corresponding to the Big Five. The content (i.e., adjectives) of the B5-RRM was drawn from a large-scale validation of personality adjectives by Ashton et al. (2004). In that study, more than 1,700 adjectives were subject to factor analysis and those with the largest factor loadings on each of the Big Five factors were reported. Those adjectives with the largest loadings were used as indicators of the Big Five in the B5-RRM. However, only a subset of the adjectives identified by Ashton et al. (2004) were used as many did not meet best practices of item writing and were likely to take considerably longer for respondents to process. An example of an adjective omitted is “unvindictive,” in which the base word is modified with the prefix “un” simply to reverse its direction. The resulting “unvindictive” is not recognized as a proper word by most dictionaries. Other examples of omitted adjectives based on negative prefixes include “unfeminine,” “unbookish,” and “unlively.” There were between 16 and 20 unique adjectives per trait among the final stimuli. One hundred adjectives were administered per Big Five trait (repeating the 16-20 unique adjectives to reach 100 total), and the entire test took approximately 7 to 8 minutes to complete.
Procedure
The study was collected inside a research laboratory on campus. Participants completed two measures, the IPIP and the B5-RRM, with the order of administration randomly assigned.
Sample 2
Sample 2 included an internet-based crowd-sourced sample of working adults to provide additional generalizability to the undergraduate in-person sample of Sample 1. An additional goal of Sample 2 was to provide more validity evidence using self-reported criteria related to the extraversion and conscientiousness factors of the B5-RRM.
Participants
Participants were 147 respondents recruited via Amazon’s Mechanical Turk (MTurk). The average age of the participants was 36.3 (SD = 14.0). Of the respondents that provided demographic information, 48 were male and 86 were female. Regarding race and ethnicity, 100 reported White/Caucasian as their predominant racial identity, 15 reported Black, 9 reported Asian, 6 Hispanic, and 4 reported “Other.” Participants were restricted to those persons located in the United States and who had a previous record of good performance in MTurk tasks. Participants received 75 cents as a gratuity for their participation. Eleven participants were removed for careless responding because they responded incorrectly to an instructed response item (Meade & Craig, 2012) that asked them to select strongly disagree as the response option to an item, resulting in a final sample of 136.
Measures
Likert-type personality
A slightly different version of the IPIP was used in Sample 2. This version was also 100 items (20 per factor) but was created to reflect the same dimensions of the FFM found in the NEO-PI-R rather than the Big Five Inventory version used with Sample 1. 3
Social desirability
Social desirability was assessed using the Balanced Inventory of Desirable Responding (BIDR; Paulhus, 1991), which includes two subscales: Self-Deceptive Enhancement (SDE) and Impression Management (IM).
B5-RRM
The same B5-RRM measure used with Sample 1 was used in this sample. In this sample, the B5-RRM was administered with only 70 adjectives per factor rather than the 100 per factor in Study 1. Total test time was approximately 5 minutes.
Affective reactions
Affective reactions to the IPIP and B5-RRM were measured by two items customized for this study: “I enjoyed the test” and “I would look forward to going through the same type of test again in the future.” Coefficient alpha for the two item scale was .92.
Self-reported criteria
We included four items of self-reported measures of work performance. Of the respondents, 99 indicated being employed at the time of the study and provided responses to these items. A parallel analysis (Horn, 1965) suggested the presence of two factors and an exploratory factor analysis with oblique rotation indicated the factors were (a) tardiness and absenteeism (“What percentage of the time would you estimate you arrive late for work?” and “How many times have you voluntarily missed work in the past 12 months?”) and (b) deadlines (“How many work deadlines have you missed in the last 12 months?” and “What percentage of the time would you estimate you miss a deadline at work?”). As these items use different response options, items were z-scored prior to averaging. We also asked a single item related to the number of Facebook “friends” of the respondent, to which 115 respondents provided a response greater than zero. Responses of zero were treated as missing.
Procedure
Respondents completed the B5-RRM, then were directed to an online survey with which they completed the IPIP and BIDR with items in random order, then finally items related to their self-reported workplace behaviors and number of Facebook friends.
Sample 3
Participants
Participants were 205 undergraduate students enrolled in a large southeastern (U.S.) university. The racial background of the participants was 74% White, 11% Black, 6% Asian, and 3% Hispanic; another 5% chose “Other” for their racial group. The sample was 53% male. The average age was 19 years, with a standard deviation of 1.01 and a range from 17 to 23 years.
Measures
Participants were asked to complete the same 100 item measure of the IPIP (Goldberg, 1999; Goldberg et al., 2006) as in Sample 1, the BIDR (Paulhus, 1991), and the 100-item version of the B5-RRM.
Procedure
Participants met in a small computer lab (N < 20 machines) for the study. Participants were asked to complete two different assessments (the IPIP and B5-RRM) under two different conditions (honest and “fake-good” instructions). As per other studies (e.g., van Hooft & Born, 2012) and consistent with recommendations related to faking research (e.g., Viswesvaran & Ones, 1999), we employed a within-participants design to investigate the role of faking on both the B5-RRM and the IPIP. Within-participant designs have the advantage of removing individual difference variables as a potential confound present in between-participant faking designs. Each participant responded to each measure under two different conditions. In the honest condition, participants were asked to respond honestly and to the best of their ability. In the second (fake-good condition), participants were asked to fake their responses as though they were applying for a job and wanted to present themselves as an ideal employee (cf. McFarland & Ryan, 2000; van Hooft & Born, 2012). Test order was randomly assigned and fully counterbalanced across the sample. Reliability and convergent/discriminant validity results are presented based only on responses from the “respond honestly” condition.
Sample 4
Participants
Participants were 228 managers enrolled in a leadership development course on the campus of a leadership development organization. Of those who reported demographic information, 139 (63%) were male and 82 (37%) were female. Of those reporting race, 146 (80%) were White, 17 (9%) were African American, 11 (5%) were Asian, 2 (1%) were American Indian or Native Alaskan, and 1 was Hispanic. Seven (3%) reported the highest level of education as high school, 9 (4%) as an associate’s degree, 89 (41%) as a bachelor’s degree, 90 (41%) as a master’s degree, and 15 (7%) as a doctorate degree; another 7 (3%) reported having another professional degree. Participants were roughly equally distributed among the middle, upper-middle, and executive levels of management. Participant age ranged from 26 to 61 years old (M = 45.31, SD = 7.61).
Measures
W-RRM
Participants were asked to complete the W-RRM assessment designed to assess traits relevant for the workplace. The constructs measured were derived based on combination of useful constructs in past literature, commonly reported facets of the Big Five, and discussions with individuals in the workplace assessment industry. Adjectives were developed by using an iterative process of generating a series of synonyms and antonyms and pilot testing with a small group of SMEs. Constructs measured include assertiveness, dependability, detail orientation, flexibility, innovativeness, stress tolerance, and teamwork potential.
Likert-type scale
As part of the leadership development program, participants also completed a 143-item version of the Workplace Big Five (WPB5; Howard & Howard, 2009), which measures the Big Five using the context of the workplace as part of the item stem. The WPB5 assesses 23 facets of personality grouped around the Big Five primary traits (a full list of facets is available in the results provided in the online supplement). While the WPB5 uses slightly different trait labels, we report the traditional names of the Big Five traits in our results section.
Criteria
Criteria measures include constructs measured via the Leading Managers 360 (LM 360; Center for Creative Leadership, 2013). The LM 360 assesses 15 competencies using multi-item scales that relate to managerial effectiveness (e.g., self-awareness, learning agility, communication, etc.). The LM 360 also includes ratings of five constructs labeled “problems that can stall a career” (e.g., difficulty changing and adapting). In addition, a series of single-item measures of performance were included in the data collection. A full list of competencies and single-item measures is available in the online supplemental materials. We report criteria relationships for variables that are expected to have the closest conceptual link to both the WPB5 and W-RRM as well as of general interest (i.e., not necessarily just for leadership development). Results are presented for two single-item measures including overall job performance ratings, and overall organizational effectiveness ratings, as well as four multi-item scales: Communication (7 items; α = .84), Resilience (6 items; α = .85), Difficulty Adjusting to Change (10 items; α = .91), and Difficulty With Interpersonal Relationships (8 items; α = .93). Data were analyzed for ratings made by supervisors, peers, and direct reports, as well as self-ratings. There were typically 4-8 raters for peer and direct report ratings groups and ratings within the groups were averaged for each item to provide a single value per item per rater group. Coefficient alphas are reported for supervisor ratings though other rater groups had very similar alpha values.
Procedure
Participants completed the WPB5 and LM 360 as part of the leadership development program. The W-RRM was available for participants to complete on machines near the training room during breaks and time away from the program. The W-RRM was mentioned to participants in training, but was entirely voluntary. Given the voluntary nature of the measure, it seems that some participants randomly clicked through the measure resulting in extreme scores and scores for which even-odd consistency (cf. Johnson, 2005; Meade & Craig, 2012) was very low (i.e., high scores on even numbered trait adjectives and low scores on odd numbered adjectives of the same trait). Thus, 27 respondents were removed leaving a final sample of 201 respondents.
Analyses
We examined reliability of the B5-RRM, W-RRM, and the IPIP as well as convergent and discriminant validity of the RRM assessment with their Likert-type counterparts. Coefficient alpha was used to assess internal consistency for the IPIP and the BIDR. Reliability of the B5-RRM and W-RRM was examined by computing even-odd split-half reliability coefficients corrected via the Spearman-Brown formula, as is the case for other assessments using response latency (e.g., IAT; Greenwald, Nosek, & Banaji, 2003). Convergent, discriminant, and criterion-related validity coefficients were estimated by computing Pearson correlations. R software was used for all analyses. Descriptive statistics and correlations for all four samples can be found in the online supplement.
Results
RQ1: Reliability
B5-RRM and IPIP reliability results for all three samples are presented in Table 2. As can be seen, all B5-RRM traits demonstrated reliability that would typically be considered appropriate in all three samples. Moreover, the smaller number of adjectives (70 instead of 100) administered via the B5-RRM in Sample 2 did not appear to diminish the reliability of the measure.
Reliability of IPIP and B5-RRM Across Three Samples.
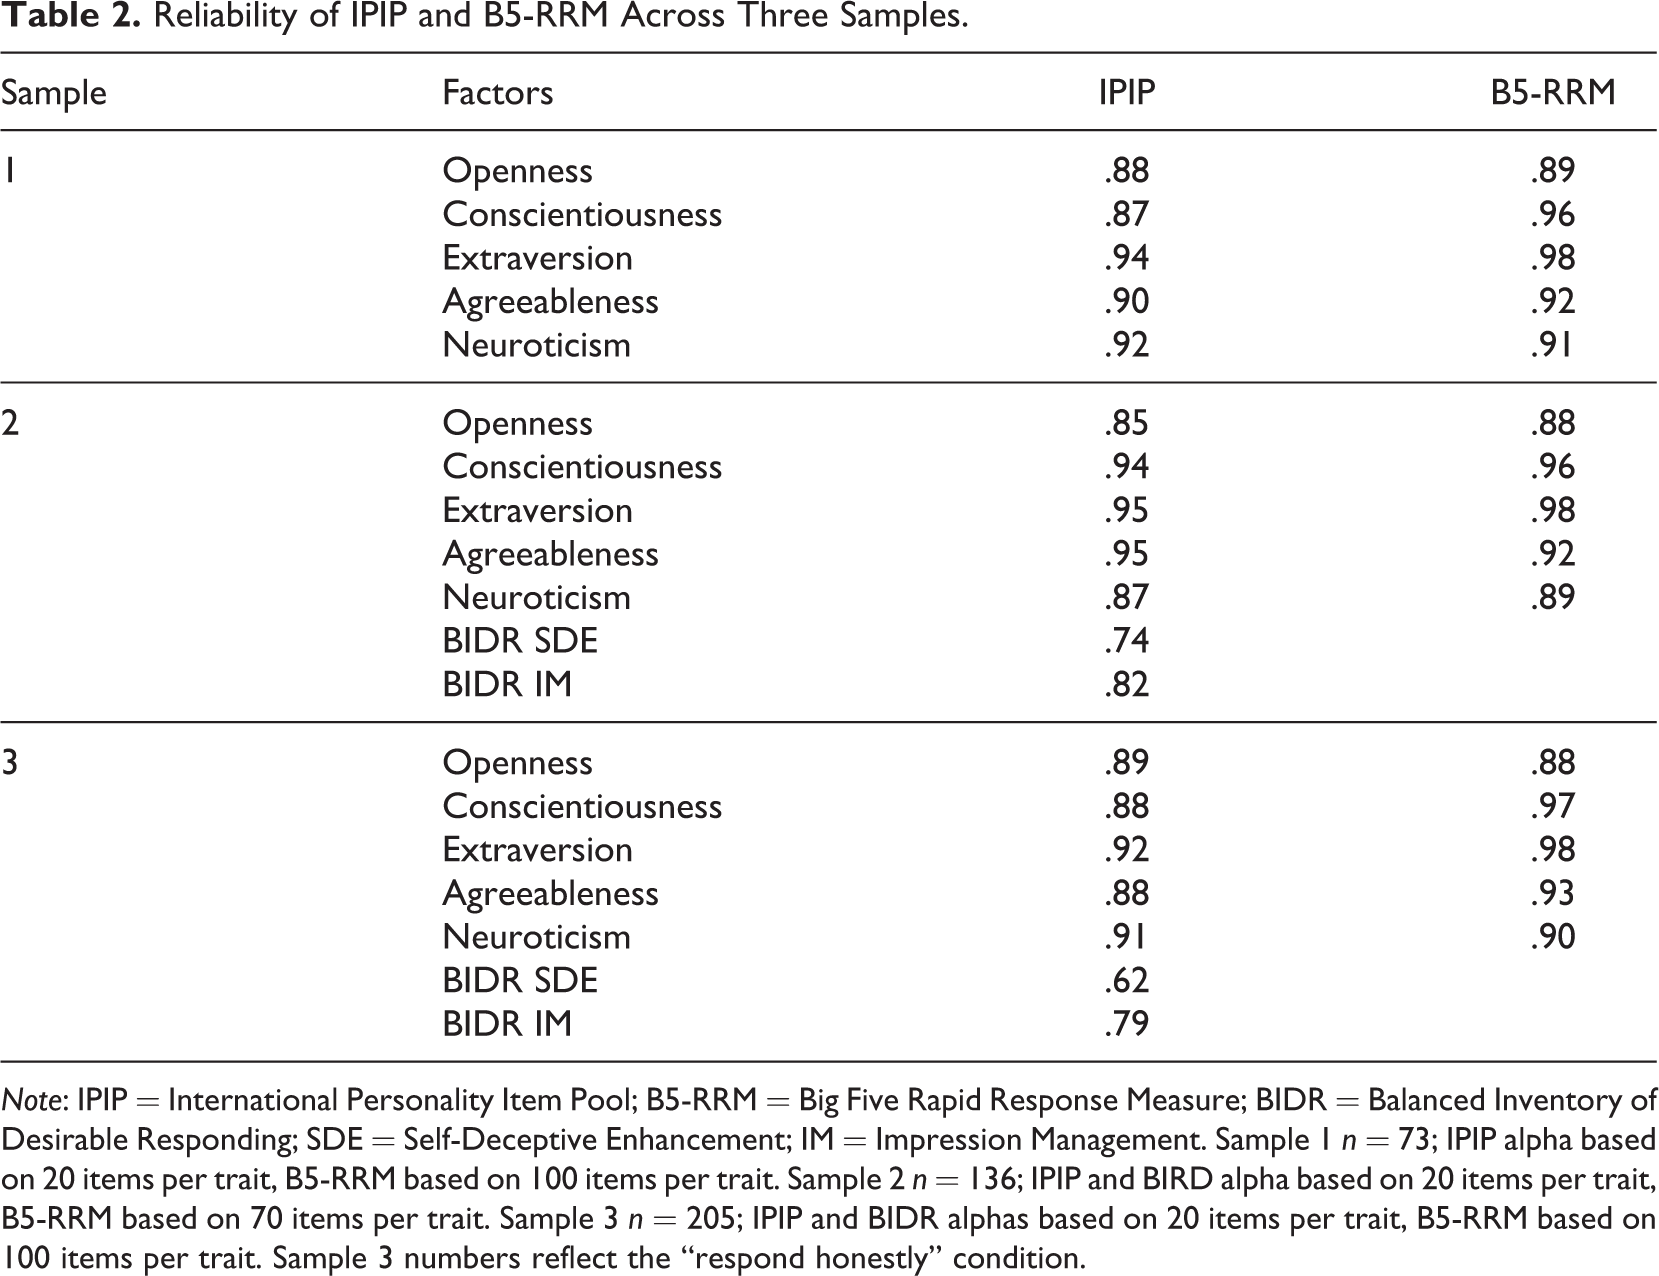
Note: IPIP = International Personality Item Pool; B5-RRM = Big Five Rapid Response Measure; BIDR = Balanced Inventory of Desirable Responding; SDE = Self-Deceptive Enhancement; IM = Impression Management. Sample 1 n = 73; IPIP alpha based on 20 items per trait, B5-RRM based on 100 items per trait. Sample 2 n = 136; IPIP and BIRD alpha based on 20 items per trait, B5-RRM based on 70 items per trait. Sample 3 n = 205; IPIP and BIDR alphas based on 20 items per trait, B5-RRM based on 100 items per trait. Sample 3 numbers reflect the “respond honestly” condition.
To further investigate the role of the number of adjectives administered on reliability, we computed split-half reliability for each trait in Sample 2 using only a subset of the total number of adjectives available. As can be seen in Figure 1, reliability plotted by the number of adjectives administered was variable across the Big Five traits. Reliability for extraversion and conscientiousness was good even with as few as six adjectives administered per trait. Reliability of agreeableness, neuroticism, and openness was not as good, though reliability of these constructs approached acceptable levels with around 20 adjectives administered per trait.
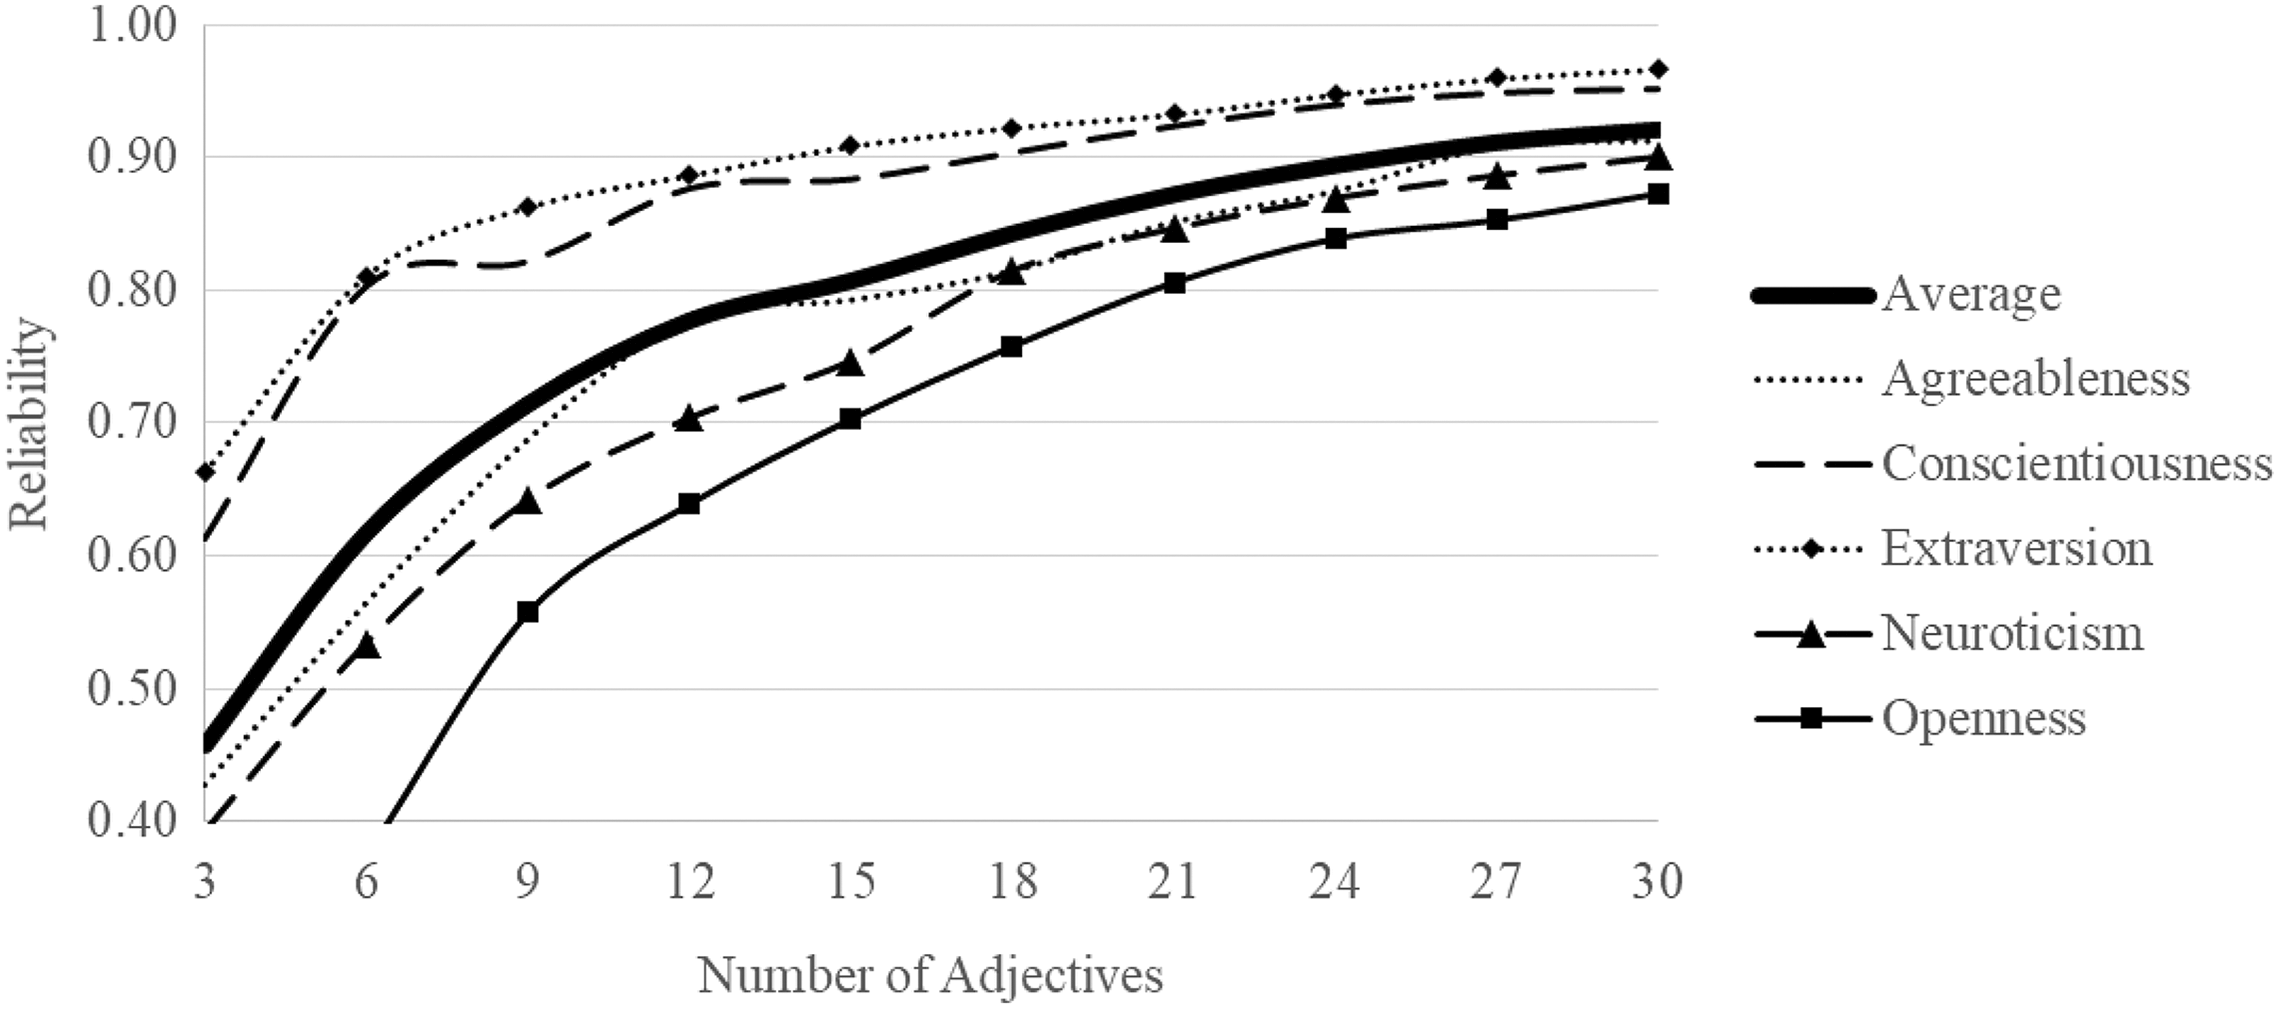
Reliability by number of adjectives administered for each Big Five factor in Sample 2.
Reliability of the W-RRM was generally adequate though lower as the number of adjectives per trait was lower than for the B5-RRM. The reliability and median number of adjectives administered per trait were as follows: assertiveness (rxx = .80, n = 16), dependability (rxx = .70, n = 12), detail orientation (rxx = .82, n = 14), flexibility (rxx = .84, n = 12), innovation (rxx = .81, n = 14), stress tolerance (rxx = .71, n = 12), teamwork potential (rxx = .77, n = 22). These reliability results match well with the investigation of the reliability of traits by number of adjectives for the B5-RRM in Figure 1. In general, it appears that approximately 15 to 20 adjectives per trait ensures adequate reliability, presuming adjectives are chosen with care.
RQ2 and RQ3: Convergent and Discriminant Validity
Convergent and discriminant validity results for the B5-RRM are presented for Samples 1 to 3 (Table 3). Convergent validity results (RQ2) can be evaluated by examining the validity diagonal (i.e., correlations among the same traits as measured by the different methods; monotrait-heteromethod correlations). Correlations between measures of the same construct should be statistically significant, should be of meaningful magnitude, and should generally be higher than those of different traits measured via different methods (i.e., heterotrait-heteromethod correlations; Campbell & Fiske, 1959).
Samples 1-3 Convergent and Discriminant Validity Evidence.
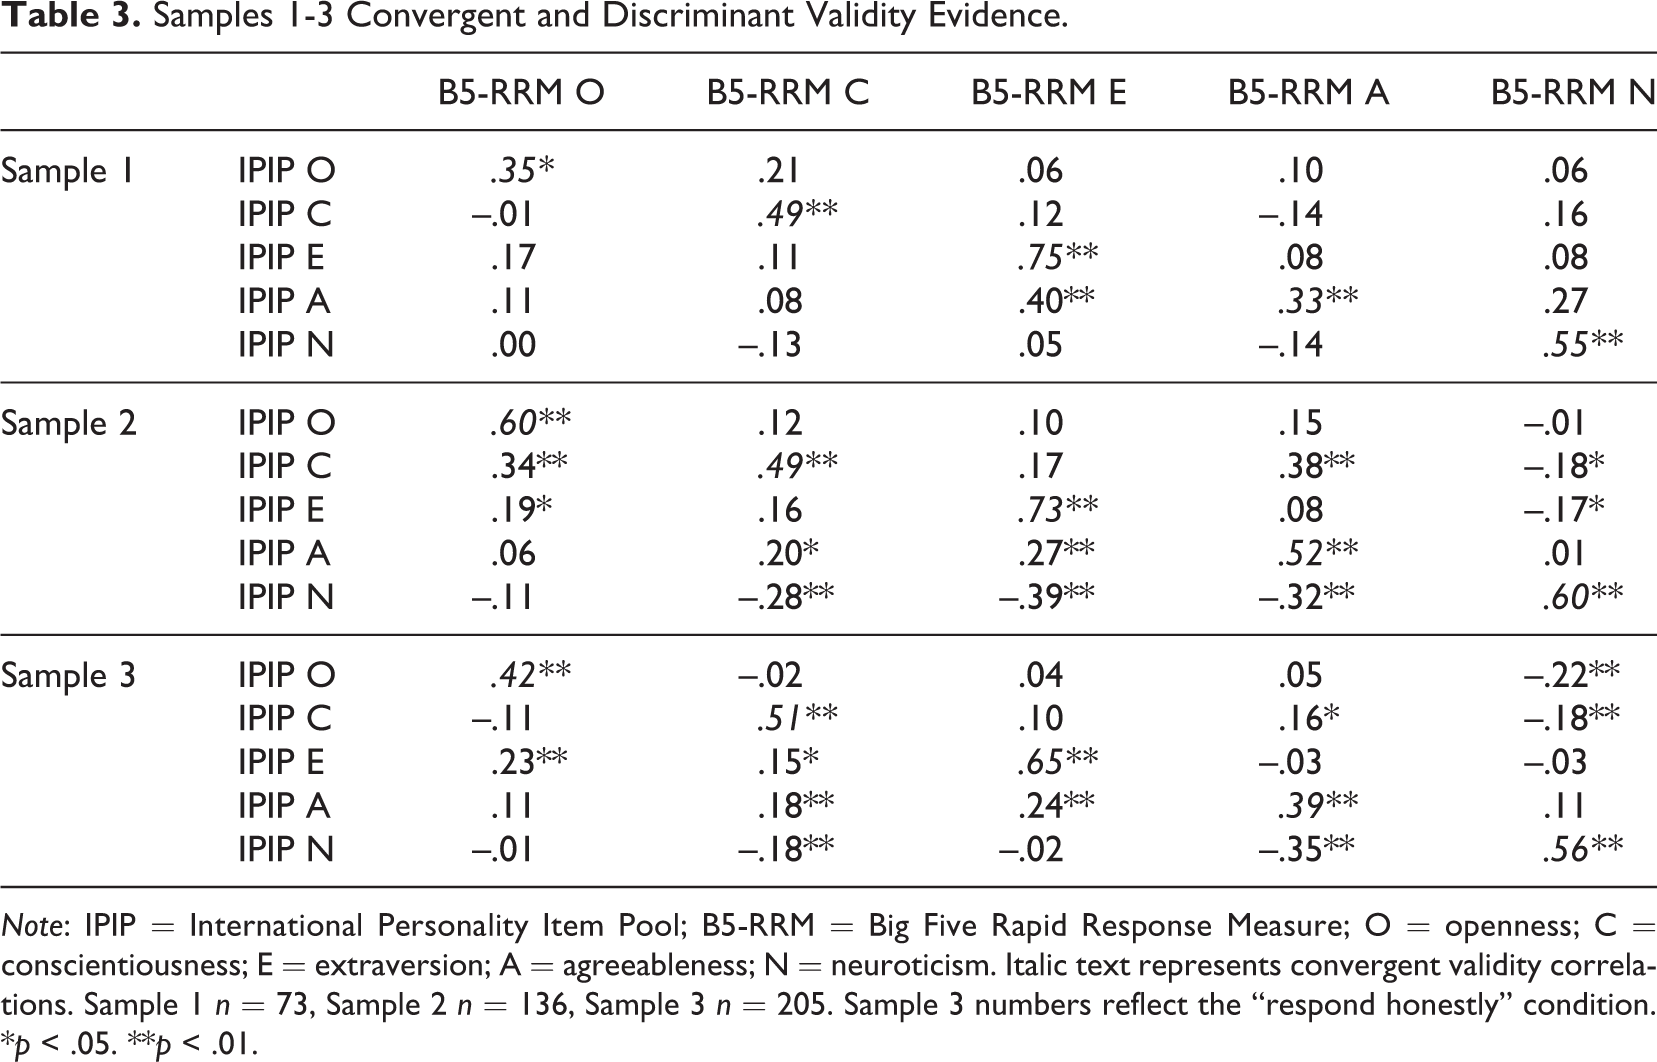
Note: IPIP = International Personality Item Pool; B5-RRM = Big Five Rapid Response Measure; O = openness; C = conscientiousness; E = extraversion; A = agreeableness; N = neuroticism. Italic text represents convergent validity correlations. Sample 1 n = 73, Sample 2 n = 136, Sample 3 n = 205. Sample 3 numbers reflect the “respond honestly” condition.
*p < .05. **p < .01.
Across all three samples, the B5-RRM measures of a given trait were significantly correlated with IPIP measures of the same trait, meeting one criterion of acceptable convergent validity. There was considerably variability in the magnitude of these correlations across samples. One potential reason could be the use of different versions of the IPIP across the three samples. Samples 1 and 3 used the Big Five version of the IPIP whereas Sample 2 used the FFM version of the IPIP. Perhaps the most significant variability was with the Openness construct. The Big Five formally measures “intellect” or “imagination” whereas the Five Factor measures “openness.” Notably all correlations, including off-diagonal correlations, were generally higher in Sample 2 than Samples 1 and 3. In addition, Sample 2 was a crowd-sourced sample whereas Samples 1 and 3 were university student samples taking the assessment in a small research lab. Thus the nature of the sample, the measures, and the environment in which the measures were completed differed in Sample 2 from Samples 1 and 3.
Despite variability across samples, (a) all monotrait-heteromethod correlations were statistically significant and (b) the observed monotrait-heteromethod correlations were larger than any other correlations in the same row and column in all cases (Campbell & Fiske, 1959). Thus convergent validity (RQ2) was generally supported.
Generally speaking, the B5-RRM showed good discriminant validity in that correlations among different traits were generally low and consistent with previous research on the Big Five (e.g., Digman, 1997). As these correlations were in all cases lower than monotrait-heteromethod correlations, discriminant validity was also generally supported (RQ3).
Convergent and discriminant validity evidence for the W-RRM can be found in Table 4. As with the B5-RRM, W-RRM correlations with WB5 traits were generally in the expected direction (e.g., W-RRM assertiveness correlated negatively with agreeableness, W-RRM dependability correlated with conscientiousness, etc.). Discriminant validity was also acceptable as expected correlations were typically higher than those that would be unexpected. However, the W-RRM assertiveness scale had significant correlations with all five WB5 constructs, showing the least discriminant validity.
Sample 4 Convergent and Discriminant Validity Evidence.
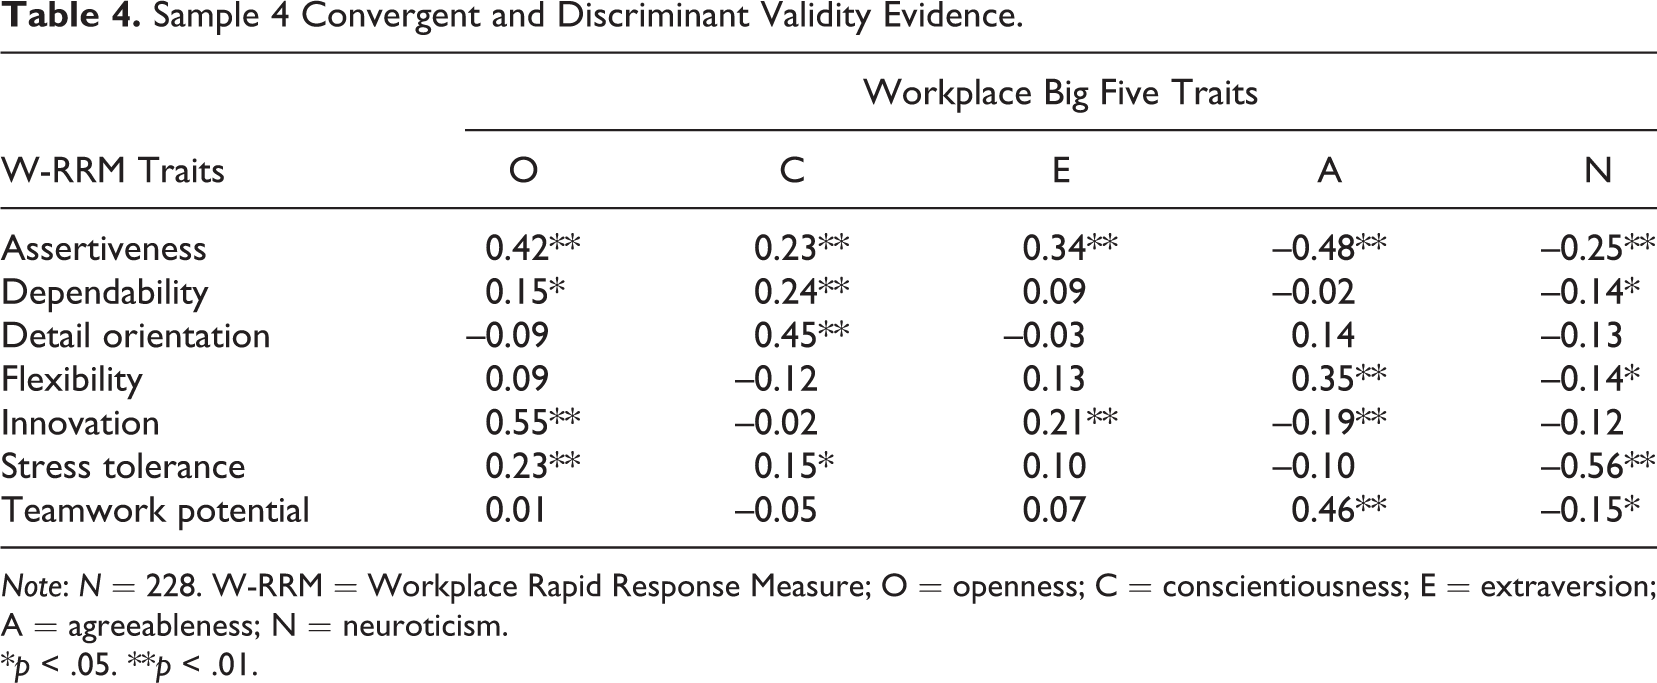
Note: N = 228. W-RRM = Workplace Rapid Response Measure; O = openness; C = conscientiousness; E = extraversion; A = agreeableness; N = neuroticism.
*p < .05. **p < .01.
RQ4: Criteria-Related Validity Evidence
Another important aspect of validation is criterion-related validity evidence. Sample 2 included self-reported behavioral criteria expected to be associated with the Big Five personality traits. Specifically, self-reported absence from work and meeting work deadlines are expected to correlate with conscientiousness and, to a lesser extent, agreeableness (Judge, Martocchio, & Thoresen, 1997). The IPIP and B5-RRM tended to show similar patterns of correlations such that the correlations between conscientiousness and both the absenteeism and deadline criteria were statistically significant and meaningfully large (Table 5). In addition, agreeableness tended to be related to the deadline criterion for both the IPIP and B5-RRM, whereas agreeableness was only significantly related to the self-reported absenteeism criterion with the IPIP. We also collected self-reported number of Facebook friends as a criterion expected to relate to extraversion. As expected, this correlation was significant for both the IPIP and B5-RRM measures (Table 5).
Sample 2 Correlations With Self-Report Criteria.
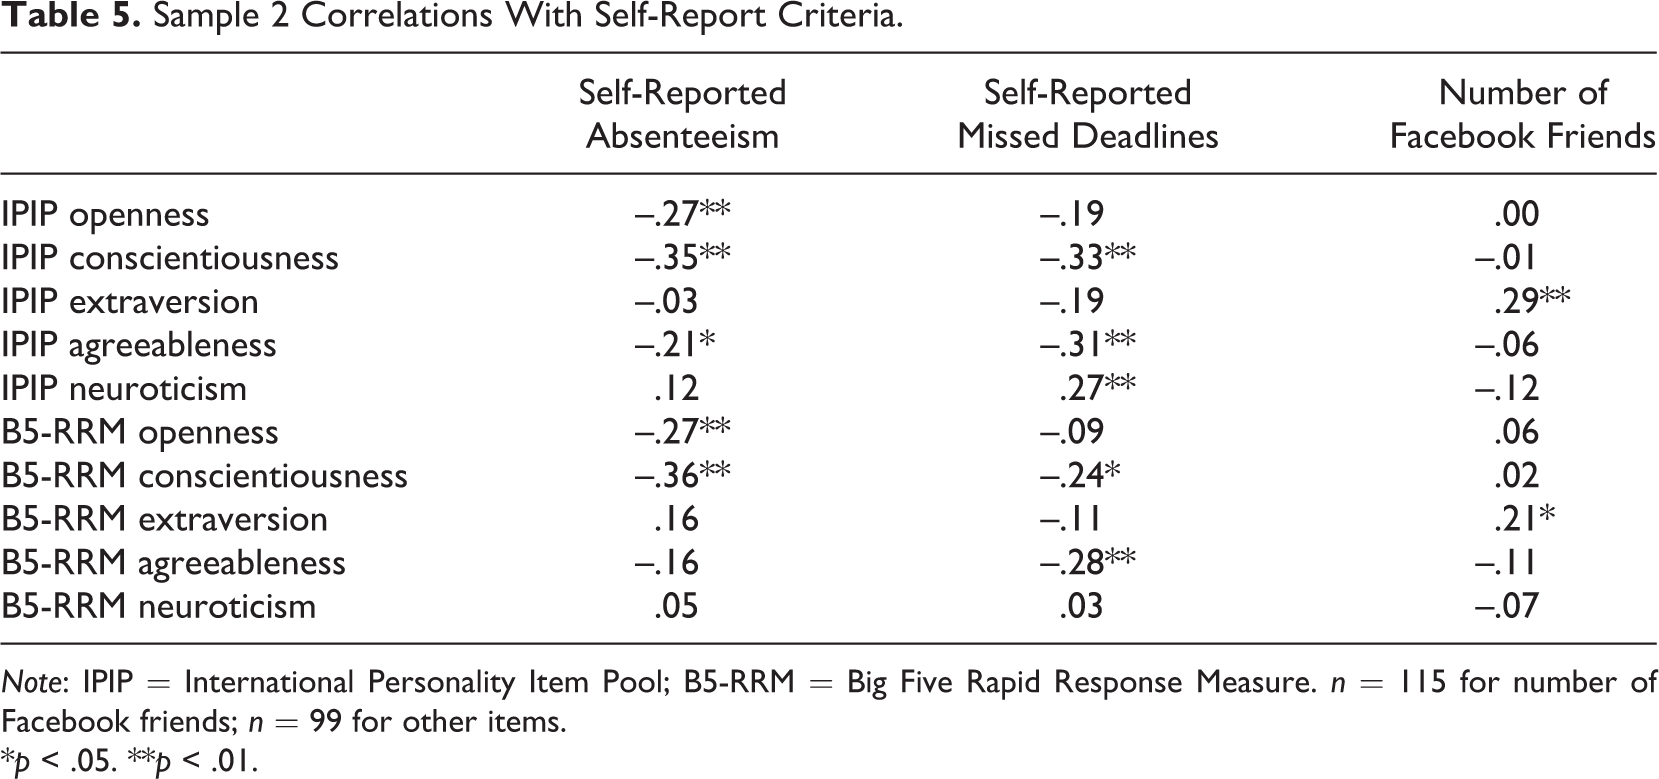
Note: IPIP = International Personality Item Pool; B5-RRM = Big Five Rapid Response Measure. n = 115 for number of Facebook friends; n = 99 for other items.
*p < .05. **p < .01.
Table 6 includes results for key criteria across rater groups for the managerial sample (Sample 4). The W-RRM measure showed significant correlations for all criteria across nearly all rater groups (with the exception of self-ratings). Criteria correlations were generally in the expected pattern. For instance, W-RRM teamwork and flexibility correlated significantly with communication, resiliency, and (negatively) with problems with interpersonal relationships and difficulty changing or adapting. However, W-RRM scales most related to conscientiousness, dependability and detail orientation, were not strong predictors of most criteria, nor was W-RRM innovation a strong predictor. Generally speaking, W-RRM scales tended to correlate more highly with specific criteria than overall performance ratings. Interestingly, among the WB5 scales, neuroticism was consistently the strongest predictor. Also, WB5 tended to correlate more strongly with self-rated criteria than other-rated criteria, whereas this was not the case for the W-RRM. It could be that the same response format, Likert-type items, contributed some same-source bias for WB5 self-rating correlations.
Sample 4 WPB5 and W-RRM Correlations with Criteria.
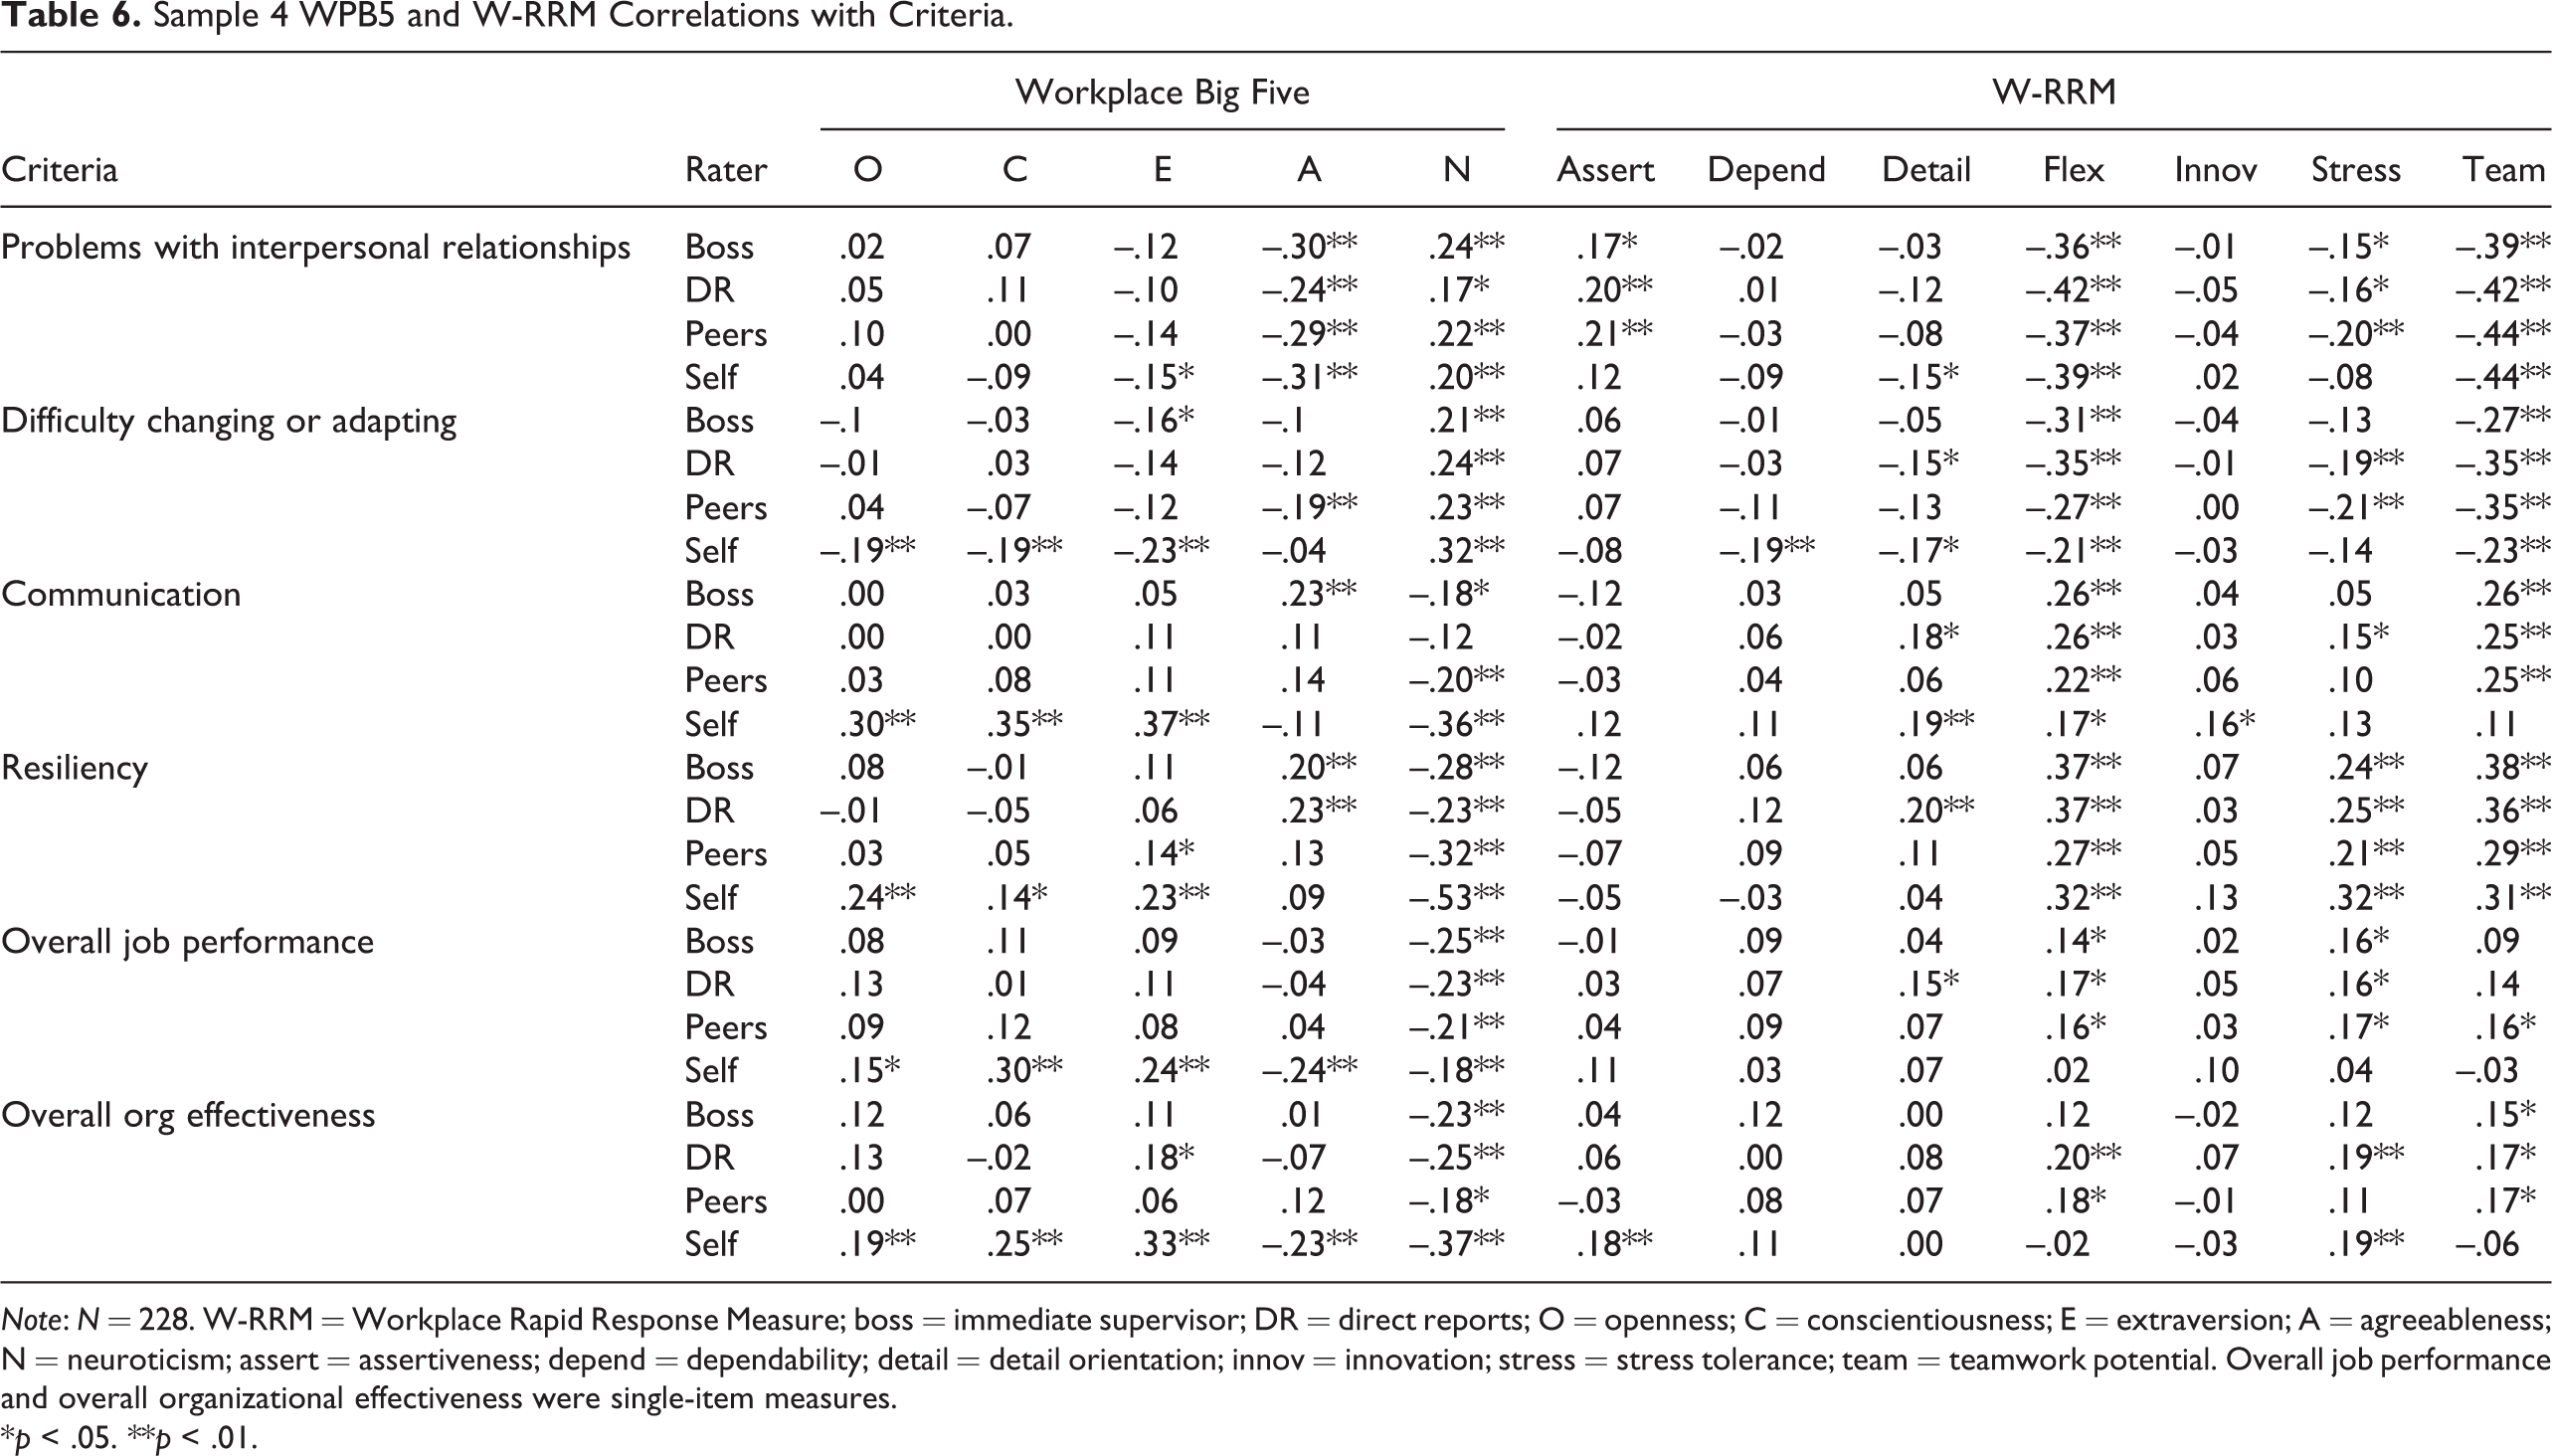
Note: N = 228. W-RRM = Workplace Rapid Response Measure; boss = immediate supervisor; DR = direct reports; O = openness; C = conscientiousness; E = extraversion; A = agreeableness; N = neuroticism; assert = assertiveness; depend = dependability; detail = detail orientation; innov = innovation; stress = stress tolerance; team = teamwork potential. Overall job performance and overall organizational effectiveness were single-item measures.
*p < .05. **p < .01.
RQ5: Correlations With Social Desirability
Table 7 provides correlations between the BIDR-SDE scale and the study personality measures. In addition, to determine whether the correlation between SDE and a given IPIP personality trait (e.g., IPIP openness) was significantly different from the correlation between SDE and the B5-RRM, we conducted a dependent-samples correlation t test. A significant t test indicates whether the correlation between SDE and the trait in question differs between the IPIP and B5-RRM measures. As can be seen in the first column of Table 7, with a single exception, all five IPIP measures correlated significantly with SDE in both Samples 2 and 3. The B5-RRM also tended to correlate with SDE, particularly for conscientiousness and neuroticism. Examining the results of t tests indicates that although the B5-RRM tended to be significantly related to SDE, in general the B5-RRM correlations with SDE were significantly lower than those between the IPIP and SDE. It should be noted that there was considerable variance in IPIP SDE correlations across the two samples such that Sample 2 (MTurk) tended to exhibit higher correlations between SDE and IPIP traits than did Sample 3 (students). Correlations with SDE among the same traits were much more consistent across the two samples for the B5-RRM than was the case for the IPIP.
BIDR Self-Deceptive Enhancement Correlations.

Note: IPIP = International Personality Item Pool; B5-RRM = Big Five Rapid Response Measure. T-value indicates t test for difference in dependent correlations between rSD.IPIP and rSD.B5-RRM.
*p < .05. **p < .01.
Results for the BIDR-IM scale are presented in Table 8. Results for IM largely parallel those of SDE. For instance, in Sample 2, there were more significant IM-IPIP correlations than there were IM-B5-RRM correlations (though not in Sample 3 honest condition). When correlations were significantly different in both Samples 2 and 3, IM-IPIP correlations were larger than those of IM-B5-RRM. As can be seen in both tables, when responding under faking instructions, correlations between the IPIP and BIDR were much higher than correlations between the B5-RMM and the BIDR. Thus participants appear to fake BIDR items much in the same way that they do IPIP items.
BIDR Impression Management Correlations.
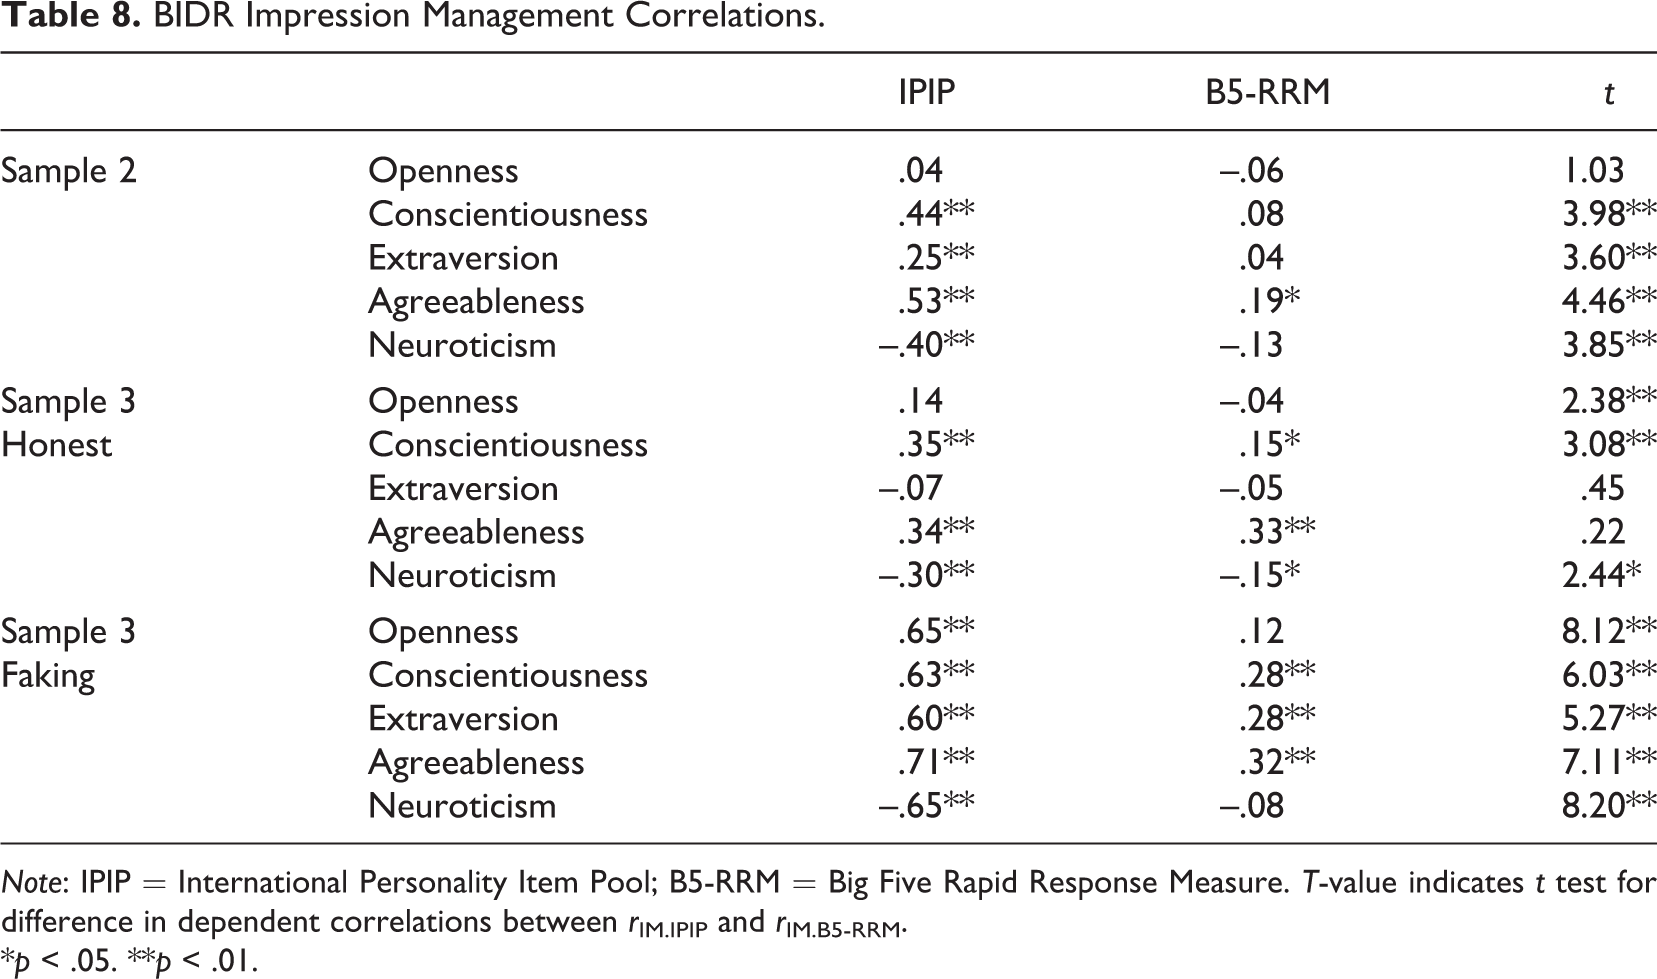
Note: IPIP = International Personality Item Pool; B5-RRM = Big Five Rapid Response Measure. T-value indicates t test for difference in dependent correlations between rIM.IPIP and rIM.B5-RRM.
*p < .05. **p < .01.
RQ6: Is There Less Faking on the B5-RRM Than the IPIP Version of the Same Traits?
Differences in scores between the honest and faking conditions for each measure can be found in Table 9. The table also presents Cohen’s d effect size estimates for the differences in honest and faking scores on the same trait as well as t tests to determine whether the mean difference in honest and faking conditions was significant for each trait. As can be seen in the table, when respondents were instructed to fake, they generally were able to do so, with statistically significant faking effects for all five IPIP traits as well as both BIDR scales. Faking effects were also statistically significant for three of the five B5-RRM traits (conscientiousness, extraversion, and neuroticism), for all three scoring keys.
Faking Results for Sample 3.
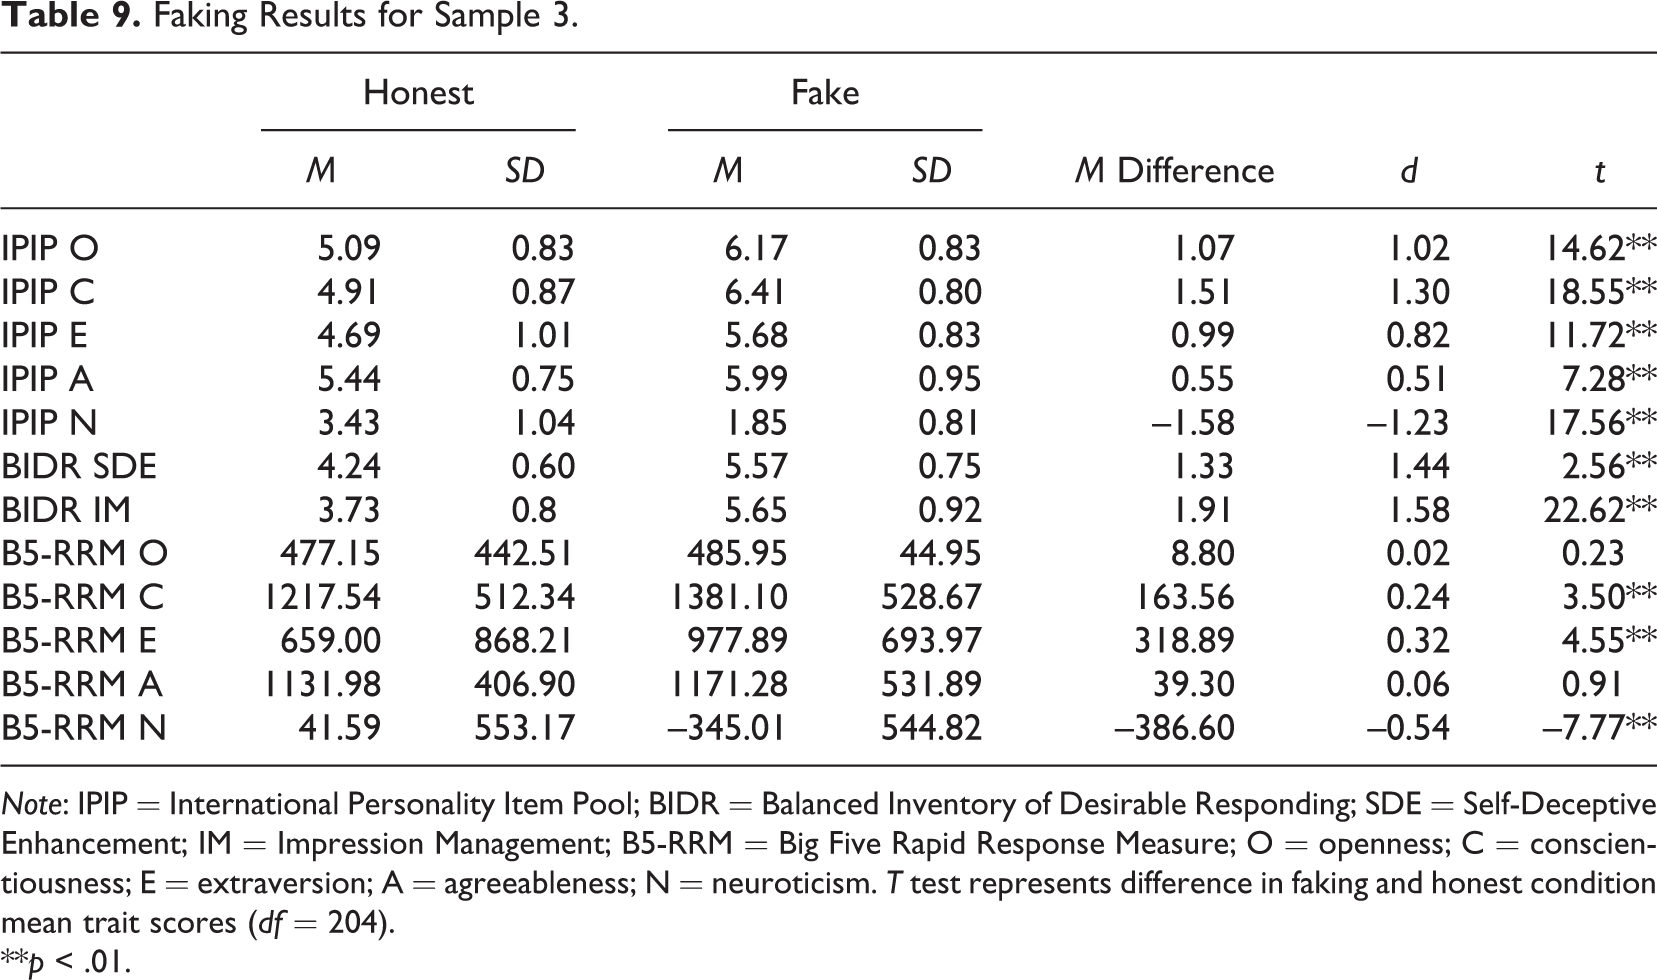
Note: IPIP = International Personality Item Pool; BIDR = Balanced Inventory of Desirable Responding; SDE = Self-Deceptive Enhancement; IM = Impression Management; B5-RRM = Big Five Rapid Response Measure; O = openness; C = conscientiousness; E = extraversion; A = agreeableness; N = neuroticism. T test represents difference in faking and honest condition mean trait scores (df = 204).
**p < .01.
We computed dependent samples t tests of faking across the IPIP and B5-RRM to determine if there was less faking on the B5-RRM than the IPIP. Because the B5-RRM and IPIP are on different metrics, we computed faking z scores for each test using the honest condition mean and SD in the formula. These z scores for the same traits were then compared using a dependent samples t test. For instance, the faking z score for IPIP Openness was compared to the B5-RRM Openness scores. For all five traits, the t test was significant (p < .01) such that there was significantly more faking on the IPIP than the B5-RRM.
RQ7: Response Latency Differences for Faking and Honest Conditions
Table 10 provides means, standard deviations, Cohen’s d estimate of effect size, and dependent samples t test of B5-RRM response latency for the honest and faking conditions in milliseconds, averaged across stimuli presented for the trait in question. There was no significant difference in response latency for any trait with the exception of conscientiousness. There was a difference in response latency for conscientiousness such that respondents were somewhat faster in the faking condition than in the honest condition.
Average B5-RRM Response Latency (in Milliseconds) by Condition for Sample 3.

Note: T test represents difference in faking and honest condition mean latency scores (df = 204).
**p < .01.
Discussion
The primary purpose of this multisample study was to introduce and establish the viability of a new assessment methodology, the RRM. As stated previously, the RRM is a general methodology that presents stimuli in rapid succession and requires a dichotomous categorization from the respondent. To evaluate the RRM, we developed two personality RRM assessments, each measuring different constructs.
While we chose personality as an initial application of the RRM, the advantages afforded by the method of reduced testing time and faking resistance would likely be of interest to researchers working in many different areas. The RRM is applicable to any type of measurement in which stimuli (such as adjectives or very short phrases) can be rated on a dichotomous scale with anchors for both options (e.g., “like me”/“not like me,” yes/no, “like my job”/“not like my job,” etc.). We believe that the RRM would be useful in the assessment of many constructs such as job satisfaction, performance evaluation, and attitudinal measurement. Initial results with personality are promising, but much future work remains to evaluate the utility of RRM with other constructs.
Reliability and Validity
Research Questions 1 and 2 addressed the basics of validation of the new measures. Reliability of the B5-RRM was well above accepted standards with little variability across the 70 and 100 item versions with additional analyses indicated that roughly 20 well-chosen adjectives is sufficient for adequate reliability. Reliability of the W-RRM was also generally adequate, though some scales may have benefitted from an increased number of adjective administrations. In addition, across all three samples, it appears that the B5-RRM could be said to generally measure the same Big Five traits as did the IPIP while demonstrating good discriminant validity. Moreover, correlations with self-reported behavioral criteria typically followed the expected pattern. Similarly, the W-RRM also generally correlated with multisource performance ratings in expected ways.
There were some caveats associated with these findings. First, convergent validity coefficients between the IPIP and B5-RRM measures of the same trait were somewhat lower than is often the case with new measure development. One potential reason could be the lack of a common methods effect. While many studies develop new measures of various constructs, convergent validity evidence is often evaluated under conditions in which both the new and existing measure use the same Likert-type response format. When two measures use the same Likert-type response format, respondents tend to engage in a similar cognitive response process model (Tourangeau, Rips, & Rasinski, 2000). While the exact nature of the extent of method effects is of some debate (Doty & Glick, 1998; Podsakoff, MacKenzie, Lee, & Podsakoff, 2003), it is common to see larger correlations between measures using the same response format than those encountered when response formats differ (Cote & Buckley, 1987; Podsakoff et al., 2003). In other words, any time measurement methods are fundamentally different, lower convergent correlations can be expected as compared to situations under which the response method is the same (e.g., both measures use a Likert-type response format).
In addition, a reviewer noted that convergent validity can be difficult with overall measures of the Big Five as each factor of the Big Five is multifaceted. For instance, Woo et al. (2014) examined openness to experience across 36 different assessments and found support for six distinct facets organized around two factors: intellect and culture. As they note, assessments composed primarily of culture items often had very modest convergent validity with those composed primarily of intellect items. The same may well be true with the assessments examined here. The IPIP utilized relatively few items (20) to assess broad constructs with several distinct facets and thus may have aligned somewhat poorly with the specific facets assessed by the B5-RRM.
It is also important to note that one purpose of developing a new type of personality assessment was to address some limitations of previous assessments. To this end, the goal of the development of the RRM was not to develop measures that correlated at > .9 with Likert-type scales, but rather to produce an assessment that generally measured the same traits but in a different way. Thus, low to modest correlations with the IPIP and WPB5 were not only expected but somewhat desirable. In addition, the general patterns of correlations were what would be expected for a valid measure of personality. Specifically, B5-RRM and W-RRM correlations were generally highest with Likert-type measures of the same trait (rather than a different trait) and both the B5-RRM and W-RRM correlated with self-reported behavioral criteria in the manner that would be expected. In sum, it appears that the RRM can be said to be a viable method of assessing personality traits, though clearly further work is necessary to better understand the RRM.
Faking
One promising aspect of the RRM was that the B5-RRM was more resistant to faking than the IPIP in a laboratory environment. Previous meta-analytic work has found variability in faking effect sizes with Viswesvaran and Ones (1999) finding a range from d = 0.48 to 0.65 in between-participant designs to 0.47 to 0.93 for within-participant designs. In their meta-analytic comparisons of job applicants (thought to be more prone to faking) to nonapplicants (presumed to be less prone to faking), Alliger and Dwight (2000) found ds between 0.11 and 0.45. In nearly all meta-analytic investigations the largest faking effects occur with neuroticism and conscientiousness (van Hooft & Born, 2012). In this study, we found similar patterns of response distortion, but with somewhat higher d values for the IPIP than those reported in previous investigations. Our IPIP d values ranged from a low of 0.51 (agreeableness) to highs of 1.23 (neuroticism) and 1.30 (conscientiousness), though these numbers were not as high as some recent studies (e.g., van Hooft & Born, 2012; d = 1.88 and 1.69 for conscientiousness and neuroticism). Our higher d values could be because the IPIP items are more transparent than those often used in employee selection contexts and the studies included in meta-analyses.
The B5-RRM was not immune to faking (ds ranged from 0.01 for openness to 0.57 for neuroticism), but rather was less susceptible to faking than was the IPIP. Respondents were able to increase their scores on B5-RRM conscientiousness and extraversion as well as reduce their scores on neuroticism. There was no faking effect for the B5-RRM for openness and agreeableness, despite some aspect of social desirability associated with being more agreeable and open (as witnessed by the significant faking effect of these two traits with the IPIP scores). Thus it appears that the B5-RRM was less prone to faking than the IPIP in this study and also less prone to faking than meta-analytic estimates of faking for other measures (e.g., Viswesvaran & Ones, 1999). The B5-RRM also showed lower correlations with the SDE and IM aspects of the BIDR than did the IPIP.
There is little evidence to explain the empirical findings that the B5-RRM was more faking resistant than the Likert-type IPIP, however we believe it is likely due to the demand characteristics of the B5-RRM. RRM presents stimuli (adjectives) very quickly with one immediately following another. Participants are told to respond quickly and receive warnings for excessively slow responses. In addition, the inherent nature of the assessment requires concentration and cognitive resources. As a result, it could be that it is inherently more difficult for participants to fake the RRM responses given the time and attentional demands of RRM itself. By requiring fast responses via both instructions and warnings, RRM is cognitively demanding and thus may prevent faking by consuming the cognitive resources required to do so. The theory underlying this approach is resource allocation theory (Ackerman, 1986; Kanfer & Ackerman, 1989) which posits that respondents have a finite amount of attentional resources that may be applied to the response process. By placing a time demand on responses, the finite resources are likely to be allocated to the evaluation of the item as it applies to the self rather than to a hypothetical ideal as may be the case during faking (Komar et al., 2010). Clearly more work is needed to fully explain the faking resistance of the B5-RRM.
Limitations
Conclusions about the merits of RRM more broadly should be tempered until further research is completed. In this particular study, we examined personality because measures such as the IPIP are widely used and the Big Five has been widely adopted within personality and organizational research (Oswald & Hough, 2011; Tett & Christiansen, 2007). As relationships among the Big Five as well as with other variables are well known, the B5-RRM was an appealing choice as an initial measure using RRM. It is premature to say whether RRM is a viable measurement method for other constructs. While initial results for RRM appear favorable, there are several limitations. Perhaps the most obvious limitation to broad conclusions related to validity and reliability is that this study is the first to examine the RRM. Validation entails establishing linkages among constructs and ensuring various types of validity evidence are in place (Binning & Barrett, 1989). While the samples examined here provide some initial information, they are far from conclusive. Additional limitations result from the nature of the samples as three of our four samples were student and MTurk samples, and all were samples of convenience. While we have no reason to expect different behavior from alternative samples, we also must caution against broad generalizations regarding other samples under drastically different conditions such as high-stakes testing environments.
Our manipulations for our faking study also must be seen in the context in which they were made. In this study, we asked laboratory participants to pretend to be an ideal job applicant as is common in faking studies (e.g., McFarland & Ryan, 2000; van Hooft & Born, 2012; Vasilopoulos, Reilly, & Leaman, 2000; Zickar & Robie, 1999). However, we caution that it is unlikely that these experimental conditions fully replicate actual faking behavior in job applicant and other high-stakes samples. Lab studies of faking typical show considerably more faking effects than comparisons of applicants and incumbents (Birkeland et al., 2006; Hough, Eaton, Dunnette, Kamp, & McCloy, 1990). In addition, nothing yet is known about the impact of coaching or other strategies on faking of the RRM. It could be that once respondents are more familiar with this type of assessment, they may become much more able to fake accordingly (see Alliger & Dwight, 2000, and Robie, Komar, & Brown, 2010, regarding the effects of coaching and faking on Likert-type scales).
Future Directions and Conclusion
RRM is a promising, short, engaging method of measurement and the B5-RRM is freely available for academic research. Future work is needed to further validate the RRM measures described here and to investigate measures of alternate constructs. We believe that RRM could be an effective measurement method of a variety of trait and attitudinal constructs. In addition, RRM versions of integrity tests may also be potentially developed as personality-based integrity tests show both strong validity (Ones, Viswesvaran, & Schmidt, 1993) and typically rely on self-report. In addition, it may be possible to replace lengthy surveys regarding employee job satisfaction and engagement with RRM versions that present various adjectives that are then categorized as “like my job” or “not like my job.” In sum, there are many potential applications with a great deal of future work needed to establish boundary conditions on the types of constructs that are suitable for measurement via the RRM.
Supplemental Material
Supplemental Material, Online_Supplement - Rapid Response Measurement: Development of a Faking-Resistant Assessment Method for Personality
Supplemental Material, Online_Supplement for Rapid Response Measurement: Development of a Faking-Resistant Assessment Method for Personality by Adam W. Meade, Gabriel Pappalardo, Phillip W. Braddy and John W. Fleenor in Organizational Research Methods
Footnotes
Declaration of Conflicting Interests
The author(s) declared no potential conflicts of interest with respect to the research, authorship, and/or publication of this article.
Funding
The author(s) received no financial support for the research, authorship, and/or publication of this article.
Supplemental material
The supplemental material is available online with the article.
Notes
References
Supplementary Material
Please find the following supplemental material available below.
For Open Access articles published under a Creative Commons License, all supplemental material carries the same license as the article it is associated with.
For non-Open Access articles published, all supplemental material carries a non-exclusive license, and permission requests for re-use of supplemental material or any part of supplemental material shall be sent directly to the copyright owner as specified in the copyright notice associated with the article.