
Abstract
Performance appraisal narratives are qualitative descriptions of employee job performance. This data source has seen increased research attention due to the ability to efficiently derive insights using natural language processing (NLP). The current study details the development of NLP scoring for performance dimensions from narrative text and then investigates validity and generalizability evidence for those scores. Specifically, narrative valence scores were created to measure a priori performance dimensions. These scores were derived using bag of words and word embedding features and then modeled using modern prediction algorithms. Construct validity evidence was investigated across three samples, revealing that the scores converged with independent human ratings of the text, aligned numerical performance ratings made during the appraisal, and demonstrated some degree of discriminant validity. However, construct validity evidence differed based on which NLP algorithm was used to derive scores. In addition, valence scores generalized to both downward and upward rating contexts. Finally, the performance valence algorithms generalized better in contexts where the same qualitative survey design was used compared with contexts where different instructions were given to elicit narrative text.
Keywords
Qualitative comments made regarding employee performance have traditionally been ignored within performance appraisal (PA) research. Instead, most PA research has dealt with traditional numerical ratings, or employee judgments made using closed rating scales (e.g., graphic rating scales). In part, this is because narrative text is challenging to incorporate into analyses given the manual time and effort required for coding. However, there are benefits to using this data source, both in terms of uncovering new and contextualized information and also in terms of increasing the total reliability of measurement (Brutus, 2010; Speer, 2018).
Recent advances in natural language processing (NLP) have opened the door to scoring narrative text more efficiently. This has occurred not only in the PA context but also across the organizational sciences more generally (e.g., Banks et al., 2018; Campion et al., 2016; Kobayashi et al., 2018; Pandey & Pandey, 2019). Within the PA context specifically, recent work by Speer and colleagues (Speer, 2018; Speer, Schwendeman, Reich, Tenbrink, & Siver, 2019) demonstrated that performance-related variance can be captured from performance narratives using NLP, and that variance predicts future behavioral outcomes. Furthermore, although most NLP methods are highly empirical in approach, deductive procedures have been used to score a priori performance dimensions from performance narratives. For example, Speer et al. (2019) developed dictionaries that automatically score the degree to which the Great 8 performance dimensions (Kurz & Bartram, 2002) are discussed in PA narratives.
Although these studies highlight new ways to understand this rich PA data source, there are challenges. Specifically, although it is desirable to depict employee performance according to performance dimensions, Speer et al.’s (2019) Great 8 theme scores only reflect the degree to which a given performance dimension is discussed; they do not indicate whether the employee is discussed favorably (i.e., whether someone performed well on a given dimension). These theme scores were accompanied by the creation of valence scores intended to reflect employee standing on performance dimensions. Yet, and per the authors’ own admissions, these were simplistically scored and did not exhibit strong convergence with traditional numerical ratings. To develop proper valence score algorithms for performance text, Speer et al. (2019) argued that researchers would need to collect traditional numerical ratings for each targeted dimension and use those as dependent variables when forming algorithms. These traditional numerical ratings reflect the best estimate of “true scores” for each dimension and can be applied within machine-learning (ML) algorithms to create estimates of performance standing based on text.
In the current research, I developed improved NLP-derived valence scores for performance comments using an a priori performance taxonomy and scored using ML. In line with the unitarian validity framework (American Educational Research Association et al., 2014; Binning & Barrett, 1989), convergent and discriminant validity, factorial validity, and reliability were evaluated to determine the construct validity of the derived NLP scores. When doing this, I also examined different NLP scoring methods that include both traditional NLP (i.e., bag of words [BOW]) and more contemporary NLP methods (i.e., word embeddings), thus allowing for a comparison of different scoring procedures to help inform future researchers conducting NLP. Finally this study investigated the generalizability of the derived NLP scores across different rating sources (upward, downward) and different survey designs. Taken together, this research presents a detailed account of how researchers can build theory-driven NLP algorithms, validate those algorithms, and then examine the boundary conditions that impact the generalizability of developed scores. This study thus furthers organizational research methods and helps advance research capabilities specifically within the PA context.
To investigate these topics, NLP-derived valence scores were developed on an initial sample (Sample 1) of downward performance judgments to measure the Great 8 performance taxonomy (Bartram, 2005; Kurz & Bartram, 2002). These algorithms were then tested on independent holdout groups created from that data collection and then on two additional samples where respondents made ratings of their direct supervisors (i.e., upward ratings). In one of these upward rating conditions, raters made judgments using the same survey design as Sample 1 (Sample 2). In the other, they made judgments using a different survey design with only a single overall text box for qualitative text (Sample 3), thus allowing comparisons of how rating source and differences in survey design impact the generalizability of NLP-derived scores. Construct validity evidence was examined within each sample to determine the adequacy and generalizability of derived scores.
Brief Introduction to Performance Evaluation
Employees bring value to organizations by producing goods and services via work-related behaviors, and companies distinguish employees based on the degree to which they successfully perform these behaviors and produce desirable work results. Such evaluation is done for many purposes, including administrative (e.g., to determine pay, promotions, or other employment-related decisions) as well as purposes more developmental in scope (e.g., providing feedback to increase self-awareness and improve employee performance). The formalized evaluation of employee performance is referred to as performance appraisal.
A full account of the many social and cognitive complexities of the PA process is well beyond the scope of this article. However, a brief orientation might help readers appreciate the context of employee performance measurement. In short, PAs are most frequently conducted by employees’ immediate supervisors, although they also might be completed by other sources too (e.g., subordinates, peers, self). Although these judgments facilitate many human-resources-related decisions, they have often been criticized for a number of reasons, including low interrater reliability (e.g., Viswesvaran, Ones, & Schmidt, 1996), low user acceptability (Pulakos et al., 2015), rater biases (Landy & Farr, 1980), and judgment deficiency (Cascio & Aguinis, 2005), among others. As such, researchers have long sought to improve the PA procedure. Much of this research has concentrated on cognitive biases and judgment errors made by the rater (e.g., DeNisi, Cafferty, & Meglino, 1984), leading to a better understanding of rater limitations and to various remedies (e.g., altering scale format, better training; Landy & Farr, 1980; Woehr & Huffcutt, 1994). An alternate research stream emerged in the latter portion of the 20th century examining how social factors impact judgments within the PA context (e.g., Harris, 1994; Levy & Williams, 2004; Murphy & Cleveland, 1995; Spence & Keeping, 2011). This area of work addressed the notion that raters may not always be motivated to accurately rate employees. Taken together, this large body of research has revealed that accurate employee judgments are difficult to make and may not always be the goals of all raters.
Research on PA judgments has typically focused on traditional numerical ratings, or judgments made using closed-format scales that assign numerical values. However, qualitative performance judgments (i.e., narratives) are also frequently made in combination with traditional numerical ratings (Gorman et al., 2017). For example, raters are often provided comment boxes to describe employee behavior in terms of ratee strengths and weaknesses, tips for improvement, overall judgments, or competency-specific feedback. Researchers have described narratives as a rich but underutilized data source that allows for elaboration and contextualization of ratee behavior (Brutus, 2010; Speer, 2018), and the inclusion of narratives in combination with traditional numerical ratings is expected to increase the bandwidth and reliability of total performance measurement in PA contexts. However, there have been challenges to PA narrative measurement. Primarily, the qualitative nature that makes narratives so interesting also makes them challenging to analyze. Until recently, analyzing narratives required laborious and expensive human coding. However, this has changed with the increase of NLP within the organizational sciences.
Creating Improved Performance Valence Scores Using Natural Language Processing
Given the recent influx of NLP research, readers are referred to the following sources for more guidance on general NLP approaches (e.g., Banks et al., 2018; Campion et al., 2016; Kobayashi et al., 2018). The current research builds on these studies by using multiple NLP approaches to create valence scores for the Great 8 performance taxonomy (Bartram, 2005; Kurz & Bartram, 2002). The Great 8 is a set of performance dimensions that describes behaviors essential to work. This framework was used by Speer et al. (2019) to score performance narratives using NLP methods and was chosen because it comprehensively targets a broad range of performance competencies, does so at a moderate level of specificity (i.e., neither too narrow nor too broad), and is generally applicable across jobs. The Great 8 dimensions include Leading & Deciding, Supporting & Cooperating, Interacting & Presenting, Analyzing & Interpreting, Creating & Conceptualizing, Organizing & Executing, Adapting & Coping, and Enterprising & Performing. The taxonomy has been applied to link selection tools to criteria (Bartram, 2005; Rojon, McDowall, & Saunders, 2015), to develop job-specific competency models (Ammons-Stephens et al., 2009; Hayes & Omodei, 2011; Klendauer et al., 2012; Spendlove, 2007), within leadership (Wu & Wang, 2011), and for employee development (Costigan & Donahue, 2009).
The specific methods used to develop Great 8 valence scores will be elaborated on in the “Methods” section. However, if the developed scores effectively measure their intended constructs, they should exhibit evidence of reliability and validity. Regarding reliability first, there are challenges to establishing internal psychometric properties of NLP-derived scores (e.g., Speer, 2018). To provide an approximation of reliability for the NLP-derived scores in this study, independent human-generated performance judgments of the narrative comments were made and served as an alternate form estimate of performance valence.
Research Question 1: Do NLP-derived performance valence scores exhibit strong correlations with independent human-generated ratings of the same narratives?
To examine the validity of the valence scores according to the unitarian framework (e.g., Binning & Barrett, 1989), associations with performance variables were examined. Great 8 valence scores were expected to be positively correlated with aligned traditional numerical ratings of the same dimensions, as completed during the PA. This establishes necessary evidence for convergent validity. Likewise, narrative scores should also exhibit evidence of discriminant validity. One form of this is the discriminant correlations between a given Great 8 valence score (e.g., Leading & Deciding) and nonaligned numerical ratings of other Great 8 dimensions, such as Supporting & Cooperating (i.e., hetero-trait-hetero-method correlations). Because performance dimensions tend to be very highly correlated and a general performance factor permeates most performance ratings (Viswesvaran, Schmidt, & Ones, 2005), such correlations were expected to be large, although lesser in magnitude, when compared to the convergent correlations.
Another form of construct validity evidence pertains to the pattern of Great 8 narrative scores with one another. The pattern of correlations within method (ratings, narratives) should be similar in order to exhibit factorial validity (via test of measurement equivalence). In other words, if the narrative-derived valence scores reflect the same set of performance constructs as numerical ratings, one would expect similar relationships between dimensions within each measurement method. A series of research questions are proposed that address the construct validity of the derived narrative valence scores. Because the type of NLP algorithm might impact the construct validity of derived scores, a question is also specified pertaining to NLP method.
Research Question 2: Do NLP-derived performance valence scores exhibit acceptable levels of convergent and discriminant validity with numerical ratings?
Research Question 3: Do NLP-derived performance valence scores exhibit similar patterns of factorial validity as numerical ratings?
Research Question 4: Which individual NLP scoring methods exhibit higher convergence with aligned numerical ratings (i.e., better convergent validity), and which exhibit lower correlations with nonaligned numerical ratings (i.e., better discriminant validity)?
Generalizability of derived valence scores
This study also examined the generalizability of the derived performance narratives across two different types of scenarios. First, this study examined whether the valence scores generalize to different rating sources (downward manager ratings vs. upward subordinate ratings). Multisource performance ratings are common within performance management and offer unique insights beyond single-source ratings (e.g., Hoffman & Woehr, 2009). Use of multisource performance ratings is actually predicated on this assumption such that the effort to collect data from multiple sources (e.g., managers, subordinates, peers) is justified because these different sources provide unique perspectives about ratee behavior (Murphy, Cleveland, & Hanscom, 2018). Consistent with these assumptions, source factors display meaningfully different patterns of correlations with externally measured variables (Hoffman & Woehr, 2009), meaning they measure different ratee attributes. Extending this to narratives, Rupayana et al. (2017) found that supervisors and coworkers describe employees differently, although this was an employee referral context and not a PA context specifically. Taken together, PA narrative language is likely to differ by rating source. As such, a substantive question is whether NLP algorithms designed to measure performance using one type of rating source generalize to narratives written by another source.
Second, this study also examined how well the derived valence scores generalize when applied to surveys with different open-ended prompt structures. Open-ended text allows for diverse information to be provided, much of which is likely to be contextualized and contain elaboration beyond numerical ratings. At the same time, the open-ended nature of narratives decreases standardization and therefore increases variance in information. This feature makes the concept of situational press, or how situational factors influence behavioral responses, quite important (Speer et al., 2019). In this study, the valence scores were created based on responses to a series of targeted, narrow prompts that asked about each of the Great 8 dimensions and overall job performance. These algorithms were then applied to new contexts where the instructional prompts were either the same or different—specifically, different by only using a single broad prompt to describe employee performance. A broad prompt is likely to result in variability in what types of themes are written about, the number of themes respondents provide information for, and how much text is provided. It is unclear whether algorithms developed using a different survey design will generalize to text from broad prompts.
Research Question 5: Do the derived performance valence scores generalize to settings where performance judgments use different rating sources or use different open-ended survey designs?
Methods
Sample 1
Participants
The purpose of Sample 1 was to create and validate Great 8 valence score algorithms. Current managers were recruited from Amazon Mechanical Turk (MTurk) for this purpose. MTurk is a labor market where people voluntarily perform tasks in exchange for monetary compensation. It has frequently been used in the social sciences to investigate psychological phenomena (Cheung et al., 2017; Landers & Behrend, 2015). In this study, respondents could only view the study link if they indicated their job function was “management” and if they were managers from the United States. Then, several survey questions filtered out respondents who did not meet study criteria, including whether they responded “yes” to currently being a direct supervisor (i.e., manager), whether they had completed a PA in the past year, and whether they directly supervise at least two employees. Only respondents who met these criteria responded to the survey, which asked participants to perform PA evaluations for their current employees. A benefit of this study’s sampling approach is that the respondents did not belong to a single organization, therefore allowing variability in organizational setting and potentially increasing generalizability of the developed valence algorithms.
The survey task (see “Measures” section) involved rating and providing narratives for two direct reports. Managers were provided a brief overview of the concept of PAs. Then, they made judgments of their first direct report (their employee with letter of first name closest to letter “A”). After completing this judgment, managers assessed a second direct report (their employee with letter of first name closest to letter “Z”). To ensure the comment data were of high quality and that managers responded purposefully, the data were thoroughly reviewed for purposeful responding, and mechanisms were put in place to increase purposeful responding. Before data were even collected, respondents were incentivized to provide high-quality text through the distribution of gift cards. Specifically, participants were informed that respondents with the highest quality responses (which was vaguely defined as “based on text length and comprehensiveness”) would be entered into drawings for monetary gift cards ($100). 1 The top 50% of respondents in terms of text length were ultimately entered into these drawings. Furthermore, throughout the study, managers were reminded to respond purposefully and were told of the importance of writing high-quality narrative comments. Overall, 80% of respondents agreed that they were very motivated to perform well in the study.
Minimal character length requirements were established to ensure enough text was included (200 characters per text box). Once data were collected, each manager’s text was manually reviewed to ensure they completed the writing task in line with instructions. Text for managers who met study preconditions and who completed the study’s PA tasks was reviewed (i.e., the comments were visually inspected one by one), and respondents were removed for nonpurposeful responding based on written narratives (i.e., if the text did not describe ratee job performance). In these cases, managers either entered random combinations of characters, copy and pasted words repeatedly, or copy and pasted text from online. After these removals, respondents were further removed because of excessively fast completion times (≤10 minutes, which the researcher set after several practice trials trying to fill out the survey as quickly as possible). The total number of respondents who successfully completed the survey was 484.
Across the entire sample, a total of 867 performance evaluations 2 were made and were usable, and this was the total sample size in Sample 1. Seventy percent of the respondents were White, and 55% were male. Eighteen percent of the sample worked in smaller companies (less than 50 employees) and 29% in larger companies (greater than 1,000 employees). The average job tenure was 4.64 years, and average organizational tenure was 6.55 years. The average age was 37 years.
The entire sample was split into subsamples to perform the NLP and ML tasks. A five-split cross-validation procedure was applied such that Sample 1 was split into random 80% calibration samples (N = 694) and 20% holdout samples (N = 173) five times 3 ; each holdout sample was independent such that a respondent was only included in a holdout sample once. Model algorithms were built using the calibration samples and then cross-validated on the holdout samples, which provide a test of how well the developed algorithms perform in new settings. Cross-validation was done a total of five times, or once for each of the holdout samples from Sample 1, making for a total holdout sample of 867 performance evaluations.
Measures
Traditional numerical ratings were made for each of the Great 8 dimensions and then for overall job performance for each direct report. For each Great 8 dimension, the dimension was first briefly described to the respondent. Managers then rated their employee on a scale ranging from 1 (does not meet expectations) to 5 (greatly exceeds expectations). This rating format was used for all Great 8 dimensions. After making the traditional numerical rating, participants were then provided with a text box with instructions to “use this text box to describe this employee’s performance in terms of the given competency.” Managers were required to provide text equal or greater to at least 200 characters for each text box. Respondents provided narrative responses for each of the Great 8 dimensions and for overall job performance. For the actual creation of scoring algorithms and when testing the validity of those algorithms, all the text provided by respondents was used irrespective of which open-ended box it came from.
Natural language processing and scoring
Separate algorithms were built for each Great 8 dimension. Narrative text was first processed (see steps in the following) to form numerical vectors (i.e., features) used for later analyses, and there are myriad ways to do this. For example, researchers in the organizational sciences frequently use the BOW framework where the order of a document’s words is ignored; instead, the simple presence of word phrases occurring in text is the focus of the analysis. The current study explored the viability of scoring Great 8 narrative valence using three approaches: (a) a customized BOW approach labeled contextualized n-gram scoring using filtered segments of available text, (b) traditional BOW using all available text, and (c) word embeddings, with each described next. The syntax for these analyses can be found in the Supplemental Material available in the online version of the journal.
Contextualized n-gram scoring
Contextualized n-gram scoring applies BOW feature creation (using n-grams such as unigrams, bigrams) but uses only specific subsets of each respondent’s narrative. To this last point, an entire block of text contains multiple sentences that describe various themes. Although certain words will generally describe effective performance overall (e.g., excellent, great), if these words are used in a context nonspecific to a given Great 8 dimension, it would be inappropriate to apply that word vector as a reflection of the Great 8 dimension in question. For example, if an employee is described as “having great time management skills,” the word great will likely correlate with overall performance. However, if trying to measure interpersonal effectiveness, that particular usage of great would not be well aligned. As such, contextualized n-gram scoring first filters narratives into those sentences that use words aligned to a Great 8 dimension. For example, Speer et al. (2019) created dictionaries of words that reflect each of the Great 8, and the word managing is related to Leading & Deciding. The described approach would filter out a sentence that did not include this word (or other word phrases that are related to the dimension) but would keep a sentence such as “He has an authoritative style of managing.” Once relevant sentences are identified for each block of narrative text, that remaining text is then converted to a document term matrix of n-grams, and that is used for future analyses.
This contextualized n-gram scoring approach has not been used before but has several benefits. Primarily, it is simplistic, in that it uses n-grams for feature creation. This approach also maintains some contextual meaning by filtering to sentences that are likely relevant to a construct and by using bigrams or higher-level n-gram features. Thus, it provides a heightened level of contextualization while still being easy to implement in practice, assuming there is a dictionary to perform sentence selection.
The first step of this approach in this study was to clean the text, which removes unhelpful information and standardizes information across narratives. The steps taken for this task were similar to those used in Speer et al. (2019) but slightly more extensive and included breaking each narrative into sentences, translating common acronyms into words (e.g., “IQ” into intelligence), controlling for negation by combining polarity flippers (e.g., not great became not_great), replacing gender-specific pronouns and first-person pronouns with placeholders that were gender-neutral, removing a custom set of common stop words (e.g., the), removing numbers, removing select punctuation (with the exception of question marks and exclamation marks), lowercasing, stripping white space, and lemmatizing (i.e., reducing words to their base; e.g., working would become work).
After doing this, the Great 8 theme dictionaries from Speer et al. (2019) were used to identify relevant sentences for each Great 8 dimension. However, slight changes were first made to these dictionaries. First, the additional word vectors described in the discussion of that article were added to the dictionaries along with a small handful of additional words linked to those performance dimensions. 4 Second, the word phrases were lemmatized to maintain consistency with the aforementioned text processing and to ensure all types of word uses were incorporated. After these changes were made, only sentences that contained at least one of a Great 8 dimension’s word phrases were kept. These sentences were then reaggregated into a single block of text, which was subsequently transformed to document term matrices consisting of unigrams and bigrams. This was done separately for each of the Great 8 dimensions, resulting in eight matrices. Note that an analysis was also performed to predict overall job performance using a composite of all performance ratings. Given that there was no word dictionary specific to this broad outcome, the approach reduces to traditional BOW without any of the aforementioned contextualization via sentence selection. Thus, the total number of predictor matrices was actually nine. Vectors were represented by dichotomous values (1 = phrase present, 0 = phrase not present) of whether a word occurred in the relevant block of text. 5
After forming initial document term matrices, it is common to reduce the number of word vectors (e.g., Kobayashi et al., 2018), and this was done in two ways. Only phrases that occurred in at least 1% of documents were kept (i.e., removing sparse terms), in line with other research (e.g., Kobayashi et al., 2018; Schwartz et al., 2013). Then, word vectors were further reduced by removing any word phrase exhibiting near zero correlations with their aligned numerical performance rating (using an arbitrary value of |r| < .05). Note that the correlation-based reduction was done using the calibration samples, thus minimizing capitalization on chance. 6 A vector that represented the total number of words within the filtered section of text was also placed into each matrix to account for differences in text length. 7 After completing these steps, the matrices were ready for input into prediction formulas, with several hundred variable features aligned to each of the Great 8 dimensions. The number of variables is not uncommon within the context of text mining (e.g., Park et al., 2014), where it is typical to use ML algorithms that maximize prediction in holdout samples by penalizing variable weights or by adding randomness to the features or sample when forming variable weights.
The next step was to take the word vectors within each matrix and combine to create predicted performance scores. To do this, aligned Great 8 numerical ratings were used as the dependent variables, and the aforementioned matrices were used as predictor inputs. A variety of ML algorithms were explored for this task (e.g., elastic net regression, random forests). Random forests was ultimately chosen. Random forests (e.g., Breiman, 2001) creates a series of individual regression trees (usually several thousand) to predict an outcome. These trees split predictor scores based on whether they differentiate respondents in terms of the criterion, and they naturally capture potential nonlinear predictor effects and interactions in the data. Whereas a traditional regression tree will consider all variables and use all respondents within a single tree, random forests intentionally reduces each tree’s individual predictive power in the calibration sample by randomly sampling from the potential pool of variables. It also randomly samples from the calibration sample’s respondents to create each tree. These aspects reduce the performance of each individual tree, but when those trees are aggregated into an ensemble, the result is usually a highly predictive model that minimizes variance in new settings.
The optimal number of available predictor variables per node was chosen by applying a step-factor to the left and right of a chosen starting point of k/3 variables. Note that this was performed solely within the calibration samples and separately for each of the Great 8 dimensions. Two thousand trees were used with a minimum node size of five, with otherwise default settings. This resulted in random forest algorithms that produced predicted performance scores for each of the Great 8 as well as for overall performance.
Traditional BOW scoring
Traditional BOW scoring used the same preprocessing and scoring as the contextualized n-gram method but without any filtering based on Great 8-specific words. Thus, full document term matrices were used for each Great 8 dimension and for overall performance. Like contextualized n-gram scoring, the resulting matrices were used as input features. Random forests was used with matched numerical ratings to produce valence scores.
Word embedding scoring
Word embeddings (e.g., Mikolov et al., 2013; Pennington, Socher, & Manning, 2014) use a form of matrix factorization that transforms words into dense vector spaces where each word is represented by a vector of numerical values. Whereas BOW does not easily capture semantic meaning, a benefit of word embeddings is that they use the context in which a word appears to train the embedding vectors. They also serve as a form of dimension reduction to convert a large number of variables (e.g., word phrases) into condensed factors. Based on whether words co-occur with one another within a window of text (e.g., within 7-10 words left and right), word embeddings are trained on large sources of text data such that each word is represented by numerical values that fall along a k-dimensional space. The use of co-occurrence matrices from word windows encodes natural meaning between words, and the embedding dimensions are then scored to produce hidden dimensions (i.e., word embeddings) that maximize the probability that a word is predicted given its surrounding words or that surrounding words are predicted given a single word (Mikolov et al., 2013; Pennington et al., 2014). Resulting word vectors can then be used to reflect the similarity of words as a function of how close their vectors are to one another.
Some of the benefits of using embeddings for these purposes include (a) that embeddings are contextualized to capture semantic meaning, (b) pretrained embeddings already exist for use (therefore precluding the need to train custom embeddings when samples are not large), and (c) pretrained embeddings are flexible across contexts such that newly occurring words that are not present in the local training corpus can still be used in analyses (Rudkowsky et al., 2018). Research has also applied embeddings to sentiment tasks (Rudkowsky et al., 2018).
In this study, 300 pretrained GloVe embeddings taken from 42 billion tokens across Common Crawl (Pennington et al., 2014) were used. These embedding vectors were trained across years of web page data. Although it is possible to train custom embeddings on local data, this approach resulted in worse performance for this study’s corpus. To apply the GloVe pretrained embeddings, document term matrices from the current data collection were first formed, with cells representing total counts, and then these vectors were standardized. The product 8 of the local document term matrix with the pretrained word-by-embedding matrix was calculated, which produces an embedding vector score for each of the 300 dimensions for each narrative. Scores were controlled for total words to make the output generalizable to various lengths of text. Note that a vector that represented document word count was also added to these matrices, as before. Like for traditional BOW and contextualized n-gram scores, this set of input features was used to predict matched numerical ratings using random forests. The same step-approach to determine the optimal number of predictors and the same random forests settings were used.
Composite valence scores
Composite valence scores were formed by unit-weighting the traditional BOW scores, contextualized n-gram scores, and word embedding scores. This is an ensemble model, which combines predicted scores from multiple algorithms. This in effect averages or cancels out the inefficiencies or biases from each individual algorithm, thus resulting in improved prediction (Berk, 2016). Created composite valence scores were transformed to scores with M = 100 and SD = 10 based on Sample 1 data for ease in interpretability. The normative values from Sample 1 were then used to transform scores for Samples 2 and 3.
Sample 2
Sample 2 consisted of employed undergraduates at a large Midwestern United States university who made upward ratings of their managers as part of this study. To be eligible, participants had to work at least 20 hours per week and be employed at their job for at least 3 months. Participants were provided a brief overview of the concept of PAs. They were then led through the same procedure as in Sample 1. However, ratings were directed toward their immediate supervisor. Like in Sample 1, efforts were made to increase purposeful responding by making gift card drawings contingent on the quality of responses. Then, the data were reviewed for meaningful text entry and completion times. The final sample consisted of 110 employees making ratings of their managers; 63% of the participants were White and 84% were female. Average job tenure was 1.28 years. Forty-one percent worked in companies with less than 50 people, and the average age was 20 years.
Measures, natural language processing, and scoring
Employees performed the exact same survey task as in Sample 1, with the exception that they rated only one employee (i.e., immediate supervisor). Traditional numerical ratings were made for each of the Great 8 dimensions and then for overall job performance, and individual narrative prompts were presented for each. Thus, this was the exact same survey design as Study 1 except that ratings were upward. The only other difference from Sample 1 was that the character count requirement was removed such that respondents only had to provide at least one character per prompt (as opposed to the 200-character count required in Sample 1). Like in Sample 1, narratives to all prompts were combined into a single block of text for each person rated. After these data were aggregated, traditional BOW scores, contextualized n-gram scores, and word embedding scores were calculated using the formulas derived in Sample 1, and these were combined into ensemble composite valence scores.
Sample 3
The Sample 3 context was the same as Sample 2 in that respondents were employed undergraduates at a large Midwestern United States university who worked 20 hours per week and had been at their job for at least 3 months. Upward ratings were made of those employees’ immediate supervisors. As in previous samples, rewards were made contingent on purposeful responding, and the data were thoroughly reviewed after collection. The sample consisted of 135 participants; 59% were White, and 83% were female. Average job tenure was 1.16 years. Forty-one percent worked in companies with less than 50 people. Average age was 21 years.
Measures, natural language processing, and scoring
The setting and instructions for Sample 3 were identical to Sample 2 besides the manipulation of survey design. Instead of using targeted text prompts for each Great 8 dimension, participants were provided a single text box at the end of the survey with the instructions, “Use the text box below to describe the employee’s performance.” Besides this, participants provided Great 8 and overall numerical ratings in the same manner as the other samples. Like in Sample 2, there was no minimal character requirement. Traditional BOW scores, contextualized n-gram scores, and embedding scores were calculated using the formulas derived in Sample 1, and these were combined into ensemble composite valence scores.
Results
To help orient readers, Table 1 provides a summary of research questions, operationalizations, and general study findings.
Summary of Results.

Note: Subscript “a” indicates that composite valence scores were used to summarize results. NLP = natural language processing; BOW = bag of words.
Validity for Downward Judgments (Sample 1)
The average intercorrelation among the Great 8 numerical ratings for downward judgments was .51, and a single factor explained 57% of the variance. This is typical for performance ratings (Viswesvaran et al., 2005), in that there often exists a strong general performance factor. Given that the valence scores were developed based on these same numerical ratings, the developed valence scores should likewise demonstrate strong intercorrelations. Indeed, the average correlation between developed composite valence scores was .70, and a single factor explained 74% of the variance. This is noticeably high. When unidimensional models were fit for each set of judgments (valence scores, numerical ratings) and then the factor loadings were held constant to test metric invariance (e.g., Vandenberg & Lance, 2000), a significant difference in model fit was observed, χ2(7) = 22.67, p < .01. This suggests there are differences in the pattern of relations for NLP-derived valence scores and traditional numerical ratings, resulting in questionable evidence of factorial validity (Research Question 3). Looking more closely, the degree of general performance variance differed by NLP method, with traditional BOW and word embedding scores exhibiting larger amounts of variance attributable to a single factor (77%, 82%). On the other hand, contextualized n-gram scores demonstrated greater differentiation, with a single factor only explaining 36% of the variance.
Table 2 displays correlations between NLP-derived valence scores and independent, human-generated ratings of the narratives as a form of alternate forms reliability (Research Question 1). A random subset of 50 narratives was drawn and rated by human coders. The coders were the author and industrial and organizational psychology graduate students who had experience reviewing narrative performance text. Two randomly selected raters from a pool of five were assigned to rate each narrative according to the Great 8 and overall performance (Sample 1 intraclass correlation coefficient [ICC 1,2] = .86). The entire block of all ratee text was aggregated to make the judgments. The average correlation between NLP-derived valence scores and human-generated ratings in Sample 1 was .64 for dimension-specific composite valence scores (Table 3), and it was .70 when using overall performance judgments. Thus, NLP-derived scores exhibited convergence with human ratings of the same text even though the scores were not developed to predict judgments from independent human raters.
Correlations Between Narrative Scores and Independent Human-Generated Ratings of Narrative Text.

Note: Narrative scores were keyed on traditional numerical ratings (i.e., rater judgments), and shown are correlations for the composite valence scores. For this analysis, human-generated ratings were made for a random subset of 50 narratives in each sample. All correlations are p < .05.
Table 3 shows correlations between developed valence scores and traditional numerical ratings in Sample 1. Convergence between these two data sources was strong. For composite valence scores, the average correlation with aligned Great 8 numerical ratings was .52 and ranged from .49 to .58. When all performance ratings were combined into an overall performance composite and an ensemble valence score was created based on that composite, the correlation between those scores and overall performance was .68, which is similar to the estimate found by Speer (2018) in predicting overall ratings.
Table 3 also shows the average correlation with nonaligned numerical ratings. Because of the general factor affecting performance-related variance, it was expected that the valence scores would exhibit moderate to strong correlations with nonaligned dimension ratings but that these correlations would be weaker than construct-aligned, convergent correlations. The average correlation with nonaligned dimensions (discriminant correlations) was .45, which was significantly weaker than the average convergent correlation (Hotelling t = 2.48, p < .05, Research Question 2), providing further evidence of construct validity. However, it is debatable whether the difference in correlational magnitude is practically large.
Valence Score Correlations With Downward Ratings (Sample 1).
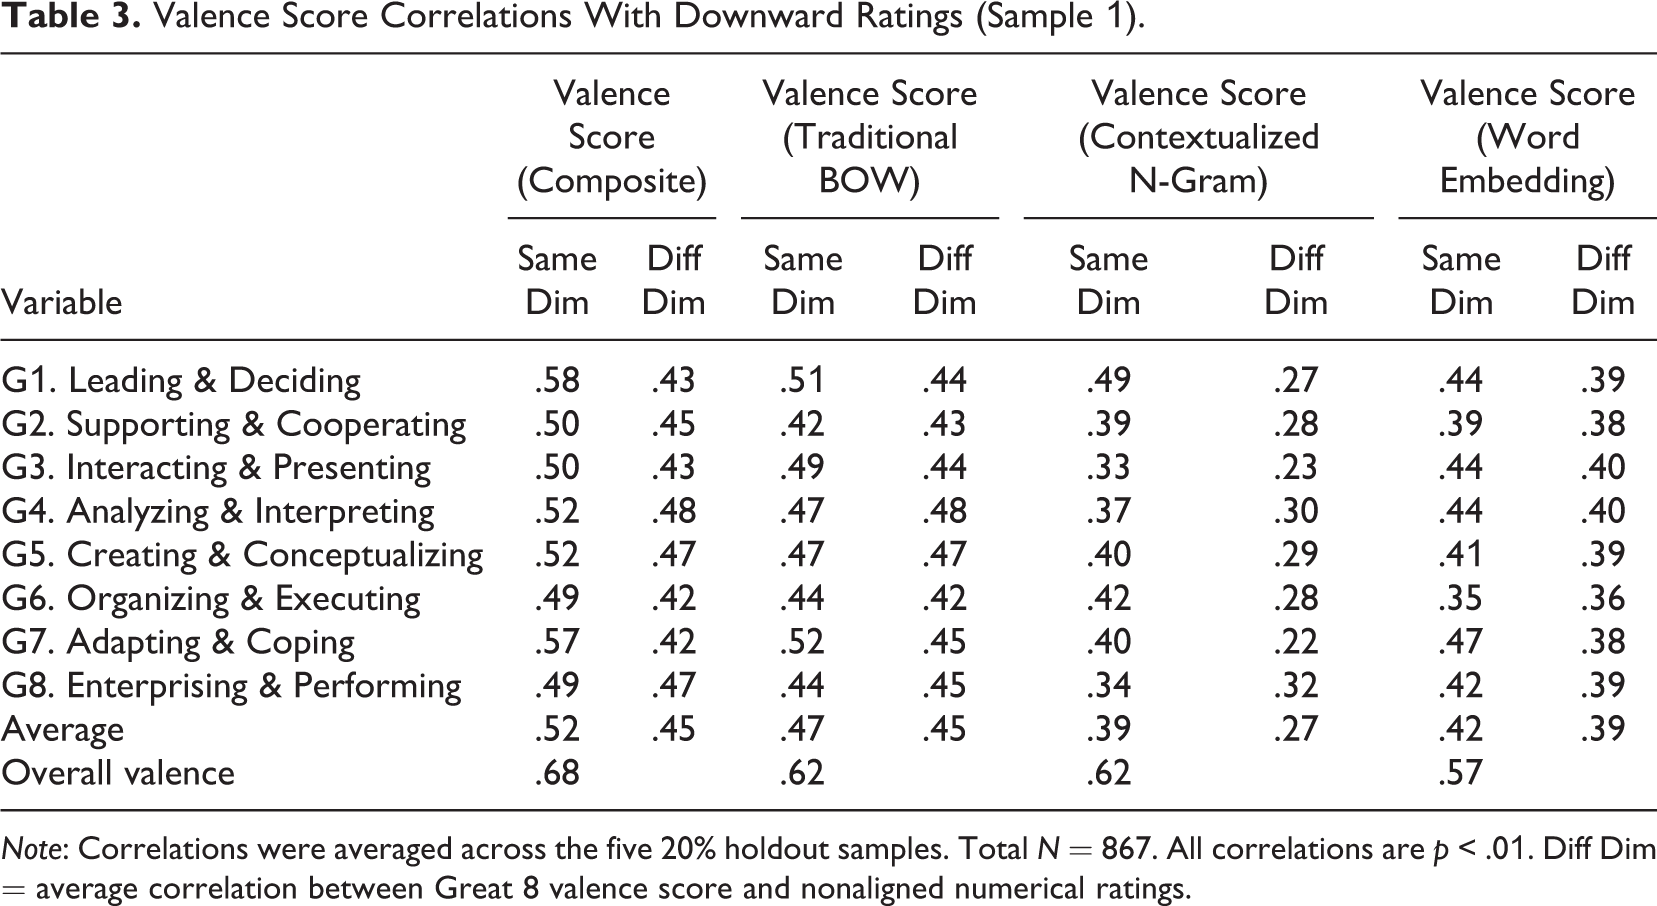
Note: Correlations were averaged across the five 20% holdout samples. Total N = 867. All correlations are p < .01. Diff Dim = average correlation between Great 8 valence score and nonaligned numerical ratings.
There are several additional noteworthy findings to point out when considering the NLP-scoring methods separately (Research Question 4). First and not surprisingly, combining the three NLP estimation methods into composite ensemble scores increased convergent validity. Second, the average convergent correlation for scores derived from the three NLP methods differed, with contextualized n-gram (.39) and word-embedding methods (.42) exhibiting similar levels of convergence with numerical ratings, whereas traditional BOW exhibited the highest average convergent correlations (.47). However, scores produced via the traditional BOW and word embedding methods demonstrated considerably less discrimination in that the average nonaligned correlation was .45 for traditional BOW and .39 for word embeddings. On the other hand, scores derived via the contextualized n-gram method showed more discrimination, with the average nonaligned correlation being .27. These findings are not entirely surprising given that the contextualized n-gram method used different inputs for each Great 8 dimension, whereas the traditional BOW and word embedding methods did not. Still, it raises concern over the ability of traditional BOW and word embedding derived scores to properly discriminate. The contextualized n-gram method was the only NLP method with significantly larger convergent correlations than discriminant correlations (t = 3.87, p < .01).
Generalizability of Upward Judgments Using Same Survey Design (Sample 2)
The Great 8 valence scores developed in Sample 1 were then applied to Sample 2, which had the same survey design for each of the Great 8 and overall performance. However, unlike Sample 1, performance judgments were upward, such that raters assessed their immediate supervisor (Research Question 5). The average correlation between NLP-derived valence scores and human-generated ratings was .66 (Table 1), and it was .84 when using overall judgments. These values are consistent with Sample 1. Also like in Sample 1, the composite valence scores once again exhibited a strong general factor (73%). However, a unidimensional metric invariance test comparing valence scores to numerical ratings showed that the dimension loadings were not significantly different across measurement formats, χ2(7) = 8.58, p > .05, lending some support for factorial validity in Sample 2.
Convergence with traditional numerical ratings was also strong (Table 4), with an average convergent correlation of .53 for individual dimensions and a correlation of .71 for overall valence scores. Furthermore, average discriminant validity was also .45, like Sample 1. However, given the small sample size, the difference in these correlations was not statistically significant (t = 0.82, p > .05). Nonetheless, the pattern of correlations was near identical to Sample 1, providing evidence that the algorithms generalize to different rating sources.
Valence Score Correlations With Upward Ratings and Same Survey Design (Sample 2).

Note: Total N = 110. r ≥ .23, p < .01; r ≥ .16, p < .05. Diff Dim = average correlation between Great 8 valence score and nonaligned numerical ratings.
When examining results for the different NLP methods, there were clear differences in construct validity. The traditional BOW method exhibited the largest average convergent correlations (.50) compared to contextualized n-gram (.38) and the word embedding method (.37). Like Sample 1, the traditional BOW (.46) and word embedding (.34) methods exhibited poor construct discrimination, with ratios of convergent to discriminant correlations of only 1.08 and 1.08. On the other hand, discrimination for the contextualized n-gram method was much better (.27), as reflected by the ratio of convergent to discriminant correlations (1.42).
Generalizability of Upward Judgments Using Different Survey Design (Sample 3)
Sample 3 was a “strong” test of the generalizability of the developed algorithms (Research Question 5) because the sample differed in rating source (upward) and used a different survey design to elicit narratives. Regarding this last point, Sample 3 had employees upwardly rate their managers using just a single overall comment box. Not surprisingly, this resulted in respondents providing less text, with the mean words per employee review being 67, compared to 199 for Sample 2. 9 As will be later discussed, this also resulted in different writing tendencies.
Convergence between NLP-derived valence scores and independent, human-generated ratings (average ICC 1,2 = .74) averaged .44 for Great 8 dimensions. However, overall judgments converged with a .76 correlation. Thus, NLP-derived scores and human judgments were in agreement when assessing overall performance but less so when measuring specific performance dimensions. The composite valence scores also exhibited a strong general factor (73%), although a unidimensional metric invariance test comparing valence scores to numerical ratings showed that the dimension loadings were not significantly different across measurement formats, χ2(7) = 6.00, p > .05. This supports the factorial validity of the valence scores.
Convergent validity between composite valence scores and traditional numerical ratings was noticeably lower in Sample 3 (Table 5), with an average convergent correlation of .32 for individual Great 8 dimensions and a correlation of .47 for overall composite valence scores. Although these values are lower than Samples 1 and 2 (Research Question 5), which used targeted text prompts, there was still a moderate level of convergence per conventional correlational benchmarks (Cohen, 1988). On the other hand, discriminant validity was nearly nonexistent, with an average discriminant correlation of .31, which was nearly identical to the average convergent correlation (t = 0.13, p > .05).
Valence Score Correlations With Upward Ratings and Different Survey Design (Sample 3).

Note: Total N = 135. r ≥ .21, p < .01; r ≥ .15, p < .05. Diff Dim = average correlation between Great 8 valence score and nonaligned numerical ratings.
Looking at the NLP estimation methods separately, the traditional BOW method once again exhibited the highest convergent correlations (.36). However, this method and the word embedding method each exhibited poor discrimination. The contextualized n-gram method had lower convergent validity (.21) than the traditional BOW approach and yet exhibited better discrimination (.14), with a convergent to discriminant correlation ratio of 1.46. Given the findings collectively, results across the three studies were explored in more detail for moderators.
Moderation of Valence Score and Rating Convergence
Tables 6 and 7 provide data on how writing tendencies and convergence of the derived scores varied by sample conditions, by the usage of dimension-related words (i.e., from theme scores), and by word count. Addressing dimension-related word usage first, the theme scores developed by Speer et al. (2019) and then tweaked in this study indicate whether text is likely to describe a given Great 8 dimension. It is probable that valence scores will be less accurate in narratives that fail to use dimension-specific language (i.e., not use words from a given dimension’s dictionary). As shown in Table 6, nearly every narrative in Sample 1 used an aligned word from the dictionary (M for dimensions = 97%). This is not surprising because the prompts were narrow and targeted and respondents were required to provide at least a minimal amount of text for each text box. Sample 2 also revealed high usage of dimension-related words (M for dimensions = 83%), although less than in Sample 1, likely due to a lack of requirement for text amount. Finally, dimension-related word usage was less frequent in Sample 3, with the typical dimension being described in only 46% of narratives. For some dimensions, description frequency was high, such as for Leading & Deciding (80%). On the other hand, Adapting & Coping was only described 18% of the time. These differences are likely due to using broader text prompts, which exert weak situational press to describe specific dimensions. However, Leading & Deciding is logical for raters to describe in text given that these were upward ratings.
Word Count, Dimension-Related Word Usage, and Valence Statistics Across Samples.

Note: Ns = 867, 110, and 135 for Samples 1 through 3. G1 through G8 reflect the Great Eight Dimensions, where G1 = Leading & Deciding, G2 = Supporting & Cooperating, G3 = Interacting & Presenting, G4 = Analyzing & Interpreting, G5 = Creating & Conceptualizing, G6 = Organizing & Executing, G7 = Adapting & Coping, and G8 = Enterprising & Performing. Sample 1 required a minimum character count for responses to each Great 8 dimension (200 characters per), whereas the other samples did not use any minimum text requirement.
Convergent Correlations by Theme Presence and Word Count.

Note: Convergent correlations are the average correlation between Great 8 valence scores and aligned numerical ratings. For theme word splits, N for each partition differed based on the Great 8 dimension in question. As such, average Ns are shown. Word count splits varied based on sample and were set with low < 33rd percentile (348, 136, and 37 words for Samples 1-3). The moderate split ranged from the 33rd to the 66th percentile. The high split was above the 66th percentile (404, 226, and 74 words for Samples 1-3). Sample 1 required a minimum character count for responses to each Great 8 dimension (200 characters per), whereas the other samples did not use any minimum text requirement.
*p < .05.**p < .01.
Differences in dimension-related word usage are especially important if they affect the validity of derived valence scores. Table 7 demonstrates how this might impact scores. In all three samples, composite valence scores from narrative reviews that did not contain dimension-aligned word phrases exhibited worse convergence with their aligned numerical ratings, with average correlations of .43, .34, and .29 in Samples 1, 2, and 3, and a sample-weighted average of .32. On the other hand, composite valence scores from narratives that did contain dimension-aligned words averaged much stronger convergence; across samples, the sample-weighted average was .51. Additionally, the amount of produced text was different when numerous narrow prompts were used (Sample 2) versus when there was a single comment box (Sample 3). This may be important given that narratives with less text generally demonstrated weaker convergent correlations, as shown in Table 7.
Several post hoc attempts were performed to address narratives with less text and a lack of dimension-related word usage, but none were ultimately satisfactory. First, it was assumed that the contextualized n-gram scoring method would be impacted most by having less text because if a dimension-aligned word is not discussed, that narrative review will have scores of zero for all document term matrix inputs. However, a post hoc examination revealed that all NLP scoring methods were similarly affected by lower word counts. Theme word presence was examined next. When theme-related words were not present in a narrative, contextualized n-gram scoring’s validity necessarily became zero. On the other hand, theme phrase presence had minimal effects for traditional BOW and word embedding methods. Thus, an attempt was made to therefore only use contextualized n-gram scoring within the ensemble scores for people who used dimension-aligned text. For those who did not, only the traditional BOW and word embedding estimates were combined. Beyond issues of possible homoscedasticity of the derived scores, this approach failed to result in improvements in convergent correlations. Thus, although the presence of theme phrases impacted findings, there was no clear solution that greatly improved construct validity.
Discussion
This study advances methods in organizational research by detailing the development of NLP scoring for performance narratives and by investigating the validity of the derived scores. The scores were formed using several NLP methods and were validated by examining convergent and discriminant correlations across three samples. Furthermore, this study demonstrated how developed NLP algorithms might generalize to different types of PA contexts and survey designs. Taken together, this research revealed some encouraging findings regarding the applicability of these valence algorithms to future performance contexts, while at the same time highlighting concerns. In the paragraphs that follow, I recap the study’s overall findings while simultaneously highlighting study limitations and areas for future research.
First, the developed algorithms converged with human-generated ratings of the narrative text. They also demonstrated evidence of validity across several samples. The magnitude of convergent correlation with aligned numerical ratings was generally satisfactory, and convergent correlations were larger than discriminant correlations, although for some cases the difference was not large. The strong dimension convergence was impressive given that the dependent variable for each dimension was a single numerical rating that only ranged from 1 to 5. If full scales for each Great 8 dimension had been used (highlighting a weakness of this particular study), the resulting outcome variables would have had more variance, been more reliable, and likely found even stronger levels of convergence. Regardless, this study’s construct validity evidence suggests these algorithms will capture dimension-related variance in new settings. However, the degree of algorithm generalizability may differ by context.
This study examined how rating source and survey design affect generalization. The valence algorithms were built to predict performance for downward ratings, but Sample 2 demonstrated that the dictionaries generalize to contexts where judgments are made from sources besides one’s supervisor. In this study, upward judgments of one’s manager exhibited similarly high levels of convergence and similar levels of discriminant validity. On the other hand, there were moderate differences as a function of survey design. Brutus (2010) described how broad, general prompts like those used in Sample 3 offer less guidance for how respondents should behave, whereas specific, narrow prompts (used in Samples 1 and 2) direct the rater regarding how to provide information. This study found that algorithms developed using responses from narrow prompts generalized worse when applied to surveys that used only a single broad comment box. When only a single text box was used that asked raters to “use the text box below to describe the employee’s performance,” written text was shorter, reflected fewer dimensions, and converged less with aligned numerical ratings. These findings cast some doubt regarding the generalizability of the valence scores to surveys that only include a single broad prompt. If the goal is to produce highly accurate narrative scores for specific dimensions, it may be necessary to use similar survey designs when measuring the intended constructs. More research on this assumption using different survey designs and constructs is warranted.
Of course, there may be other statistical ways to improve estimates. Although the developed algorithms converged well when conditions were ideal (i.e., when the same survey design was used), alternate algorithms might possibly generalize better. For example, Socher and colleagues (2013) applied recurrent neural networks to estimate the sentiment of short movie review phrases. Additionally, alternative word representations such as embeddings from language models (i.e., ELMO, Peters et al., 2018) might be considered in future research because these algorithms more thoroughly take into account the context of words. Methods that apply deep recurrent neural networks, which are more capable of modeling the sequence of written language, may result in improved performance estimates. Thus, future research should investigate whether different NLP algorithms improve Great 8 valence estimates.
Additional Considerations
Readers might also wonder what level of correlation is expected between narrative scores and numerical ratings, and the answer is not a simple one. It is dependent on the context and the outcome being measured. Take, for instance, the situation where a researcher is interested in predicting personality, or a person’s pattern of thoughts, behaviors, and emotions. Personality constructs are representative of a large collection of behaviors over time, and there is unlikely any piece of text that would capture enough information to accurately depict the entirety of this variance. For example, short text blocks from open-ended situational judgment test responses correlate around .25 in predicting the five factor model traits (Thompson, Koenig, & Liu, 2019). The low to moderate values are not surprising given that information elicitation is very narrow; it reflects how a person would behave in only a few situations. This is in juxtaposition to most personality surveys, which ask respondents questions about typical behaviors over many situations (e.g., “I enjoy being around other people”). However, even when using text that spans a greater time frame of a person’s life, correlations between NLP-derived scores and survey-derived personality scores are not incredibly large, as shown by a study of Facebook posts by Schwartz et al. (2013). In that study, which spanned across many social media posts and thousands of words per participant, convergence ranged from .31 to .42 in the prediction of five factor model personality scores.
Within a performance context, the appropriate frame of reference is not entirely clear because the two mediums (narratives, ratings) elicit different types of information and serve different purposes. As elaborated on by Brutus (2010) and Speer (2018), narratives will capture unique information that traditional ratings do not. In a PA context, ratings are often tied directly to administrative outcomes (e.g., pay, promotion eligibility) and thus signal contingent rewards. Narratives might be used for justification for these ratings or outcomes, but they might also be used to motivate respondents, indicate areas for improvement, and elaborate upon the rating scale. Thus, the measurement methods may differ in intent, in which case, convergent correlations would be expected to be lower.
In a roundabout way then, the expected level of convergence with traditional numerical ratings is unclear. Absent of contextualization in terms of how derived narrative scores are to be used, it seems reasonable to adopt the commonly applied 0.1 (small), 0.3 (medium), and 0.5 (large) benchmarks imposed by Cohen (1988), with satisfactory model performance occurring when estimates converge with at least moderate to large correlations. However, if narratives scores are used for decision-making, the threshold likely needs to be raised and must be considered in line with whatever other reliability, validity, and adverse impact information can be established.
Finally, there were other study limitations that have yet to be discussed. Although the study was focused on measurement using narratives, data were collected for research purposes, and so the judgments were not taken from an operational setting. This is certainly a weakness of the study. However, it is unlikely that specific PA language would vary greatly between research and applied contexts; in fact, this study showed that the Speer et al. (2019) Great 8 word phrases, which were derived from an operational setting, were in fact used quite often in this research setting. As such, the generalizability of the developed algorithms is unlikely to be greatly affected by this difference in context. If anything, operational judgments conducted in real-world organizational settings are likely to be more intentional (i.e., less nonpurposeful responding) because the ratings managers make are seen by employees and inform administrative decisions, 10 and as such the narratives and numerical ratings would contain less random error. This would suggest greater convergence between narrative scores and numerical ratings in operational settings. Nonetheless, this is an empirical question that should be examined.
This study was also mostly agnostic toward industry or job level. Whereas Sample 1 used managers as respondents, these employees could have varied by managerial level, type of managerial work, and more importantly, the type of employees they were supervising. The language used to describe work will likely differ based on the job in question. Likewise, Samples 2 and 3 included employees of any type of job. Thus, this research failed to tackle potential nuances in language that might differ across jobs. At the same time, the intent of the dictionaries is generalizability, and thus, a design using ratees of diverse positions fits within the ultimate research goals. Future researchers should investigate differences in PA language across jobs.
Conclusion
NLP-based analyses allow researchers to better utilize qualitative text, which in combination with traditional measurement methods (e.g., surveys), can help researchers better understand organizational phenomena. This study advanced our understanding of NLP in organizational contexts, and particularly within the domain of PAs. This in turn helps facilitate new research and theory development. Although results were generally favorable for the created Great 8 algorithms, findings also portray a cautionary tale around some of the boundary conditions that are likely to impact the generalizability of derived scores. Thus, although this study provides evidence supporting the use of these algorithms in future contexts, careful consideration must be made as to how text is collected and what the scored narratives will be used for.
Supplemental Material
Supplemental_Materials_A_-_inter_correlation_matrices - Scoring Dimension-Level Job Performance From Narrative Comments: Validity and Generalizability When Using Natural Language Processing
Supplemental_Materials_A_-_inter_correlation_matrices for Scoring Dimension-Level Job Performance From Narrative Comments: Validity and Generalizability When Using Natural Language Processing by Andrew B. Speer in Organizational Research Methods
Footnotes
Declaration of Conflicting Interests
The author(s) declared no potential conflicts of interest with respect to the research, authorship, and/or publication of this article.
Funding
The author(s) received no financial support for the research, authorship, and/or publication of this article.
Supplemental Material
Supplemental material for this article is available online.
Notes
References
Supplementary Material
Please find the following supplemental material available below.
For Open Access articles published under a Creative Commons License, all supplemental material carries the same license as the article it is associated with.
For non-Open Access articles published, all supplemental material carries a non-exclusive license, and permission requests for re-use of supplemental material or any part of supplemental material shall be sent directly to the copyright owner as specified in the copyright notice associated with the article.