
Abstract
Forced-choice (FC) measurement has become increasingly popular due to its robustness to various response biases and reduced susceptibility to faking. Although several current Item Response Theory (IRT) models can extract normative person scores from FC responses, each has its limitations. This study proposes the Generalized Thurstonian Unfolding Model (GTUM) as a more flexible IRT model for FC measures to overcome these limitations. The GTUM (1) adheres to the unfolding response process, (2) accommodates FC scales of any block size, and (3) manages both dichotomous and graded responses. Monte Carlo simulation studies consistently demonstrated that the GTUM exhibited good statistical properties under most realistic conditions. Particularly noteworthy findings include (1) the GTUM's ability to handle FC scales with or without intermediate statements, (2) the consistently superior performance of graded responses over dichotomous responses in person score recovery, and (3) the sufficiency of 10 mixed pairs to ensure robust psychometric performance. Two empirical examples, one with 1,033 responses to a static version of the Tailored Adaptive Personality Assessment System and the other with 759 responses to a graded version of the Forced-Choice Five-Factor Markers, demonstrated the feasibility of the GTUM to handle different types of FC scales. To aid in the practical use of the GTUM, we also developed the R package “fcscoring.”
The Likert rating scale is undoubtedly the most widely used format to assess organizationally relevant constructs for its relative ease of development, administration, and scoring. Each time, respondents are presented with a single statement and are asked to indicate their absolute degree of agreement with it on a graded scale (e.g., 1 = “Strongly disagree”; 2 = “Disagree”; 3 = “Agree”; 4 = “Strongly agree”). However, this format has long been criticized for its susceptibility to various response biases (Podsakoff et al., 2003; Zettler & Lang, 2015; Zettler et al., 2016) and faking (Hu & Connelly, 2021; Speer et al., 2023; Sun et al., 2022; Zickar & Drasgow, 1996; Zickar et al., 2004), which threatens the validity of scores derived from such a format.
To overcome these issues, researchers in the US Army first developed the forced-choice (FC) format (Sisson, 1948). FC scales show respondents a block of at least two statements measuring different latent factors. When there are two statements per block, respondents are required to
However, the dichotomous FC format discussed above is not without issues. First, scores derived from such scales are often less reliable than Likert rating scales with identical statements because dichotomous responses offer more limited information (Brown & Maydeu-Olivares, 2011; Bürkner, 2022). Second, people may respond unfavorably to such a dichotomous FC format because they are forced to make decisions even if the statements within a block are similarly like/unlike them (Dalal et al., 2021). Lower reliability and less favorable respondent reaction will likely reduce the validity of scores derived from FC scales and further threaten the accuracy of decisions based on these scores. To address these issues, Brown and Maydeu-Olivares (2018) introduced the graded FC format. Instead of choosing between two statements (1= “A describes me better”; 2 = “B describes me better”), respondents can indicate the degree to which they prefer one statement over the other (e.g., 1 = “A describes me
Given the variety of block sizes and response formats (PICK, MOLE, RANK, and graded) and that each has unique advantages, it would be beneficial to have a versatile psychometric model capable of handling all variants. This would enable FC users to rely on a unified framework to model responses to various FC scales so that researchers can directly compare across different FC scales. It is also essential for the psychometric model to accurately depict the underlying response process (see detailed discussion below), as using a scoring model that misaligns with the underlying response process can lead to detrimental effects (Nye et al., 2020; Tay & Drasgow, 2012). However, as will be elaborated on later, the two main psychometric models for FC responses, namely the Multi-Unidimensional Pairwise Preference Model (MUPP; Stark et al., 2005) and the Thurstonian Item Response Theory Model (TIRT; Brown & Maydeu-Olivares, 2011), and their extensions, are limited in certain aspects. The MUPP model is currently restricted to handling FC scales with a block size of two and the dichotomous response format. The GGUM-RANK model (Lee et al., 2019), an extension of the MUPP model, can accommodate FC scales of any block size (e.g., pairs, triplets, quadruplets). Yet, it does not apply to the graded FC format. The TIRT model can handle FC scales of any block size and response format. However, it assumes that individuals respond to statements using a dominance response process, inconsistent with many studies suggesting that the unfolding response process better characterizes how people respond to self-report assessments (Drasgow et al., 2010).
For these reasons, there is a compelling need for a more versatile psychometric model that not only consolidates the advantages of prior models but also advances beyond them. Ideally, this model (1) should adhere to the unfolding response process, (2) should be capable of handling FC scales with any block size, and (3) can model both dichotomous and graded responses. Additionally, in the context of practical considerations, improving the accessibility of the new model is a pivotal factor in ensuring ease of application by fellow researchers (Borsboom, 2006). With these considerations in mind, we present a new Item Response Theory (IRT) model that fulfills these objectives, supplemented by an accompanying R package. In doing so, we offer FC users a flexible and easily accessible tool for analyzing FC data and enhancing FC measurement. This aim aligns fundamentally with the recognized significance of measurement in organizational research (Cortina et al., 2017; Foster et al., 2017; Zickar, 2020) and the recent advocacy for novel modeling techniques in personnel assessments, and more specifically, in FC assessments (Joo et al., 2020, 2021; Speer & Delacruz, 2021).
Modeling Forced-Choice Data
Traditionally, FC scales are scored by counting how many statements of a specific trait are chosen as “most like me” after adjusting for the direction of statement wording (Baron, 1996; Meade, 2004). However, scores derived in this approach are ipsative because the sum of scores across all factors is the same for everyone. Ipsative scores are fundamentally flawed and inappropriate for between-person comparisons (Hicks, 1970), which is what personnel selection relies on. Therefore, the use of FC scales waned soon after people recognized the issue of ipsative scores. Fortunately, multiple IRT models have been developed to recover normative scores from FC data in later years. Table 1 presents a summary of key features of existing FC IRT models that are capable of producing normative scores from FC data. Among the 16 existing models, the MUPP and the TIRT models have been the most influential. Below, we will review the MUPP model and its GGUM-RANK extension and the TIRT model in detail because our new model integrates and extends their strengths.
A Summary of Existing FC IRT Models and the Current One.
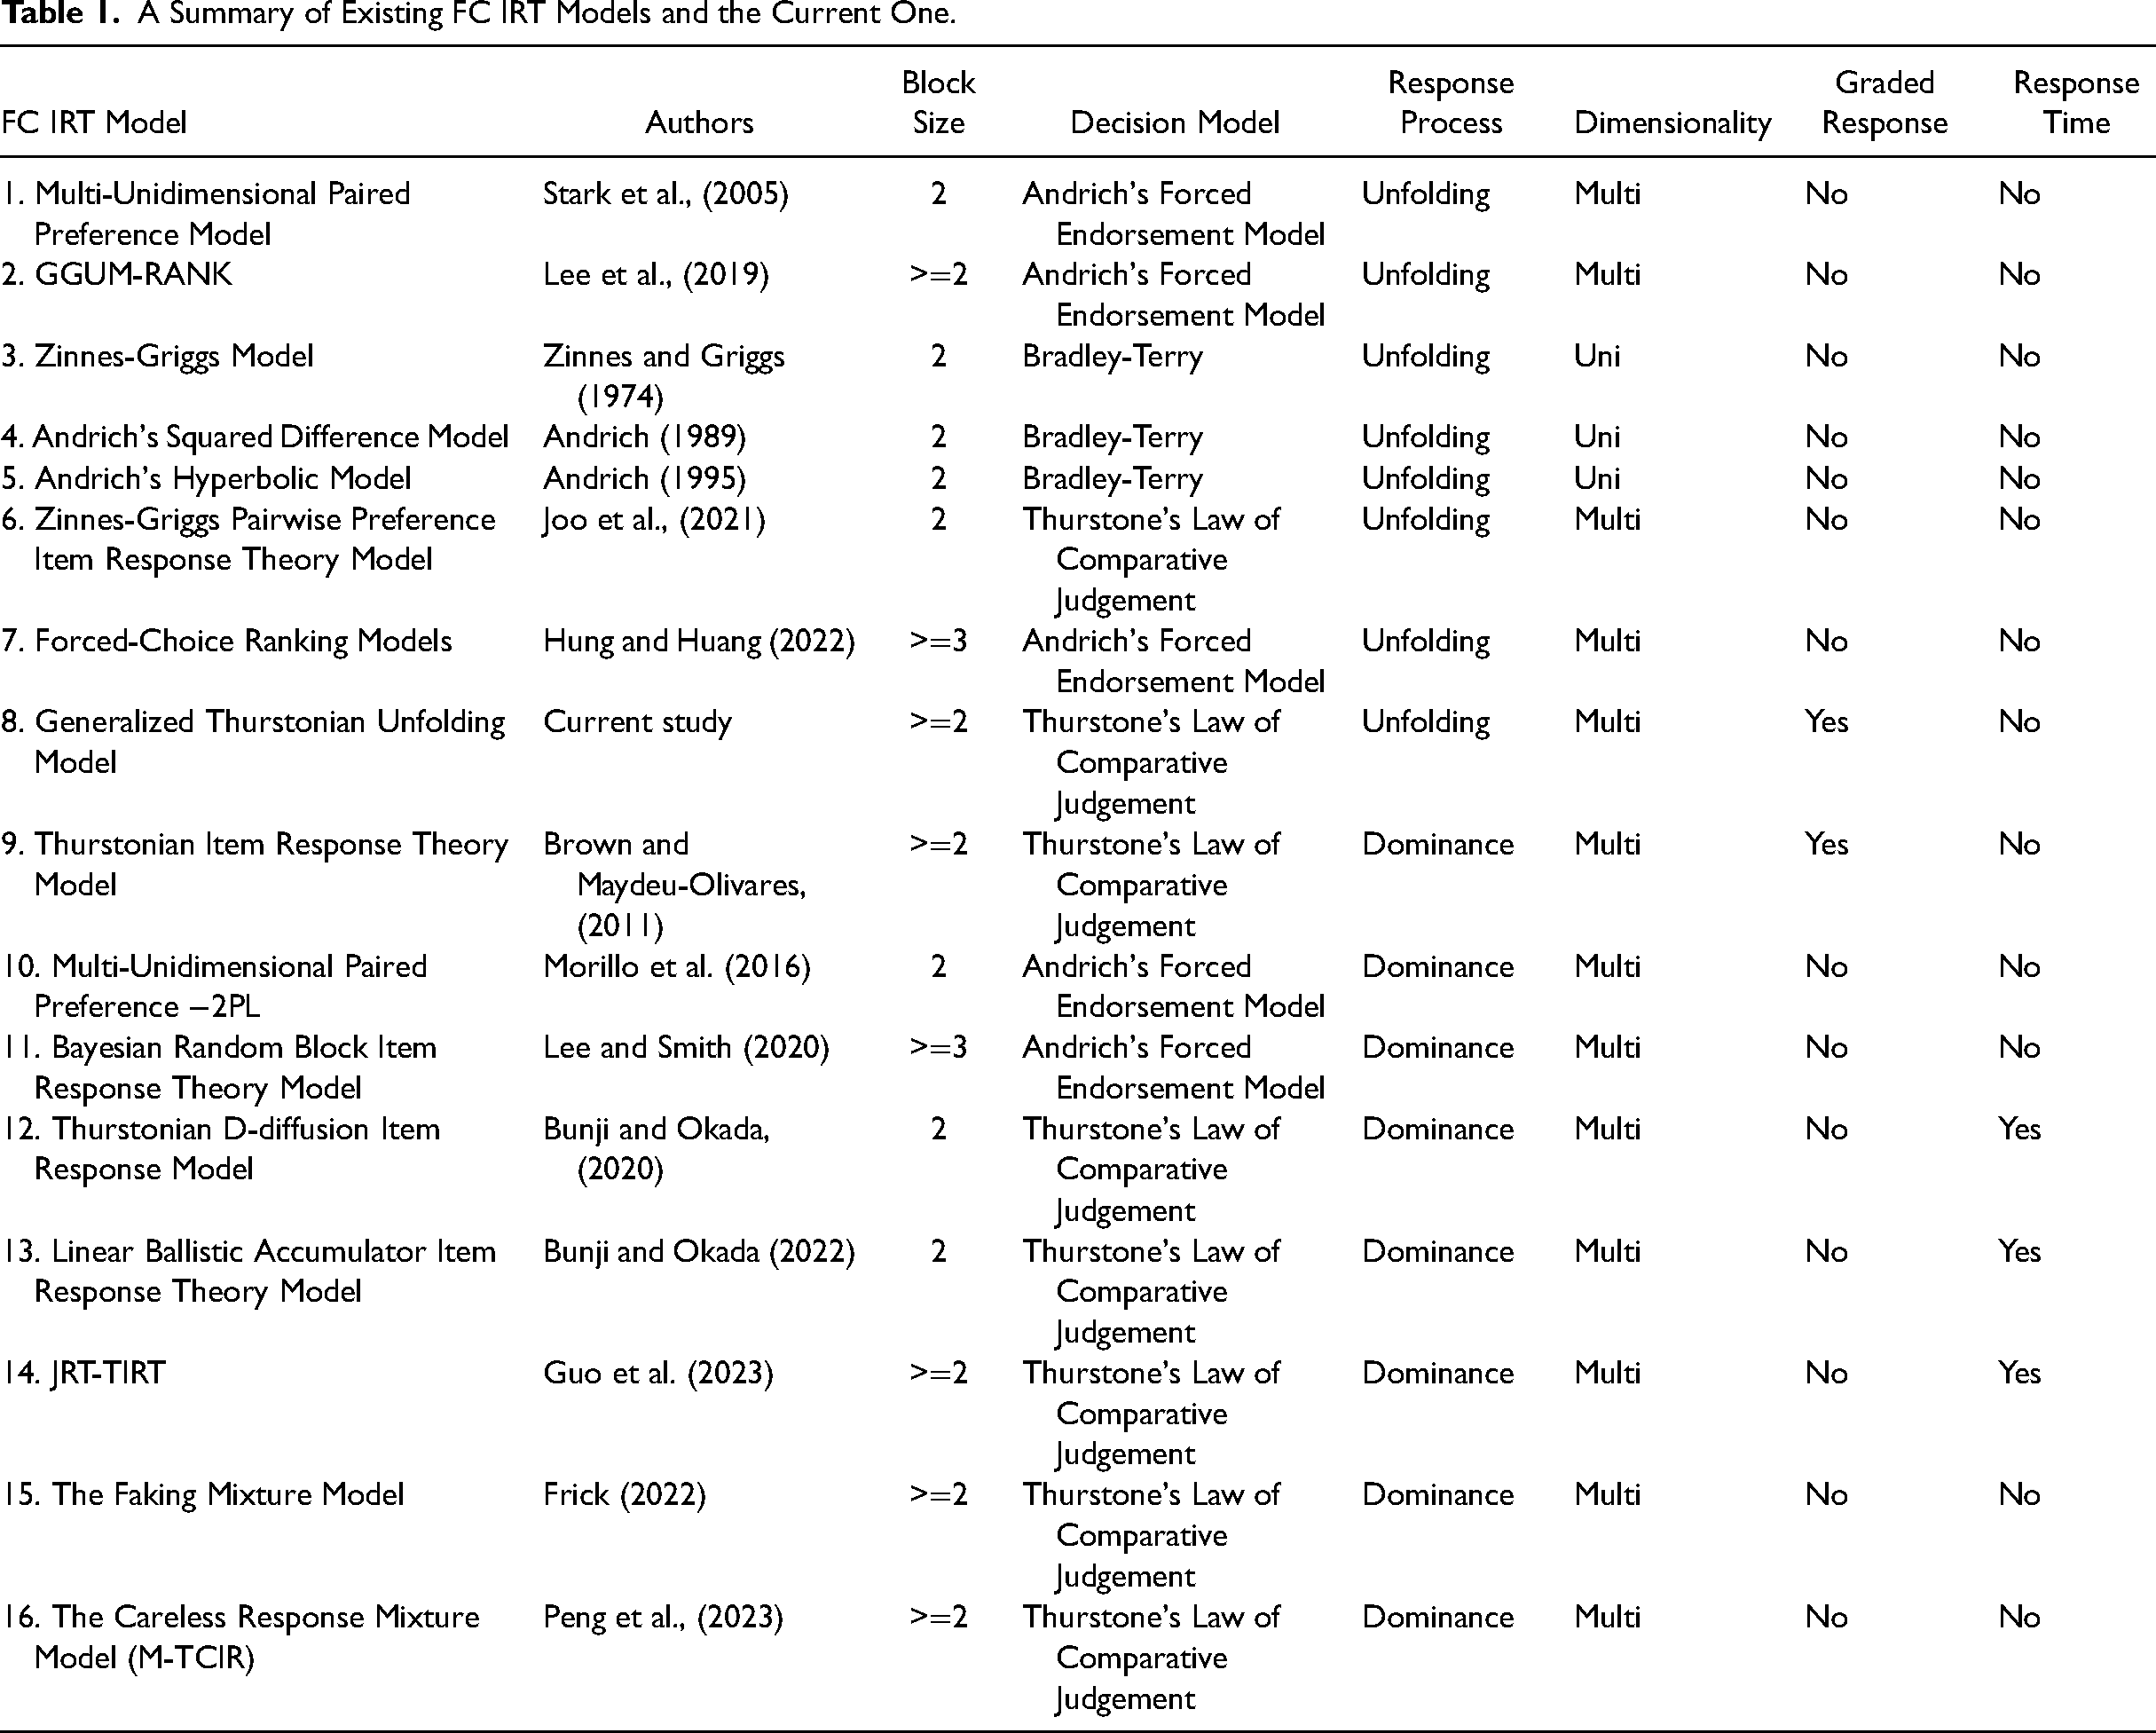
Using the framework proposed by Brown (2016), we can describe a FC IRT model along three axes: (1) the block size used, (2) the decision model for choice behaviors, and (3) the measurement model for the relationship between statements and the underlying psychological attributes. Regarding the first axis, the MUPP model can only handle FC scales with a block size of two, while the GGUM-RANK and the TIRT models work for FC scales with any block size.
Regarding the second axis, the MUPP model is built upon Andrich's Forced Endorsement model (Andrich, 1989); the GGUM-RANK model is based on an integration of Luce's Choice Axiom model (1959) and Andrich's Forced Endorsement model; the TIRT model is based on Thurstone's Law of Comparative Judgement (Thurstone, 1927). Specifically, Andrich's Forced Endorsement model assumes that when presented with a pair of statements (i and k), respondents will first form a dichotomous response to each statement separately, producing 22 possible outcomes: agree with both statements (
To accommodate larger blocks, Lee et al. (2019) extended the MUPP model to the GGUM-RANK model. According to Luce's Choice Axiom, a complete ranking of K statements can be achieved by K−1 choice tasks. Specifically, it is assumed that respondents first choose one statement that is “most like me” from the K statements. Then they exclude this chosen statement and choose another one that is “most like me” from the remaining K−1 statements. This process goes on until only two statements remain, and respondents make the last choice among the two. It is further assumed that these consecutive choice tasks are independent. Therefore, the probability of the complete ranking is given by the joint probability of these choice tasks. For example, the probability that person j ranks the three statements as A > B > C can be obtained as follows:


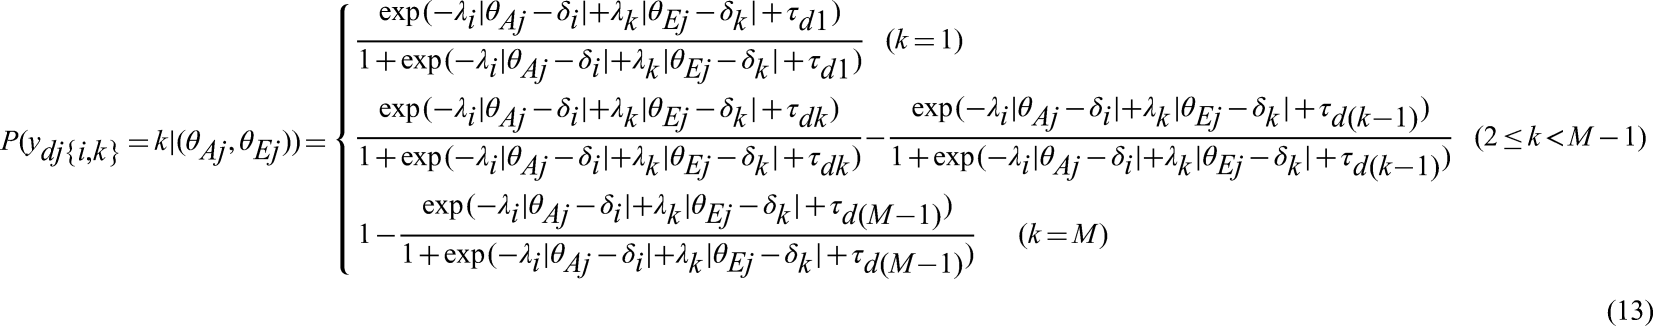
The TIRT model is based on Thurstone's Law of Comparative Judgement. Specifically, Thurstone adopted the notion of item utility and argued that it is the difference between the utilities of the two statements under comparison that determines the preference so that people will choose the statement with higher utility (Thurstone, 1927). Denote the utilities of statements i and k for person j as tji and tjk, the latent utility difference as

As for the third axis, the MUPP model and the GGUM-RANK model adopt an unfolding response process while the TIRT model assumes a dominance response process, which are two fundamentally different response processes on how people respond to statements measuring various types of constructs (Drasgow et al., 2012; Roberts et al., 2000; Tay & Ng, 2018; Zhang et al., 2020a). The unfolding response process assumes an inverse U-shaped relationship between people's latent trait levels and the probability of endorsing a statement, such that people whose standings on the latent continuum are closer to the statement's location are more likely to endorse the statement than those who are further away from the statement's location (either from above or below). For example, people who feel that they work as hard as an average person are more likely to endorse the statement “I am as hardworking as an average person,” while those who are very hardworking or lazy are more likely to reject this statement. Both the MUPP model and the GGUM-RANK model adopt the dichotomous version of the Generalized Graded Unfolding Model (GGUM; Roberts et al., 2000) to model the probability that individual j will endorse statement i:

Despite the wide use of dominance models, dozens of studies have shown that the unfolding response process better describes how people respond to measures of noncognitive constructs (Drasgow et al., 2010), such as personality (Cao et al., 2015; Zhang et al., 2020a), vocation interests (Tay et al., 2009), emotional intelligence (Cho et al., 2015), job satisfaction (Carter & Dalal, 2010), attitudes (McGrane, 2019; Roberts et al., 2000), attachment styles (Sun et al., 2021), and motivation (Freund & Lohbeck, 2021). These are typically the types of constructs to which FC measurement is applied. It has been further shown that the misapplication of dominance models to unfolding data reduces the accuracy of selection decisions (Stark et al., 2006), attenuates criterion-related validity (Sun et al., 2021), and lowers the power to detect moderation effects (Cao et al., 2018; Carter et al., 2017). This suggests that the MUPP model and the GGUM-RANK model are theoretically more appropriate for noncognitive assessment than the TIRT model because they adopt the unfolding response process. Another practical advantage of the MUPP model and the GGUM-RANK model due to the use of the unfolding response process is that they allow intermediate statements (e.g., “My extraversion is about the average level”) in addition to extreme statements (e.g., “I am very extraverted” or “I am very introverted”). While extreme statements are often socially desirable or undesirable, intermediate statements are more neutral, making them good candidates for developing faking-resistant FC scales. Besides, intermediate statements also provide more information for extreme latent trait levels (Roberts et al., 2000) and thus increase measurement accuracy for people located on the two ends, often the focus of personnel selection.
In sum, the MUPP model, though theoretically more attuned to the underlying response process, was not designed for graded responses or FC scales with larger block sizes. While the GGUM-RANK model was designed for various block sizes, it cannot handle graded responses. Further complicating its use, there is currently no user-friendly software publicly available for the GGUM-RANK model, which limits its utility for researchers. On the other hand, while the TIRT model can analyze graded responses and any block size, it assumes a dominance response process, which may not align with how individuals respond to noncognitive items. As a result, there is a need for a new model that incorporates the strengths of these existing models. This model should be able to (1) handle both dichotomous and graded responses, (2) score FC scales of any block size, and (3) accommodate the unfolding response process. Additionally, this proposed model should be supported by readily accessible software designed with user-friendly features.
The Generalized Thurstonian Unfolding Model (GTUM)
To meet the goals outlined above, we propose the GTUM to incorporate the strengths of earlier models. The GTUM is based on Thurstone's Comparative Law of Judgement (Thurstone, 1927) and adopts the same notion of item utility as the TIRT model. Therefore, the decision model for FC behavior is the same as the TIRT model, and it can handle FC scales with any block sizes and response formats (dichotomous and graded). The major difference between the GTUM and the TIRT model lies in the relationship between statements and the underlying psychological attributes. Assuming that in block d, statements i and k measure Agreeableness and Extraversion, instead of using a dominance model (Equation 9) as in the TIRT model, we use the negative Euclidean distance between person j 's trait score and the statement location to define statement utility
1
in the GTUM as


Model Estimation
While the TIRT model can be easily estimated using limited information methods, such as the unweighted least square estimators (Brown & Maydeu-Olivares, 2011, 2018) in common latent variable modeling software, the estimation of the GTUM proves to be more complex due to its inherent nonlinearity. Consequently, we opted for a Bayesian approach. This estimation method is particularly well-suited for complex models like the GTUM, as it facilitates the incorporation of reasonable priors to aid in estimation. For instance, it is straightforward to distinguish between extreme positive statements (e.g., “I am very sociable”), extreme negative statements (e.g., “I hate to be the center of attention”), and intermediate statements (e.g., “I am as talkative as an average person”). Such information can be integrated into model estimation by assigning moderately informative priors to location parameters. Furthermore, the creation of FC scales necessitates calibration studies on the psychometric properties of single statements administered in a Likert format. Statement parameters obtained from such calibration studies can also be used as priors for GTUM estimation. This approach is predicated on the assumption that statement parameters from Likert scales are moderately associated, albeit not necessarily identical, with parameters in the FC format. Therefore, they offer additional useful, though not perfectly accurate, information for the estimation of statement parameters in the FC format.
To facilitate applications of the GTUM, we developed an R package “fcscoring” that uses Stan, a probabilistic programming language for Bayesian inference and optimization (Gelman et al., 2015), as the backend estimation engine. Stan is more efficient and computationally stable for large datasets and large models because it uses the no-U-turn sampler (Hoffman & Gelman, 2014), a variant of Hamiltonian Monte Carlo (HMC; Betancourt, 2013). HMC produces posterior samples that have lower autocorrelation than other MCMC algorithms, thus substantially reducing the number of iterations and improving efficiency. The R package only requires users to input raw data. It allows users to customize priors for all model parameters. We also provide several functions to facilitate model diagnostics and a tutorial in the package. The R package fcscoring can be downloaded by typing
The Present Study
As the GTUM is new, we first conducted three Monte Carlo simulation studies to examine the statistical performance under both ideal and realistic conditions. Specifically, the first simulation study focused on the performance of the GTUM for pairs where there is no random block factor. In the Appendix, we also presented the second simulation devoted to FC scales with a block size of 3, where random block factors were invoked to handle local dependency. We also presented a third small-scale simulation to examine the convergence between GTUM- and MUPP-based trait scores in the Appendix. Then, we used two empirical datasets to showcase their feasibility and utility. Empirical data for the graded FC, data analysis script, simulation code, and supplementary tables are available on the Open Science Framework (OSF) at https://osf.io/x6749/?view_only=11f0d49373214f1c936c18eb82156dfc. Empirical data for the dichotomous FC scale was not made public because the FC scale TAPAS is proprietary.
Simulation Study: GTUM for Paired Comparisons
The main goal is to examine how accurately person and statement parameters of the GTUM can be recovered under ideal and realistic conditions for paired comparisons where each statement appears in a pair once (and only once) throughout the test so that the local dependence issue is nonexistent. Following previous studies that used 12 statements per factor and 2–5 factors when studying the statistical performance of the Zinnes and Griggs pairwise preference IRT model (Joo et al., 2021), the MUPP-2PL model (Morillo et al., 2016), the TIRT model (Brown & Maydeu-Olivares, 2011), the Thurstonian D-diffusion item response model (Bunji & Okada, 2020), and the Log-Linear model integrating response time and FC responses (Guo et al., 2023), throughout the simulation, we fixed the number of latent factors at 5 and the number of unique statements per trait at 12 to mimic classic measures of the Big Five personality factors (McCrae & Costa, 1989; Soto & John, 2017). So, there were 30 pairs in total. Correlations among the five factors were all set to .30 for simplicity, which also resembles the meta-analytical correlations among the Big Five personality factors after reverse-scoring neuroticism (van der Linden et al., 2010).
We also conducted another two simulation studies to examine (1) the performance of the GTUM when applied to FC scales with a block size of three where local dependency needs to be modeled, and (2) the convergence between trait scores obtained from the GTUM and the MUPP model. Triplets results largely replicated the patterns we reported below for pairs, and GTUM- and MUPP-based trait scores generally converged well. Due to space limitations, details regarding the two simulation designs and results are reported in the Appendix.
Simulation Design and Data Generation
Number of response options. Two levels of response options were investigated: 2 and 5. Two response options represent the traditional dichotomous FC format, and five response options represent the graded FC format (Brown & Maydeu-Olivares 2018; Zhang et al., 2023a).
Sample size. Two levels of sample size were studied: 300 and 1,000. Although a sample size of 300 is generally considered small for most latent variable models (Zhang et al., 2023b), it is typical in organizational research where personality tests are frequently administered (Shen et al., 2011; Su et al., 2019). Therefore, it is important to examine how the GTUM performs in such nonideal but realistic conditions. A sample size of 1,000 was also included because we are interested in how the GTUM performs in large sample sizes.
Statement quality. Statement quality is indicated by the size of their discrimination parameters (
Proportion of mixed pairs. For a FC scale to be faking-resistant, it is critical to ensure that statements within a block are matched on social desirability. With the TIRT model, it almost always means that factor loadings of statements within a block should have the same sign (i.e., all positive or all negative). With the GTUM, it mostly means that statements within a block should have similar location parameters. However, person parameters in the TIRT model are difficult to recover if statements within a block are of the same sign due to the limited formation provided by such blocks (Brown & Maydeu-Olivares, 2011; Frick et al., 2023). There must be some mixed pairs with positively and negatively keyed statements (Lee et al., 2022) for accurate person score estimation, which may compromise the faking-resistance of a FC scale. However, it remains unknown whether matching statements within a block on location parameters will equally lead to loss of information. If yes, how many mixed pairs do we need to make up for the loss? Therefore, we examined five proportions of mixed pairs: 0/6, 1/6, 2/6, 3/6, and 6/6. For mixed pairs, we ensured that statements within them had location parameters of opposite signs. For non-mixed pairs, they were matched based on the “degree of match” factor presented below.
Degree of match. We manipulated the degree of match between statements, operationalized as the difference in location parameters between two statements within a pair. In the close match conditions, the location parameter difference was .25; in the loose match conditions, the difference was .50. No perfect match was simulated because it is unlikely in the real world.
Statement extremity. Even though the GTUM is designed for FC scales that include both extreme and intermediate statements, writing enough good intermediate statements for some constructs may be challenging (Cao et al., 2015). Therefore, we also studied two levels of statement extremity: intermediate-including and intermediate-excluding. In the intermediate-including conditions, location parameters for the 12 statements of each factor spanned evenly between −2.5 and 2.5; in the intermediate-excluding conditions, all location parameters laid within [−3, −1.5] and [1.5, 3]. Across both levels, we ensured that about half statements within each factor had positive location parameters, and the other half had negative ones.
In total, there were
Model Estimation
A truncated LogNormal(.2, .5) prior on
Two chains were utilized so that we could estimate model convergence based on the potential scale reduction (PSR), which measured the ratio of the average variance of samples within each chain to the variance of the pooled samples across chains, with PSR close to 1 indicating convergence. In the present study, we considered the model converged if the maximum PSR of all parameters falls below 1.20. Chain length was set to 2,000, with the first 1,000 discarded as warmups. One hundred replications per condition were performed.
Accuracy Metrics
Bias, Absolute Bias (ABias), Root Mean Square of Error (RMSE), and Pearson Correlation between true and estimated parameters (PCorr) were calculated for
Results
Model Convergence
Overall, the GTUM converged well, with an average convergence rate of 99% across all conditions (see Table S1). More specifically, convergence rates were above 90% in 156 out of 160 conditions (most were 100%). Only four challenging conditions with only extreme statements and five response options had convergence rates below 90% (83%–89%). We note that imperfect convergence rates for correctly specified models have also been reported for the MUPP model (Tu et al., 2023a), the GGUM-RANK model (Lee et al., 2019), and other non-FC IRT models (Jang & Cohen, 2020; Paek et al., 2018; Tay et al., 2011). Therefore, we believe the GTUM converged reasonably well. We reported results from converged replications.
Recovery of Person Scores (
)
Four patterns can be observed in Table 2.
Correlation Between True and Estimated Person Scores.

Note. Intermediate refers to intermediate statements; Extreme refers extreme statements; L-Diff = difference in location parameters; SS = Sample Size; Match = The proportion of mixed blocks; Options = The number of response options.
Recovery of Statement Parameters (
)
In the main text, we present bias for
Discrimination parameters (
Bias of Discrimination Parameters.

Note. Intermediate refers to intermediate statements; Extreme refers extreme statements; L-Diff = difference in location parameters; SS = Sample size; Match = The proportion of mixed blocks; Options = The number of response options.
Location parameters (
Absolute Bias of Location Parameters.
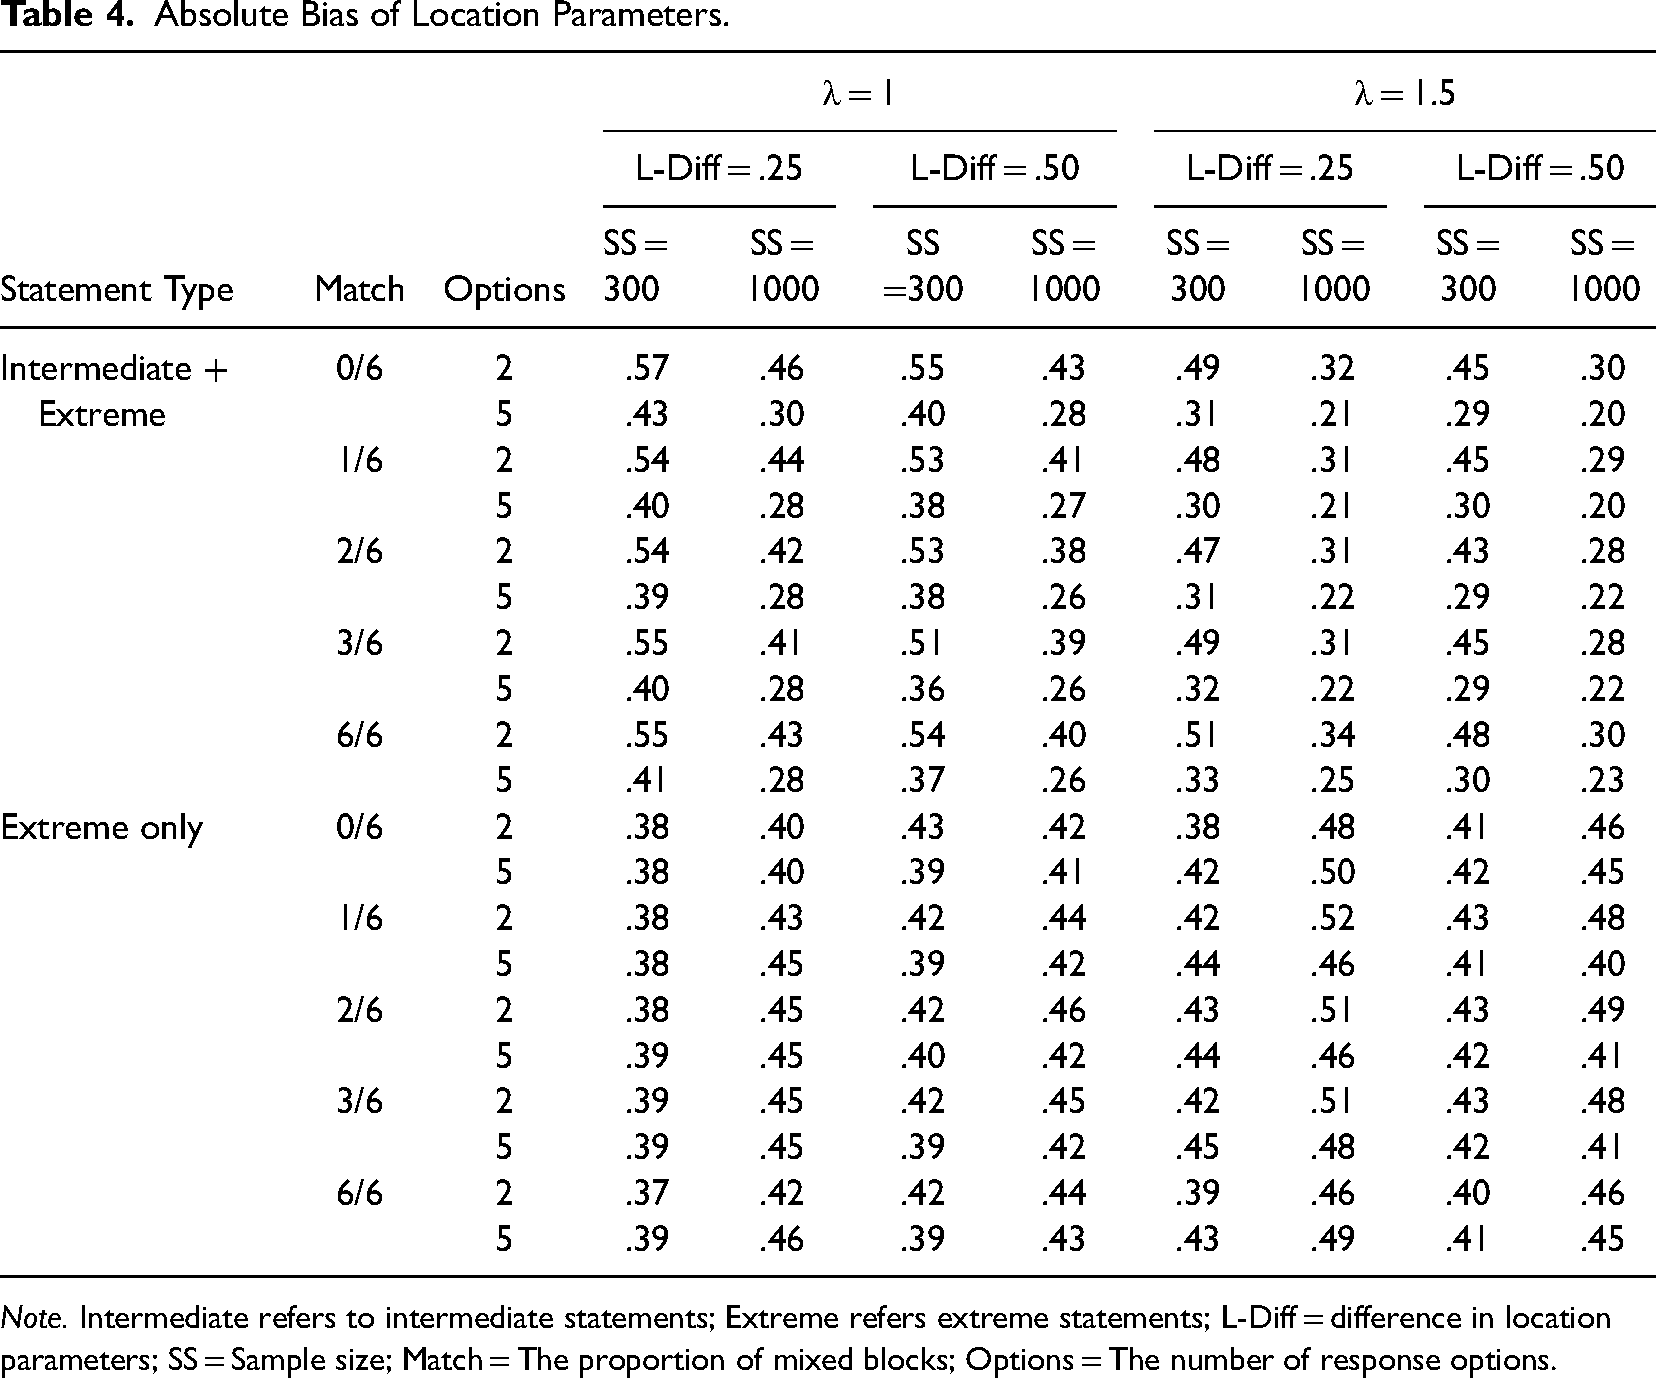
Note. Intermediate refers to intermediate statements; Extreme refers extreme statements; L-Diff = difference in location parameters; SS = Sample size; Match = The proportion of mixed blocks; Options = The number of response options.
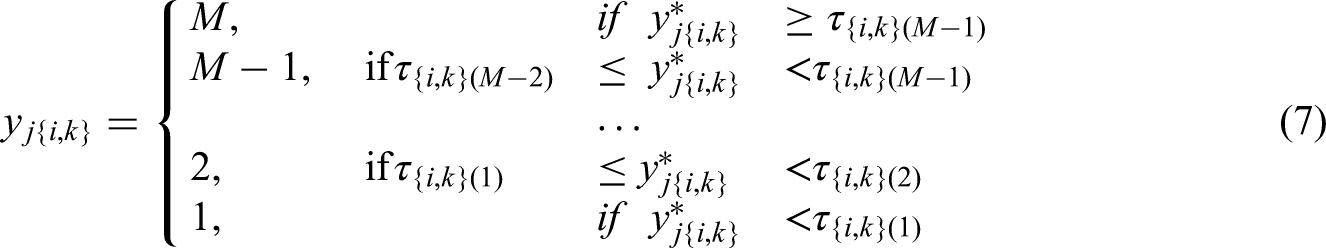
Threshold parameters (
Absolute Bias of Threshold Parameters.
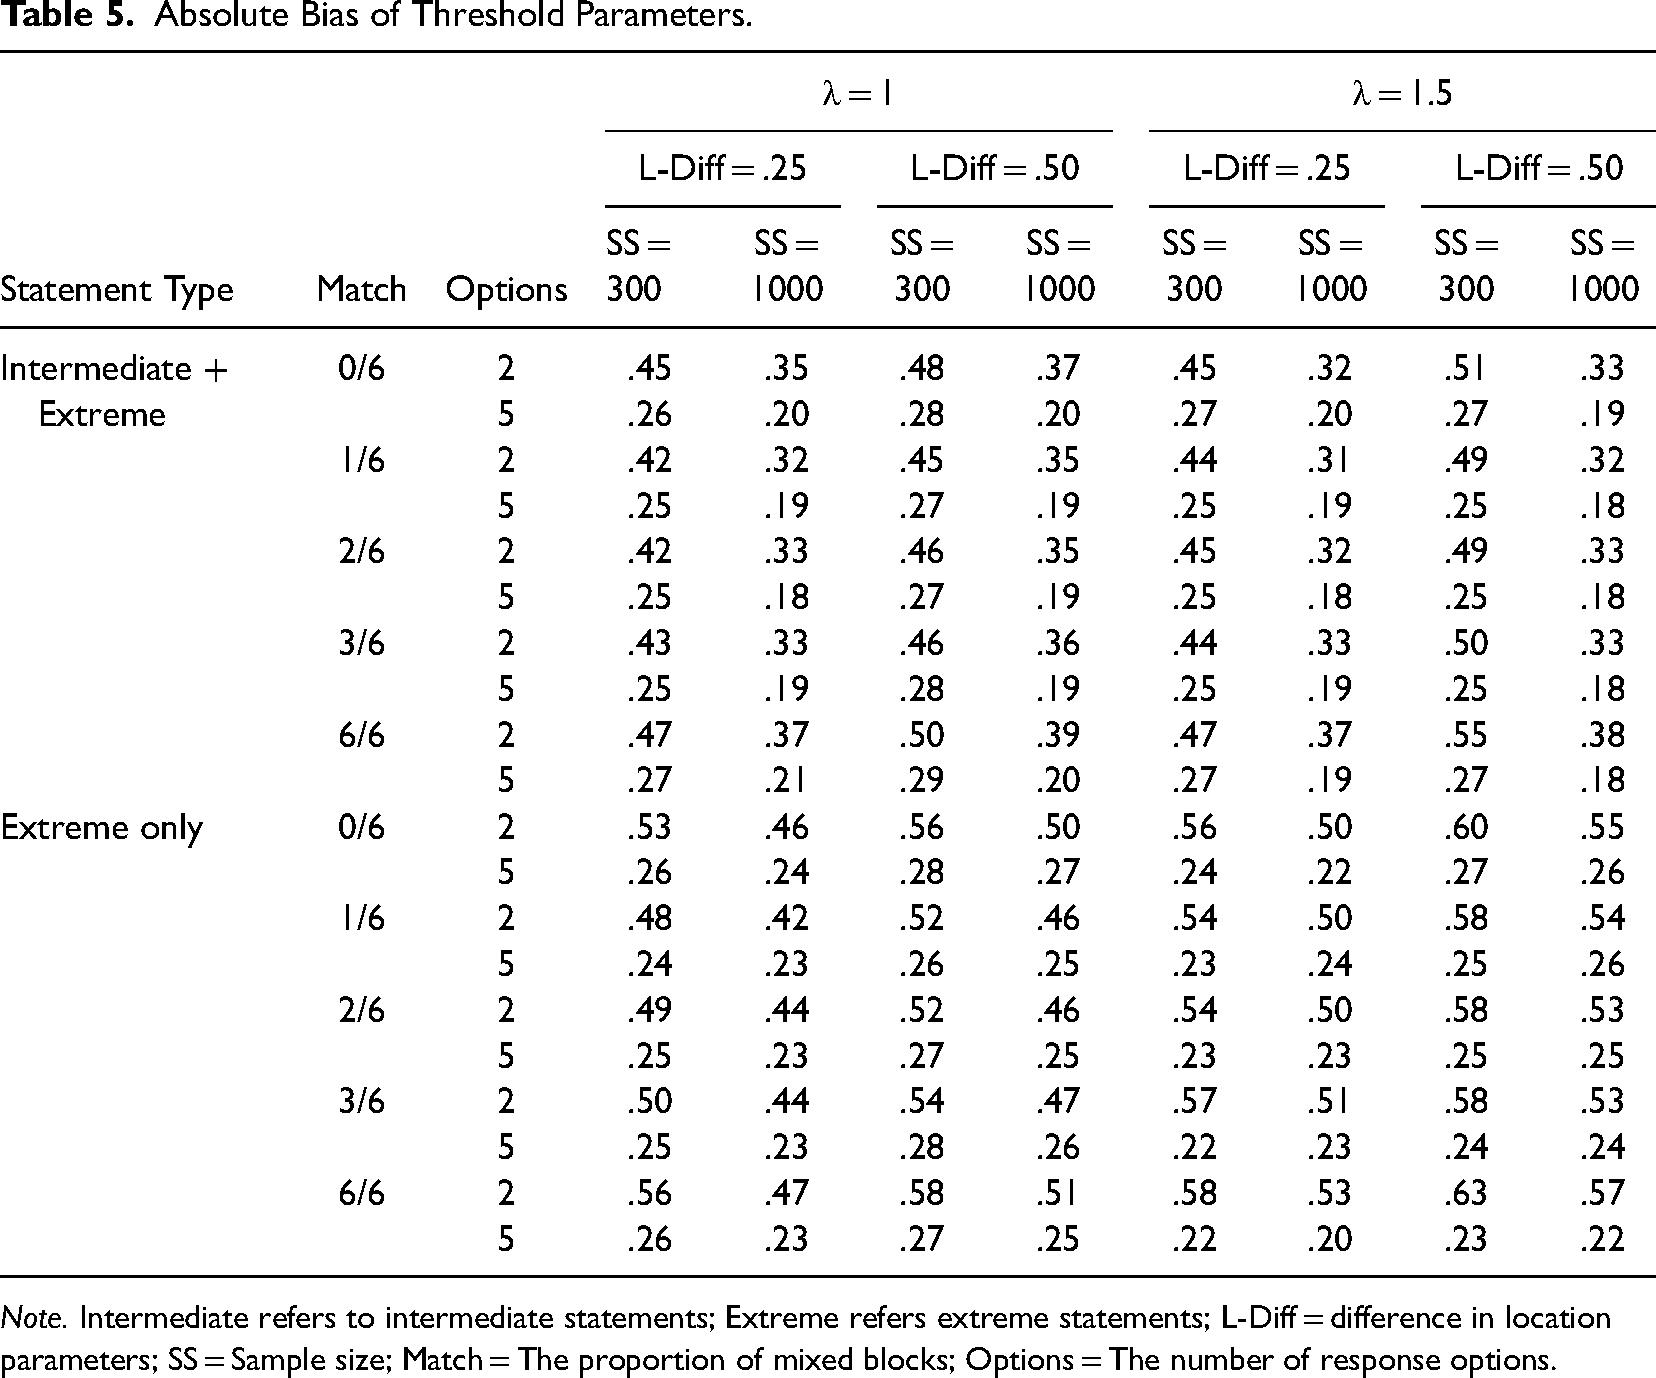
Note. Intermediate refers to intermediate statements; Extreme refers extreme statements; L-Diff = difference in location parameters; SS = Sample size; Match = The proportion of mixed blocks; Options = The number of response options.
Recovery of Latent Correlations (
)
Bias was reported for the estimation of latent correlations. Absolute bias and RMSE can be found in the online Supplemental material (Tables S12–S13). As can be seen from Table 6, latent correlations can be estimated with reasonable to good accuracy except for conditions with zero pairs and highly discriminating statements where latent correlations were severely underestimated. The degree of underestimation was particularly concerning when there were only extreme statements (a true correlation of .30 was estimated to be around −.10). Fortunately, when there were five mixed pairs, estimation accuracy quickly resumed to an acceptable range.
Bias of Latent Correlations.
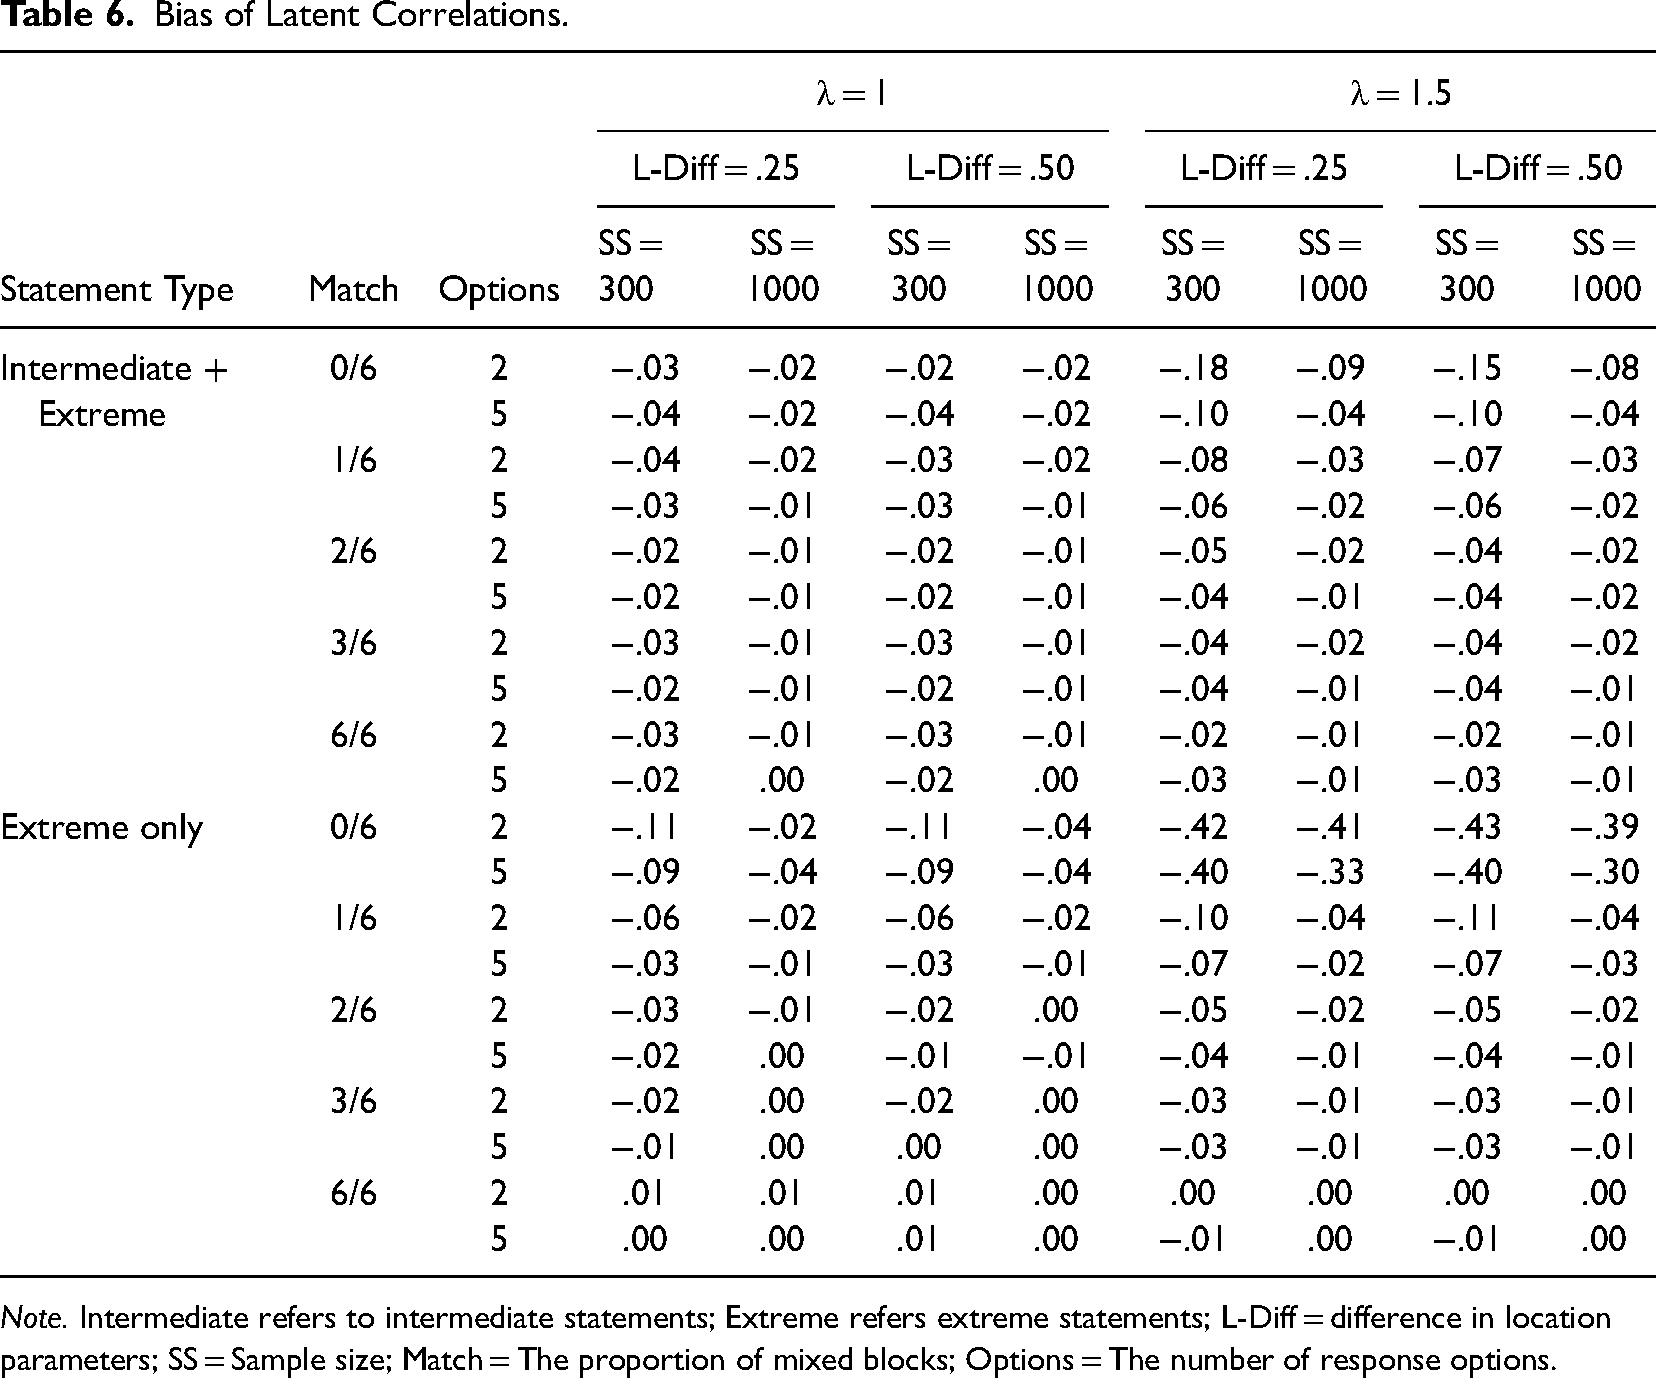
Note. Intermediate refers to intermediate statements; Extreme refers extreme statements; L-Diff = difference in location parameters; SS = Sample size; Match = The proportion of mixed blocks; Options = The number of response options.
Summary
We examined the psychometric performance of the GTUM in various conditions, and the results have several implications for future FC scale development and scoring.
Empirical Illustrations
After establishing the statistical performance of the GTUM, we illustrated its feasibility and utility in two organizationally-relevant datasets in comparison with the MUPP and the TIRT models. These illustrations demonstrated how GTUM can be flexibly applied to different types of FC scales. It also served as a showcase for researchers and practitioners seeking to use the GTUM.
Samples and Measures
Data Analysis
For the TAPAS in Sample 1, we first scored the responses by the MUPP model using statement parameters and scoring software provided by the test developer to obtain MUPP-based maximum a posteriori (MAP) scores 2 . Then, we rescored the TAPAS with the GTUM and obtained the GTUM-based MAP scores. Thus, there were two sets of scores for each facet.
For the FCFFM in Sample 2, we first scored the responses by the TIRT model following Brown and Maydeu-Olivares (2018) using Mplus 8.5 (Muthén & Muthén, 1998–2017) to obtain TIRT-based MAP scores. Next, we rescored the FCFFM with the GTUM and obtained the GTUM-based MAP scores. Thus, there were two sets of scores for each of the Big Five factors.
Responses to the Likert scales were scored using the Graded Response Model (Samejima, 1969) and MAP estimates were obtained from the R package mirt (version 1.36.1; Chalmers, 2012). Responses to single-item measures were used as they were.
Results
TAPAS Results
Statement parameters. Statement parameters and their standard errors from the GTUM are shown in Table S34. Specifically, the discrimination parameters ranged from .20 to 2.81, with a mean of 1.01. The magnitude of location parameters ranged from .35 to 3.37, which correctly reflected the fact that intermediate statements were intentionally included in TAPAS. The threshold parameters were between −4.52 and 3.80.
Convergence between different scoring methods. As shown in the shaded diagonal of the upper panel of Table 7, it was clear that the GTUM-based and MUPP-based scores resulted in high convergence (r's = .85–.96), supporting the validity of the GTUM.
Reliability, Convergent Validity, Facet Intercorrelations, and Criterion-Related Validity (

Note. SOC = sociability; DOM = dominance; PHY = physical condition; SEL = selflessness; ACH = achievement orientation; ORD = orderliness; OPT = optimism; EVT = even-tempered; TOL = tolerance; IEF = intellectual efficiency; N = neuroticism; E = extraversion; A = agreeableness; C = conscientiousness; O = openness; LS = life satisfaction; CSE = core self-evaluation; SS = single-statement (Likert) scale. Values in gray shade were convergence between GTUM-based and MUPP-based scores.
Empirical reliability. Empirical reliability was calculated for each dimension using the formula suggested by Brown and Maydeu-Olivares (2018). As shown in the first two columns of Table 7, all facet scores displayed adequate to satisfactory reliability. Relatively, MUPP scores were slightly more reliable than GTUM-based scores (MMUPP = .80, MGTUM = .74). It is likely due to the fact that the MUPP model assumes statement parameters are known with no sampling variability while the GTUM properly incorporated such uncertainty into the scoring procedure. Thus, the reliability for MUPP scores might have been overestimated.
Correlation among facets. We note that the MUPP scoring procedure we adopted did not consider latent correlations among facets while the GTUM did. Therefore, we presented correlations among estimated factor scores for both MUPP-based scores and GTUM-based scores for a fairer comparison (see Table S36 for the latent correlations estimated by the GTUM). As shown in the off-diagonals of the upper panel of Table 7, GTUM-based scores, on average, had slightly higher correlations with one another than MUPP-based scores. This is probably because the GTUM incorporated correlations among facets when estimating person scores while the MUPP model did not make use of such information.
Correlations with external variables. As shown in the lower panel of Table 7, GTUM-based scores, in general, displayed a slightly higher correlation with theoretically relevant external variables than MUPP-based scores. For example, GTUM-based Dominance scores had a correlation of .57 with extraversion measured by the BFI, while the corresponding correlations for MUPP-based Dominance scores were .48. Similarly, GTUM-based Sociability scores were correlated with life satisfaction at .31 while that for MUPP-based score was .21. The slight improvement in criterion-related validity of GTUM-based scores over MUPP-based scores is likely to come from the relaxation of the strict assumption of parameter invariance across formats.
FCFFM Results
Statement parameters. As shown in Table S35, statement discrimination parameters ranged from .65 to 1.75 with a mean of 1.05. All location parameters were large in magnitude (4.10 to 8.66). This is also consistent with the fact that the FCFFM was developed based on the dominance assumption—only statements with extreme location parameters were included. The threshold parameters were largely in the range between −4 and 4. The standard deviation of the random block factor was .65, reflecting a moderate amount of local dependence.
Convergence between different scoring methods. As shown in the shaded diagonal of the upper panel of Table 8, it was clear that the GTUM-based and TIRT-based scores resulted in almost perfect convergence (r's = .99–1.00), strongly supporting the validity of the GTUM.
Reliability, Convergent Validity, Factor Intercorrelations, and Criterion-Related Validity (

Note. N = neuroticism; E = extraversion; A = agreeableness; C = conscientiousness; O = openness; FC = forced-choice scale; SS = single statement (Likert) scale; Values in gray shade were convergence between GTUM-based and TIRT-based scores.
Empirical reliability. As shown in the first two columns of Table 8, GTUM scores were slightly more reliable than TIRT scores. One post-hoc explanation could be that the GTUM better represented how people respond to personality statements than the TIRT, thus resulting in more reliable scores. Regardless, these differences were generally small.
Correlation among factors. As can be seen from the upper panel of Table 8, correlations among the five factors were very similar to each other for the GTUM-based and the TIRT-based scores. This is unsurprising, given the almost perfect convergence between the two sets of scores.
Correlations with external variables. As shown in the lower panel of Table 8, the GTUM-based scores displayed practically identical correlations with externally measured Big Five factors as the TIRT-based scores.
Summary
Across two FC scales constructed under different assumptions and with different response formats, we found strong evidence that the GTUM can successfully extract reliable and valid scores from FC responses. Overall, the two empirical illustrations effectively supported the feasibility and utility of the GTUM to analyze a broader set of FC scales.
Discussion
The GTUM was proposed as a next-generation psychometric model for a variety of FC scales. The GTUM combines the advantages of the MUPP model and the TIRT model such that it can (1) accommodate unfolding responding, (2) handle FC scales of any block sizes, and (3) score both dichotomous and graded responses. The GTUM can also be applied to FC scales without intermediate statements. Two simulation studies systematically showed that the GTUM generally performs well, even in conditions with only 300 respondents. The empirical illustrations supported the feasibility of the GTUM in real applications.
Implications
The findings of this study have several implications. First, we, for the first time, systematically showed that the tradeoff between psychometric performance and location parameter matching, which is likely to be closely related to social desirability matching, is not only limited to the TIRT model. The GTUM is not immune, either. Fortunately, including intermediate statements can substantially alleviate the negative impact of location parameter matching such that even in conditions with zero mixed pairs, person parameters can still be recovered with reasonable accuracy. However, if only extreme statements are included, the psychometric performance of the GTUM is similarly impacted by social desirability matching as the TIRT model (Lee et al., 2022). Another practical advantage of intermediate statements is that they are more likely to be faking-resistant because they are often more neutral than extreme statements. When designing FC scales for use in high-stakes situations, we can at least pair extreme statements with intermediate statements instead of pairing extreme positive statements with extreme negative statements, the former of which should be less fakable than the latter. Overall, even though both the GTUM and the TIRT model are impacted by social desirability matching, the GTUM suffers less than the TIRT model due to its unique capability to leverage intermediate statements. Those troubled by the tradeoff between social desirability matching and psychometric information are encouraged to consider the GTUM and intermediate statements for scale development and scoring.
Second, our findings strongly support using the graded FC format over the traditional dichotomous FC format. This finding is not surprising as numerous studies have shown that more response options always lead to higher reliability in Likert scales. However, unlike Likert scales where many polytomous IRT models have been developed to make full use of graded responses, currently, only the TIRT model can handle graded responses in FC scales. The GTUM represents an important addition to the family of FC IRT models that can leverage the advantages of graded responses (Zhang et al., 2023a). In fact, we may consider the TIRT model as a model practically subsumed under the GTUM, because the GTUM is equally capable of handling FC scales constructed under the dominance assumption. However, the TIRT model cannot handle FC scales with intermediate statements.
Practical Considerations
Given the complexity of the GTUM and its estimation, users may have some questions about using this model. To aid researchers and practitioners in applying this model to FC scale construction and scoring, we provide brief discussions on practical issues and suggestions below.
How to best construct FC scales for accurate estimation of trait scores?
According to the simulation findings, several steps can be taken to construct high-quality FC scales. First, researchers should always use high-quality statements. Our simulations demonstrated that high-quality statements consistently lead to superior psychometric performance. Therefore, the importance of crafting high-quality statements should never be underestimated. Second, incorporating both intermediate and extreme statements effectively achieves robust psychometric performance and adequate social desirability matching. Achieving this balance becomes challenging if only extreme statements are used. Third, for optimal psychometric results, it is recommended to include 5–10 mixed statement pairs. However, caution should be exercised with the use of mixed pairs as they may make FC scales vulnerable to faking. Fourth, larger block sizes can enhance reliability. For example, with a pool of 60 statements, 30 unique pairs can be formed. If researchers adopt a block size of 3, they can produce 20 unique triplets, which can further be broken down into 60 unique pairs. The latter scale provides approximately twice the information of the former. However, it is advisable to maintain block sizes below six due to the cognitive burden associated with larger blocks. Moreover, the block size should not exceed the total number of latent traits intended for measurement; incorporating multiple statements from the same trait into the same block may be psychometrically ineffective. If, for any reason, the block size has to be set at two, utilizing the graded response format is encouraged, as it has proven effective in our simulations and previous empirical studies (Brown & Maydeu-Olivares, 2018; Zhang et al., 2023a). Regardless, researchers are strongly encouraged to use the autoFC R package (Li et al., 2022) to automate the test construction process.
How should I choose among the MUPP model, the GGUM-RANK model, the TIRT model, and the GTUM?
The answer is: it depends. When there are only two statements per block and intermediate statements are intentionally included, both the GTUM and the MUPP model with simultaneous estimation of person and statement parameters can be used, though the GTUM may be preferred for its parsimony; when the graded response format is adopted, and intermediate statements are included, the GTUM is the only option; when there are at least three statements per block and intermediate statements are intentionally included, both the GTUM and the GGUM-RANK model are appropriate, though the GTUM is more accessible to many researchers. Both the GTUM and the TIRT model can be used if users are sure that no intermediate statements are present, though the TIRT might be preferred in this case due to faster computation. When users are not sure whether statements are functioning as intermediate statements, the GTUM is recommended, as it allows the empirical examination of the extremity of statements. It is important to note that some seemingly extreme statements can turn out to be intermediate, and vice versa. Therefore, if time permits, it does not hurt to fit both the GTUM and the TIRT model to empirically decide which one is more appropriate.
What is the sample size requirement for the GTUM?
Before discussing the tentative recommendation, we note that sample size planning is very complex, and the exact answer depends on various factors. Thus, our recommendation should not be used as a gold standard. Instead, our aim is to provide a recommendation that would lead to reasonable parameter estimates. The simulation showed that with 300 respondents, person parameters can be recovered as well as when there were 1,000 respondents; statement parameters can also be recovered with reasonable accuracy. Therefore, we consider 300 as a safe option, especially when the focus is on estimating person scores. Beyond this, we also ran some small-scale simulations and found that person scores could be recovered reasonably well even when the sample size was 200. However, statement parameters cannot be accurately estimated in that case.
How to choose priors?
Our personal experience with Bayesian estimation of unfolding models in general and the GTUM, in particular, suggests that choosing appropriate priors for location parameters is very important. Specifically, it is critical to let the algorithm know which statements are extreme positive statements and which are extreme negative statements. Fortunately, it is easy to tell from the statement content. For statements that we are sure are extreme positive, we can choose a normal prior with a mean of 1.5 or 2 and a variance of 4 or 9, and constrain them to be within a reasonable positive range; for statements that we are sure are extreme negative, we can choose a normal prior with a mean of −1.5 or −2 and a variance of 4 or 9, and constrain them to be within a reasonable negative range; for statements whose directionality or extremity we are not sure about, we can choose a normal prior with a mean of 0 and a variance of 4 or 9, and constrain them to be within a reasonable range symmetrical around zero. These priors and constraints are moderately informative and reasonable. In fact, we also tested the use of noninformative normal priors with a variance of 100 for location parameters (using the same range constraints as discussed above) and the results were close to what was obtained with moderately informative priors. When available, using semi-informative priors obtained from the calibration of single statements could speed up model convergence. When applying the model to empirical scenarios that differ from the current settings, researchers may conduct prior sensitivity analysis, as was done here, by comparing the parameter estimates obtained under different choices of priors. Although we recommend moderately reasonably informative priors for other parameters (as used in the simulation because we know the approximate range within which most parameters will lie), they are less critical than the priors for location parameters, especially when the sample size is large. Therefore, users can use less informative priors for other parameters in the model if they want the data to dominate the posterior distributions.
How to speed up computation?
One critical issue with Bayesian approaches implemented in MCMC algorithms is that they are much slower than frequentist approaches, and the computation time increases with sample size, scale length, and the number of response options. Therefore, it is desirable to speed up computation. One potential approach is to use the variational Bayes method that is available in the vb function of RStan. Variational approximation is a class of analytical techniques for approximating high-dimensional integrals, the key to which is to approximate the intractable integrals with a simple tractable form and thus create a lower bound to the marginal likelihood. Then, we can maximize the more tractable lower bound of the likelihood function (Jeon et al., 2017). The main advantage of the variational Bayes is computational efficiency. In our small-scale experiment, with 1,000 respondents and 20 blocks whose size was 3, MCMC took about 10 h to finish, while the variational Bayes only took about 15 min. Person scores were estimated only moderately less accurately (r's = .65–.75) than those from MCMC (r's = .80–.90); the recovery of statement parameters was not satisfactory. Therefore, if person scores are the focus and fast computation is required, the variational Bayes may be a practical way to go. However, if accurate statement parameter estimation is desired, then the current variational Bayes approach is not recommended. Note that the variational Bayes approach implemented in Stan is the beta version and thus may not perform optimally. Testing of future formal versions is encouraged.
What if my model does not converge?
Simulation results showed that model convergence may be an issue when there are at least three statements per block. The post-hoc exploration showed that relaxing the bounds on the location parameters is an effective way to facilitate convergence. This is also supported by the empirical example. Specifically, fitting the GTUM to the second dataset by constraining the location parameters between [−5, 5] resulted in nonconvergence. After relaxing the range to [−10, 10], all model parameters converged well. Users can also increase the number of MCMC chains and the number of iterations per chain, which are generally recommended (Jiang & Carter, 2019).
Limitations and Future Directions
Despite the strengths, the present study has the following limitations.
Conclusion
We proposed the GTUM as a more versatile IRT model for various types of FC scales by combining the advantages of the MUPP model and the TIRT model. Simulation studies and empirical illustrations supported the feasibility and utility of the GTUM. The accompanying R package fcscoring was also developed to facilitate the application of the GTUM.
Supplemental Material
sj-xlsx-1-orm-10.1177_10944281231210481 - Supplemental material for The Generalized Thurstonian Unfolding Model (GTUM): Advancing the Modeling of Forced-Choice Data
Supplemental material, sj-xlsx-1-orm-10.1177_10944281231210481 for The Generalized Thurstonian Unfolding Model (GTUM): Advancing the Modeling of Forced-Choice Data by Bo Zhang, Naidan Tu, Lawrence Angrave, Susu Zhang, Tianjun Sun, Louis Tay and Jian Li in Organizational Research Methods
Footnotes
Appendix 1: GTUM for Triplets
The primary goal of this simulation study is to examine the performance of the GTUM for FC scales with a block size of three where local dependence emerges. To be consistent with Study 1, we fixed the number of latent factors at 5, the number of statements per factor at 12, the number of latent factors at 5, and latent correlations among the factors at .30. In total, there were 20 blocks with a block size of three. After decomposing these blocks, there were 60 pairs (pseudo items), and each statement appeared in two pairs.
Appendix 2. Convergence Between GTUM- and MUPP-based Trait Scores
One reviewer raised a thoughtful question about the practical equivalence between the GTUM and the MUPP model: if we fit both the GTUM and the MUPP model to the same dataset and obtain trait scores, to what degree the two sets of scores will be correlated. Therefore, we conducted additional simulations to examine the degree to which estimated trait scores from the two models converge. Specifically, we manipulated (1) the proportion of mixed pairs, (2) statement quality, (3) degree of match, and (4) statement extremity in the same way as the focal study. Sample size, the number of response options, and scale length were fixed at 300, 2, and 30, respectively. In total, there were
As can be seen from Table A2, GTUM- and MUPP-based trait scores were generally highly correlated. Whether intermediate statements were included or not further moderated the degree of correlation such that their convergence was higher in conditions with no intermediate statements (M r = .94, min = .89, max = .97) compared to conditions with intermediate statements (M r = .82, min = .72, max = .88).
Acknowledgment
We thank Dr. Fritz Drasgow for providing valuable feedback on an earlier version of the draft.
Authors’ Note
An earlier version of this paper was presented at the 38th Annual Conference of the Society for Industrial and Organizational Psychology.
Declaration of Conflicting Interests
The authors declared no potential conflicts of interest with respect to the research, authorship, and/or publication of this article.
Funding
The authors disclosed receipt of the following financial support for the research, authorship, and/or publication of this article: Data collection for sample 2 was supported by Grant 2020YFC200300 from the National Key R&D Program of China awared to Dr. Jian Li.
Supplemental Material
Supplemental material for this article is available online.
Notes
Author Biographies
![]() ) a technology startup enabling researchers to conduct better experience sampling studies.
) a technology startup enabling researchers to conduct better experience sampling studies.
References
Supplementary Material
Please find the following supplemental material available below.
For Open Access articles published under a Creative Commons License, all supplemental material carries the same license as the article it is associated with.
For non-Open Access articles published, all supplemental material carries a non-exclusive license, and permission requests for re-use of supplemental material or any part of supplemental material shall be sent directly to the copyright owner as specified in the copyright notice associated with the article.