
Abstract
The value of treating customer satisfaction (CS) as a marketing objective began to be questioned in the 1990s. Achieving customer delight (CD) was the suggested alternative. However, CD is used for a distinct response and for an upper zone of positive nonlinear response to CS. This research investigates these two perspectives by examining the linearity of how CS influences behavioral intentions while controlling for CD measured as a distinct response. Unique data, crossing online retailers with respondents, confirm CD and CS are distinct responses that both determine behavioral intentions. CD has a positive quadratic effect; contrary to the zone of delight conceptualization, CS has a negative cubic effect. This suggests that CD is a service performance metric that needs to be monitored and managed just as much as CS. Once CS is above average, resources should be used to increase CD rather than CS.
Introduction
Customer satisfaction (CS) has long been considered the best customer response-based performance goal for marketing organizations (Howard and Sheth 1969). It is the focus of a substantial stream of literature built on the expectations and disconfirmation paradigm (for a review, see Oliver 1997). This literature provides strong evidence of positive effects of CS on desirable outcomes such as repeat purchase (Szymanski and Henard 2001), retention (Bolton 1998), loyalty (Anderson and Sullivan 1993), and profitability (Anderson, Fornell, and Lehmann 1994; Bernhardt, Donthu, and Kennett 2000). The Szymanski and Henard’s (2001) meta-analysis concludes that CS is strongly related to repurchase intention.
However, the 1990s brought some questioning of the value of treating CS as a business objective, with practitioners (McNealy 1994) and consultants (Keiningham and Vavra 2001) recommending firms strive for customer delight (CD). The Roche Diagnostics division is quoted to have found CS was not enough; its customers had to be delighted for it to succeed (Keiningham and Vavra 2001, chap. 8). In the academic services literature, CD was first identified in an application of the critical incident technique (Bitner, Booms, and Tetreault 1990). But what exactly is CD?
Currently, there are two perspectives on CD in the literature. First, the zone of delight perspective (Rust, Zahorik, and Keiningham 1994) identifies CD as a specific zone of nonlinearity in the relationship between CS and measures of loyalty. In particular, it is a zone of increasing returns to CS at upper levels of CS. This would mean firms could continue to monitor and manage CS as they always have but place more emphasis on improvements near the top of the scale. The second perspective identifies CD as an emotional response that is distinct from what is captured by measures of CS (Oliver, Rust, and Varki 1997). This would mean that firms have to measure and manage their levels of CD, making it another performance metric. The goal of this research is to investigate these two perspectives on CD by examining how the nonlinear effect of CS and CD as a distinct response simultaneously influence customers’ behavioral intentions.
Two Views of CD
Distinct Response
There has always been some inconsistency in what researchers have meant by or measured as CS (Fournier and Mick 1999; Giese and Cote 2000). It has been conceptualized both as a summary evaluative judgment, consistent with the early view that it was primarily cognitive (e.g., Howard and Sheth 1969), and as primarily emotional (e.g., Westbrook and Reilly 1983; Wong 2004). It has sometimes even been treated as having both cognitive and emotional dimensions (Cronin, Brady, and Hult 2000; Yu and Dean 2001). These conflicting views have evolved into a distinction between CS itself, and CD, which Oliver, Rust, and Varki (1997) identified as the key emotional response to a service.
Following Plutchik (1980), Oliver, Rust, and Varki (1997) argued that CD results from surprising and positive levels of service performance. Their antecedents and consequences model of CD identified it as an emotion distinct from CS. Their model proposed a causal chain whereby a surprisingly positive experience (level of performance) initiated arousal, leading to positive affect and CD. Both a surprising experience and an arousal were also direct antecedents of CD. The model identified CD as a direct determinant of behavioral intention, quite separate and in parallel with the long-established direct effect of CS. This model, with independent effects of CD and CS on behavioral intentions, was fully supported by data from symphony attendees and partially supported by data from theme park visitors. It has since been corroborated for B2C websites (Finn 2005), online retailers (Finn 2006), and rural lodgings (Loureiro 2010).
Zone of Nonlinear Response to CS
In the 1990s, the prior assumption that CS translates linearly into such desired managerial outcomes as behavioral intentions, repurchase, and loyalty began to be challenged (Schneider and Bowen 1999). In one form of nonlinearity, the effect of satisfaction on loyalty could be more positive at higher levels than at lower levels. This form, referred to as increasing returns to satisfaction, is modeled as the positive quadratic effect shown in Figure 1A. Because of this nonlinear response to CS, very high levels of satisfaction were labeled as CD as opposed to mere satisfaction (Oliver 1997, p. 316).Figure 1A also shows a contrasting negative quadratic, producing general decreasing returns, in which the effect of satisfaction on loyalty is more positive at low levels of satisfaction than at higher levels of satisfaction. These contrasting nonlinearities can be accounted for by a dual factor approach to motivation (Agustin and Singh 2005). Beyond the point of hygiene fulfillment, increasing fulfillment of lower order economic needs (satisfaction) has decreasing incremental effects on goal pursuit (intentions). Increasing fulfillment of higher order relational needs has increasing effects on goal pursuit.
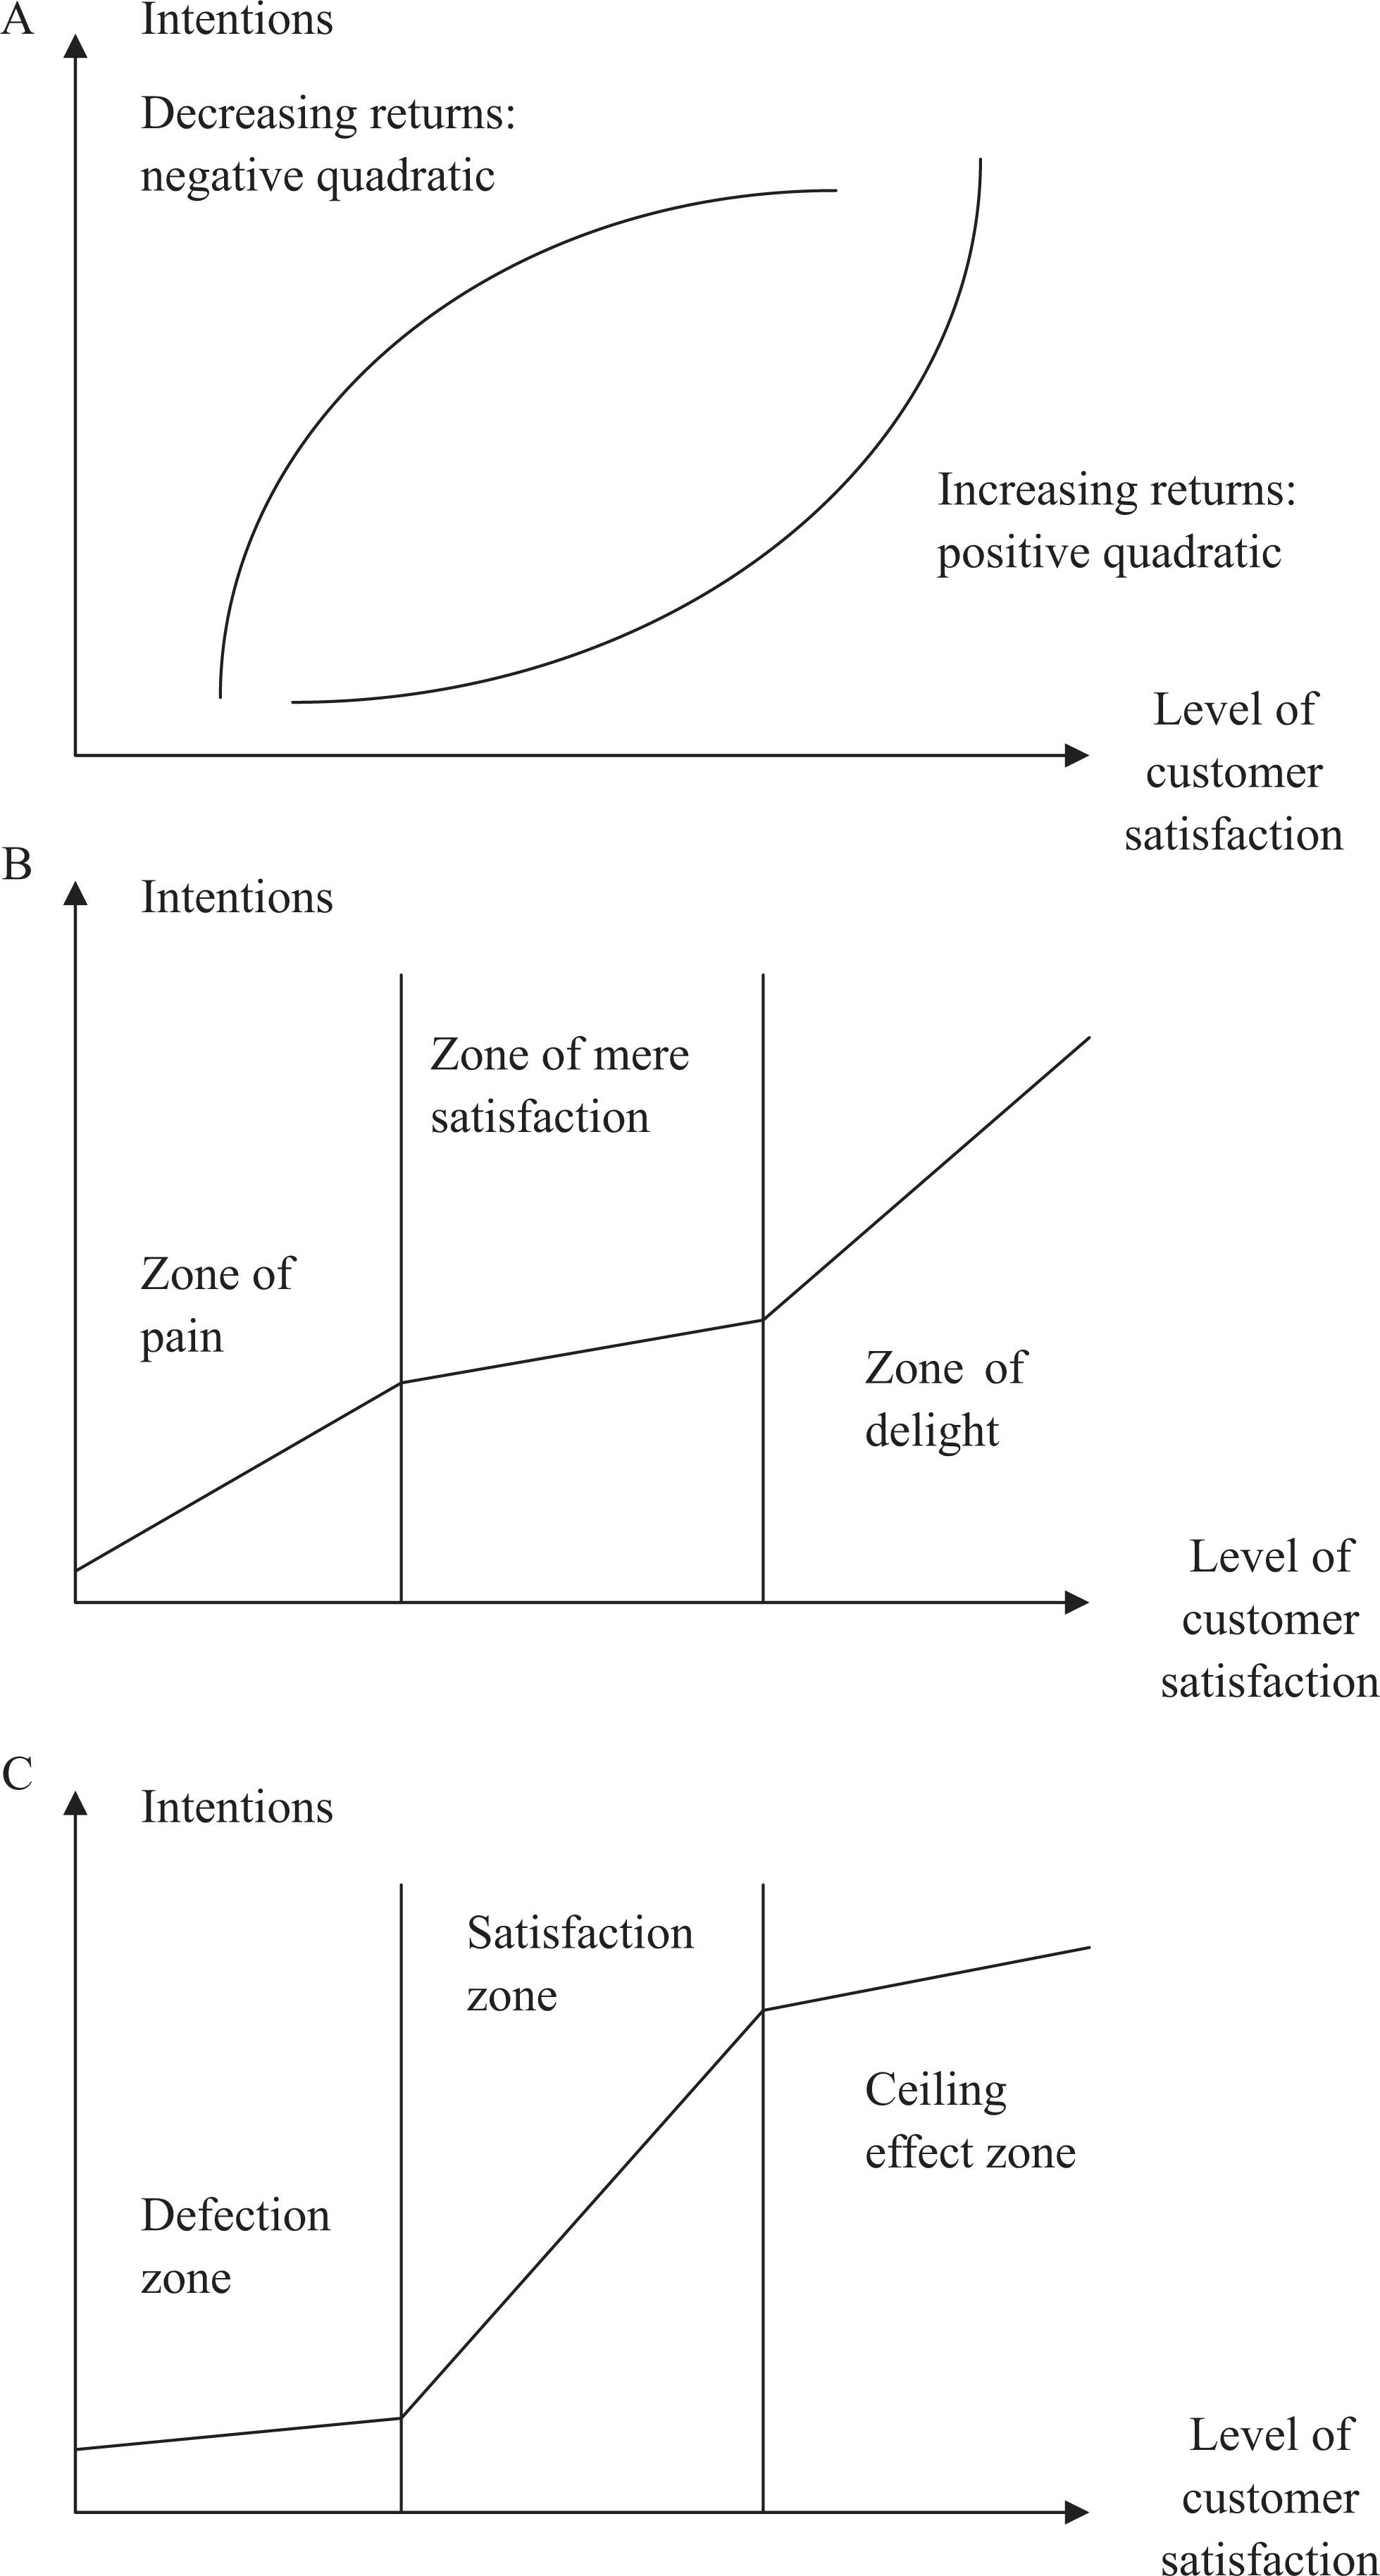
Nonlinear effects of customer satisfaction on behavioral intentions. A, Quadratic response functions. B, Positive cubic response function. C, Negative cubic response function.
Among practitioners, CD has been more narrowly associated with a specific and more complex form of nonlinearity than general increasing returns. First identified by Coyne (1989), it proposes a dual threshold or positive cubic relationship between CS and loyalty behavior, with a steep effect below a lower threshold, a relatively flat effect between the two thresholds, and another steep effect above the upper threshold. Coyne (1989) referred to the zone above the upper threshold, which occurs when the customer is pleasantly surprised by a service encounter, as an “excited” state of satisfaction. As shown in Figure 1B, the upper zone of this dual threshold model has since been referred to as a zone of delight (Keiningham and Vavra 2001; Rust, Zahorik, and Keiningham 1994). Homburg, Koschate, and Hoyer (2005) account for this shape using disappointment theory (Loomes and Sudgen 1986), which suggests the greater the disparity between a choice outcome and expectations, the greater is a person’s disappointment or elation, and these emotions generate additional value (negative or positive) to the basic value of the consumption or usage experience from the process of confirmation/disconfirmation.
Note that Ngobo (1999) proposed an alternative dual threshold model, with a flat effect below the lower threshold, a relatively steep effect between the thresholds, and another flat effect above the upper threshold. This defection, satisfaction, and ceiling effect zone alternative is shown in Figure 1C. Ngobo attributed the ceiling effect zone to a saturation effect, reflecting both the decreasing marginal utility of higher levels of satisfaction and a competitive intensity effect, often observed, of escalating expectations. It can also be attributed to prospect theory (Kahneman and Tversky 1979), with a deviation below a satisfaction reference point having a greater impact than one above the point.
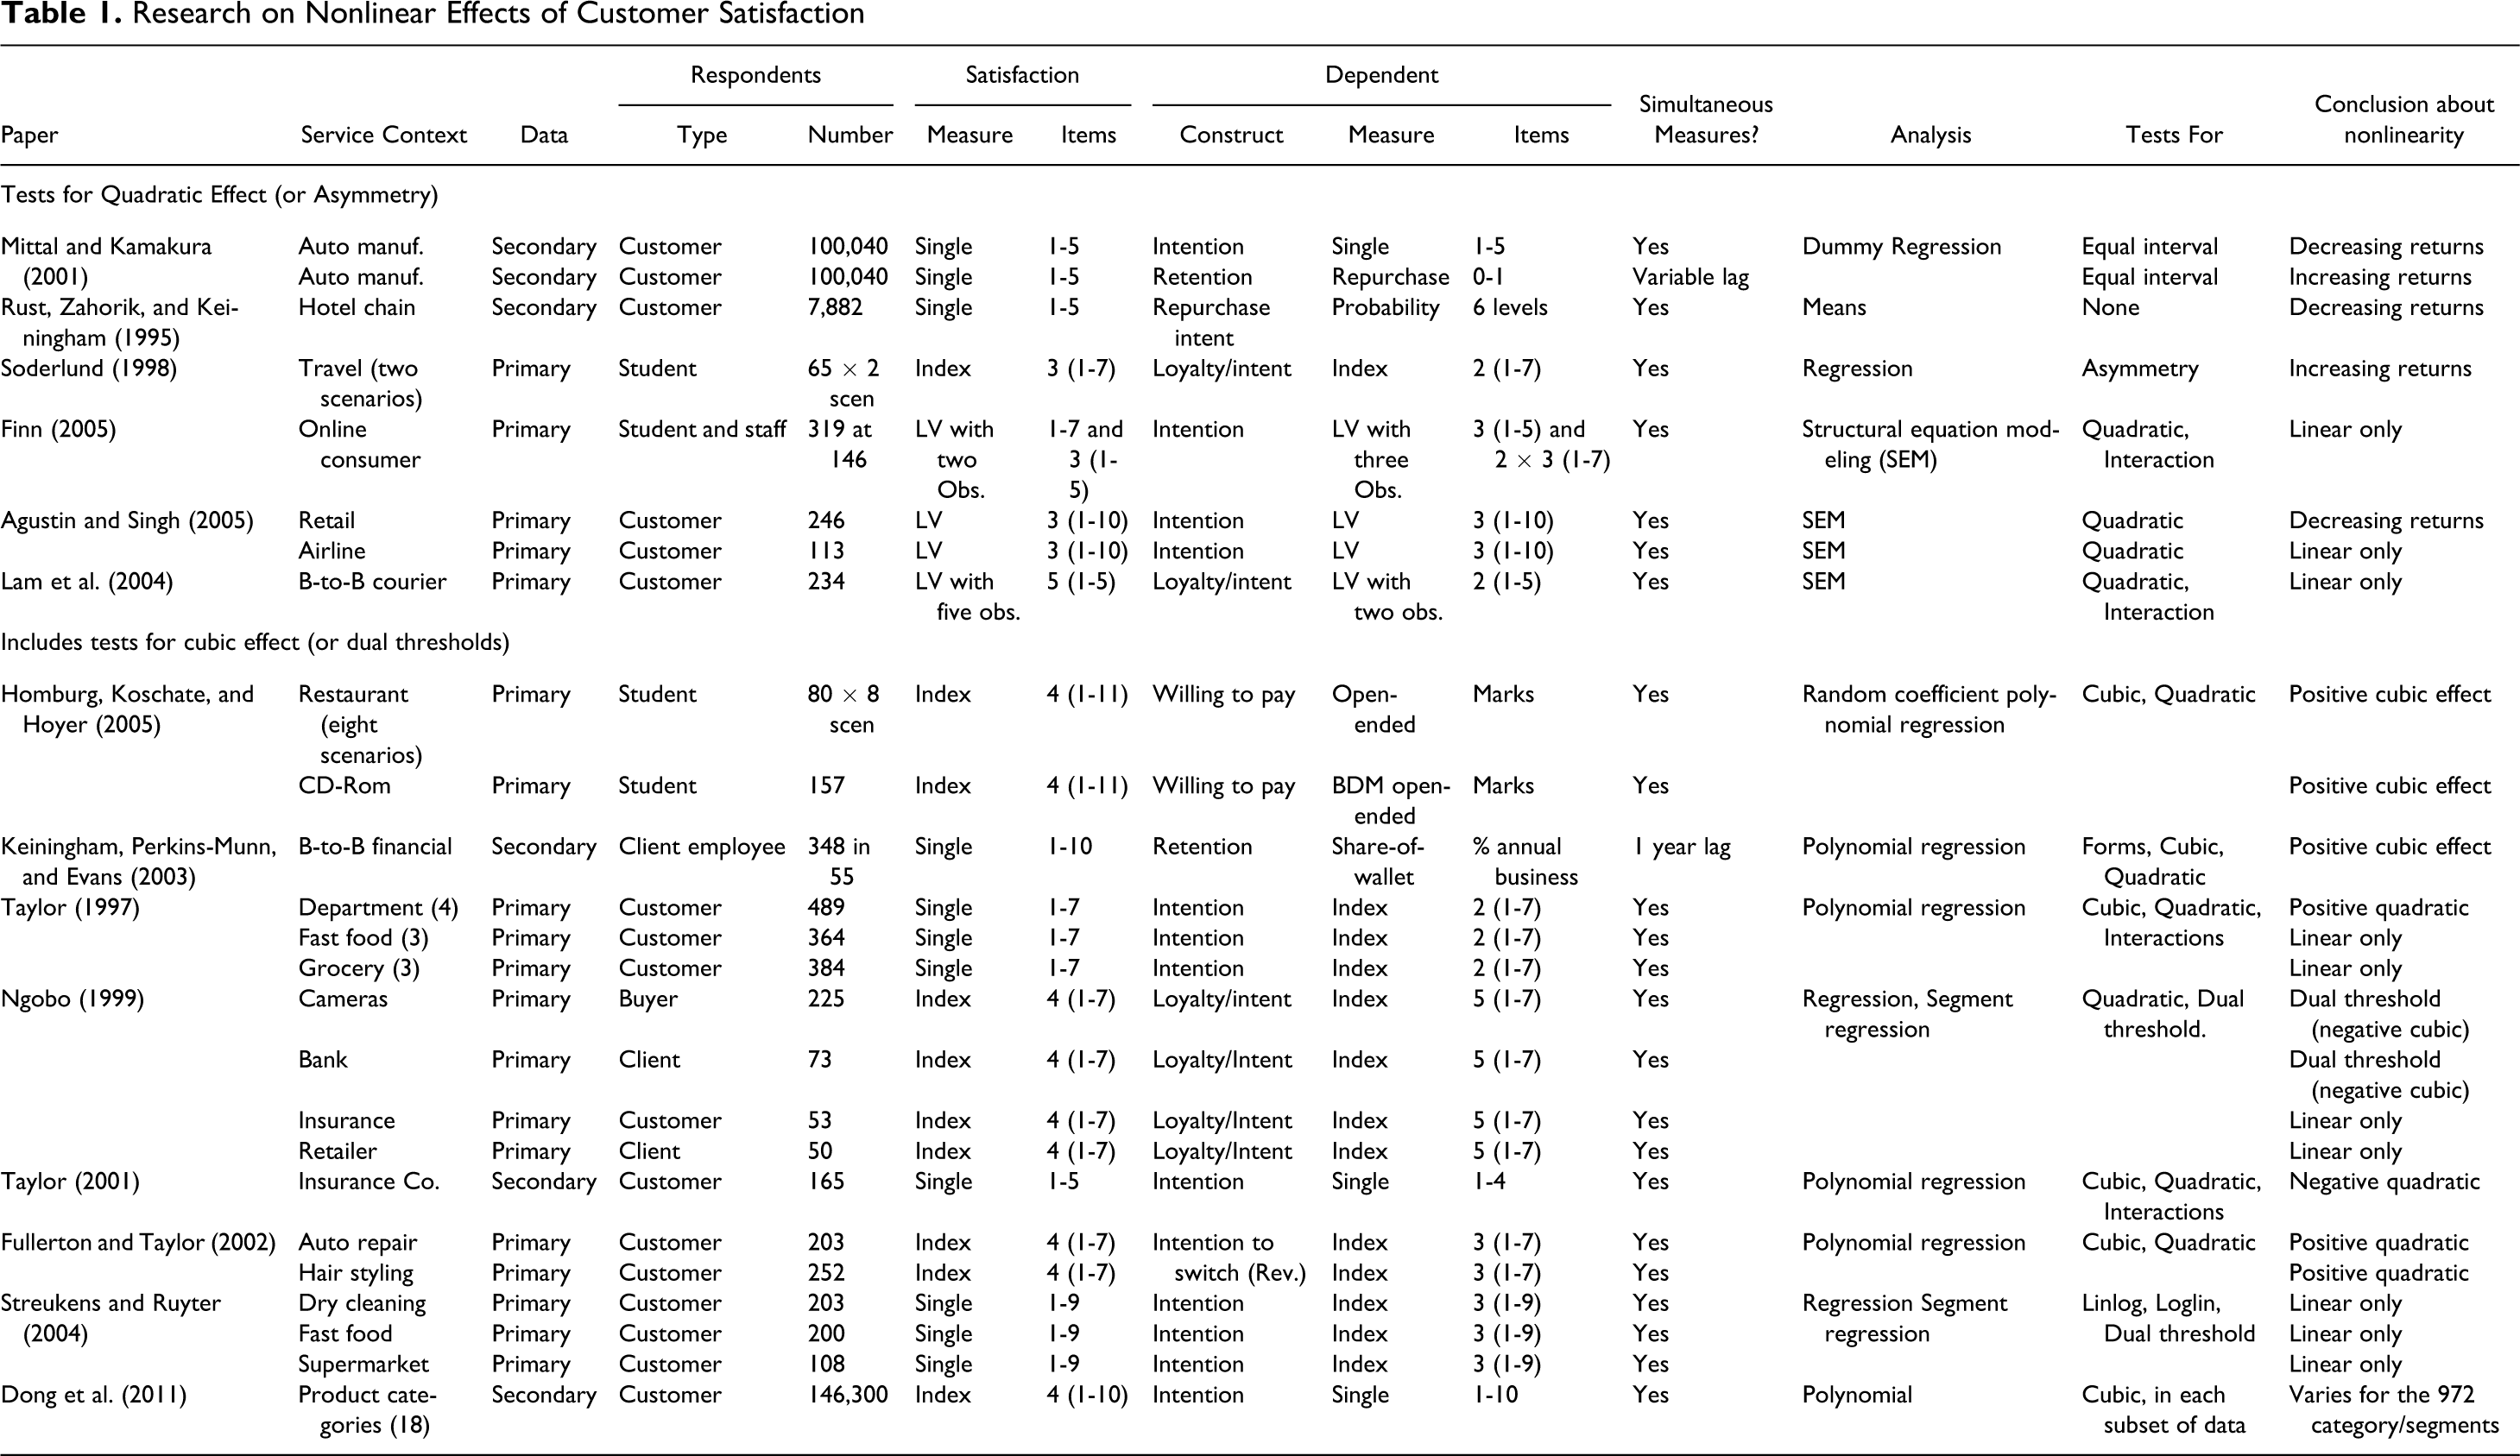
Table 1 summarizes the empirical tests for nonlinear effects of CS. It separates studies investigating quadratic (or asymmetry) effects only from those also testing for cubic (or dual threshold) effects. The studies are ordered by the level of respondents’ likely involvement, as nonlinearity seems more often reported for more involving services. Two of the eight tests for quadratics (Mittal and Kamakura 2001; Soderlund 1998;, actual repurchase) found asymmetry consistent with increasing returns. There were decreasing returns for three of these tests (Mittal and Kamakura 2001; Rust, Zahorik, and Keiningham 1995, intention; and Agustin and Singh 2005, retail). Three of the sixteen tests for cubics (Keiningham, Perkins-Munn, and Evans 2003; both in Homburg Koschate, and Hoyer 2005) produced evidence consistent with the more specific zone of delight (i.e., Figure 1B). Another three tests (Taylor 1997; Fullerton and Taylor 2002, auto repair and hair styling) found positive quadratics. Three tests found negative nonlinear effects, two cubics (Ngobo 1999, cameras and a bank), and one quadratic (Taylor 2001, insurance). Other tests found linear relationships. Recently, Dong et al. (2011) tested for cubics in 972 product category-customer segments and found instances of all functional forms, but linear (51%) and negative cubic (13%) effects were most common. A zone of delight appeared in 2% of their tests. Methodological artefacts might contribute to these mixed findings. First, omitted variable bias could be an issue, as only Finn (2005) controlled for CD. Second, three studies reporting decreasing returns used single-item measures for satisfaction and intention, whereas studies reporting cubic effects usually used index or other ratio scale measures. Therefore, this research addresses some key methodological issues.
Research on Nonlinear Effects of Customer Satisfaction
Methodological Issues
Table 1 shows that researchers now use polynomial regression or nonlinear structural equation modeling to detect nonlinear or threshold effects. Nonlinear structural equation modeling has the advantage of controlling for construct measurement error when testing for quadratic and simple interaction effects (Agustin and Singh 2005, Finn 2005, Lam et al. 2004). However, it has not yet been used to assess higher order nonlinear and interaction effects because the complexity increases substantially and the likelihood of obtaining consistent simultaneous estimates of quadratics and cubics is remote (Ping 2007, p. 20). This makes polynomial regression the preferred methodological approach to research on cubics. In a polynomial regression,
Power polynomials provide a flexible approach to identifying whether nonlinearity is significant. They can approximate both increasing and decreasing returns and different threshold effects, without having to identify the specific form of nonlinearity a priori. This research tests for the polynomials by first estimating a linear model, then adding the quadratic, and then adding the cubic term, testing for the significance of the highest order term using the squared semipartial correlation (see Cohen and Cohen 1975, chap. 6). Because measurement error attenuates parameter estimates and reduces the power of these tests (see Carroll, Ruppert, and Stefanski 1995), the polynomial analysis is conducted on latent variable scores rather than observed scores.
Distinguishing a linear from a quadratic or cubic relationship presupposes the constructs are inherently quantitative and are measured in units that provide ratio-scaled measures (see Mitchell 1999). The equal interval condition is unlikely to be met in studies that employ a single-item rating scale to measure the constructs, such as Taylor (1997) and Streukens and De Ruyter(2004). Equal intervals are likely to be better approximated when using a multiple-item rating scale, as in the studies by Fullerton and Taylor (2002) and Ngobo (1999). This research employs multiple item rather than single-item scales.
Moreover, identifying threshold-like effects requires the equal interval data to be measured relative to a common scale origin. This condition is not satisfied when a rating scale is used to measure CS with each consumer responding for a single service (e.g., Finn 2005; Taylor 1997). Such data confound variation in true response to the service with differences in scale usage and response style (Baumgartner and Steenkamp 2001). Only Homburg, Koschate, and Hoyer (2005) try to account for this by collecting observations for eight restaurant scenarios from each respondent, and it found support for a positive cubic effect. This research collects fully crossed data, so observed responses for an item can, where appropriate, be transformed to deviations from individual i’s average response to the item across the m randomly sampled websites. For CS and CD, differences in the average rating for a random sample of websites reported by individuals are more likely to be due to heterogeneity of scale use and response effects than real, so removing these differences is appropriate. For example, when applied to satisfaction items (or factor scores), Equation 2 generates transformed satisfaction (TS) data with a comparable scale origin across individuals.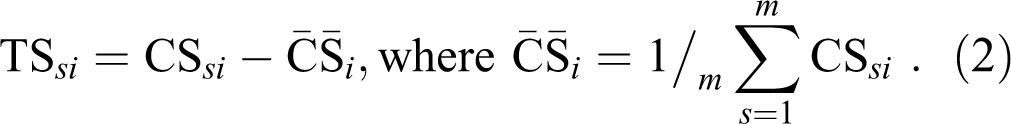
Because crossed data are repeated measures, this transformation restores independence to the multiple within respondent observations.
Ideally, the data would randomly sample all consumer services—from themed consumer environments (Kozinets et al. 2002) and third places, such as Starbucks (Thompson and Arsel 2004), to chain and mom-and-pop services. This study uses data for a sample of online retailers. This substantially reduced the study cost by eliminating respondent travel time and transportation costs, while still spanning a heterogeneous population of services.
In summary, this research uses unique data to investigate the two perspectives on CD. It simultaneously examines whether there are nonlinear effects of CS and whether a distinct CD has its own effects on behavioral intentions. Most research on CD (Finn 2006; Loureiro 2010; Oliver, Rust, and Varki 1997) did not consider the effect of CS could be nonlinear. Finn (2005) was an exception, but it considered neither cubic effects nor the methodological issues raised above.
Application
Samples of Websites and Consumers
The research context was a study of visits to online retailers. To adequately capture all sources of construct variance and covariance, the research employed a data collection design in which a sample of respondents was fully crossed with a sample of services. The stratified sample of e-services consisted of 20 online retailers. A subsample of 12 retailers was randomly sampled from a list of 1,588 Canadian retail websites. This ensured representation of smaller retailers with less sophisticated websites. The remaining 8 websites were randomly chosen from a list of 20 well-known Canadian retail websites. This ensured an overrepresentation of the types of retailers that attract a disproportionate share of visits to retailers’ websites. A simple user task was created for each of the sites, such as to select a suitable gift and to determine the total cost of purchasing it from the site. The respondents came from a posting for part-time research assistants on a Canadian University campus. Interested applicants were briefed and then assigned a pretest website to familiarize themselves with the type of task and data collection instrument. Then 20 applicants were randomly assigned to this research project rather than an alternative.
Data Collection Procedure
Data for the 400 combinations of 20 websites and 20 respondents were collected by the respondents making 1 website visit per day over 20 successive weekdays. The study design began by randomly assigning websites and respondents to 2 factors in a 20-level Latin square design. The third factor was days, so each website would be evaluated once a day by a different respondent. To control for possible order effects, the days were then randomly reordered. The respondents were given 24 hr to visit an assigned website at a convenient time using their normal form of Internet access, use the site to answer the assigned questions, complete their evaluation, and then return it to the research office. Data collection took 31 days for a total of 400 website evaluations. A Latin square design was used to avoid carryover effects created by a consistent sequencing of the website visits, while the visits were spread out to minimize the fatigue effects that would be generated if several sites were visited on the same day. Respondents reported whether they had previously visited a website; 82% were first-time visits. The website visits averaged 28.6 min in duration, with no differences between websites but significant differences between the respondents.
Construct Measures
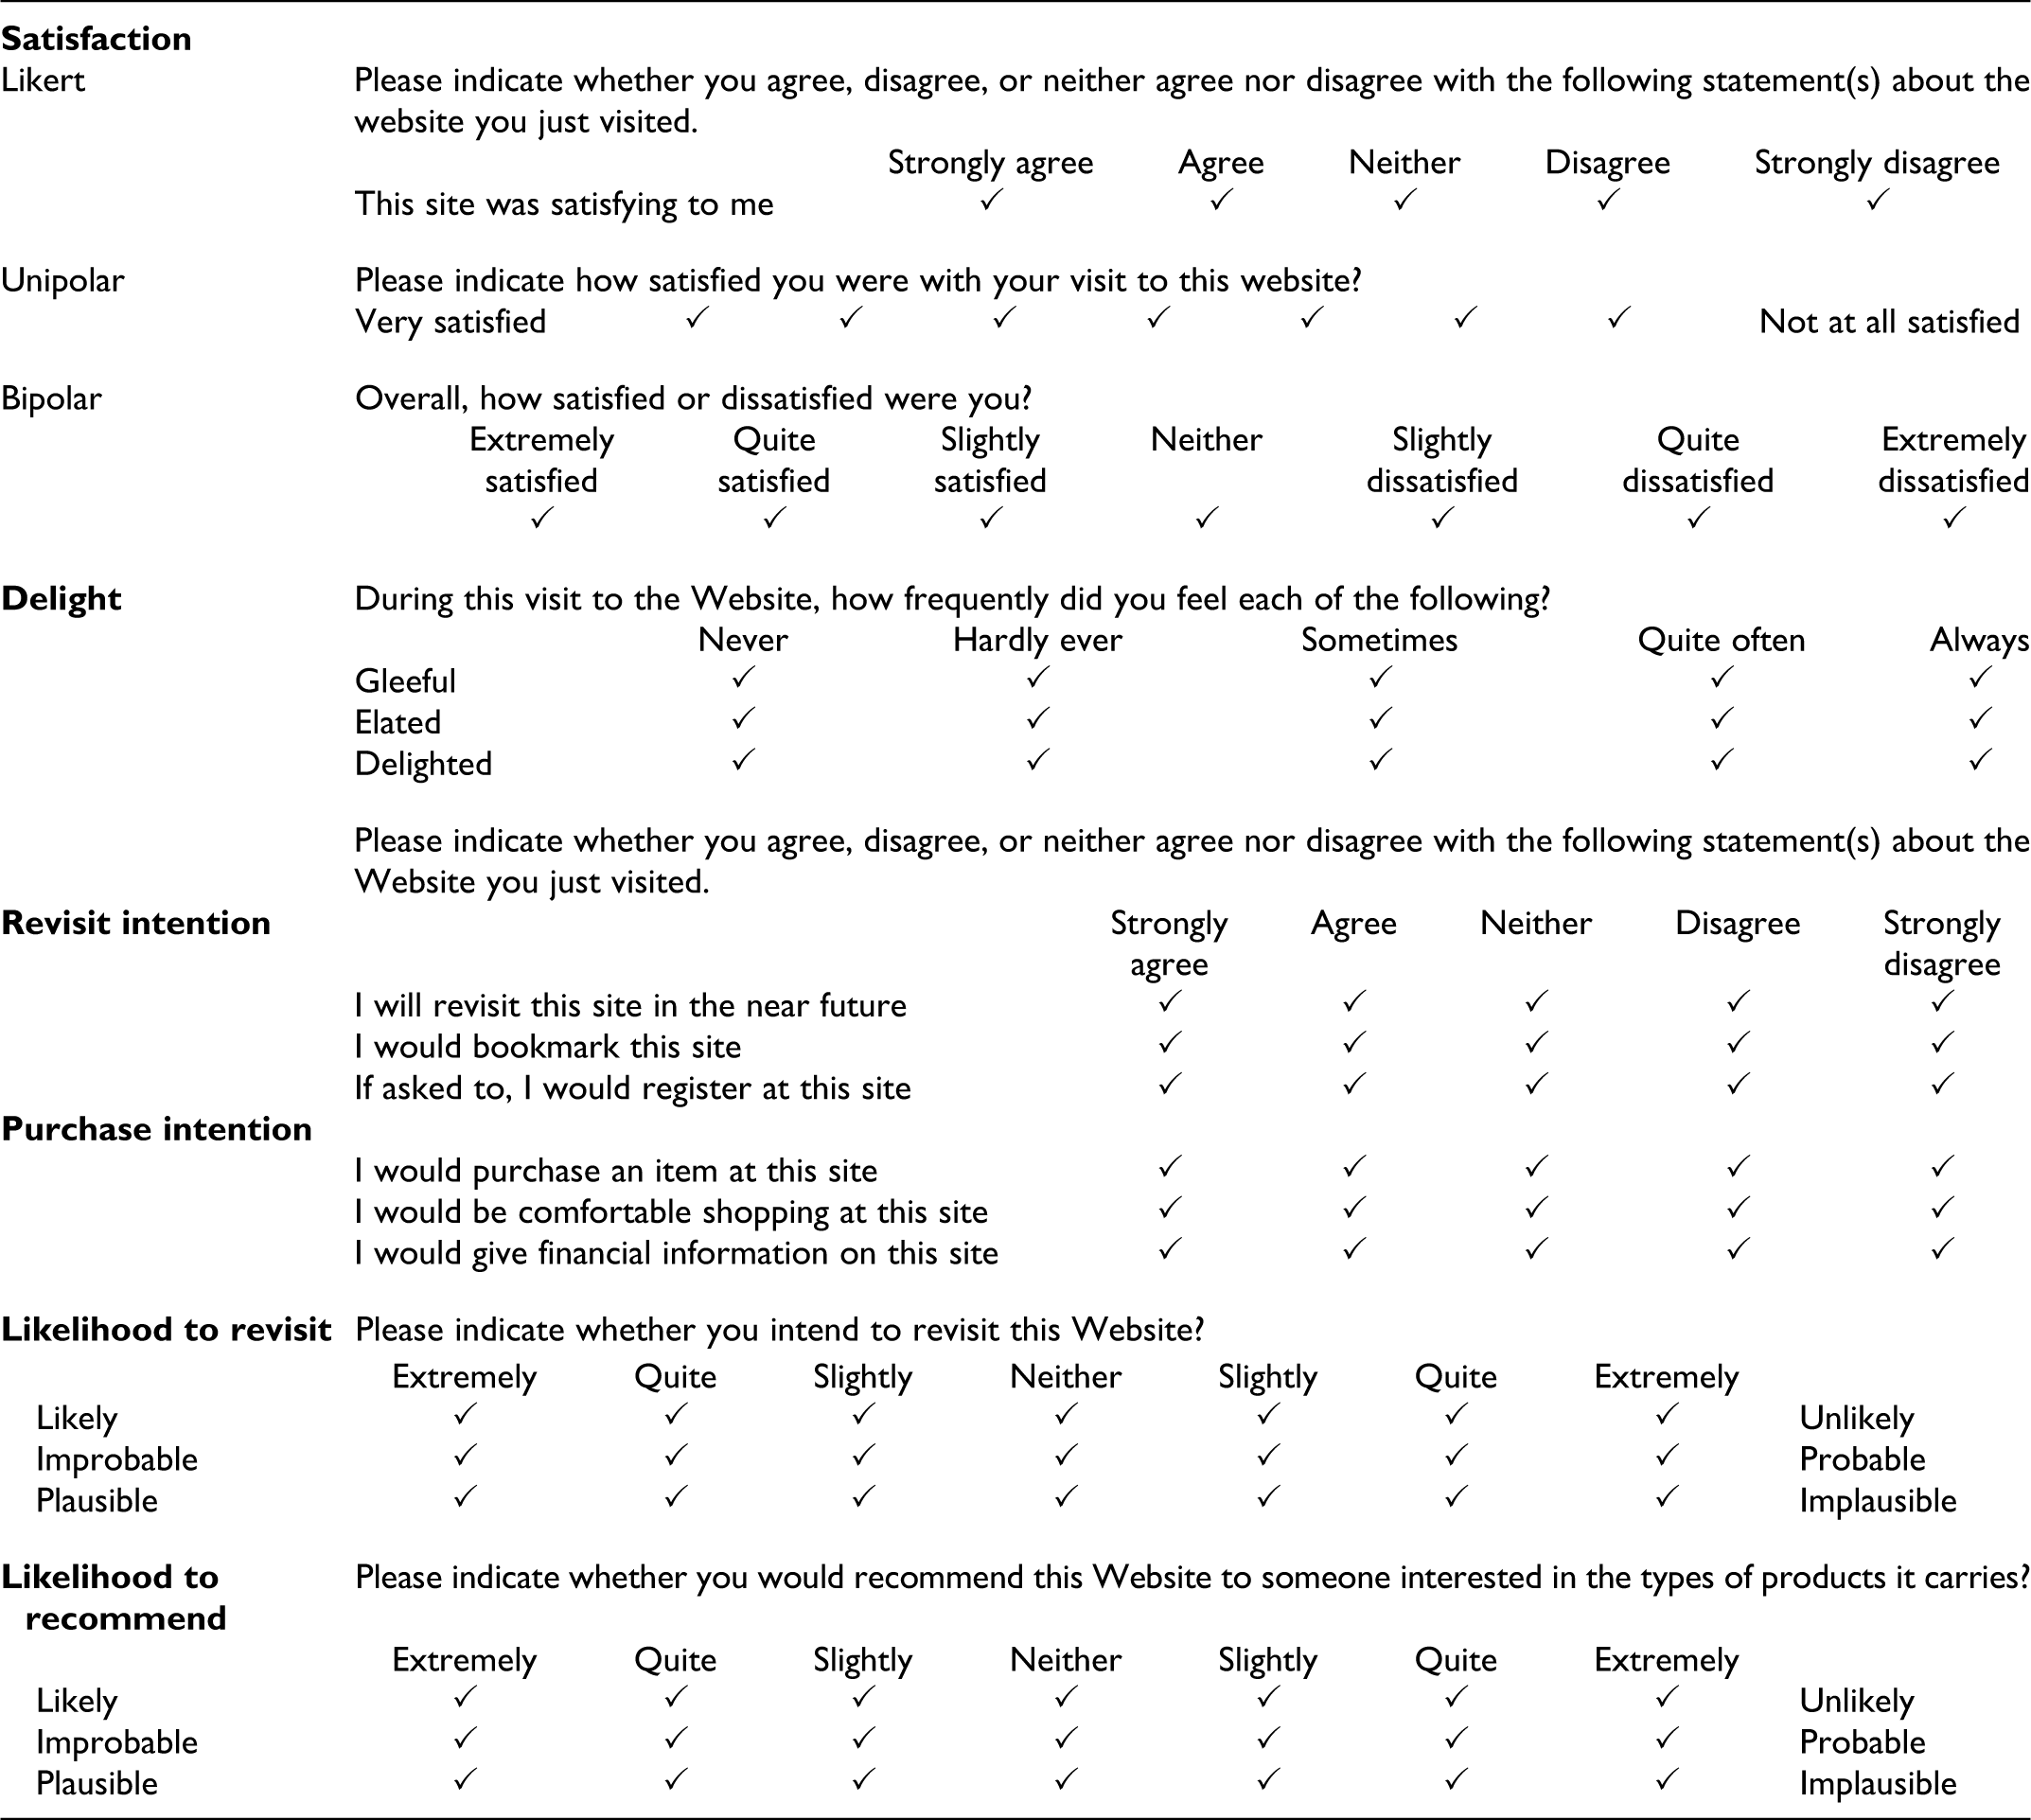
The measures used are shown in Appendix A. Delight is a specific emotion state that is experienced all-or-none (see Rossiter 2011, p. 83), so what varies is how often it is experienced. 1 Therefore, CD used the 3-item scale for frequency of occurrence from Finn (2005). CS used conventional ratings, namely, a 7-point unipolar satisfaction, a balanced 7-point bipolar satisfaction to dissatisfaction, and a 5-point Likert-type item. Data were collected for four behavioral intentions scales. The research focused on a 3-item Likert-type revisit intention scale. It had a distinct response format to help limit common method variance and it corresponded most closely with the measures of delight and satisfaction, as the website visits did not include making a purchase. The other behavioral intentions scales (likelihood to revisit, likelihood to recommend, and purchase intention) were used to investigate the generalizability of the findings.
Analysis and Results
Scale validity was investigated using LISREL 8.8 to estimate a three-factor confirmatory factor analysis (CFA) measurement model on the transformed CD, transformed CS, and revisit intention items. 2 Then, latent variable scores for these three scales were used to investigate the relationships.
Construct Measurement Model
Completely standardized estimates of loadings, measured squared multiple correlations, and construct intercorrelations for the 9-item, 3-construct measurement model are shown in Table 2. This model was rejected in a test of exact fit, χ2(df = 24) = 70.6, p. = .000, but other fit indices were indicative of close fit (Non-Normed Fit Index [NNFI] = .984, comparative fit index [CFI] = .990, standardized root mean square residual [SRMR] = .025, root mean square error approximation [RMSEA] = .068; see Hu and Bentler 1999). 3 The measures of CD, CS, and revisit intentions all exhibited adequate internal consistency, as indicted by Cronbach’s α values exceeding .70 and average variance extracted (AVE) values exceeding .50. Moreover, the AVE value for each construct was greater than the square of its correlation with the other constructs, satisfying the Fornell and Larker (1981) criterion for discriminant validity.
CFA Measurement Model Parameters
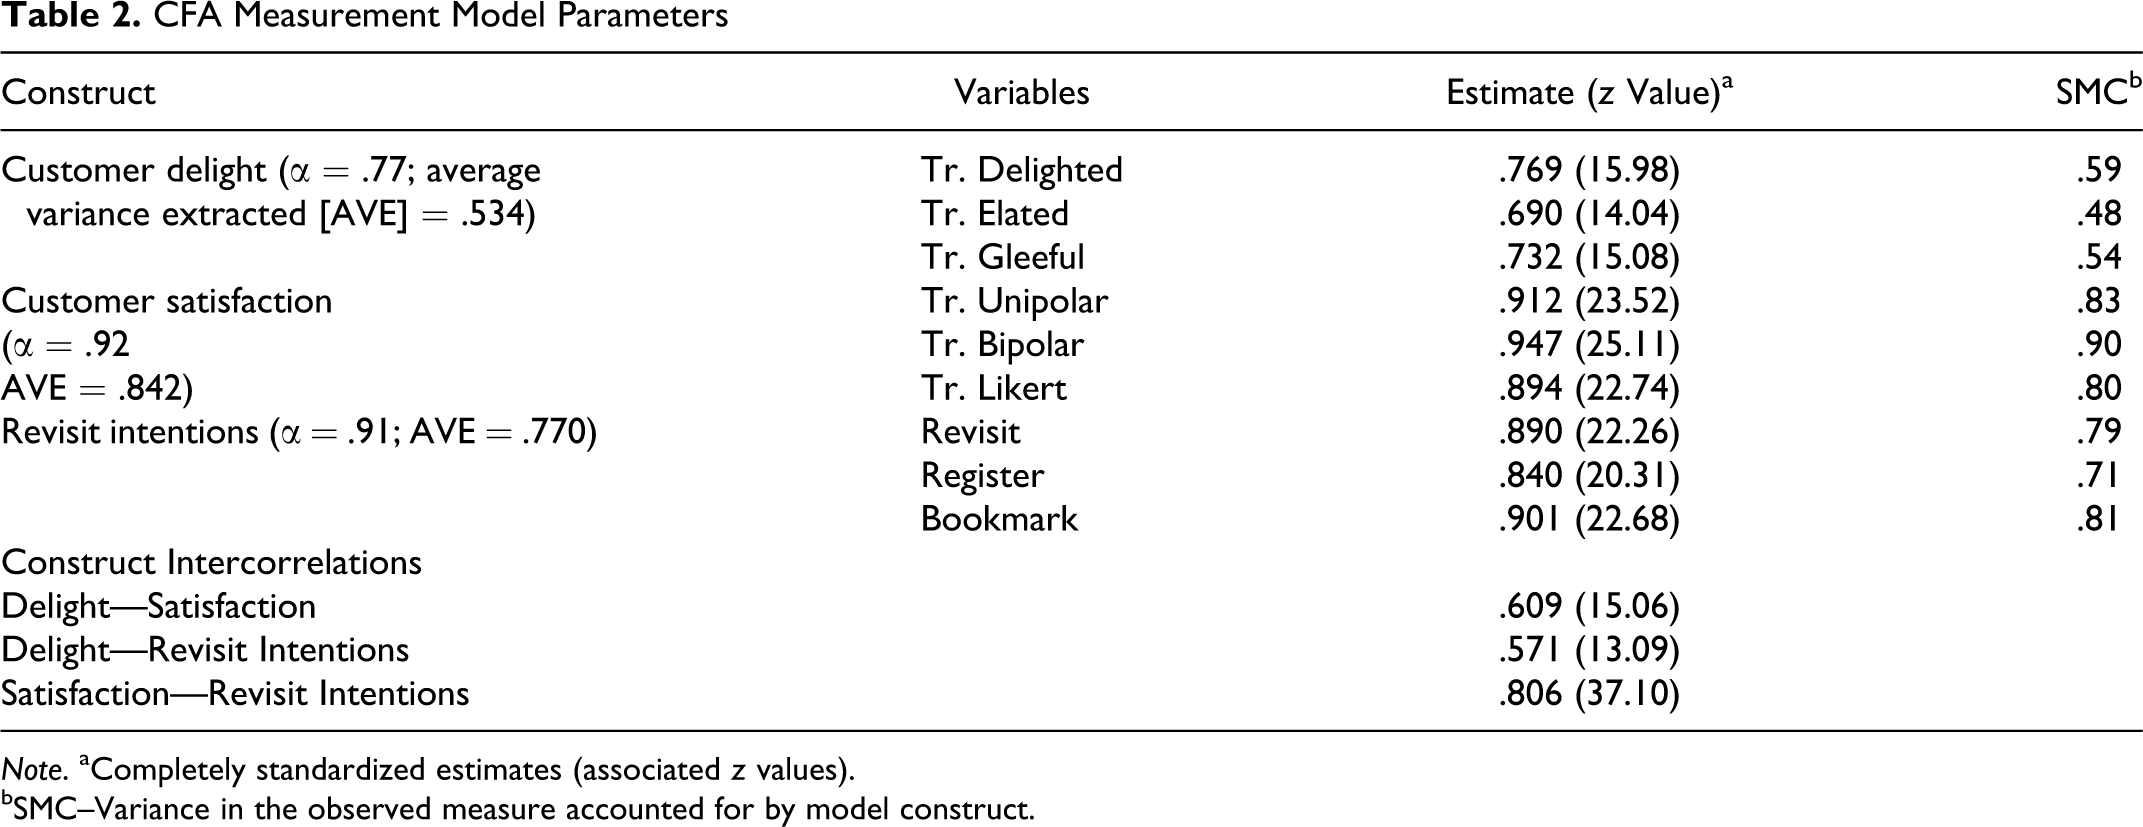
Note.
aCompletely standardized estimates (associated z values).
bSMC–Variance in the observed measure accounted for by model construct.
Linear Structural Model
Next, a structural model in which CD and CS both have direct linear effects on revisit intention was estimated using the same data. With delight and satisfaction free to correlate, this model is equivalent to and so has the same fit as the measurement model. Therefore, the sole concern was the structural parameters, which were both significant at the p < .01 level. The completely standardized structural effects on revisit intentions were .13 for CD and .73 for CS. Together delight and satisfaction accounted for 66% of variance in revisit intentions.
Nonlinear Effects
The test for nonlinear effects of CS and CD on revisit intentions employed multivariate polynomial regression analysis using latent variable scores for the constructs. This analysis took a hierarchical approach, beginning with stages of the bivariate polynomial analysis for CS, and then stages adding CD and interaction terms. It used transformed latent variable scores for CS and CD obtained by applying Equation 2. These take advantage of the crossed data structure to provide deviation scores from the mean (over the 20 websites) reported by each respondent. Table 3 reports the model parameters, standard errors, and associated probabilities and the variance accounted for at each stage of the analysis.
Hierarchical Regression Models for Revisit (Behavioral) Intentions
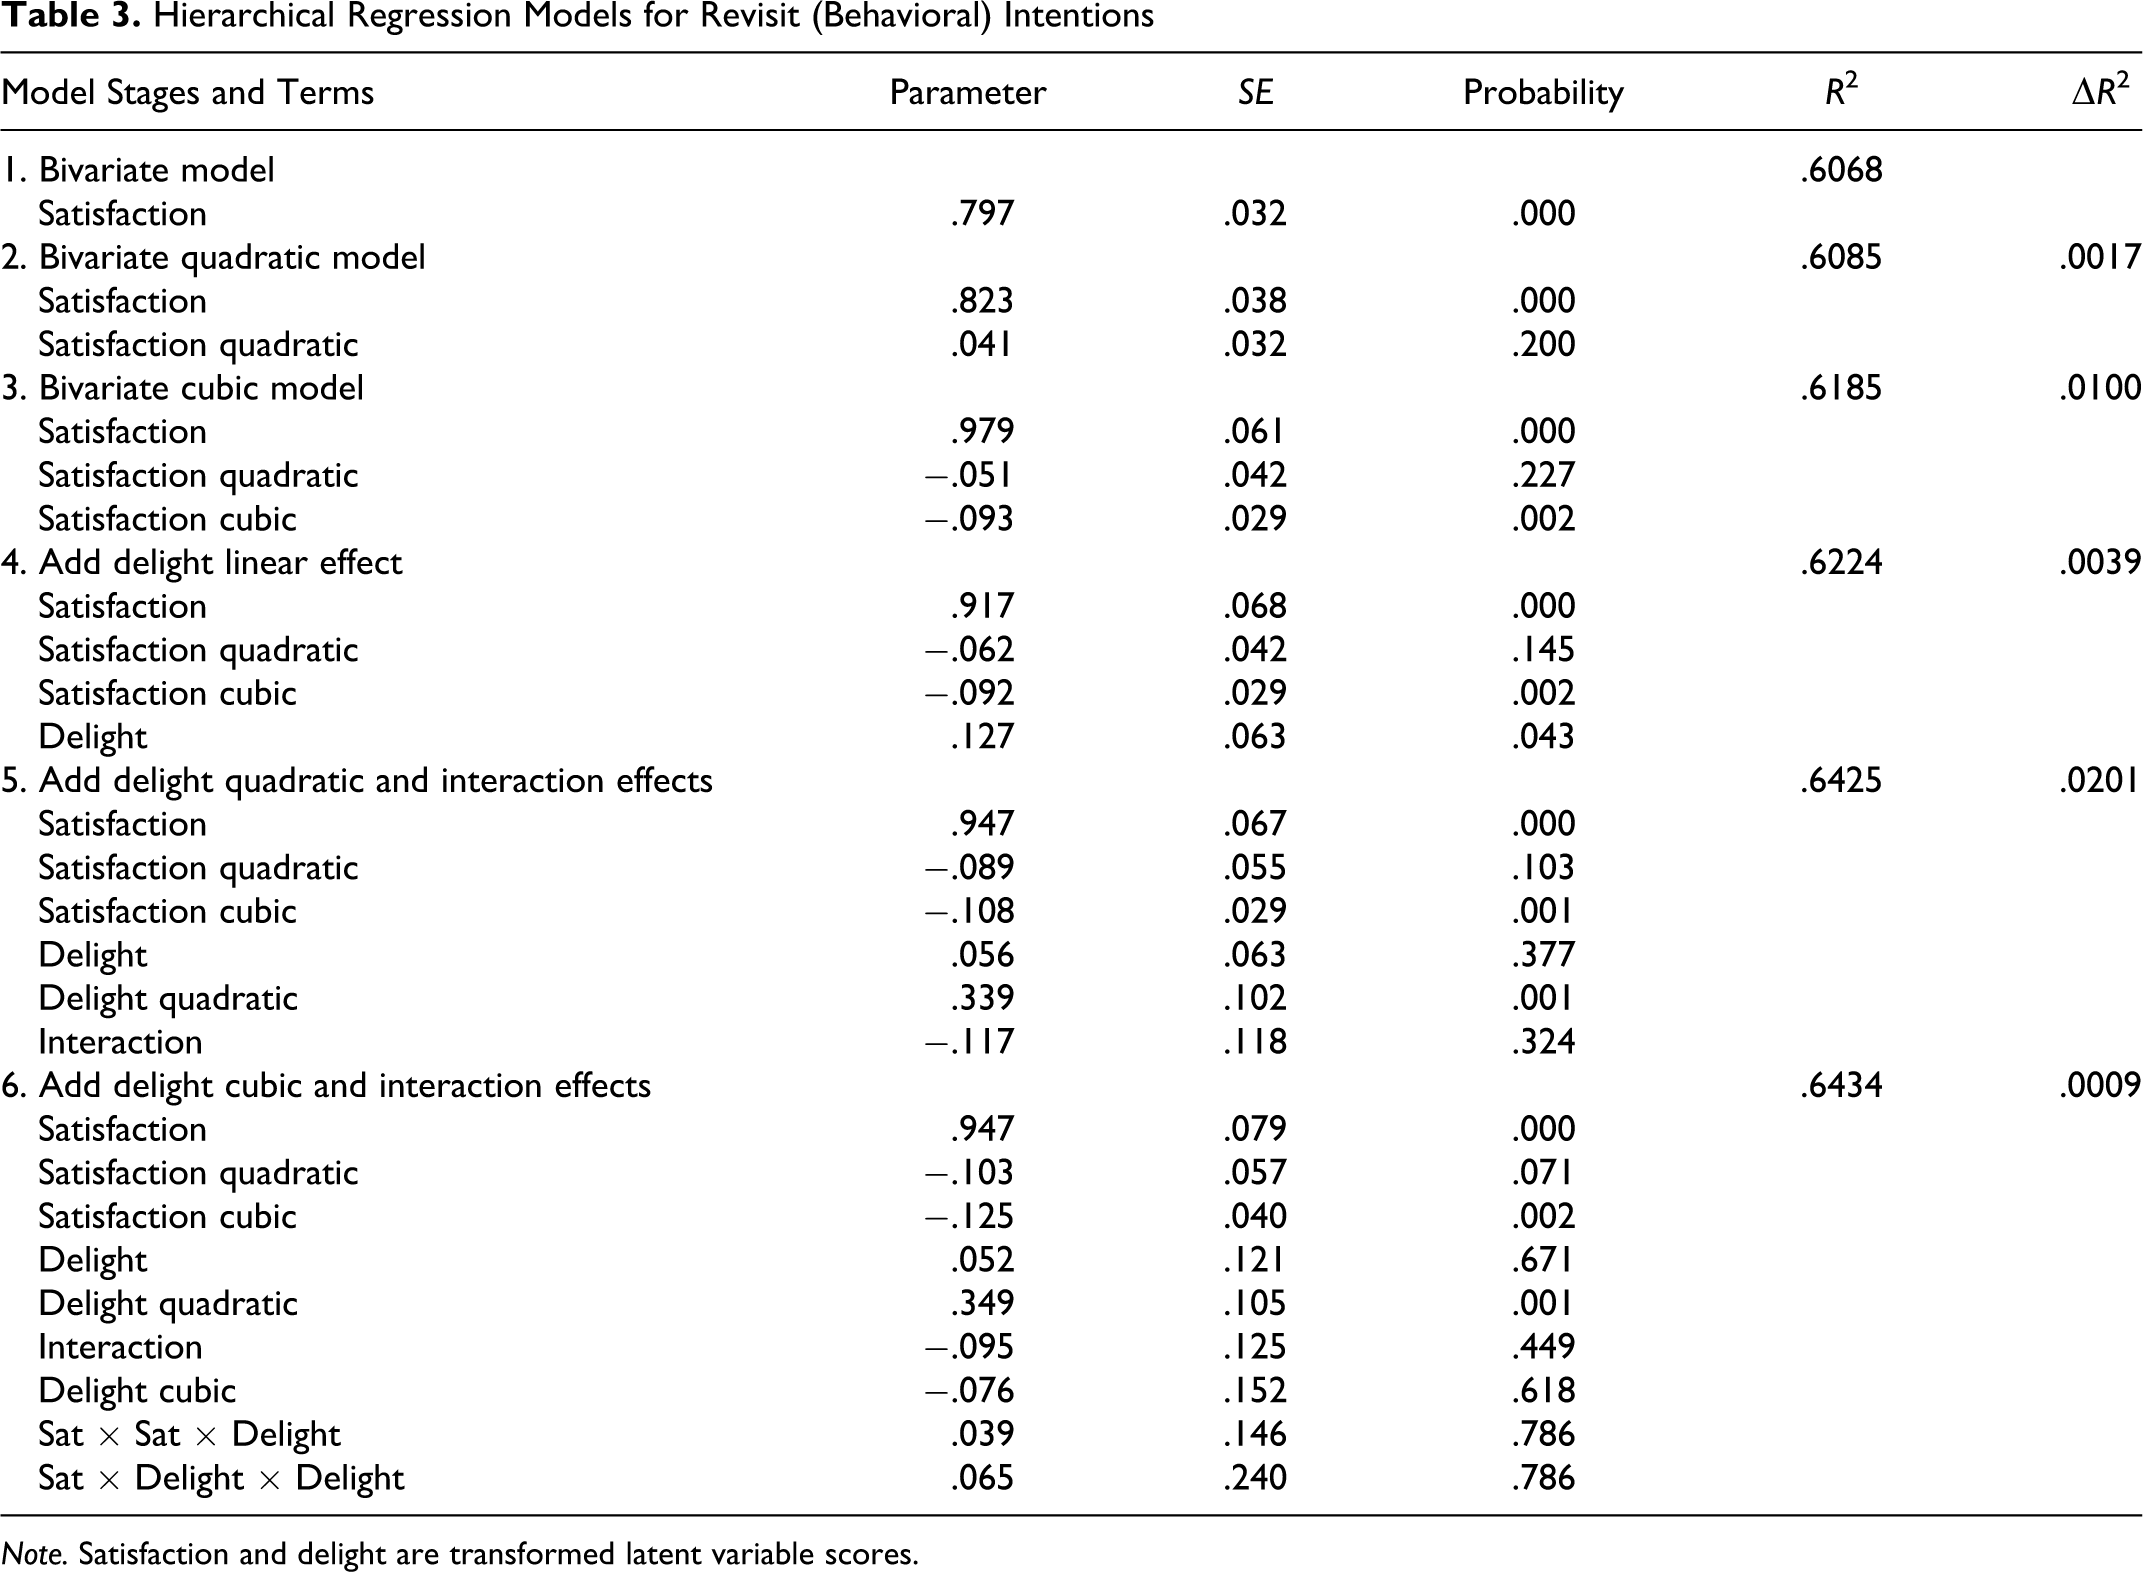
Note. Satisfaction and delight are transformed latent variable scores.
Bivariate Effects of CS
For the bivariate effect of CS, the linear model is positive and significant, the squared semipartial correlation for the quadratic effect is insignificant, but the squared semipartial correlation for the cubic effect is negative and significant at .001 level. The nonlinear effects account for an additional 1.17% of the variance in revisit intentions. Thus, the data identify a form of nonlinearity but the shape is inconsistent with a zone of delight.
Figure 2A shows the cubic model fit line and contrasts it with the Stage 1 linear fit line. Of note is the flattening of the cubic function at very low and very high levels of satisfaction. Figure 2B shows the fit of a smoothing spline (see Eubank 1988) to these data. It clearly illustrates that the negative cubic shape is consistent with the dual threshold model in which variation in CS below a lower and above an upper threshold has less effect on revisit intentions than it does between the two thresholds, where there is a region of steeper linear response (i.e., Figure 1C).
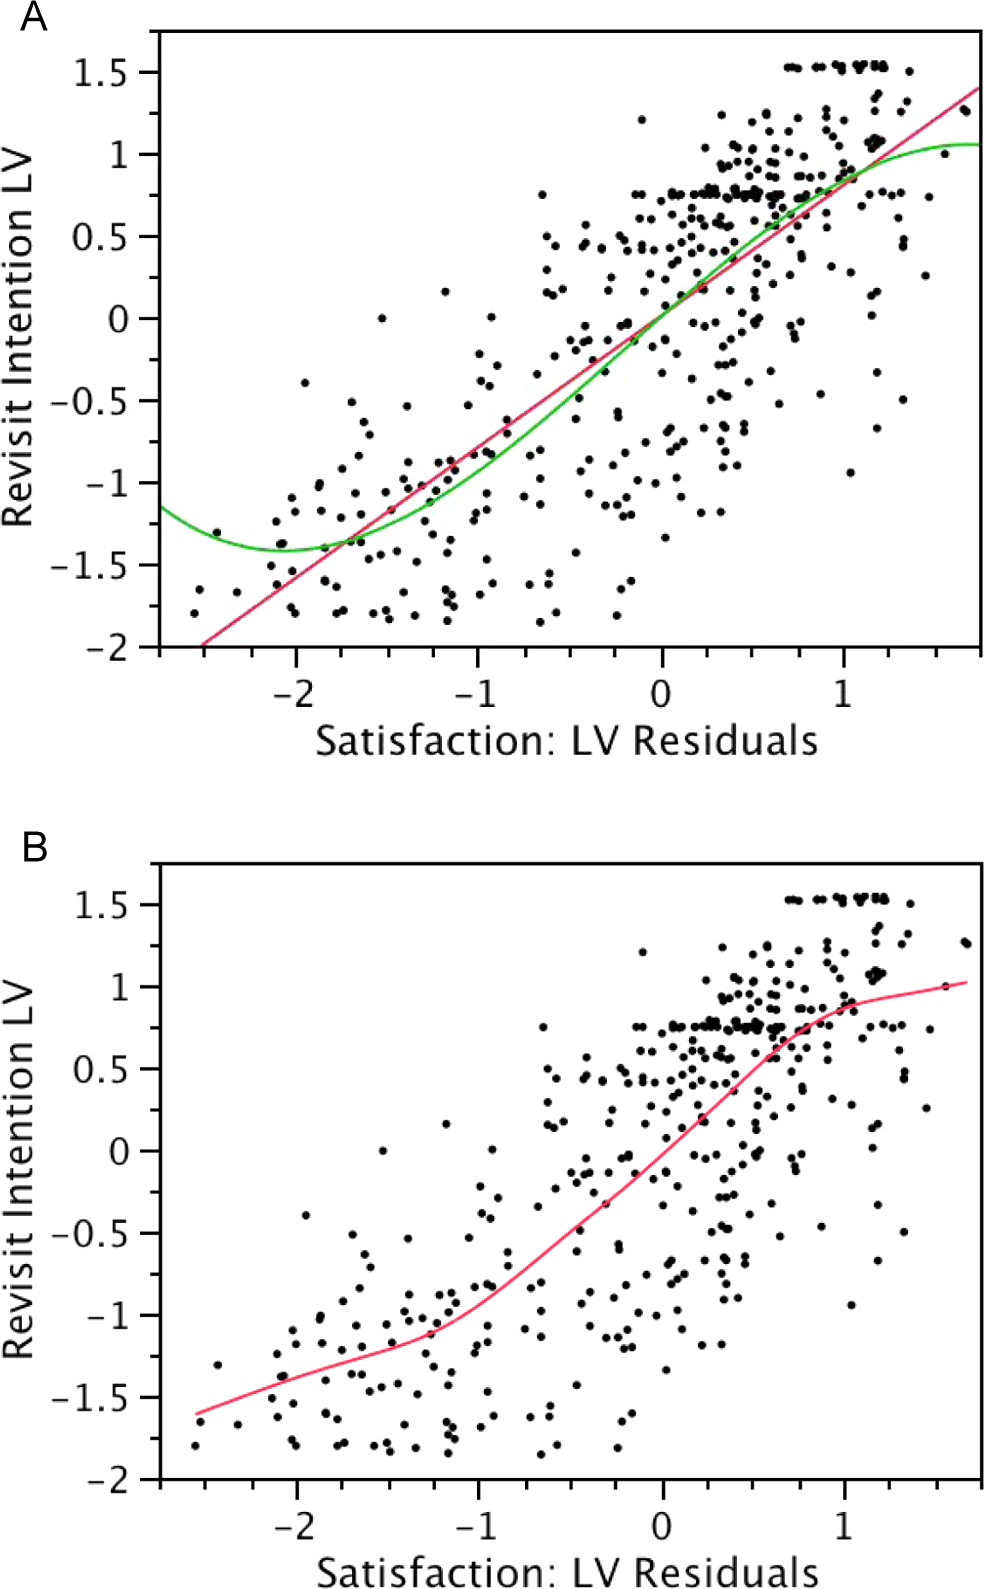
(A) Bivariate fit of behavioral intentions by residualized customer satisfaction. Linear fit and polynomial fit degree = 3; Rev Intent = .797 Satisf RSq. = .607; Rev Intent = -.007+ .979 Satisf -.051 Satisf2 – .093 Satisf3 RSq. = 619. (B) Smoothing spline fit of behavioral intention by residualized customer satisfaction.
Simultaneous Effects of CS and CD
To further investigate the alternative views of CD, we continued the hierarchical analyses, by introducing CD into the CS polynomial regression. As shown at Stage 4 in Table 3, the linear effect of CD is positive and significant when controlling for the cubic satisfaction effects but accounts for only an additional 0.39% of the variance. Incorporating this linear effect of CD into the model has minimal impact on the parameters for the polynomial effects of CS.
Stage 5 in Table 3 adds the quadratic effect of CD and the interaction effect of CS with CD to the polynomial regression. This model accounts for an additional 2.01% of variance because customer delight exhibits a significant positive quadratic effect. The interaction between CS and CD is insignificant. Finally, at Stage 6, the cubic effect of CD and the higher order interaction effects of CS with CD are all insignificant. Thus, the polynomial regression using residualized scores identified a positive linear and a negative cubic effect of CS and a positive quadratic effect of CD.
Generalization to Other Intentions
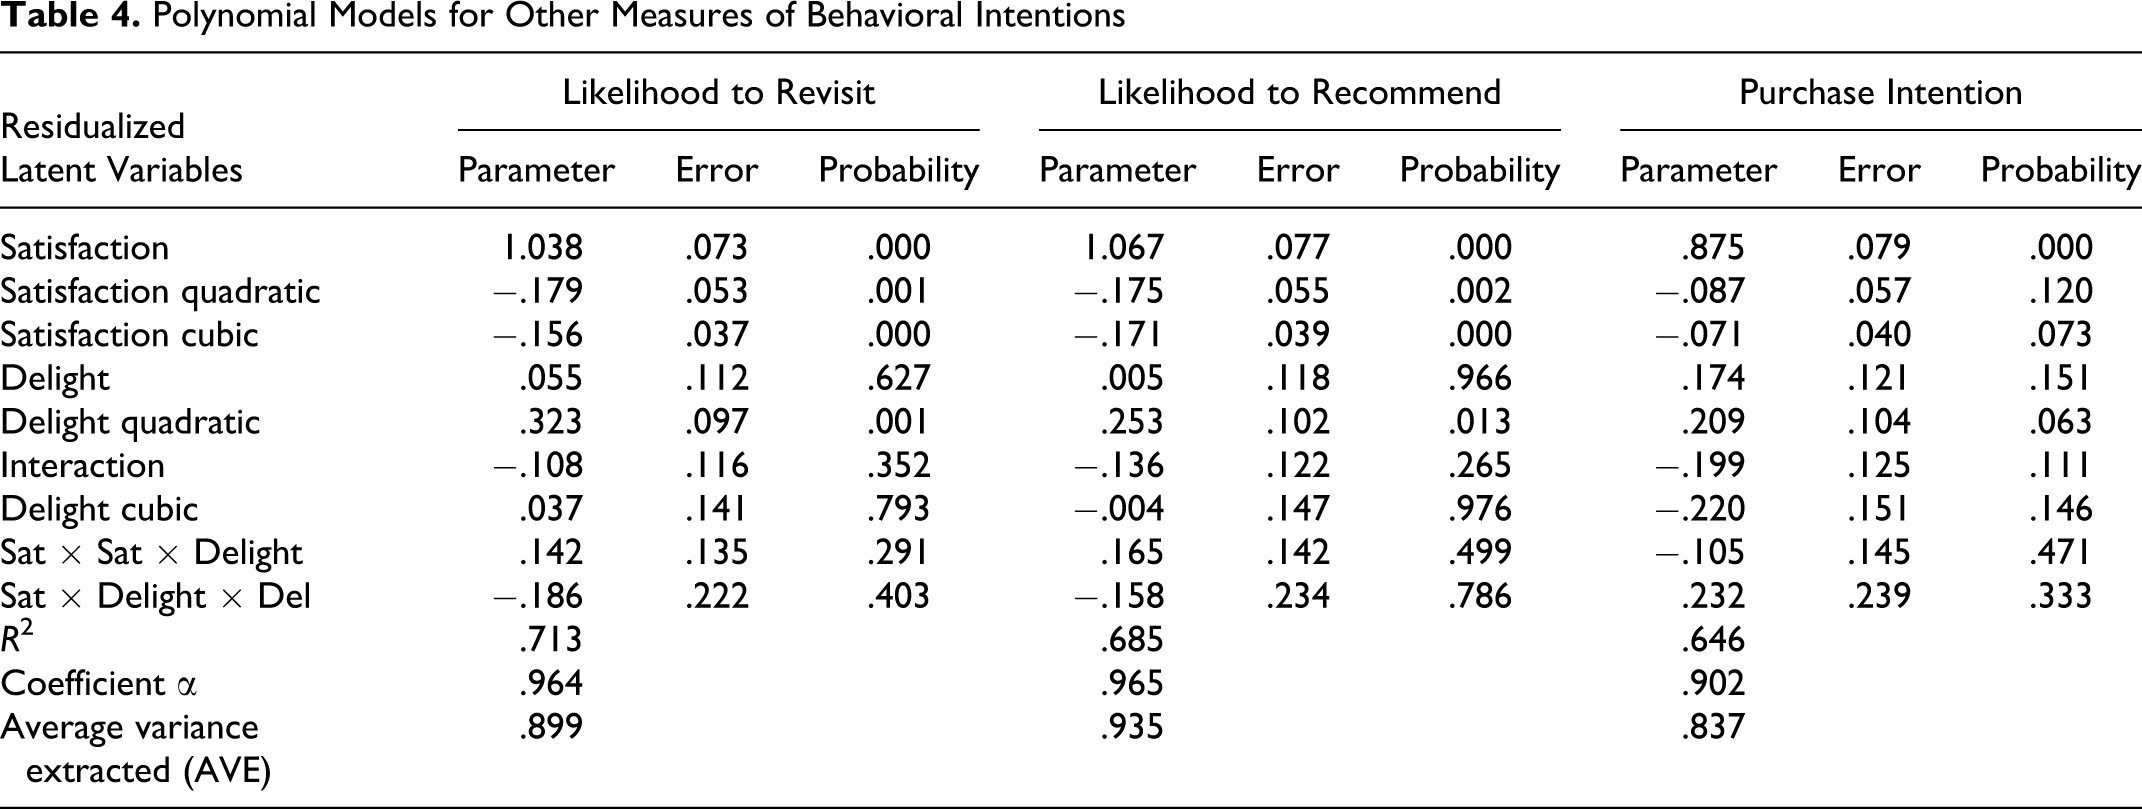
The data collection included three other Behavioral Intentions scales, namely, 3-item semantic ratings of likelihood to revisit and of likelihood to recommend, and a 3-item Likert-type scale for purchase intention. To assess the generalizability of the observed effects to other intentions, the final model (Stage 6) was also estimated for residualized scores for each of these scales. As shown in Table 4, the significant effects for likelihood to revisit and likelihood to recommend were the same as for revisit intention, verifying the robustness of the earlier results. For purchase intention, the negative cubic for satisfaction and the positive quadratic for CD were directionally consistent with the other three intentions but only reached marginal significance (p < .10).
Polynomial Models for Other Measures of Behavioral Intentions
Relationship Between CD and CS
The CFA results reported earlier indicated that CD and CS are correlated but exhibit discriminant validity. That analysis assumed a linear relationship, observations were independent, and the measures provided ratio scale data. Subsequent results suggest that these assumptions were not satisfied, so the relationship was reexamined using the residualized latent variable scores and polynomial regression. At the linear stage, CS was significant and accounted for 38.4% of variance in CD. The quadratic term was also significant and positive and increased the variance accounted for to 40.6%. The cubic term was insignificant. CD is only weakly associated with CS at below-average levels of satisfaction but becomes more strongly associated at satisfaction levels that are above the respondents’ average level.
Discussion
Two perspectives on CD have coexisted in the service literature. In the first, CD is a distinct construct with its own effect on behavioral intentions. In the second, a positive cubic nonlinearity in the effect of CS on behavioral intentions is identified as a zone of delight. To reconcile these perspectives, this research investigated whether the relationships between CS and intentions and CD and intentions are linear, quadratic, or cubic when considered simultaneously. The research avoided some methodological shortcomings that limit the value of earlier work examining these relationships. First, by randomly sampling online retailers, it ensured the analysis investigated the full range of satisfaction and delight, with representation proportionate to the frequency with which they are actually experienced. A truncated sample could result in a cubic response function being misidentified as quadratic. Second, it addressed the comparability of the levels of CS and CD reported by different respondents, using fully crossed data to obtain transformed measures with a common zero point. Illustrating the importance of this step, follow-up polynomial regression analysis of the untransformed data produced quite different results, namely, a positive quadratic effect of CS, a positive linear effect of CD, and a negative interaction between satisfaction and delight.
First, this research supports the Oliver, Rust, and Varki (1997) contention that CD and CS are distinct responses to a service experience. These constructs exhibit discriminant validity for respondents visiting Canadian retail websites, a finding that is consistent with those reported in Finn (2005) and Loureiro (2010). Here, CD has its own significant effect on behavioral intentions, whereas earlier research (Finn 2005, 2006; Loureiro 2010; Oliver, Rust, and Varki 1997) reports conflicting findings. An important implication is that service organizations have to measure and manage their levels of CD because it is a separate performance metric. They need to consider the effects that any change in marketing strategy or tactics will have on levels of CD as well as the effects on the levels of CS.
Second, this research finds a nonlinear effect of CS on behavioral intentions, but it is not consistent with a zone of delight. The nonlinearity is not the positive cubic (Figure 1B), reported by Keiningham, Perkins-Munn, and Evans (2003) and Homburg, Koschate, and Hoyer (2005). Rather, it is a negative cubic (Figure 1C), close to the dual threshold model with a flat ceiling effect zone, proposed by Ngobo (1999). It can also be described as a combination of increasing returns at below-average levels of satisfaction and decreasing returns at above-average levels of satisfaction. An important implication for service resource allocation is that an improvement in satisfaction has more impact when it is around the average level than when it is already at a higher level.
Third, when controlling for the nonlinear effects of CS, this research finds the significant positive effect of CD on behavioral intentions to be quadratic. An increase in delight has more impact when it is already at higher levels than when it is around average or lower levels. CD accounts for only 2.4% of the variance in revisit intention beyond that already accounted for by the nonlinear effect of CS. This modest observed impact of CD might be explained by the limited amount of delight generated by the combinations of websites and shopping tasks and by the limitations of the pen and paper instrument used to capture it.
One implication for resource allocation is that CD has a threshold above which each increases in CD has a greater impact on behavioral intentions. Another is that once CS is above average, resources should be devoted to creating CD rather than increasing CS. There are practical implications for some websites included in the study. Given the mean CS and CD they obtained in the study, Basket of Wishes, selling gift baskets (−1.34, −0.44), and Club Monaco, unisex apparel (−0.41, 0.18), should focus their resources on improving satisfaction, whereas Chapters, an online bookstore (0.88, 0.57), should focus entirely on improving CD, as its satisfaction is approaching a level of flatter response, whereas its CD is at a level of increasing response. Chapters should try to surprise customers with service that exceeds their hedonic wants and generate more delight rather than to better fulfill utilitarian needs to increase satisfaction (Chitturi, Raghunathan, and Mahajan 2008). Wang (2011) shows providing customers with unexpected supporting services is one way to do this.
Finally, our results for the transformed data shed new light on the true relationship between CS and CD. A follow-up polynomial regression analysis using the untransformed data found a positive linear relationship. After accounting for differences due to the respondents’ evaluation standards and/or use of the response scales, this research found that CD has a positive quadratic relationship with CS. There is little association at below-average levels of CS. At above-average levels of CS, increases in CS are associated with stronger increases in CD. This could explain the persistence of the belief in a zone of CD (Berman 2005; Keiningham and Vavra 2001; Rust, Zahorik, and Keiningham 1994), when academic research (Finn 2005; Oliver, Rust, and Varki 1997) shows CS and CD are two distinct constructs.
Limitations
The methodological choices made here mean the modest nonlinear effects that were observed here are for websites of Canadian retailers that are evaluated by respondents selected from applicants for marketing research assistant positions on a Canadian university campus. Future research should examine whether the results generalize and whether effect sizes are greater for other consumers and for services that produce stronger emotional responses. Data sampling from all consumer service environments would be ideal.
A second limitation is the respondents were sent to the websites and we measured their interaction-specific satisfaction. Thus, they were not necessarily interested in the retailers’ product lines, and so might not be interested in returning even if fully satisfied and delighted by a website. Moreover, respondents did not complete a purchase transaction, so their responses do not reflect payment or fulfillment issues (Parasuraman, Zeithaml, and Malhotra 2005). Future research should examine the generalizability of our results for cumulative satisfaction and for respondents varying in their situational and/or enduring involvement with a service. Third, respondents were aware that they would be reporting their responses to the websites. This awareness might increase the correlation between their reported responses; its effect on the shape of the relationships between satisfaction, delight, and intentions is unclear.
Finally, like much of the research summarized in Table 1, this research collected measures of CS, CD and behavioral intentions in the same survey. It did not address subsequent behaviors, such as return visits or later purchase behavior on the website. Future research should address whether the relationships between CS, CD, and actual behavior are the same as those for behavioral intentions.
Conclusions
CD is used to refer to two things in the service literature, for a distinct response and for an upper zone of positive nonlinear response to CS. This research took advantage of crossed services by respondents’ data for online retailers to examine how CD as a distinct response and any nonlinear (positive cubic) effects of CS simultaneously influence behavioral intentions. The results are more consistent with the distinct construct perspective. CS accounts for more variance but there is no support for the upper zone of delight perspective. Its nonlinear relationship with behavioral intentions is a negative cubic with a flatter ceiling effect zone at higher levels of satisfaction. Controlling for the nonlinear effects of CS, CD has its own positive quadratic effect on behavioral intentions. These results suggest CD is a service performance metric that needs to be monitored and managed just like CS. Once CS approaches the ceiling zone, resources should be allocated to increasing CD. If CD remains below its threshold level, moving respondents from satisfaction levels that are 1 SD to 2 SDs above the average will not have any impact.
Executive Summary
Consumer information is critical as companies tailor their efforts to better meet the needs of customers. Nowhere is this more true than in online services. Firms must understand how consumers evaluate the potential losses and gains to disclosing personal information and how that links to the strategies they can enact. According to David Mothersbaugh, a researcher on this project, “perhaps the most important aspect of our research is the revelation that the sensitivity of information requested plays a major role in how consumers view the losses and gains of information disclosure. When information is lower in sensitivity, consumers perceive lower potential losses to disclosure and as a result even consumers who exhibit relatively high levels of privacy concern are still willing to disclose. This is not the case, however, when information is more sensitive, in which case online privacy concern inhibits disclosure as one might expect.” Another intriguing aspect of this research is the role that firm-level information control plays in the disclosure process. According to Sharon Beatty, another researcher on this project, “consumers want to be able to control how firms handle their information in terms of usage beyond the initial purpose, sharing with other companies, and so on. This factor is particularly important when firms want to garner more sensitive information from consumers. Typically, consumers are more averse to disclosing more sensitive information. However, our findings show that this can be offset to some degree when firms provide consumers the ability to control the use of their information within their privacy and information policies.” Website customization is another important tool to enhance disclosure. According to William Foxx, another researcher on this project, “customization is a critical strategic tool for firms who want to enhance online disclosure. Although less effective when information is higher in sensitivity, it is a factor that can be used by firms to provide benefits to consumers that help offset the perceived losses associated with disclosure.” Beyond customization and control, firms should examine the online privacy concerns held by their consumers in regard to their specific website and the reasons behind these concerns. According to Beatty, “firms should enact strategies at both the micro and macro level that improve consumer perceptions of the firm’s website and the firm itself. Our results show that firm trust is a major factor in enhancing consumer disclosure. Broad efforts such as corporate reputation building as well as more micro tactics such as privacy seals can help in this regard.” In recognizing the burdens of disclosure and the difficulty of overcoming consumer concerns, firms should consider matching their information requests to the specific needs at hand. According to Mothersbaugh, “a one size fits all strategy to information gathering is not appropriate. Firms must consider both their information needs and the privacy concerns of their various consumer segments, and request the least sensitive information possible for effectively marketing to each of those segments.”
Footnotes
Appendix A
Notes
The author(s) declared no potential conflicts of interest with respect to the research, authorship, and/or publication of this article.
The author(s) disclosed receipt of the following financial support for the research, authorship and/or publication of this article: Support for this research was provided by a Social Sciences and Humanities Council of Canada Initiative on the New Economy Research Alliances Program [Grant 538-02-1013].
References
Supplementary Material
Please find the following supplemental material available below.
For Open Access articles published under a Creative Commons License, all supplemental material carries the same license as the article it is associated with.
For non-Open Access articles published, all supplemental material carries a non-exclusive license, and permission requests for re-use of supplemental material or any part of supplemental material shall be sent directly to the copyright owner as specified in the copyright notice associated with the article.