
Abstract
Flat rates are a dominant pricing scheme in many consumer service industries that largely benefit service providers: Many customers exhibit a bias and choose flat rates even though a pay-per-use plan would be less expensive for them. Yet, whereas the degree of flat-rate bias varies strongly across services, no study has determined whether consumers’ consumption goals might influence its extent. The authors argue and show that consuming services to attain hedonic gratification leads to a significantly higher flat-rate bias than using services to fulfill utilitarian needs. The three well-known flat-rate bias effects (taximeter, insurance, and overestimation) fully mediate the relationship between the consumption goal and flat-rate bias. In three experimental studies, the authors consistently show that these findings apply across different services, for a service that relies on natural variance in customers’ consumption goals, and for the same service framed as hedonic, utilitarian, or a hybrid. These findings show that managers need to be aware of major “natural” industry differences in the level of flat-rate bias. However, service providers can also actively manage and increase consumers’ hedonic consumption goals for their services and thus increase their share of flat-rate contracts. A further experiment shows that the hedonization tactic has no negative side effects on consumers’ price perceptions in terms of willingness to pay (WTP). Service providers can benefit from hedonizing their services as long as it is compatible with their value proposition.
Flat-rate pricing appears increasingly popular in service sectors. Although most common in telecommunications, flat rates can be found in all industries—from all-inclusive vacation resorts to music download platforms to public transportation day passes. For example, in the Munich public transportation system, customers can choose to pay €2.50 per ride or buy a day pass for €11, allowing unlimited rides. For heavy users, unlimited consumption at a fixed price can be a bargain. Yet many customers exhibit a flat-rate bias and choose this pricing scheme even though a pay-per-use rate would be less expensive for them. That is, a flat-rate bias contradicts standard economic theory, according to which customers try to maximize their welfare and choose the rate that leads to minimal costs (Khan, Dhar, and Werternbroch 2004). Multiple studies confirm the existence of this bias (e.g., Hobson and Spady 1988; Kling and van der Ploeg 1990; Nunes 2000). Lambrecht and Skiera (2006) find support for three effects that ultimately cause this flat-rate bias: the taximeter effect, such that watching the fees accumulate makes the consumption experience less enjoyable; an insurance effect that provides protection against unexpectedly high bills due to higher demand; and the overestimation effect that occurs when consumers poorly predict their demand for the service.
Furthermore, the degree of flat-rate bias varies significantly across industries. Mitchell and Vogelsang (1991) report that 45% of households pay too much for telephone packages, and Nunes (2000), in a survey of health club users, finds that 61% overpay. For Internet services, Lambrecht and Skiera (2006) identify only 38% of customers who would have saved money with variable pricing. Because a flat-rate bias directly increases revenues and thus profit, understanding these variations is important for service providers. To make the right pricing decisions, service managers need answers to several questions: Are some types of services more prone to evoke a flat-rate bias? What underlying processes define these differences? Can service managers actively manage customers’ propensity to pick a flat rate?
Behavioral decision research might contribute to the answers through a consideration of consumption goals (Loewenstein 2001) because “consumer choices are driven by utilitarian and hedonic considerations” (Dhar and Wertenbroch 2000, p. 60). Researchers have demonstrated that consumption goals affect product choice (Maslow 1968) and evaluations (Okada 2005). Consumption goals express utilitarian and hedonic benefits derived from usage, and the type and amount of such benefits likely determines the strength of flat-rate bias effects. Consumers striving for hedonic benefits should, for example, have a higher degree of usage overestimation, since affect-rich, hedonic services induce an emotional evaluation mode that is more susceptible to bias (Nunes 2000). The consumption of hedonic services should also evoke feelings of guilt (Okada 2005), which increase the negative effect of watching the fees accumulate (i.e., taximeter effect). Therefore, consumption goals should influence flat-rate bias effects and then exert an indirect impact on flat-rate choice. This potential impact of consumption goals on price plan choices and the flat-rate bias has not been studied previously.
From a service manager’s perspective, understanding this potential impact is highly relevant. Managers of utilitarian services such as public transportation might anticipate that they benefit less from flat-rate bias than do managers of hedonic services, such as theme parks. But is this situation unchangeable? And what about hybrid services that can be both utilitarian and hedonic? Might differences in consumers’ consumption goals explain customers’ flat-rate bias for the same service, such that it can inform segmentation efforts? Ultimately, service managers need to know whether they can actively influence consumption goals. That is, can “hedonizing” a service through marketing communications and service designs increase customers’ propensity to choose a flat rate?
Our study indicates that they can. Our empirical analyses show that consuming services to attain hedonic gratification leads to a significantly higher flat-rate bias than using services to fulfill utilitarian needs. The three well-known flat-rate bias effects (taximeter, insurance, and overestimation) fully mediate this relationship. In three studies, we show that these findings apply across different services (Study 1), for a service that relies on natural variance in customers’ consumption goals (Study 2), and for the same service framed as hedonic, utilitarian, or a hybrid (Study 3).
Research Background
Flat-Rate Bias
When choosing a service provider, customers often must select among several price plans, such as pay-per-use or flat-rate options (Schlereth, Skiera, and Wolk 2011). Pay-per-use rates use variable pricing schemes with a predefined price per consumption unit (e.g., time, volume). A flat-rate pricing structure instead charges a single fixed fee for the service, regardless of actual usage. A flat-rate bias emerges when consumers “value flat-rate service over measured service even when the bill that the consumer would receive under the two services . . . would be the same” (Train 1991, p. 211). Many studies confirm its existence in various contexts (see Appendix A). Lambrecht and Skiera (2006) cluster the causes of flat-rate bias into four effects: taximeter, insurance, convenience, and overestimation effects. A taximeter effect arises when consumers do not want to “hear” the price ticking upward as they use the service, because it reminds them of the pain of paying and lowers their consumption enjoyment. The insurance effect means customers attempt to anticipate the risk of exceeding the planned usage or demand variability, which could cause financial losses. Therefore, they give up the opportunity to pay less and instead set a ceiling level to avoid paying more. A convenience effect occurs when the consumer chooses a flat rate simply to avoid the need for pay-per-use calculations. Especially when many alternatives are available, customers likely make the “easiest” choice, whether that means the most common price plan, a promoted plan, or the one with the easiest structure. Finally, overestimation occurs when customers overestimate their expected usage. Despite its theoretical foundation, Lambrecht and Skiera (2006) find no significant influence of the convenience effect on flat-rate bias. Therefore, we focus only on the taximeter, insurance, and overestimation effects herein.
Consumption Goals
Such “biases” in consumers’ economic decision making are common topics in behavioral decision research (Loewenstein 2001), which uses consumption goals to understand customer behavior (Simonson et al. 2001). Consumers use services for two basic reasons: hedonic gratification or utilitarian achievement (Batra and Ahtola 1991). Hedonic consumption aims at pleasure, fun, and enjoyment. At the extreme, it may be even frivolous or decadent (O’Curry and Strahilevitz 2001). Typical examples include listening to music, going to the movies, or riding a roller coaster. Utilitarian consumption instead reflects functional needs and requirements. Pure utilitarian services are practical, instrumental, necessary, or functional (O’Curry and Strahilevitz 2001), such as going to the dentist, visiting a take-out lunch counter, or using tax advisors. These two consumption goals are not necessarily two ends of a continuum though (Voss, Spangenberg, and Grohmann 2003); services can score high on both dimensions simultaneously (Okada 2005), such as museum visits. Moreover, the evaluation of these dimensions is highly subjective and case dependent. For example, using the telephone to call for help makes it utilitarian; using the service to chat with friends makes it hedonic (Khan, Dhar, and Wertenbroch 2004).
Many research studies show that consumption goals influence consumer behavior in various decision contexts (e.g., Maslow 1968; Okada 2005). Although the impact of consumption goals on price plan choices for services has not been analyzed, it seems likely that they would influence such decisions. Therefore, we analyze the impact of the consumption goals (hedonic vs. utilitarian) on the three relevant flat-rate bias effects and, indirectly, on flat-rate choice (see Figure 1).

Research model.
Hypotheses Development
Impact of Consumption Goals on the Taximeter Effect
The theory underlying the taximeter effect is mental accounting (Heath and Soll 1996; Kivetz 1999; Shefrin and Thaler 1992; Thaler 1985), which assumes an implicit accounting system, with virtual budgets and accounts for consumption (Thaler 1985). A purchase decision causes the consumer to open a mental account that contains all related benefits and costs. Users enjoy the benefits from consumption, but the costs constitute pain that lowers their pleasure (Prelec and Loewenstein 1998). If a payment occurs in advance (or can be mentally depreciated by assigning it to a flat rate), users can forget the pain of payment while they consume and enjoy the service (Lambrecht and Skiera 2006; Nunes 2000). In contrast, a pay-per-use rate forces consumers to think about the costs constantly, which lowers their perceived benefits (Kivetz 1999).
Three differences mark hedonic versus utilitarian consumption in relation to the taximeter effect. First, in addition to the financial pain of paying, hedonic services evoke a feeling of guilt and a need to justify spending money on fun and enjoyment (Okada 2005), for reasons such as anticipated regret, cognitive dissonance, or rational self-perception. Hedonic services seem like luxuries, and consuming them often is associated with guilt and negative self-attribution (e.g., I indulge). It is harder to justify spending money on hedonic than on utilitarian services, which are necessities and usually have a clear purpose (Khan, Dhar, and Wertenbroch 2004). These negative feelings lower the enjoyment from consumption to some degree, though the overall benefit still remains hedonic in nature. However, if the payment is decoupled from consumption through a flat rate, enjoyment should be higher. Second, services are distinguished by their process orientation (Sampson and Froehle 2006), and the sensory gratification of hedonic consumption occurs during a process of consumption. All the pleasure, fun, and enjoyment take place as customers consume the service (Batra and Ahtola 1991). Such services could also be called experience centric, characterized by intense emotional customer participation (Zomerdijk and Voss 2009). The instrumental value of utilitarian consumption instead occurs only once, after consumption (Khan, Dhar, and Wertenbroch 2004). Therefore, the need to decouple the payment from the benefit should be higher in a hedonic context. Third, the pain of paying lowers enjoyment—the main benefit sought from hedonic consumption (O’Curry and Strahilevitz 2001). In a utilitarian context, the main benefit is independent of hedonic enjoyment (Prelec and Loewenstein 1998), so the pain of paying should be lower in a utilitarian versus hedonic context. We predict:
Hypothesis 1. The taximeter effect (i.e., when the ticking of the meter lowers consumption enjoyment) is stronger in a hedonic than in a utilitarian setting.
Impact of Consumption Goals on the Insurance Effect
Three theories explain the insurance effect: loss aversion, risk aversion, and option value. Loss aversion, as part of prospect theory, notes that a loss evokes stronger negative feelings than the same amount of gain evokes positive feelings (Kahneman and Tversky 1979; Tversky and Kahneman 1991). With pay-per-use pricing, the bill amount disperses around an expected value, such that interim losses and gains find a balance over the long term. For loss-averse customers, the negative feelings of losses outweigh the positive feelings of gains, so they prefer a constant bill to varying interim losses and gains (Lambrecht and Skiera 2006).
Risk-averse behavior emerges when people prefer a flat rate because they fear the uncertainty associated with the possibility of paying more (Miravete 2000; Nunes 2000; Train 1991). With loss aversion, paying more evokes worse perceptions than paying less can mitigate in other situations. For hedonic goods, the risk of losses should be perceived as greater than that for utilitarian goods, because feelings of guilt and justification extend beyond a financial perspective (Okada 2005).
Finally, the option value of a flat rate describes the possibility that the customer will consume more than originally planned, at the same price (Kridel, Lehman, and Weisman 1993). If the desired level of consumption is met or exceeded, consumers value hedonic attributes more than utilitarian attributes (Chitturi, Raghunathan, and Mahajan 2007), because excess consumption (i.e., option value) then seems like a prize won. O’Curry and Strahilevitz (2001) show that hedonic options are more popular prizes than utilitarian ones. We thus expect the option value of hedonic consumption to be higher as well. We propose:
Hypothesis 2. The insurance effect (i.e., insurance against unexpectedly high bills due to higher demand) is stronger in a hedonic than in a utilitarian setting.
Impact of Consumption Goals on the Overestimation Effect
The overestimation effect is a result of an inaccurate demand forecast. Parducci’s range-frequency model explains the general existence of overestimation bias (Nunes 2000). Any usage has a natural minimum of zero. The amount of possible outcomes below an expected value is both limited and lower than the amount of possible outcomes that rise above an expected value. Therefore, people perceive a higher likelihood of consuming more than of consuming less.
Affect-rich, hedonic services create stronger associative imagery than affect-poor, utilitarian services (Khan, Dhar, and Wertenbroch 2004). This strong associative imagery induces an emotional decision mode, but the lack of imagery fosters a rational evaluation (Kahneman and Frederick 2002). The more rational the evaluation, the more people calculate their usage; the more emotional the evaluation, the higher the likelihood that they use Parducci’s range-frequency model.
If they have used the service before, consumers can predict the frequency of future usage from their prior behavior. An easy retrieval of historic usage information implies higher usage frequency (Tversky and Kahneman 1973). Because hedonic consumption is more emotionally laden than utilitarian consumption, it leaves more detailed and vivid memory traces and is easier to retrieve (Carroll 1978). Therefore:
Hypothesis 3. The overestimation effect (i.e., overestimation of demand for the service) is stronger in a hedonic than in a utilitarian setting.
Impact of Consumption Goals on Flat-Rate Bias
In line with our hypotheses, flat-rate bias effects seemingly should be stronger in a hedonic than in a utilitarian consumption situation. We anticipate that feelings of guilt (Okada 2005) and the pain of paying (Prelec and Loewenstein 1998) are higher in hedonic contexts and strengthen the taximeter effect (Hypothesis 1). A higher option value linked to hedonic goods and services should enhance the insurance effect (Chitturi, Raghunathan, and Mahajan 2007, Hypothesis 2), and overestimation is more likely in the affect-rich context of hedonic consumption (Khan, Dhar, and Wertenbroch 2004, Hypothesis 3).
Lambrecht and Skiera (2006) show that flat-rate bias effects significantly explain the existence and degree of flat-rate bias. Higher levels of one or more of these effects lead to higher levels of flat-rate bias (Lambrecht and Skiera 2006). If consumption goals increase flat-rate bias effects, they also ultimately should increase the flat-rate bias. In this relationship, flat-rate bias effects mediate the impact of consumption goals on flat-rate bias. Therefore,
Hypothesis 4. (a) Flat-rate bias is stronger in a hedonic than in a utilitarian setting, and (b) the impact of consumption goals on flat-rate bias is fully mediated by flat-rate bias effects.
Empirical Study
Research Approach
To determine the impact of hedonic and utilitarian consumption goals, we compare flat-rate bias effects and flat-rate choices across various conditions (Carson et al. 1994): pure hedonic, hybrid hedonic and utilitarian, and pure utilitarian consumption. To generate these conditions in experimental surveys, we apply three approaches and thereby combine their strengths while mitigating their weaknesses. Furthermore, using three approaches with three independent samples, we improve the external validity of our findings and strengthen the implications.
Study 1
We start by comparing services that inherently fulfill differentiated consumption goals, without any experimental manipulation. This investigation reveals realistic decision behavior by respondents across a vast spread of consumption goals. Service managers of such differentiated services can derive direct implications from these findings. However, this approach suffers a potential bias due to other service criteria, which may influence the decision, such as price levels or usage frequency.
Study 2
To address this potential problem, we analyze natural variance in consumption goals expressed by different respondents toward the same service. This approach ensures the comparability of service characteristics and still offers high external validity. Although the spectrum of hedonic-utilitarian ratings is limited compared with Study 1 (Carson et al. 1994), the results are relevant for pricing managers who must determine the potential uses of consumption goals for customer segmentation.
Study 3
Finally, we create artificial variance using hypothetical scenarios about the same service and ask respondents to make a decision for another person. In so doing, we achieve a wide hedonic-utilitarian spread, because we define the consumption goals of the other person and ensure that all other elements are equal. Because the respondents are acting for another person, their decision behavior is not quite as realistic (Epley, Savitsky, and Gilovich 2002); therefore, the results must align with the results of the prior studies to exclude this realism bias as a potential explanation. This study also tests whether practitioners can influence flat-rate choices by manipulating the consumption goals associated with their services.
Research Design
In all experiments, respondents first read a description of the choice situation to make the task more realistic (Carson et al. 1994), such as, “suppose you are about to enter an amusement park and have the choice of two price rates.” We then asked them to decide between flat-rate and pay-per-use pricing. We used a 4-point scale (1 = definitely pay-per-use, 2 = probably pay-per-use, 3 = probably flat-rate, and 4 = definitely flat-rate) instead of a binary decision to measure weaker signals of preference. The payment modalities were the same for both rates, to eliminate any impact of personal preferences for payment methods. As a decision support and guidance, we told the respondents to presume a given usage pattern, described by a range from minimum to maximum expected usage (e.g., minimum three rides, maximum nine rides). We also provided expected usage as an arithmetic mean (e.g., on average, six rides). The flat-rate price always equaled the average usage multiplied by the pay-per-use price, following the definition of flat-rate bias by Train (1991). If there were no flat-rate bias, half the respondents should choose pay-per-use pricing and the other half the flat rate. This procedure mirrors other flat-rate bias research (e.g., Lambrecht and Skiera 2006). The prices and usage patterns came from pretests that we used to determine typical values in order to make the decisions as realistic as possible.
After revealing the price plan choice, we measured the flat-rate bias effects on a 5-point scale (1 = fully disagree, 5 = fully agree). For the taximeter and insurance effects, we relied on reflective measurement scales from Lambrecht and Skiera (2006), adjusted to the specifics of each service for every experiment and translated into German. For the overestimation effect, we developed a new 4-item scale that appears, together with the other scales, in Appendix B.
As a manipulation check for Studies 1 and 3, and to analyze the natural variance of consumption goals in Study 2, we measured every respondent’s consumption goals at the end of the survey (Perdue and Summer 1986). For this purpose, we used the well-established Hedonic/Utilitarian (HED/UT) scale by Voss, Spangenberg, and Grohmann (2003) translated into German. Both hedonic and utilitarian consumption goals for the service were measured on a 5-point scale (1 = fully disagree and 5 = fully agree; Khan, Dhar, and Wertenbroch 2004). All scales were tested using exploratory (SPSS version 18) and confirmatory (AMOS version 18 with maximum likelihood algorithm 1 ) factor analyses (see Appendix B).
Pretest: Services for the Price Plan Choice Experiments
Before conducting the experiments, we needed to find suitable services. We used the official German services catalogue as a starting point and extracted a long list of 40 consumer services. Through brainstorming with service experts of an international consulting firm, we limited this list to 13 services (see Figure 2), using as criteria their pervasiveness and familiarity as well as their potential for flat-rate pricing.
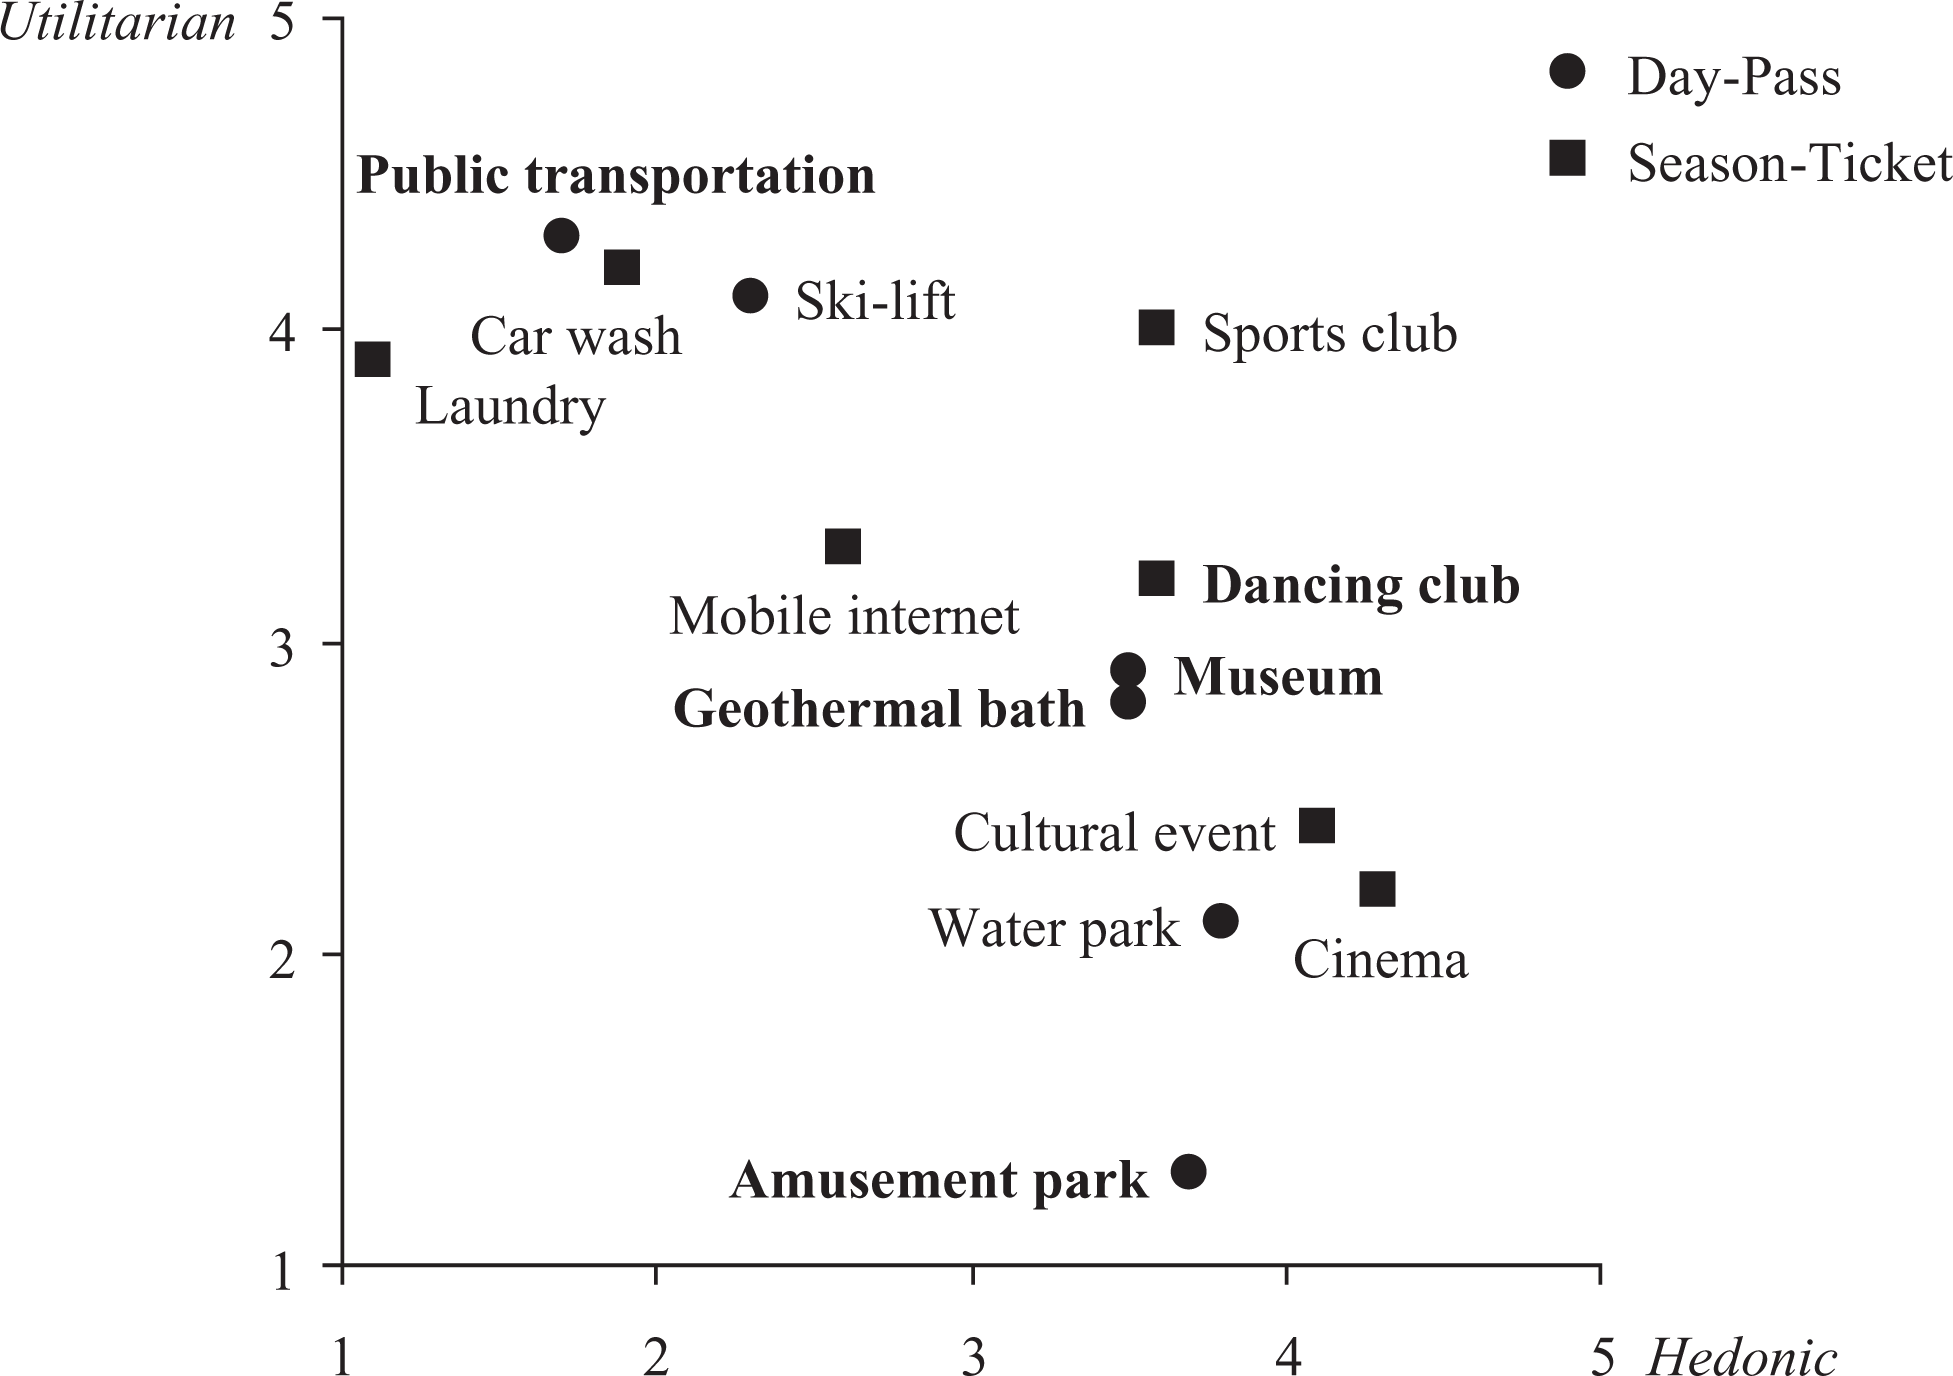
Average hedonic and utilitarian rating for short-listed services.
To select services for direct comparison (Study 1), we needed to find pairs of services that differ in their consumption goals but are equal in all other regards. Otherwise, ulterior, dominant alternatives might distort the price plan choice (Carson et al. 1994; Krieger and Green 1991). Therefore, we developed six criteria: (1) identical contractual setting (e.g., subscription model versus day pass); (2) equal level of service participation (e.g., direct customer participation with his or her body vs. indirect participation with an item owned by the customer); (3) similar price level (e.g., €500 vs. €20); (4) comparable variability (e.g., car repairs with more or less binary occurrence probability vs. annual drinking water demand with 20% variability); (5) comparable time frame (e.g., monthly flat vs. 1-year contract); and (6) comparable frequency/usage cycle (e.g., season ticket for soccer with one match every week vs. season ticket for opera with one play every night).
We classified the short-listed services according to these six criteria and ran a short pretest. In an online survey, 62 respondents rated the hedonic and utilitarian consumption goals of the 13 services (see Figure 2) and identified museum visits and geothermal baths as the most balanced services regarding hedonic and utilitarian consumption goals; we therefore used them in Studies 2 and 3, respectively. Furthermore, we found two services with strongly oppositional consumption goals: Amusement parks are purely hedonic, and public transportation is solely utilitarian. In most other regards, both services are quite similar. For example, their time frames involve 1 day, and their contractual settings exclude any actual contracts. Both services require the consumer to engage personally and physically during consumption by sitting in the train or roller coaster coach. The typical usage patterns and price levels, obtained from the pretest survey, also are of a similar order of magnitude.
Study 1: Public Transportation Versus Amusement Parks
Description
We distributed paper questionnaires to all students of an undergraduate marketing course at a large university in south Germany. In return for their participation, students received candy. We obtained 268 completed questionnaires.
The two experiments (buying a ticket for an amusement park vs. running some errands throughout the city using public transportation) appeared in random order in a within-subject setup. In both experiments, students rated their preference for a day pass versus paying per ride. We provided past usage patterns that indicated minimum, average, and maximum rides per day (public transportation 2–4–6; amusement park 4–8–12). The price for the day pass reflected the average usage, yielding realistic prices for this university town (e.g., public transportation €2 per ride × 4 rides = €8 per day; amusement park €3 per ride × 8 rides = €24 per day). In addition, the students completed flat-rate bias effect and HED/UT scales.
Manipulation check
The manipulation check, using dependent sample t-tests, confirms the pretested classification of both services: The amusement park is perceived as significantly more hedonic (M = 3.8, SE = .06) than public transportation, M = 1.8, SE = .04, t(243) = −30.0, p < .001, whereas public transportation appears significantly more utilitarian (M = 4.0, SE = .05) than amusement parks, M = 1.8, SE = .05, t(243) = 29.1, p < .001. With two linear regression models 2 (see Table 1), we find that the flat-rate bias effects explain a substantial portion of price plan choice (amusement park R 2 = .27; public transportation R 2 = .28). In the amusement park scenario, all three effects are significant, whereas for public transportation, overestimation has no significant impact on flat-rate choice. Perhaps these respondents were sufficiently familiar with public transportation to be better able to recall their own past usage information.
Regression Model for Public Transportation and Amusement Park.

Note. Dependent variable = price plan choice.
*p < .05. **p < .01. ***p < .001.
Hypotheses tests
Using dependent samples t-tests, 3 we compare flat-rate bias effects and flat-rate choice in both scenarios. The taximeter effect is higher in the hedonic amusement park than in the utilitarian public transportation setting, M hed = 3.6, SE hed = .05; M ut = 3.2, SE ut = .04, t(243) = −7.6, p < .001. People seem to fear the loss of enjoyment much more in a hedonic than in a utilitarian context, in support of Hypothesis 1. The insurance effect, M hed = 2.8, SE hed = .06; M ut = 2.5, SE ut = .06, t(243) = −4.9, p < .001, and the overestimation effect, M hed = 3.6, SE hed = .06; M ut = 3.2, SE ut = .06, t(243) = −5.3, p < .001, are also higher in the hedonic than in the utilitarian situation in support of Hypotheses 2 and 3. Regarding flat-rate choice, the students exhibit significantly higher flat-rate biases in the hedonic amusement park than in the utilitarian public transportation scenario, M hed = 2.9, SE hed = .06; M ut = 2.6, SE ut = .05, t(243) = −3.7, p < .001. This finding confirms Hypothesis 4a.
We test the suggested mediating effects of the flat-rate bias effects with the procedure promoted by Judd, Kenny, and McClelland (2001). All three relevant conditions are met: (1) the flat-rate bias effects predict flat-rate choice in both scenarios as shown before in the manipulation checks with two linear regression models; (2) flat-rate bias effects are significantly higher in the amusement park scenario with the respective higher flat-rate preference as shown with the dependent samples t-tests in the manipulation checks; and (3), the flat-rate bias effect differences—but not the sums—predict the price plan choice difference between the two scenarios (see Table 2). This finding provides evidence for the mediation function of the flat-rate bias effect, and thus we can also confirm Hypothesis 4b.
Regression Model for Mediation Test.
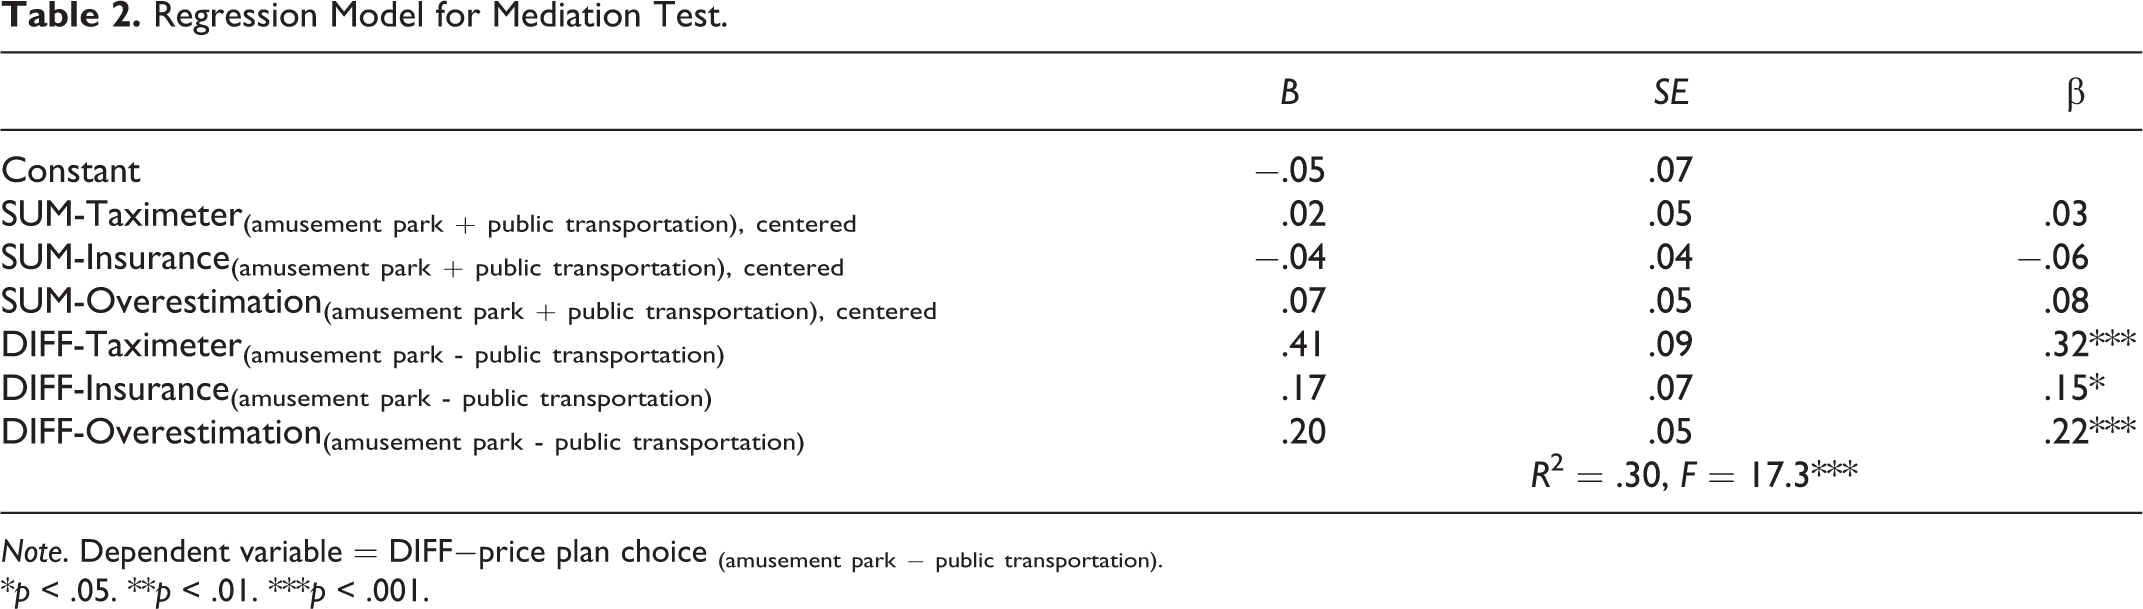
Note. Dependent variable = DIFF−price plan choice (amusement park − public transportation).
*p < .05. **p < .01. ***p < .001.
Summary
Study 1 reveals that a flat-rate bias is stronger in a pure hedonic decision context than in a pure utilitarian decision context, and the flat-rate bias effects mediate this impact. To test whether this outcome is due to a change in the utilitarian or hedonic dimension, we next analyze natural variance in respondents’ consumption goals toward the same service, such that we can assess the impacts of the two dimensions separately. In Study 1, we compared two different services; to eliminate this potential bias our next experiments should feature only one service each.
Study 2: Varying Consumption Goals for Museum Visits
Description
In this second experiment, we analyze the natural variance of consumption goals across respondents but for the same service. As the pretest shows, visiting a museum fulfills both hedonic and utilitarian consumption goals; standard deviations of .88 for the hedonic and 1.2 for the utilitarian dimension also indicate sufficient natural variance.
We contracted with a marketing research agency to conduct Study 2 online with a sample that is representative of the German population. The 376 respondents imagined that they were going on a weekend trip to a new city, whose main attraction was an energy museum. A guidebook suggested that to visit the museum, people would need a minimum of 1 hour, an average of 3 hours, and a maximum of 5 hours. The available rates were either €4 per hour or a day pass for €12 (i.e., 3 hours × €4). Again, respondents chose their preferred price plan on our 4-point scale and explained their decision across the three flat-rate bias effect and HED/UT scales. Because we analyze natural variance in customers’ consumption goals, there is no need for a manipulation check. The average hedonic and utilitarian ratings are balanced (M hed = 3.46, M ut = 3.19), with standard deviations of 1.01 (hedonic) and 0.99 (utilitarian).
Hypotheses tests
To test all hypotheses, we use multicategorical mediation analysis, as promoted by Hayes and Preacher (2011). Compared with a classical causal steps approach, it makes less strict assumptions, due to its use of bootstrapping, and it allows for several mediators (i.e., flat-rate bias effects) and independent variables (Preacher and Hayes 2008; Zhao, Lynch, and Chen 2010). In this study, hedonic and utilitarian ratings act as independent variables using the whole range of the scale. The three flat-rate bias effects are mediators, and flat-rate choice is the dependent variable. Table 3 includes all relevant information.
Mediation Analysis for Energy Museum Visits.
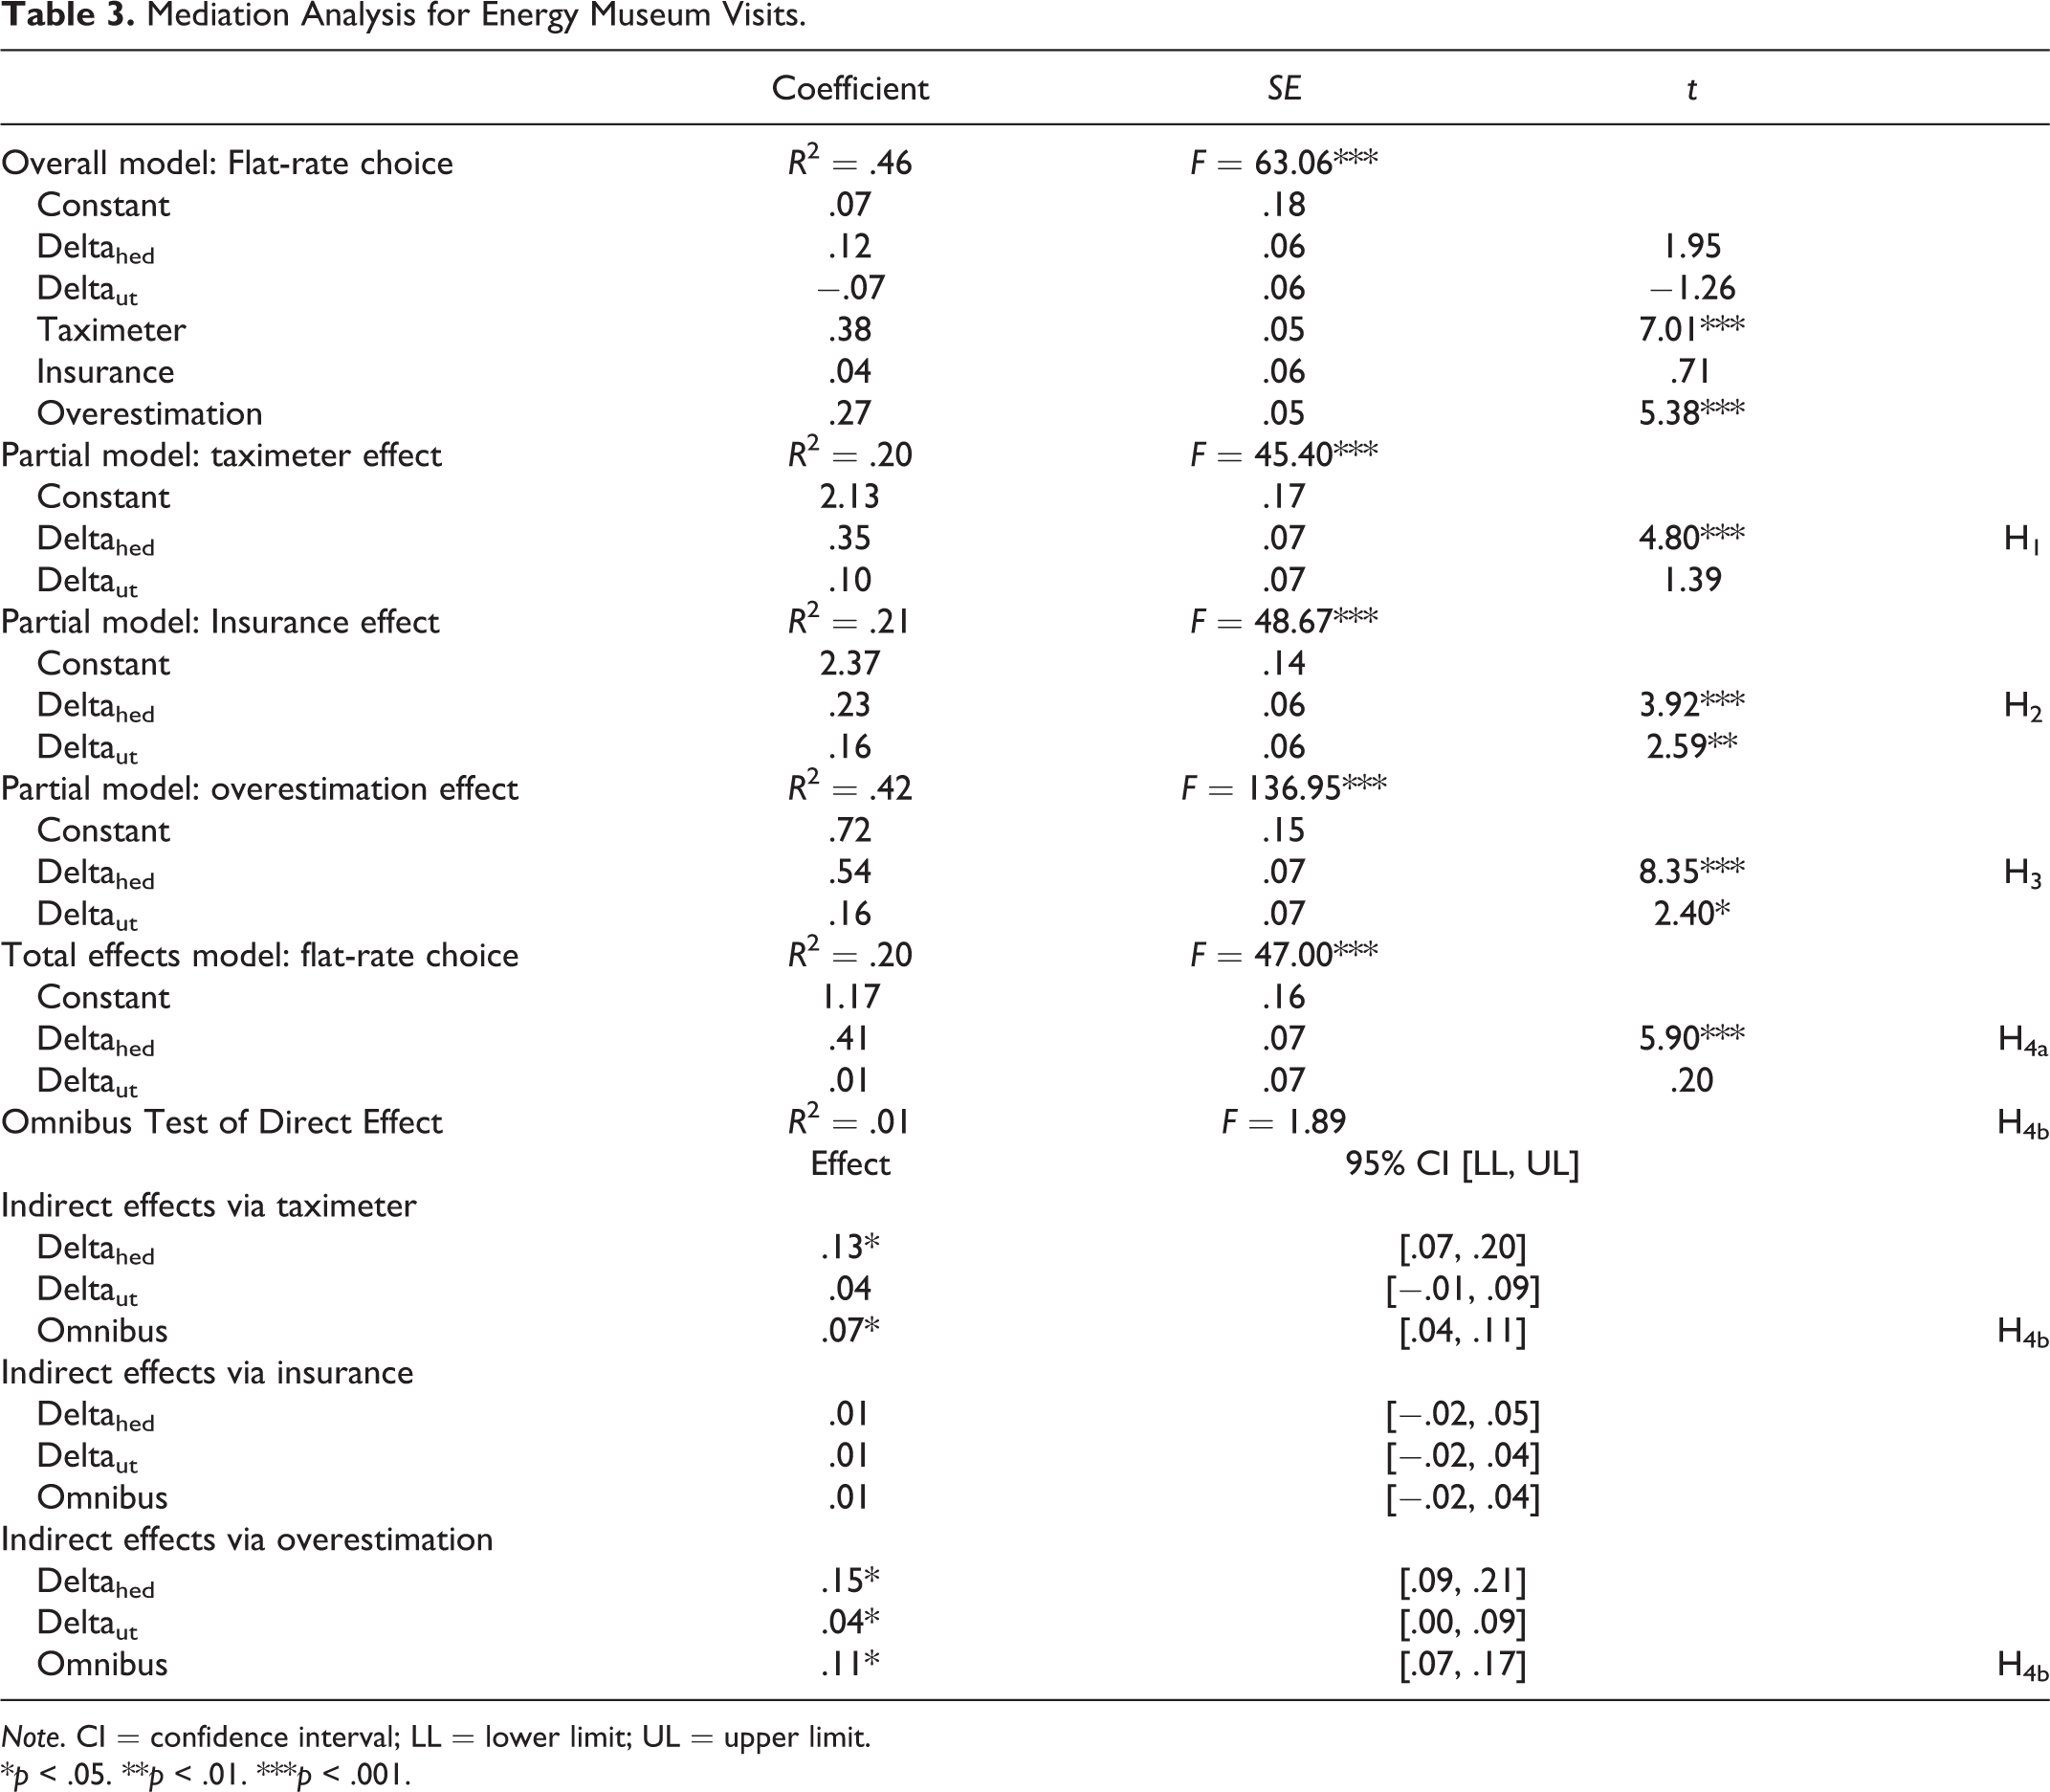
Note. CI = confidence interval; LL = lower limit; UL = upper limit.
*p < .05. **p < .01. ***p < .001.
The overall model indicates that flat-rate choice is driven by the taximeter and overestimation effects. There is no significant impact of the insurance effect in this context (coeff. = .04, SE = .06, n.s.). The lack of influence from the insurance effect might reflect the nature of a museum visit: Staying 6 hours or longer might seem unlikely. The risk of exceeding the planned or purchased usage also is limited by the opening hours per day, such that the need to insure against it may be lower than it would be for services without such a natural limit (e.g., telecommunications). Hedonic and utilitarian consumption goals reveal no significant impact on flat-rate choice in the overall model that controls for the three flat-rate bias effects. This finding excludes the direct effect of consumption goals on flat-rate bias but leaves the possibility of an indirect effect.
In the partial models, we find significant effects of the hedonic dimension on the taximeter (coeff. = .35, SE = .07, t = 4.8, p < .001), insurance (coeff. = .23, SE = .06, t = 3.9, p < .001), and overestimation (coeff. = .54, SE = .07, t = 8.4, p < .001) effects, in support of Hypotheses 1, 2, and 3. The total effects model proves that in total—and not controlling for the three flat-rate bias effects—the flat-rate bias increases due to hedonic consumption goals (coeff. = .41, SE = .07, t = 5.9, p < .001), which confirms Hypothesis 4a; it is not affected by utilitarian consumption goals. The omnibus test of direct effects proves that this increase is not due to a direct impact of hedonic consumption goals on flat-rate choice (R 2 = .01, F = 1.9, n.s.). Instead, the hedonic impact on flat-rate bias is fully mediated by the flat-rate bias effects. Thus, we find support for Hypothesis 4b. Using a bootstrap confidence interval of 95%, together with the omnibus tests, we find indirect effects of the hedonic dimension on flat-rate choice through the taximeter (.07, p < .05) and overestimation (.11, p < .05) effects. 4 However, there is no indirect effect of the insurance effect on flat-rate choice, as we expected, considering that the insurance effect in this context generally is not a significant driver of flat-rate bias.
Summary
Customers with more hedonic consumption goals for a specific service have a stronger preference for the flat rate. More utilitarian consumption goals did not lead to an increase in the flat-rate bias. For service providers, this finding implies that they can increase their share of flat-rate customers by increasing perceptions of hedonic consumption goals associated with the service. To simulate the potential impact service providers could have by manipulating customers’ consumption goals, we use three primes in Study 3: a pure hedonic consumption situation that describes a service provider that focuses exclusively on hedonic aspects in communications and service design; a pure utilitarian situation in which service providers emphasize only utilitarian concepts in their designs and communication; and a hybrid consumption situation, such that service providers foster both types of consumption goals. We avoid a consumption situation that is neither utilitarian nor hedonic, because it is implausible and would not be treated seriously by respondents (Carson et al. 1994).
Study 3: Hypothetical Scenarios in Thermal Bath Visits
Description
We told three hypothetical stories of a visit to a thermal bath by a person named Andrea (Bargh and Chartrand 2000). In the hedonic story, Andrea visits the baths just for fun and to have a good time. In the utilitarian story, she needs the mineral water to relieve the pain of her rheumatism. Finally, in the hybrid version, Andrea enjoys the leisure time she spends at the baths but also believes the mineral water is good for her skin. In each case, a short descriptive text explained Andrea’s consumption goals for her next thermal bath visit. The goal of this priming tactic was to cause respondents to put themselves in Andrea's shoes and subconsciously adopt her consumption goals (Kolb and Whishaw 2003). In all scenarios, Andrea’s past visits had ranged from a minimum of 2 hours to an average of 4 hours to a maximum of 6 hours. The rates were €4 per hour or €16 for a day pass, in line with typical German thermal baths. The survey was conducted online by a professional marketing research agency using a between-subject design. The sample of 298 respondents represented the German population in terms of gender, age, income, and education.
Manipulation check
For the manipulation checks in Study 3, we use an analysis of variance (ANOVA). The three scenarios differ significantly in terms of priming hedonic, F(2, 295) = 91, p < .001, and utilitarian, F(2, 295) = 46, p < .001, consumption goals. The Tukey’s honestly significant difference HSD post hoc tests show that the hedonic scenario is significantly less utilitarian than the hybrid (M hed,hyb = −1.0, SE hed,hyb = .12, p < .001) and utilitarian (M hed,ut = −1.0, SE hed,ut = .12, p < .001) scenarios. There is no significant difference in hedonic consumption goals for the hybrid scenario, (M hed,hyb = −.05, SE hed,hyb = .14, n.s.) but the difference is notable with the utilitarian scenario (M hed,ut = 1.6, SE hed,ut = .14, p < .001). The utilitarian scenario also is significantly less hedonic than the hybrid (M ut,hyb = −1.6, SE ut,hyb = .14, p < .001) and hedonic (M ut,hed = −1.6, SE ut,hed = .14, p < .001) scenarios. Although there is no significant difference in utilitarian consumption goals with the hybrid scenario (M ut,hyb = −.02, SE ut,hyb = .12, n.s.), as anticipated by the priming, the difference arises with the hedonic scenario (M ut,hed = 1.0, SE ut,hed = .12, p < .001). Thus, the priming was successful.
Hypotheses tests
To test our hypotheses, we apply the same SPSS macro we used in Study 2 (Hayes and Preacher 2011). We use a categorical scenario type variable (hedonic, utilitarian, or hybrid, with hybrid as the base case) as the independent variable; the three flat-rate bias effects are the mediators; and flat-rate choice is the dependent variable. The SPSS mediate macro (Hayes and Preacher 2011) generates two dummy variables to represent the delta between hybrid and utilitarian scenarios, reflecting the change in hedonic consumption goals (Deltahed), and the delta between the hybrid and hedonic scenarios, reflecting the change in utilitarian consumption goals (Deltaut).
The overall model in Table 4 shows that the taximeter and overestimation effects lead to flat-rate choice, but the insurance effect does not (coeff. = .02, SE = .06, n.s.). Similar to Study 2, the lack of impact of the insurance effect could indicate a natural limitation of risk by the opening hours. Another context-specific cause could relate to the hypothetical scenario, in which respondents made a decision for someone else (Johansson-Stenman, Carlsson, and Daruvala 2002).
Mediation Analysis for Thermal Bath Visits.

Note. CI = confidence interval; LL = lower limit; UL = upper limit. The coefficient signs of the hedonic and utilitarian deltas (representing change from hybrid scenario) are reversed to facilitate comprehension.
*p < .05. **p < .01. ***p < .001.
The three partial models reveal significant effects of the hedonic dimension (Deltahed) on all three flat-rate bias effects. Significant increases of the taximeter (coeff. = .63, SE = .13, p < .001), insurance (coeff. = .58, SE = .13, p < .001), and overestimation (coeff. = 1.1, SE = .15, p < .001) effects support Hypotheses 1, 2, and 3. The total effects model reveals that hedonic consumption goals significantly increase flat-rate bias (coeff. = .67, SE = .13, p < .001), in support of Hypothesis 4a. Because there is no direct impact of hedonic consumption goals on flat-rate choice following the omnibus test of direct effects (R 2 = .01, n.s.), the hedonic impact is fully mediated by the flat-rate bias effects, as we predicted in Hypothesis 4b.
Using a bootstrap confidence interval of 95%, we recognize that the omnibus tests for the taximeter effect (.03, p < .05) and overestimation effect (.05, p < .05) fully mediate the hedonic impact. 5 There is no indirect effect of the insurance effect on flat-rate choice. This finding is plausible because the insurance effect in this context generally is not a significant driver of flat-rate bias. The utilitarian dimension (Deltaut) has neither a significant effect on flat-rate bias effects nor a significant direct or indirect effect on flat-rate choice.
Summary
With Study 3, we adopt a third approach, but again confirm all of our hypotheses. This confirmation across three different approaches emphasizes the validity and reproducibility of our findings. Stronger hedonic consumption goals increase flat-rate bias effects, which fully mediate the impact of consumption goals on flat-rate choice and ultimately lead to a higher flat-rate bias. Stronger utilitarian consumption goals instead exert no significant impact on flat-rate bias effects or flat-rate choice. Because we also used priming as our study methodology, we can draw conclusions about the practical applicability of our findings for service providers. Customers’ preferences for the flat rate depend on their consumption goals—hedonic versus utilitarian—even when the underlying service remains the same and the expected cost, as given in the scenario description, is equal in all cases.
Discussion
Theoretical Implications
Our investigation contributes to flat-rate bias research in at least three ways. First, our study is the first to compare flat-rate biases systematically across services. After the discovery of the phenomenon by Train, McFadden, and Ben-Akiva (1987), subsequent researchers have identified and clustered its causes and studied its consequences (e.g., Lambrecht and Skiera 2006). These studies report very different levels of flat-rate bias, yet so far, it has remained unclear whether these differences simply resulted from applying different methodologies to assess the bias. By using consistent measures of flat-rate bias across services, we show that the causes of flat-rate bias, as well as flat-rate bias itself, depend on the service type. Consumers exhibit different degrees of flat-rate bias for different types of services, such as public transportation versus amusement parks.
Second, we show that consumption goals can explain substantial variance across services. Flat-rate bias is substantially stronger when consumers have hedonic, rather than utilitarian, consumption goals. In a series of experiments, we show that these differences in consumption goals have not only natural variance but also can be actively influenced by service providers. Study 1 shows that services that are considered more utilitarian, such as public transportation, have significantly lower levels of flat-rate bias than services that are more hedonic, such as amusement parks. In Study 2, we also find that natural variance across consumers within the same service setting can explain differences in their flat-rate bias. Depending on consumption goals for a museum visit, consumers differ significantly in their flat-rate bias. Those with hedonic consumption goals reveal a significantly higher flat-rate bias than their counterparts with utilitarian consumption goals. In Study 3, we demonstrate that the service provider can influence consumers’ consumption goals toward one and the same service and thus also influence their susceptibility to flat-rate bias. Consumers in a utilitarian priming condition showed significantly lower levels of flat-rate bias compared with those in a hedonic priming condition. These findings are highly relevant for research on flat-rate bias and for understanding its differences, both between and within service settings.
Third, we disentangle the cognitive processes that mediate the effect of consumption goals on flat-rate biases. In all three studies, we find that the three flat-rate bias effects identified by Lambrecht and Skiera (2006)—taximeter, insurance, and overestimation—are higher when consumers pursue hedonic rather than utilitarian consumption goals. Yet these three flat-rate bias effects do not influence the flat-rate bias to the same extent in various conditions. The taximeter effect consistently contributes to flat-rate choice in all choice situations; it is a very robust driver of flat-rate bias. Overestimation leads to flat-rate choice in all services but public transportation, perhaps because the respondents were so familiar with public transportation that they easily recalled their past usage information. The insurance effect contributes to flat-rate choice only for public transportation and amusement parks. For the thermal bath and energy museum visits, the lack of significant contribution might result because in these cases, service usage is measured by time and therefore naturally limited by the opening hours of the provider. This limit reduces the risk of unexpectedly high costs, whereas for public transportation or amusement parks, the maximum amplitudes based on the amount of rides can be much higher—even a double-digit multiple of expected usage. In telecommunications, where most flat-rate bias research has focused, the variability of usage also is higher and might foster consumers’ need for insurance.
We also tested the indirect effects of consumption goals on flat-rate bias through flat-rate bias effects. The individual flat-rate bias effects mediate the influence of consumers’ consumption goals on flat-rate bias. In Zhao, Lynch, and Chen’s (2010) terminology, it is an indirect-only mediation. In all studies, the taximeter and overestimation effects fully mediate the influence of consumption goals on flat-rate bias, whereas the insurance effect only has a significant mediation effect in Study 1. In Studies 2 and 3, insurance is not a significant driver of flat-rate bias and hence also does not function as a mediator.
We also contribute to behavioral decision research. Prior research has analyzed the impact of consumption goals in various contexts, such as product design (Gill 2008), product evaluations (Okada 2005), or product choice (Maslow 1968) as well as in various conditions, such as winning prizes versus earning rewards for hard work (O’Curry and Strahilevitz 2001). We show for the first time that consumption goals also affect price plan choices for services. The more hedonic the consumption goals of customers, the less standard economic theory can explain their behavior with regard to price plan choices for services.
Our findings are not limited to price plan choices though; they can contribute to general pricing research. Wakefield and Inman (2003) suggest that consumers are more willing to pay for hedonic than for utilitarian products and services, which is consistent with our results that indicate a stronger flat-rate bias for hedonic services. Because the flat-rate bias implies a relative preference for fixed versus variable costs, our findings also might apply to decisions between purchasing and leasing or renting. For example, we expect a stronger preference for purchase if a consumer considers a hedonic sports cars rather than a utilitarian minivan. Buying the car minimizes constant reminders of spending on hedonism (i.e., guilt and justification theory, part of the taximeter effect). Customers even might prefer buying hedonic cars for a higher price than they would pay if they were to rent or lease them. In contrast, for utilitarian cars such as minivans, consumers likely prefer to calculate the expected overall cost and choose the more economical option. Further research is needed to test these assumptions.
Managerial Implications
Companies benefit from constant and predictable revenues of flat rates. With a flat-rate bias, those revenues are higher and more profitable than the respective pay-per-use revenues would be. At the same time, customers enjoy consumption with no thought for the pain of paying and protection from bill shocks. Lambrecht and Skiera (2006) even show that a flat-rate bias has no negative impact on customer churn, so flat rates offer a universally beneficial rate. Service providers should make use of the positive effect of hedonic consumption goals on flat-rate biases when attempting to increase their profits by raising the share of customers using flat rates.
Our findings show that managers need to be aware of major industry differences though. Managers of hedonic services, such as amusement parks or spas, enjoy a much higher “natural” level of flat-rate bias than do managers of more utilitarian services, such as public transport or laundry services. Yet despite these general differences, managers in all fields still have opportunities to influence the share of flat-rate customers in their customer base. One such opportunity is to use the self-selection effects among customers and target customers who have hedonic consumption goals with flat rates.
Furthermore, service managers can influence customers’ service consumption goals. By advertising the hedonic experience and thereby evoking the respective expectations (Deliza and MacFie 1996), “hedonizing” their service (i.e., stressing the hedonic component), managers can increase consumers’ likelihood of opting for a flat rate, even if pay-per-use would have been the cheaper option. Describing their offer, service managers could use the vocabulary in the HED/UT scale (Voss, Spangenberg, and Grohmann 2003) to trigger hedonic consumption goals. For example, they might highlight the fun of using their service, then describe the service experience as exciting and thrilling, or delightful and enjoyable—depending on the nature of the service.
When service managers thus hedonize their service in marketing communications, they also must ensure that the service consumption is a hedonic experience, because not delivering as promised can lead to customer dissatisfaction and defection. To hedonize their services, service managers should concentrate on three relevant aspects: people, processes, and physical evidence (Bitner 1993). Selecting the right employees who enjoy their jobs is fundamental for a transfer of enjoyment to customers. Then training these staff to deliver “service with a smile” can enhance customer moods and also make them perceive the service process as more hedonic (Pugh 2001). Finally, the design of the physical environment should enhance and foster hedonic experiences (Hightower, Brady, and Baker 2002). For example, museums or zoos should not only focus on education, but should also offer hedonic services, such as movie theaters with exiting and funny movies, nice coffee shops, and themed playgrounds. Similarly, education service providers, such as language schools, might hedonize their services by offering entertaining, diversified teaching materials that include enjoyable events, such as cooking country-specific food. Leveraging such means to design hedonic customer journeys, achieve sensory designs, and implement dramatic service delivery process structures should allow consumers to achieve hedonic experiences (Zomerdijk and Voss 2009).
In making this recommendation, we also considered whether hedonizing might have negative side effects on perceptions of the service price (Shiv, Carmon, and Ariely 2005). Therefore, we ran a short online survey with convenience sampling, using invitation e-mails sent to colleagues and friends. This sampling strategy allowed us to acquire a sample of highly educated consumers in well-paid positions, which represent an attractive target group for service providers offering hedonic services. We obtained a usable sample of 136 respondents, with an average age of 30 years, 70% of whom were men, and 50% of whom have a job with an average monthly net income of more than €3,000. We showed them three types of advertisements for a geothermal bath (hedonic, utilitarian, and hybrid) in a between-subject design. 6 Their scores of the HED/UT scales confirm the manipulation, and a confound check of attitudes toward the ads across conditions indicates no significant effects (Biehal, Stephens, and Curlo 1992). In turn, we measured perceptions of price in terms of intended WTP with an open-ended question (Miller et al. 2011). An ANOVA reveals no differences in the WTP across the three scenarios, n hed = 39, M hed = €11.8, SE hed = .64; n hyb = 54, M hyb = €12.7, SE hyb = .75; n ut = 43, M ut = €11.9; SE ut = .91, F(2,133) = .46, n.s. Thus, the hedonization tactic had no negative side effects on consumers’ price perceptions in terms of willingness to pay. Service providers can benefit from hedonizing their services as long as it is compatible with their value proposition.
Limitations and Further Research
Our study has several limitations that suggest topics for further research. First, our findings are based on stated preferences in experimental settings. Real-life behavior sometimes differs from stated preferences. We tried to make the choice tasks as realistic as possible (e.g., matching real prices, including historic usage information, providing detailed scenario descriptions), but data on actual behavior would provide better external validity. Especially for the overestimation effect, an analysis of transactional data is essential, because our scale can only approximate this influence. A necessary next step would be to validate our findings with transactional data about actual price plan choices.
Second, we recommend that managers increase consumers’ hedonic consumption goals to foster flat-rate choice. Additional research should investigate in more detail how service managers can do so, such as by changing perceptions of the service. We describe a hedonization effect for one particular service (thermal bath), but we need a much better understanding of hedonization and how it works for different kinds of services. Although our convenience sample revealed no negative willingness to pay effect, other influences, such as on the perceived value proposition or changes in the attracted target group, should be investigated. Especially for a pure utilitarian service, adding hedonic consumption goals might change the value proposition and thus the service itself.
Third, we adopted Lambrecht and Skiera’s (2006) framework, with the taximeter, insurance, and overestimation effects as causes of flat-rate bias. Other causes also might exert an influence, such as a flexibility effect that favors a pay-per-use bias (Krämer and Wiewiorra 2012; Schulze and Gedenk 2005). Further research should consider these additional effects and evaluate the relative importance of them among all underlying processes.
Fourth, researchers should look for moderators that allow practitioners to further increase flat-rate choice. Such moderators could be found among the six criteria we used in our pretest to ensure ceteris paribus conditions. Researchers should also investigate potential boundary conditions of the impact of consumption goals on flat-rate bias to understand under which conditions the effects that we find might disappear.
Conclusion
Our research reveals that flat-rate bias differs depending on the underlying consumption goals of consumers: Consuming services to attain hedonic gratification leads to a significantly higher flat-rate bias than using services to fulfill utilitarian needs. The more hedonic a service is, the higher the taximeter, insurance, and overestimation effects and the stronger the flat-rate bias. Thus, consumption goals have a significant influence on the service price plan choices made by customers. Service providers can predict, using the nature of their service offerings, whether the introduction of a flat-rate price is likely to result in a high share of flat-rate biased customers who contribute to a higher profitability. Our findings also indicate that service providers can influence the consumption goals of their customers and benefit from greater flat-rate biases by promoting and designing a more hedonic consumption experience.
Footnotes
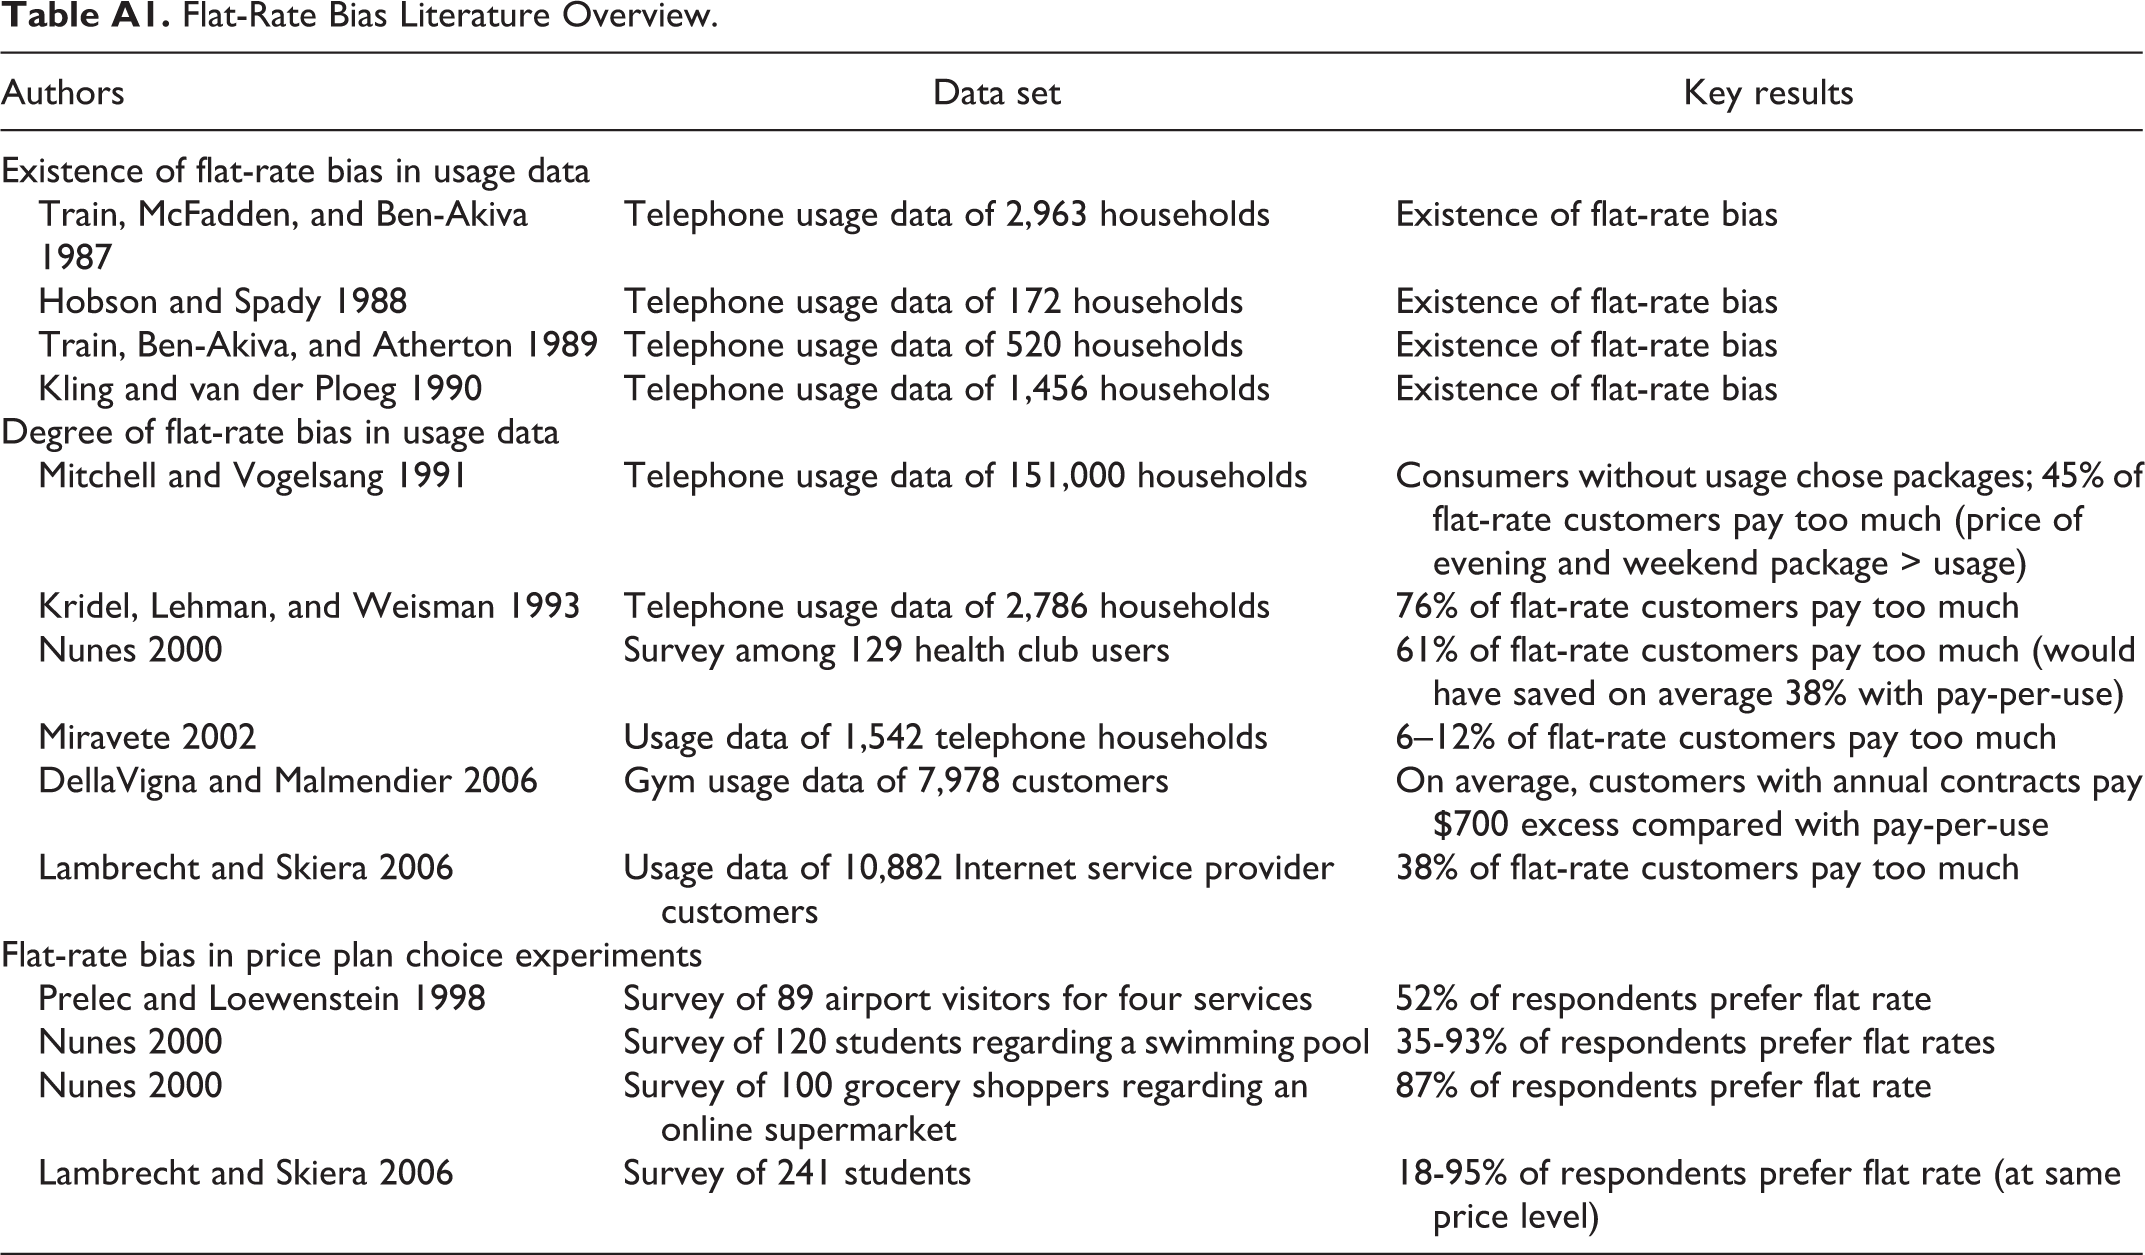
Appendix A
Flat-Rate Bias Literature Overview.
| Authors | Data set | Key results |
|---|---|---|
| Existence of flat-rate bias in usage data | ||
| Train, McFadden, and Ben-Akiva 1987 | Telephone usage data of 2,963 households | Existence of flat-rate bias |
| Hobson and Spady 1988 | Telephone usage data of 172 households | Existence of flat-rate bias |
| Train, Ben-Akiva, and Atherton 1989 | Telephone usage data of 520 households | Existence of flat-rate bias |
| Kling and van der Ploeg 1990 | Telephone usage data of 1,456 households | Existence of flat-rate bias |
| Degree of flat-rate bias in usage data | ||
| Mitchell and Vogelsang 1991 | Telephone usage data of 151,000 households | Consumers without usage chose packages; 45% of flat-rate customers pay too much (price of evening and weekend package > usage) |
| Kridel, Lehman, and Weisman 1993 | Telephone usage data of 2,786 households | 76% of flat-rate customers pay too much |
| Nunes 2000 | Survey among 129 health club users | 61% of flat-rate customers pay too much (would have saved on average 38% with pay-per-use) |
| Miravete 2002 | Usage data of 1,542 telephone households | 6–12% of flat-rate customers pay too much |
| DellaVigna and Malmendier 2006 | Gym usage data of 7,978 customers | On average, customers with annual contracts pay $700 excess compared with pay-per-use |
| Lambrecht and Skiera 2006 | Usage data of 10,882 Internet service provider customers | 38% of flat-rate customers pay too much |
| Flat-rate bias in price plan choice experiments | ||
| Prelec and Loewenstein 1998 | Survey of 89 airport visitors for four services | 52% of respondents prefer flat rate |
| Nunes 2000 | Survey of 120 students regarding a swimming pool | 35-93% of respondents prefer flat rates |
| Nunes 2000 | Survey of 100 grocery shoppers regarding an online supermarket | 87% of respondents prefer flat rate |
| Lambrecht and Skiera 2006 | Survey of 241 students | 18-95% of respondents prefer flat rate (at same price level) |
Appendix B
Measurement Scales for the Energy Museum.
| Effect/scale item | α CITC | EV FL | FR SRW | AVE IR |
|---|---|---|---|---|
| Taximeter | .87 | .66 | .87 | .58 |
| The day pass for the energy museum is great because I don’t need to think about the cost every hour | .67 | .79 | .74 | .55 |
| I enjoy visiting the energy museum less if cost rises every houra | .68 | .80 | .71 | .50 |
| Only with a day pass do I have real fun in the energy museuma | .72 | .83 | .80 | .64 |
| If I have a day pass I feel much more free and unstressed visiting the energy museum than having a variable rate | .70 | .82 | .78 | .61 |
| I don’t like it if costs increase every houra | .74 | .84 | .78 | .61 |
| Insurance | .82 | .60 | .84 | .52 |
| For the security that the museum visit never exceeds a preset price, I’d even pay a bit more | .44 | .58 | .44 | .19 |
| Even if the day pass would be a bit more expensive for me I’d be happy because my total cost will never exceed a fixed amount | .60 | .73 | .60 | .36 |
| The transparency of knowing in advance how much the museum visit will cost me is important to mea | .69 | .84 | .81 | .66 |
| It is important to me that the museum visit never costs more than a fixed amounta | .75 | .88 | .88 | .77 |
| I don’t like it if costs are higher than originally planneda | .63 | .80 | .78 | .61 |
| Overestimation | .92 | .81 | .92 | .74 |
| I can well imagine spending more time in the museum than on average | .83 | .91 | .89 | .79 |
| The probability to spend more time in the museum is higher than the probability to spend less time in the museum | .82 | .90 | .87 | .76 |
| The case that I stay longer in the museum happens more than the case that I stay shortera | .82 | .90 | .86 | .74 |
| The risk of visiting the museum for longer than average is higher than the risk of visiting the museum for shorter than averagea | .80 | .89 | .83 | .69 |
| Hedonic | .94 | .80 | .94 | .75 |
| Visiting the energy museum is fun | .85 | .91 | .88 | .77 |
| Visiting the energy museum is exciting | .80 | .87 | .83 | .69 |
| Visiting the energy museum is delightful | .81 | .88 | .85 | .72 |
| Visiting the energy museum is thrilling | .87 | .92 | .90 | .81 |
| Visiting the energy museum is delightful | .84 | .90 | .87 | .76 |
| Utilitarian | .92 | .81 | .94 | .75 |
| Visiting the energy museum is effective | .85 | .91 | .90 | .81 |
| Visiting the energy museum is helpful | .85 | .91 | .91 | .83 |
| Visiting the energy museum is functional | .85 | .91 | .87 | .76 |
| Visiting the energy museum is necessary | .79 | .86 | .80 | .64 |
| Visiting the energy museum is practical | .84 | .90 | .86 | .74 |
| Model fit indices | RMSEA | χ2/df | TLI | CFI |
| .07 | 2.97 | .93 | .93 |
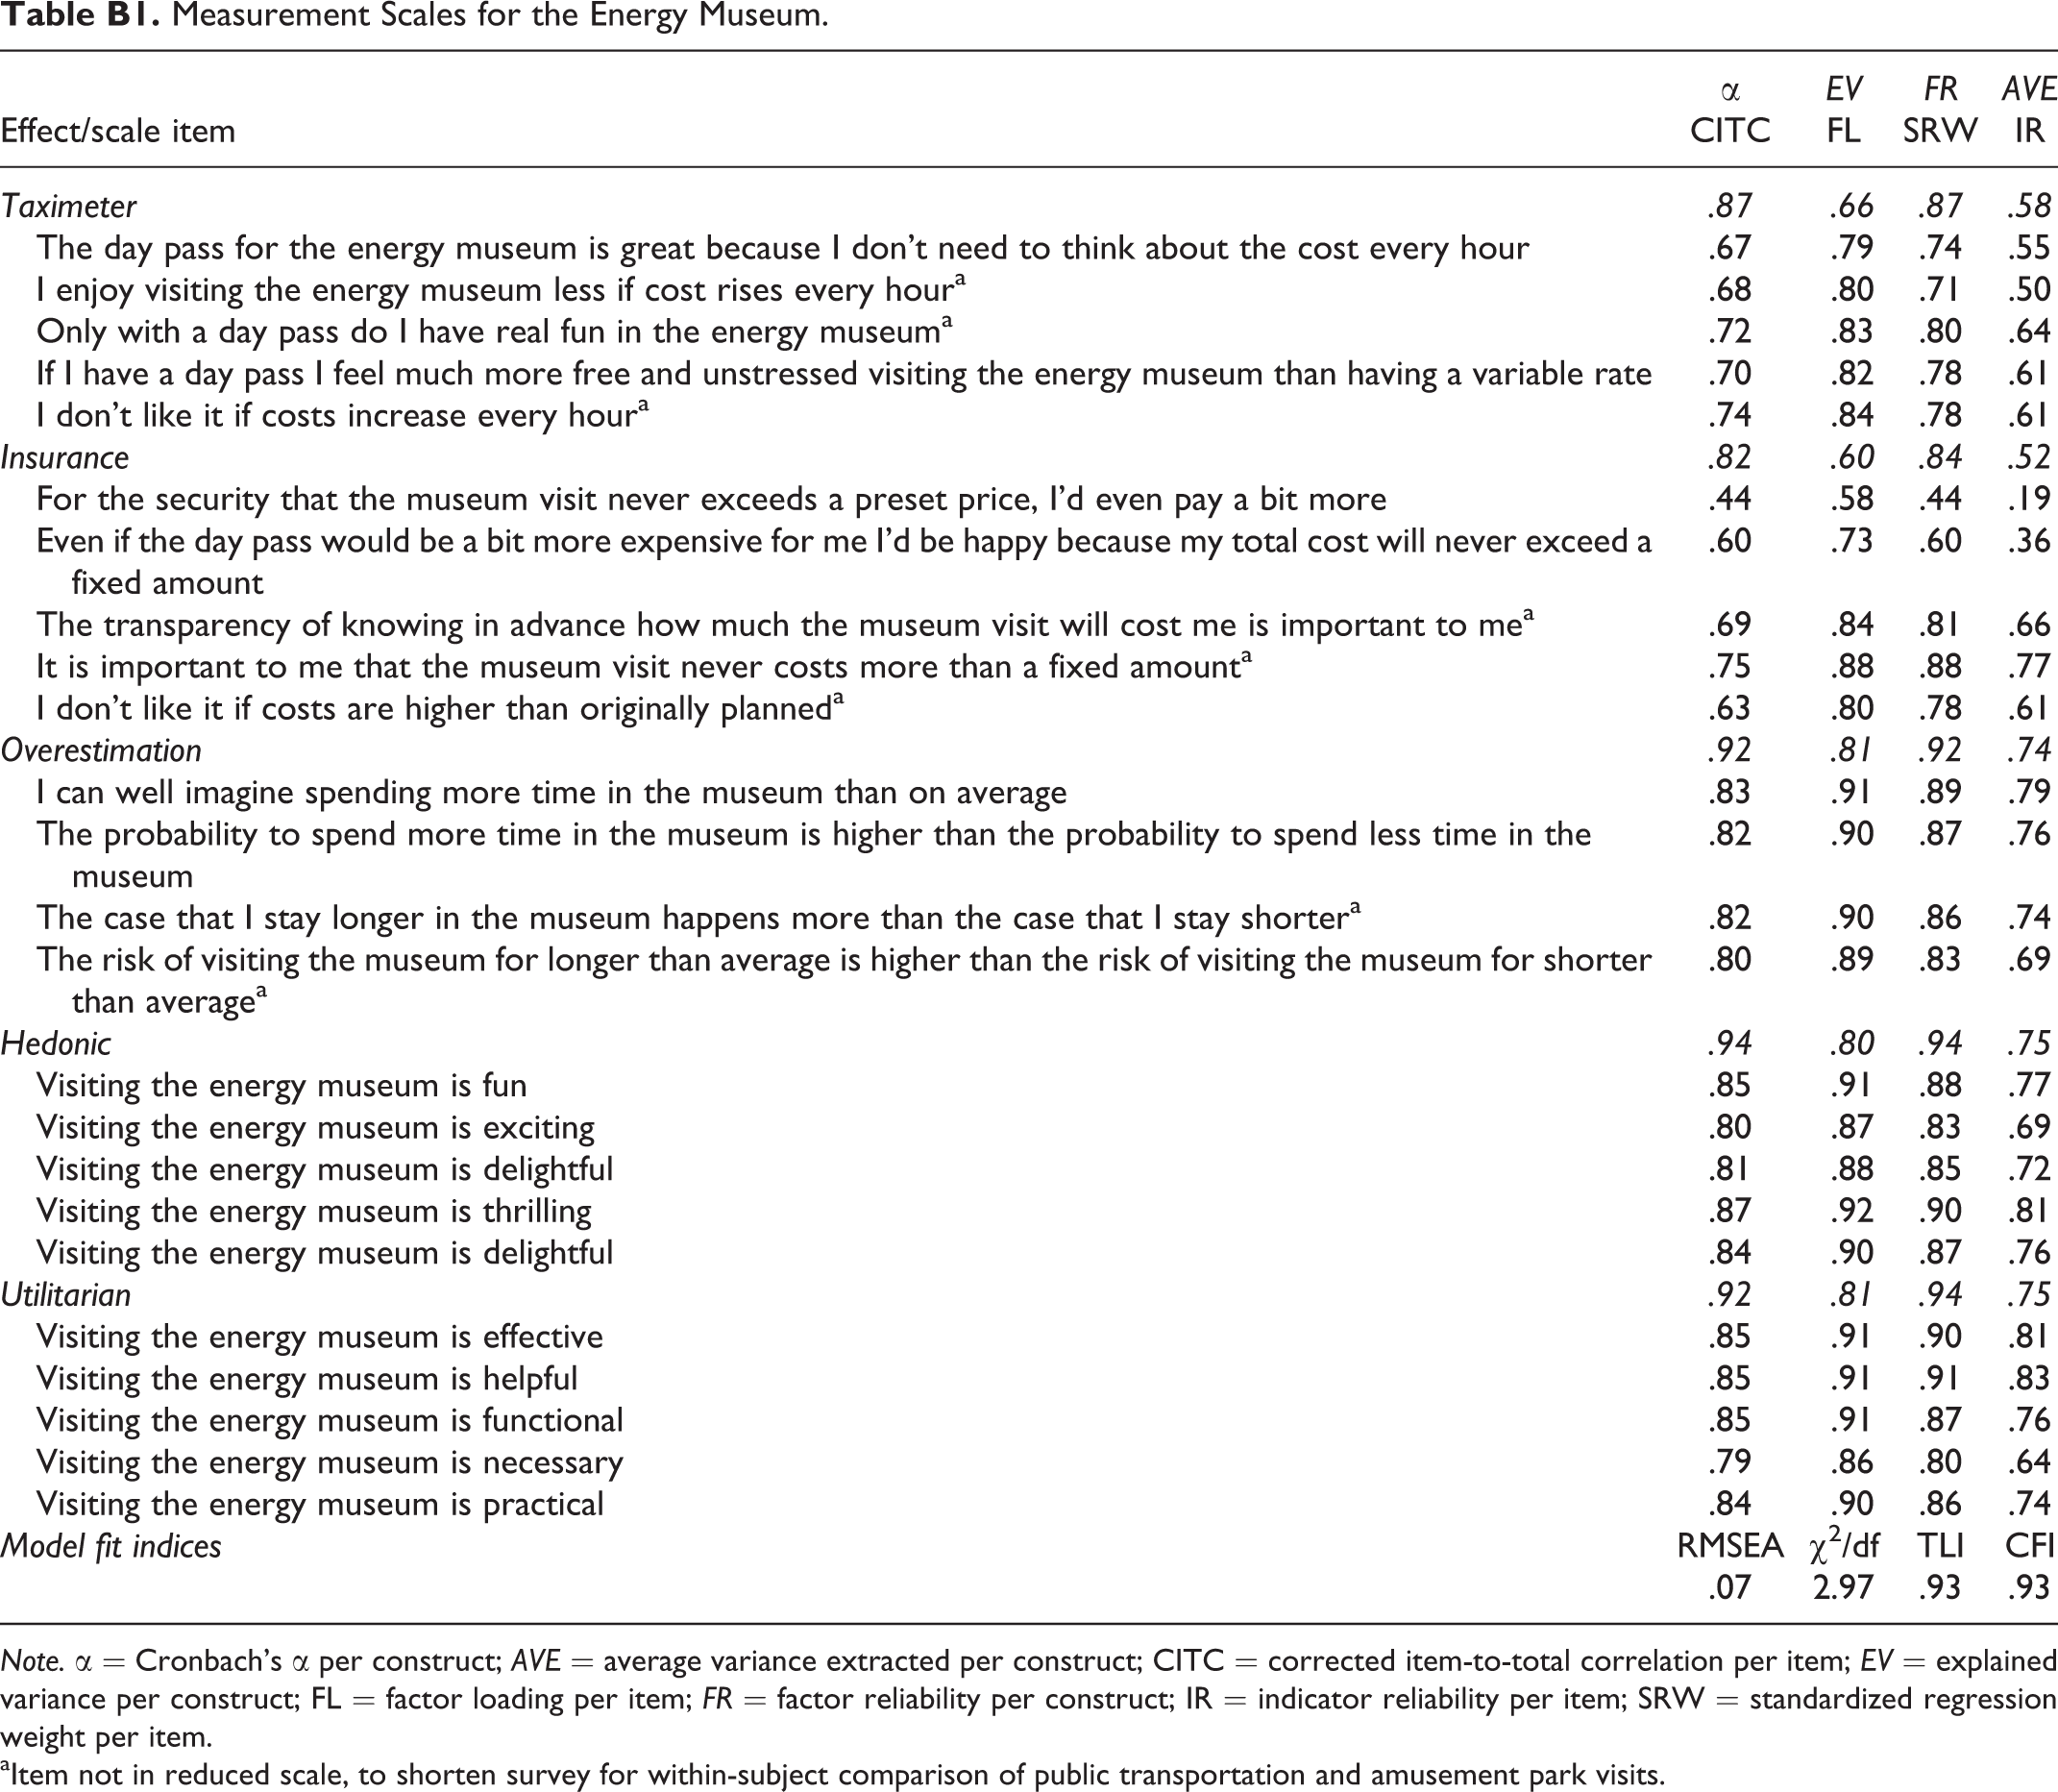
Note. α = Cronbach's α per construct; AVE = average variance extracted per construct; CITC = corrected item-to-total correlation per item; EV = explained variance per construct; FL = factor loading per item; FR = factor reliability per construct; IR = indicator reliability per item; SRW = standardized regression weight per item.
aItem not in reduced scale, to shorten survey for within-subject comparison of public transportation and amusement park visits.
Declaration of Conflicting Interests
The author(s) declared no potential conflicts of interest with respect to the research, authorship, and/or publication of this article.
Funding
For their research, the author(s) received financial support from the Foerderverein Kurt Fordan for herausragende Begabungen e.V., the Dr.-Ing. Leonhard-Lorenz-Stiftung, and The Boston Consulting Group GmbH.
Notes
References
Supplementary Material
Please find the following supplemental material available below.
For Open Access articles published under a Creative Commons License, all supplemental material carries the same license as the article it is associated with.
For non-Open Access articles published, all supplemental material carries a non-exclusive license, and permission requests for re-use of supplemental material or any part of supplemental material shall be sent directly to the copyright owner as specified in the copyright notice associated with the article.