
Abstract
One of an Internet retailer’s managerial goals is to create positive perceptions of retail prices among online customers. This study examines the relationship between customer perception of Internet retailers’ service quality and customer price perception. Unlike previous studies, this study extends the scope of service quality to three stages of service interaction: first, a retailer’s home page presentation; second, the overall retail website, which we call a retailer’s order-procurement quality; and third, the retailer’s order-fulfillment quality. To that end, this study samples 516 Internet retailers whose service quality information in their separate service interaction stages is available on their home pages and on a well-known rating site, Bizrate.com. The results verify a clear connection between service quality perception and price perception along the chronological flow of service interaction. In particular, both the presentation of an effective home page web format and the customer perception of a retailer’s order-procurement quality are significantly associated with customer price perception. The price perception is also significantly associated with order-fulfillment quality perception. These findings suggest that the configuration of customer perceptions of both service quality and price stands out as an important subject for managerial attention.
Keywords
Introduction
Since amazon.com launched their online business solution in 1995, the Internet retail sector has become a significant part of the global economy. Recent market research shows that sales in this sector in the United States have already surpassed US$230 billion in 2012; the sales growth rate in that year was 14%, which is more than three times the average growth rate of the entire retail sector (4.2%) in the same year (Indvik 2013; Solsman 2013). In the case of China, as a new and now the second largest online retail market, Internet retail sales have increased remarkably since 2003, with a compound annual growth rate of 120% (Dobbs et al. 2013). Currently, Internet shopping is rapidly moving to Internet-enabled mobile devices such as smartphones and tablets (eMarketer 2013). This fast-growing online economy has left many research areas unexplored.
One of the pending research topics is customer perceptions of Internet retailers’ service quality and their retail prices. For an Internet retailer hoping for profitability, creating positive perceptions of retail prices and service quality among online customers is critical. The immediate benefits of doing so are apparent, from making the price and the online store attractive to customers, to increasing the perceived value of using the online store, all of which trigger the customer’s purchase intention and purchase behavior (Chang and Wildt 1994; Nejad, Evans, and Babakus 2009; Varki and Colgate 2001; Zeithaml 1988). This impact will eventually deliver positive financial results to the Internet retailer (Reichheld and Schefter 2000).
Past research has provided contextual evidence of a close relationship between service quality perception and price perception. Cao, Gruca, and Klems (2003–2004) find that an Internet retailer who presents sufficient service quality attributes on the company website gives a more favorable impression of retail prices to online customers, compared to other retailers who do not present these attributes. Collier and Bienstock (2006) also validate that college students’ positive perceptions of prices and web services from a given retailer influence their perceptions of the retailer’s delivery services. Other relevant studies confirm that customers are willing to pay a high premium for quality services (Anderson 1996; Homburg, Koschate, and Hoyer 2005), which suggests that customer experience with high-quality services creates a positive price perception. This relationship has managerial implications because it allows Internet retailers to make competitive pricing decisions based on their service quality performance (Pan, Ratchford, and Shanker 2002; Rabinovich 2007; Rabinovich, Maltz, and Sinha 2008a).
However, multiple stages of service interaction in the Internet retail process complicate the focal relationship. The earliest interaction typically occurs with a retailer’s home page, where customers obtain an initial impression about the online store. The second interaction occurs in the various webpages within the retailer’s website, as customers search for product and service information and pursue online transactions. The retailers’ delivery of customer orders constitutes the third and final stage of service interaction that creates customer involvement off-line, such as waiting for and receiving orders at home. Examining the three stages of interaction is necessary because the stages as a whole shape a customer’s shopping experience, which will influence their future behavior (Boyer, Hallowell, and Roth 2002; Rayport and Jaworski 2004). In this regard, Boyer, Hallowell, and Roth’s (2002) definition of an e-service encounter—that is, “the initial landing on the home page until the requested service has been completed or the final product has been delivered and is fit for use” (p. 178)—is entirely valid.
This empirical study examines interaction among customer perceptions of price and service quality in the multiple stages of Internet retail service interaction. In this study, price perception refers to the extent of customer satisfaction with the product price from an Internet retail store. High (low) price perception indicates positive (negative) price perception from satisfaction (dissatisfaction) with the price. Similarly, high quality perception indicates positive perception of or satisfaction with service quality from the Internet retailer and vice versa. The primary focus of this study is to find the linkage of those perceptions among the three different stages of service interaction. The focus area covers our research questions: how much do customer perceptions of service quality during the first or the second stage affect customer price perception in the second stage? How much does the price perception in the second stage affect customer perception of service quality in the later stage? Any significant linkage will verify that the shopping experience of online customers is the outcome of interactive effects from different service stages rather than the simple sum of those individual effects.
Compared to previous studies, this research makes many distinct contributions. First, literature shows that numerous existing studies have focused on the relationship between consumer price perception and the resulting product quality anticipation (Janiszewski and Lichtenstein 1999; Monroe 1973; Puccinellia et al. 2013). However, this study investigates price perception in relation to the actual service quality that customers perceive. An examination of service quality and price perception promises significant managerial implications because findings will point to specific service quality experiences that are associated with price perception. This unique approach covers both service operations and marketing by identifying the operational drivers of customer price perception (Heim and Field 2007). Second, considerable research highlights the relationship between service quality and customer satisfaction or loyalty, while research on service quality perception and price perception is relatively rare. This study uses empirical data from different stages of service interaction, which will provide a more complete picture of the relationship. Notably, no previous study has examined the service quality-price relationship within the extended scope of service interaction in Internet retailing. Finally, this study collects its data from real business contexts in the form of feedback from actual online customers and information pulled from Internet retailers’ websites. Hence, this work complements many previous studies on price perception that have been performed in a controlled laboratory environment.
This article is organized as follows. In the next section, we provide the theoretical background for our work, based on previous literature on related concepts and theories on price perception, and we then develop our hypotheses. Next, the Methodology section describes the details of our data collection and processing as well as the analytical procedures of hypothesis testing. We present our research results in the subsequent section, followed by the Discussion section, which provides insights derived from our research findings. The Managerial Implications section offers useful suggestions for managers. The final section discusses the limitations of our study and proposes areas for relevant future research.
Theoretical Development
Theoretical Background
Multiple theories and concepts related to price perception, including price fairness perception, indicate that customer price perception involves complex psychological processes. By applying adaptation-level theory, which links an organism’s adaptation tendency to recent external stimulations (Helson 1947), a sizable amount of previous research explains price perception with an internal reference price. The reference price indicates a current adaptation level. Related studies show that people compare an observed market price to an internal reference price that was shaped by previous experience and is influenced by the environment in which that price is displayed (Janiszewski and Lichtenstein 1999; Kalyanaram and Winer 1995; Monroe 1973). Eventually, the gap between an internal reference price and an observed price determines the magnitude of price perception.
Literature on price fairness perception adds complications. Using different theories and concepts such as equity theory, attribution theory, dual entitlement, and procedural justice, previous studies illuminate buyers’ psychological propensity for accepting a fair price (Bechwati, Sisodia, and Sheth 2009; Collie, Bradley, and Sparks 2002; Xia, Monroe, and Cox 2004). Equity theory states that people in a social exchange tend to compare the inputs and outcomes of that exchange to judge price fairness (Huppertz, Arenson, and Evans 1978). With some overlap to equity theory, attribution theory claims that people attempt to make causal inferences about not only the actual prices charged but also the reasons behind any differences in those prices (Folkes 1988; Vaidyanathan and Aggarwal 2003). A related concept is the dual entitlement principle, which suggests that a buyer feels that both a buyer and a seller are entitled to a normative price and profit. According to this concept, a price difference would be acceptable to buyers if it reflected a cost difference, but not if it came simply from a demand-supply shift (Kahneman, Knetsch, and Thaler 1986; Kalapurakal, Dickson, and Urbany 1991). In contrast, the concept of procedural justice claims that buyers watch and compare transaction procedures in order to judge price fairness, an approach that differs from those listed previously which focus on a transaction outcome or on transaction participants (Maxwell 2002). According to procedural justice, a buyer’s positive impression of a fair and transparent transaction process leads to a positive price perception.
Internet retailers’ service quality appears to play a critical factor in all the theories and concepts that explain customer price perception. As an advanced information system, the Internet enables customers to evaluate price and service quality among online stores. Consequently, customer knowledge of and experiences with different Internet retailers’ service quality certainly influence the development of an internal reference price within an online customer’s psychology (Janiszewski and Lichtenstein 1999; Monroe 1973). Likewise, as suggested by equity theory, online customers compare prices as a transaction input, anticipating service quality as one of the related outcomes (Bailey 2005; Lipsman 2007; Rabinovich 2007). Attribution theory and the dual entitlement concept are equally applicable to the retail context since customers are likely to view a high price as acceptable if it is accompanied by high service quality (Chen, Gupta, and Rom 1994; Li and Dinlersoz 2012; Rabinovich 2007). Similarly, procedural justice comes into play when people perceive retail prices in connection with the retailer’s web-service process and order-delivery process (Rabinovich, Maltz, and Sinha 2008a). Along the multiple stages of service interaction, an Internet retailer’s service quality reflects how much each stage remains fair and transparent.
In fact, most previous studies on price perception assume that price is the only information available to buyers. This specific situation lets buyers use price as a cue for assessing quality (Brown 1969; Janiszewski and Lichtenstein 1999; Monroe 1973). However, evidence also shows that if other cues, like store information or quality information, are available to buyers in addition to price, those cues now become related to price perception (Brown 1969; Kerin, Jain, and Howard 1992; Monroe 1973). In online shopping, customers pass through different stages, which suggests that they have a chance to experience some of an Internet retailer’s service quality (or lack thereof) prior to their observation of a retail price (Chen, Gupta, and Rom 1994). Therefore, customer experience with retailers’ service quality will influence price perception until they observe an actual price, at which point price perception will start influencing their perception of service quality. Essentially, the multiple stages of online service interaction, from the first contact with the home page through the completion of an order delivery, have different implications to customer price perception.
Previous literature shows that online customers maintain a keen sense of service quality throughout their shopping experience, from the point of accessing an Internet retailer’s home page through to receiving and using the ordered products (Boyer, Hallowell, and Roth 2002; Rayport and Jaworski 2004). This study references service quality cues in three different stages of the e-service encounter, from home page presentation to order-procurement quality perception, and through to order-fulfillment quality perception. The proposed relationships among these three service quality cues and customer price perception are summarized in the research model in Figure 1.
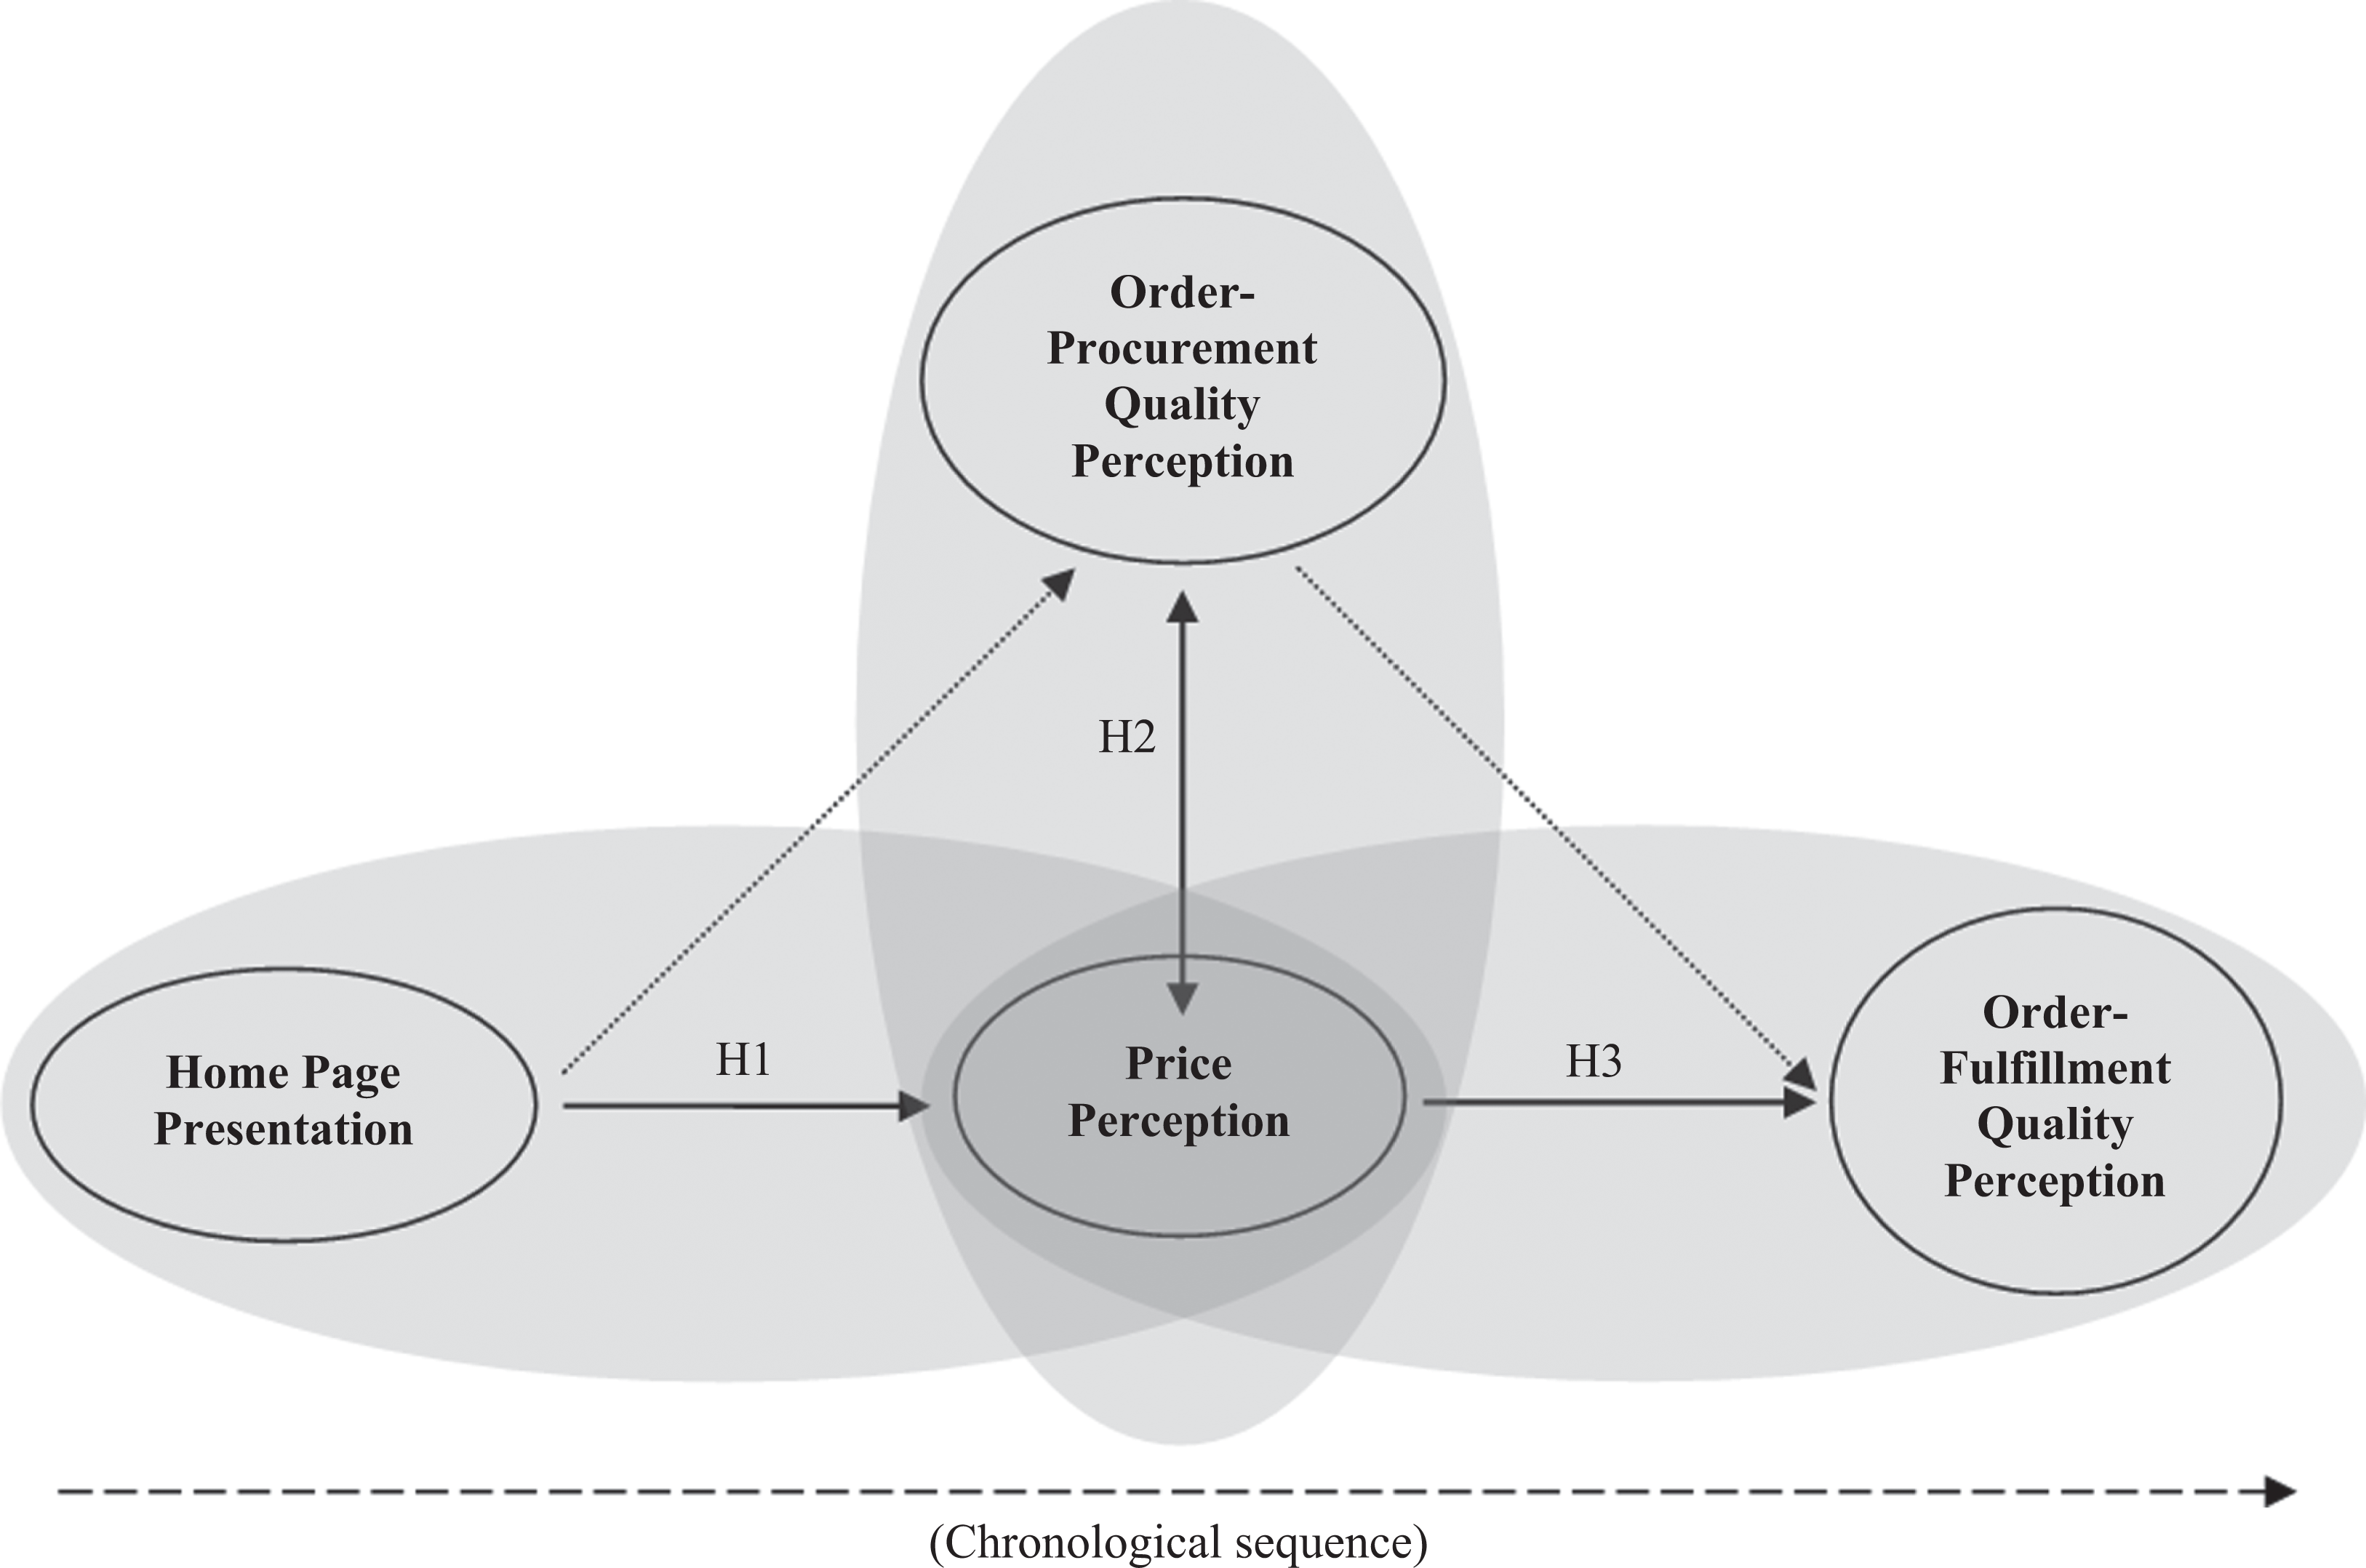
The proposed research model.
The Effects of Home Page Presentation
A retailer’s home page provides the earliest stage of interaction between online customers and an Internet retailer by displaying a portrait of the online store. The home page is supposed to present key information about the store, its merchandise, and its services, all in an organized manner. Therefore, home page presentation determines customer perception of service quality in the earliest stage of service interaction. In this study, home page presentation concerns the format of an Internet retailer’s home page organized by menu bars, and the information on it, which largely determine the look and utility of a retail home page. According to research by Collier and Bienstock (2006), the format of a website featuring many design factors, such as design innovativeness, web graphics, and web space for a side margin, is closely associated with the efficiency of online retail processes and user satisfaction. Fassnacht and Koese (2006) also demonstrate that visual presentation and design structure set by the website format determine the appearance of the user interface, which directly influences customer perception of e-service quality. In addition to the format, certain pieces of web information, such as payment, shipping, customer service, web security, and social media, make online customers feel that an online retailer is approachable and trustworthy (Balasubramanian, Konana, and Menon 2003; Holloway and Beatty 2003; Kaplan and Haenlein 2010; Li and Dinlersoz 2012). Koufaris (2002) and Mummalaneni (2005) empirically verify that web characteristics, summarized by format and information, collectively stimulate web users’ psychological domains, which govern online customers’ overall experiences with a retailer’s website.
This study contends that home page presentation influences customer price perception. The concept of the servicescape in a physical store is useful in explaining this influence because home page presentation determines the virtual servicescape of an Internet retail store. Servicescape refers to the physical environment of a store characterized by artifacts, spatial layout, and ambient conditions (Bitner 1992). Han and Ryu (2009) found that servicescapes have a positive effect on price perception in the restaurant industry. In their study, the individual effect of three servicescape elements—artifacts, spatial layout, and ambient conditions—on price perception was significant. In an earlier study of the supermarket industry by Kerin, Jain, and Howard (1992), store environments and services prior to purchase, such as cleanliness, the variety and selection of merchandise, and the store’s check-cashing policy, positively influence customer price perception. Likewise, a retailer’s home page introduces the initial environment of the online store, leading to emotional and cognitive responses (Koufaris 2002), which are believed to have an effect similar to a physical store’s servicescape on customer price perception.
The theories on price perception offer plausible explanations why home page presentation influences customer price perception. By landing on a retailer’s home page, a customer obtains a certain image of the store. That image will be compared with home pages of other retail stores that the customer has visited (Bechwati, Sisodia, and Sheth 2009; Xia, Monroe, and Cox 2004). Such comparisons will help the shopper develop and adjust an internal reference price for the retailer’s merchandise, as claimed by the adaptation-level theory (Helson 1947). A high-quality home page presentation will lead to a high reference price, which increases the chance that the observed price will be lower than the reference price. This in turn will create a positive price perception within the customer (Janiszewski and Lichtenstein 1999; Kalyanaram and Winer 1995). Conversely, a low-quality home page presentation will create a low reference price, leading to a negative price perception.
Additionally, search efficiency potentially explains the connection of home page presentation with customer price perception. Search efficiency represents a website’s information handling and processing capabilities, which satisfy online customers’ information needs prior to purchase (Brynjolfsson and Smith 2000; Rabinovich 2007; Rabinovich, Maltz, and Sinha 2008a; Szymanski and Hise 2000). Importantly, effective home page presentation substantially improves search efficiency. For instance, a well-organized home page uses menu bars effectively, classifying information for the customer’s convenience. Presentation of an efficient hyperlink to critical information, such as payment information, shipping details, and customer service, makes a customer’s search for information simpler. Therefore, a well-designed retailer home page allows customers to easily locate desired information and shortens the time required to do so. The related concept to search efficiency is e-distance, which represents the distance, measured by the number of clicks required, to access specific types of information from a home page (Cox 2004; Kendall 2003). Kendall (2003) explains that five clicks of e-distance rule out 90% of web users’ accessibility. Accordingly, “the two-click rule” directs web design, with important information located within two clicks from the home page. Rabinovich (2007) finds that online customers of retail websites with high search efficiency spend more on their online transaction than those of websites with low search efficiency. This finding suggests that high search efficiency driven by an effective home page presentation can develop causal inferences about price fairness (Folkes 1988; Vaidyanathan and Aggarwal 2003), resulting in a positive price perception.
Order-Procurement Quality Perception and Price Perception
In the order-procurement stage, an Internet retailer aims to provide customers with information about the store’s products and services that matches the shopper’s specific needs and ultimately guides them to order placement online (Collier and Bienstock 2006; Szymanski and Hise 2000; Wolfinbarger and Gilly 2003). A variety of web attributes is required to support customers’ online information search beyond the home page, an activity that not only evokes pleasure but is also challenging (Agarwal and Venkatesh 2002; Koufaris 2002; Mummalaneni 2005; Novak, Hoffman, and Yung 2000). At first, the ease of finding necessary information becomes an important service quality factor in this stage, but after online shoppers have successfully located sought-after information, they then evaluate the quality of that information (Heim and Sinha 2001; Montoya-Weiss, Voss, and Grewal 2009; Ranganathan and Ganapathy 2002).
This study argues that the mutual influences between order-procurement quality perception factors, such as the ease of finding information and its quality and relevance, and price perception exist. The influence of order-procurement quality perception on price perception can be explained by the internal reference price. After experiencing high order-procurement quality driven by a website’s high search efficiency, online customers may increase their reference price, which creates a larger gap between the actual price and the reference price. This gap will lead to a positive price perception. At the same time, online customers have an opportunity to evaluate retailers’ procedural justice, and they can also develop causal inferences about service quality and prices during this stage of service interaction, as attribution theory claims. It is because customers move through multiple web pages providing information about the store, its products, shipping options, delivery promises, after-sales service, contacting channels, and so on. A positive order-procurement quality perception will reduce customer price sensitivity (Cao, Gruca, and Klems 2003–2004), which would result in a positive price perception. Relevantly, Zeng et al. (2011) find that cellular phone retailers’ service quality, such as customer services and order discrepancy handling, significantly reduces customer price sensitivity.
The opposite effect—influence from price perception to order-procurement quality perception—can still occur, particularly when a customer’s primary interest is price. Such a customer will check the price first, and then judge order-procurement quality later, which results in the influence from price perception on order-procurement quality perception. A customer satisfied with a price will likely favor the retailer’s web services, resulting in high order-procurement quality perception. This influence can happen because both customer price perception and order-procurement perception occur within the customer’s interaction with a retailer’s website. Any positive or negative price perception during this web interaction will instantaneously influence order-procurement quality perception.
The coexistence of both directions of influence is illustrated as a bidirectional relationship in Figure 1. Previous studies demonstrate the importance of chronological influence when people perceive price and service quality (Cao and Zhao 2004; Chang and Wildt 1994; Rabinovich 2007). The shorter the time interval is between two events, the stronger the influence of the first event on the second. The short time interval between price perception and order-procurement quality perception within the same stage of service interaction increases the chance for online shoppers to mix these perceptions. This condensed interaction is believed to create strong mutual influences between customer price perception and order-procurement quality perception.
Price Perception on Order-Fulfillment Quality Perception
The last relationship that this study highlights is between price perception and order-fulfillment quality perception. In the order-fulfillment stage, an Internet retailer delivers ordered goods and provides customer services during or after delivery. Many operational factors come into play in an order-fulfillment service process. Information replaces inventory in the process, and a firm aims to keep its supply chain lean but agile upon order signals (Cho and Menor 2012; Swafford, Ghosh, and Murthy 2006). Thus, delivery speed or on-time delivery becomes a key determinant of order-fulfillment quality (Heim and Sinha 2001; Rabinovich, Rungtusanatham, and Laseter 2008b). Similarly, product availability at the moment of order reception ensures on-time delivery, but Internet retailers often fail to update their websites to match their inventory (Raman, DeHoratius, and Ton 2001). In this instance, responsive customer support that informs customers of any delivery issues and rapidly recovers service failures will increase customer perception of service quality (Holloway and Beatty 2003). To facilitate this insight, some retailers offer order-tracking services online, which decrease the anxiety of impatient customers who comprise a significant segment of online shoppers (Cao and Zhao 2004).
From a buyer standpoint, a clear chronological gap exists between order placement on a retailer’s website and order reception. After observing a price and checking out the purchasing item, the buyer waits for order delivery. Many previous studies, as discussed earlier, find that high prices will have buyers anticipating high product/service quality (Brown 1969; Monroe 1973). This carryover effect can be explained by buyers’ tendencies to seek and confirm fair prices from each transaction by considering the input and output of the transaction (Huppertz, Arenson, and Evans 1978). From the view of fair price, the cost of a high price should be compensated by high quality, which leads to buyers anticipating high order-fulfillment quality (Cronin, Brady, and Hult 2000; Varki and Colgate 2001; Zeithaml 1988). Such anticipation provides a behavioral motive to pay different shipping costs for individual delivery options, from ground shipping to next-day air (Li and Dinlersoz 2012; Pan, Ratchford, and Shanker 2002; Rabinovich, Rungtusanatham, and Laseter 2008b). Such anticipation also explains that a buyer with a positive price perception has a favorable perception of the retailer’s order-fulfillment quality (Varki and Colgate 2001). Cao and Zhao (2004) explain the carryover effect such that a positive price perception raises customers’ tolerance to poor order delivery services, which results in a high perception of order-fulfillment quality.
However, contrary evidence to fair-value realization exists as well. Cao, Gruca, and Klems (2003–2004) propose the positive effect of price perception on order-fulfillment perception, but the path coefficient in their partial least squares (PLS) results is negative. One potential reason, they discuss, for this result is the long chronological gap between price perception on the web and order-fulfillment quality perception later on. According to the authors, the chronological gap can sweep away the earlier positive price perception, which could otherwise have influenced order-fulfillment quality perception.
This study examines the relationship using more recent data, supporting the customer tendency to seek fair value. Today, advanced supply chain management has shortened the chronological gap, with same-day delivery increasingly adopted as a delivery option by Internet retailers. The order tracking online also keeps online customers from losing their memories of earlier price perceptions. Based on these advances in order fulfillment, this study argues that the carryover effect will be significant across the different stages of service interaction, which will lead to a positive influence of price perception on order-fulfillment quality perception.
Methodology
Data Source and Collection
To test the three hypotheses, we collected data by examining individual retailer websites and Bizrate’s customer reviews. Bizrate.com hosts Internet retailers who agree to allow their online customers to evaluate their service quality, with the results in turn being released to the public (Field, Heim, and Sinha 2004). A major characteristic of Bizrate customer reviews lies in its two-step survey, which differentiates retailers’ order-procurement quality from their order-fulfillment quality. In the first step, a Bizrate.com pop-up survey invitation appears once a customer has completed an online transaction with an affiliated retailer. The survey at this point collects customer perceptions of the retailer’s order-procurement quality and price. Later, after delivery of the ordered item has been completed, the rating site sends a follow-up e-mail survey to that same online shopper to inquire about his or her perception of the retailer’s order-fulfillment quality. The survey results are collected and only the most recent results—from the past 90 days—are presented on Bizrate.com and on its sister website, Shopzilla.com. The Bizrate survey data have been very useful in studies of customer interaction with Internet retailers, as demonstrated by many research articles from different disciplines, including operations, marketing, and information systems, all of which have used Bizrate’s web data for their research (Heim and Sinha 2001; Otim and Grover 2006; Rabinovich, Maltz, and Sinha 2008a; Srinivasan and Moorman 2005; Thirumalai and Sinha 2011).
To collect the necessary empirical data, this study first listed 516 Internet retailers that were enrolled in Bizrate.com’s review of online customer services during the summer of 2010. They were entire lists of retailers with a minimum of 100 customer reviews enrolled within different business sectors, including electronics, computers and software, clothing and accessories, and health and beauty supplies. Selecting different sectors was necessary to increase the generality of our research findings. Before the full-scale data collection, we examined home pages of different Internet retailers within our sample and found considerable variation in home page format and information presentation. While the home page formats of almost all the retailers each had a horizontal menu bar, the formats varied in the numbers of vertical menu bars, as graphically illustrated in Figure 2. In addition to web format, we noticed five critical pieces of information on retailers’ home pages, among those that Heim and Field (2007) reference as the operational drivers of service quality: payment information, shipping information, customer service information, a web security device, and social media. Importantly, presentation of this information varied across the retailers’ home pages. These findings were useful in developing our measures of home page presentation.

Examples for presentations of menu bars in retailers’ home pages: (a) one vertical menu bar (with one horizontal one) and (b) multiple vertical menu bars (with one horizontal one).
After developing the sampling frame and examining retailer home pages, we performed two different data collection processes. First, we examined the 516 retailers’ individual websites to evaluate the major home page presentation factors identified previously, such as the web format and multiple pieces of home page information. For our second data collection process, we sourced the data for price perception and order-procurement and fulfillment quality perceptions from Bizrate customer reviews. In this study, the unit of analysis was an Internet retailer, and the overall customer reviews of each individual retailer were used. In the data collection process, those retailers with a minimum of 100 customer reviews were selected due to the potential risk of bias associated with a smaller number of reviews. The average number of customer ratings per retailer was 57,638 (standard deviation [SD] 148,625), with a maximum of 1 million reviews.
Measures
For each retailer’s home page, the number of vertical menu bars was counted as one of the home page presentation measures. The five pieces of home page information were also used to measure home page presentation. Payment information typically included different payment options, either showing the information directly, often by displaying a variety of credit card images, or providing a hyperlink to the relevant page. Similarly, shipping information on the home pages generally provided a hyperlink to the relevant page. The home page also typically had a hyperlink to customer service information, where detailed service information, such as contacting channels in the case of delivery problems or order returns, was provided. In the case of the web security device, retailers’ home pages showed a web security certificate such as McAfee SECURE, Verified Secure, or PayPal Verified, to assure customers that their website was financially safe and personally secure. Technically, these devices operate a variety of mechanisms—from scanning a retailer’s website to protecting a specific bank account for online use—but this study considered them collectively as security devices. We also found social media on the retailers’ websites, typically represented by individual iconic symbols, which might signify that those retailers want more close interaction with web users.
The results of our data collection within the home page presentation are summarized in Table 1. Of the 516 retailers examined, 156 (30%) used one vertical menu bar, while the remaining 360 retailers used two or more vertical menu bars to present classified products or services on their home pages. In the sample, 281 (54%) of the 516 retailers provided payment information on their home pages, while 342 (66%) of the retailers showed one or more web security certificates. More than half the retailers carried information about shipping (292 retailers, 57%) and customer service (307 retailers, 59%) on their home pages, either directly or via hyperlinks. Sixty percent of retailers (259 retailers) presented at least one social media tool of the 12, as summarized in Table 1. Facebook and Twitter were the two most popular social media tools used by online retailers.
Variables Within the Constructs of Home Page Presentation and Social Media.
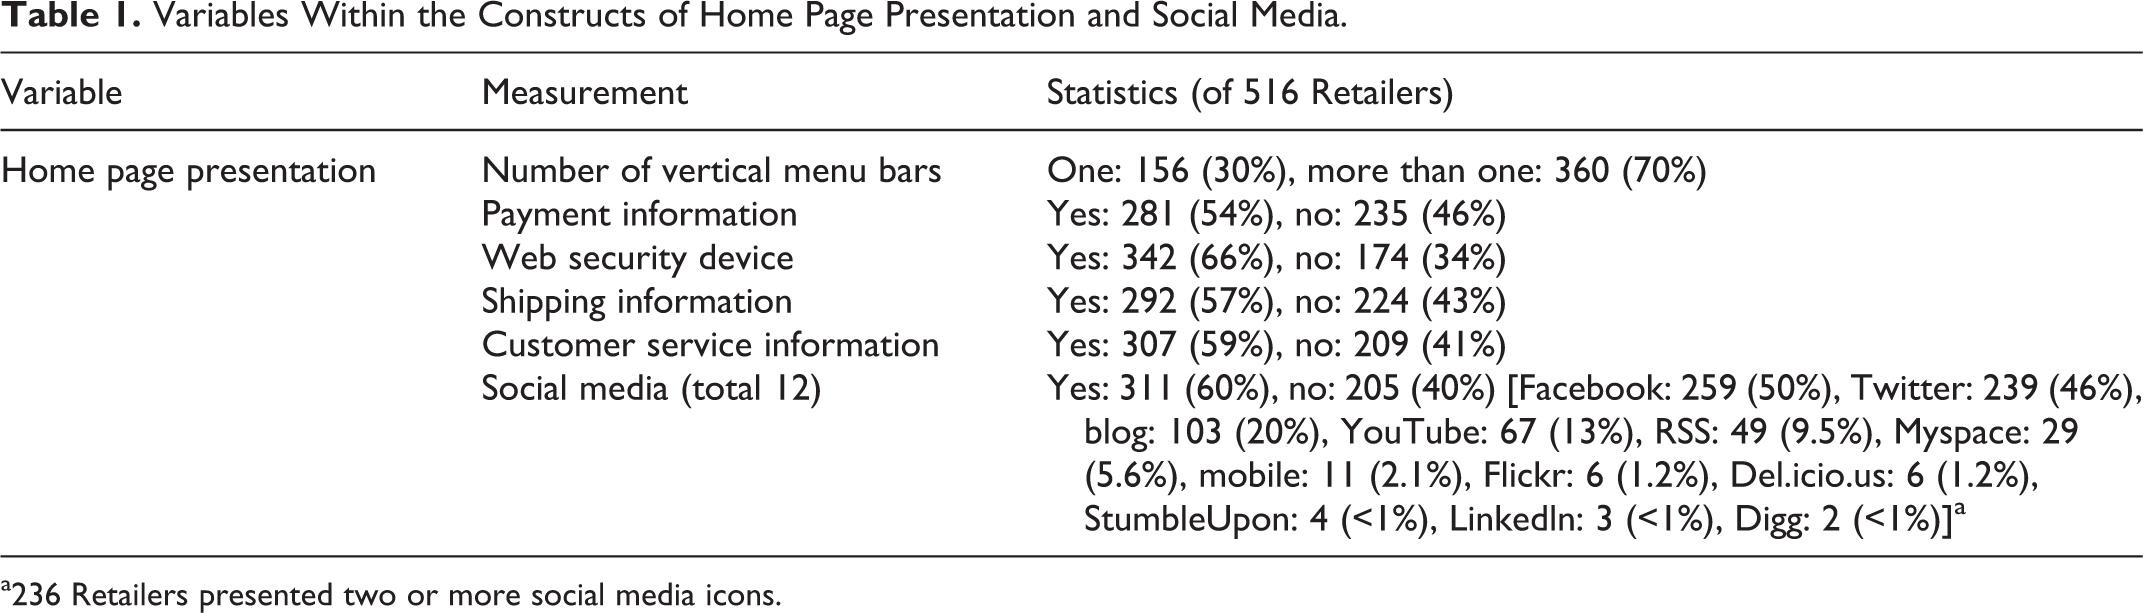
a236 Retailers presented two or more social media icons.
Bizrate.com’s customer survey data were further processed to operationalize customer perceptions of retailers’ order-procurement quality, order-fulfillment quality, and price. For this purpose, customer responses to nine of a total of 16 questions in the Bizrate.com survey, which were relevant to this study, were selected. The principal component factor analysis was used to reduce variables, and the results are summarized in Table 2. As shown, the analysis confirmed three latent factors; we labeled them as order-procurement quality perception, price perception, and order-fulfillment quality perception. Some previous studies have treated these individual indicators as separate variables, but the results of our factor analysis indicated the existence of common latent factors. The validation of measurement scale quality is summarized in Table 3, which demonstrates overall satisfactory measurement quality. The Cronbach’s α for the scale of price perception is relatively lower than other scales, but the small number of indicators explains the difference (Pedhazur and Schmelkin 1991). The size of factor loading for each indicator in the scale and composite reliability and average variance extracted (AVE) are all satisfactory.
A Rotated Component Matrix of the Principal Component Factor Analysis.a
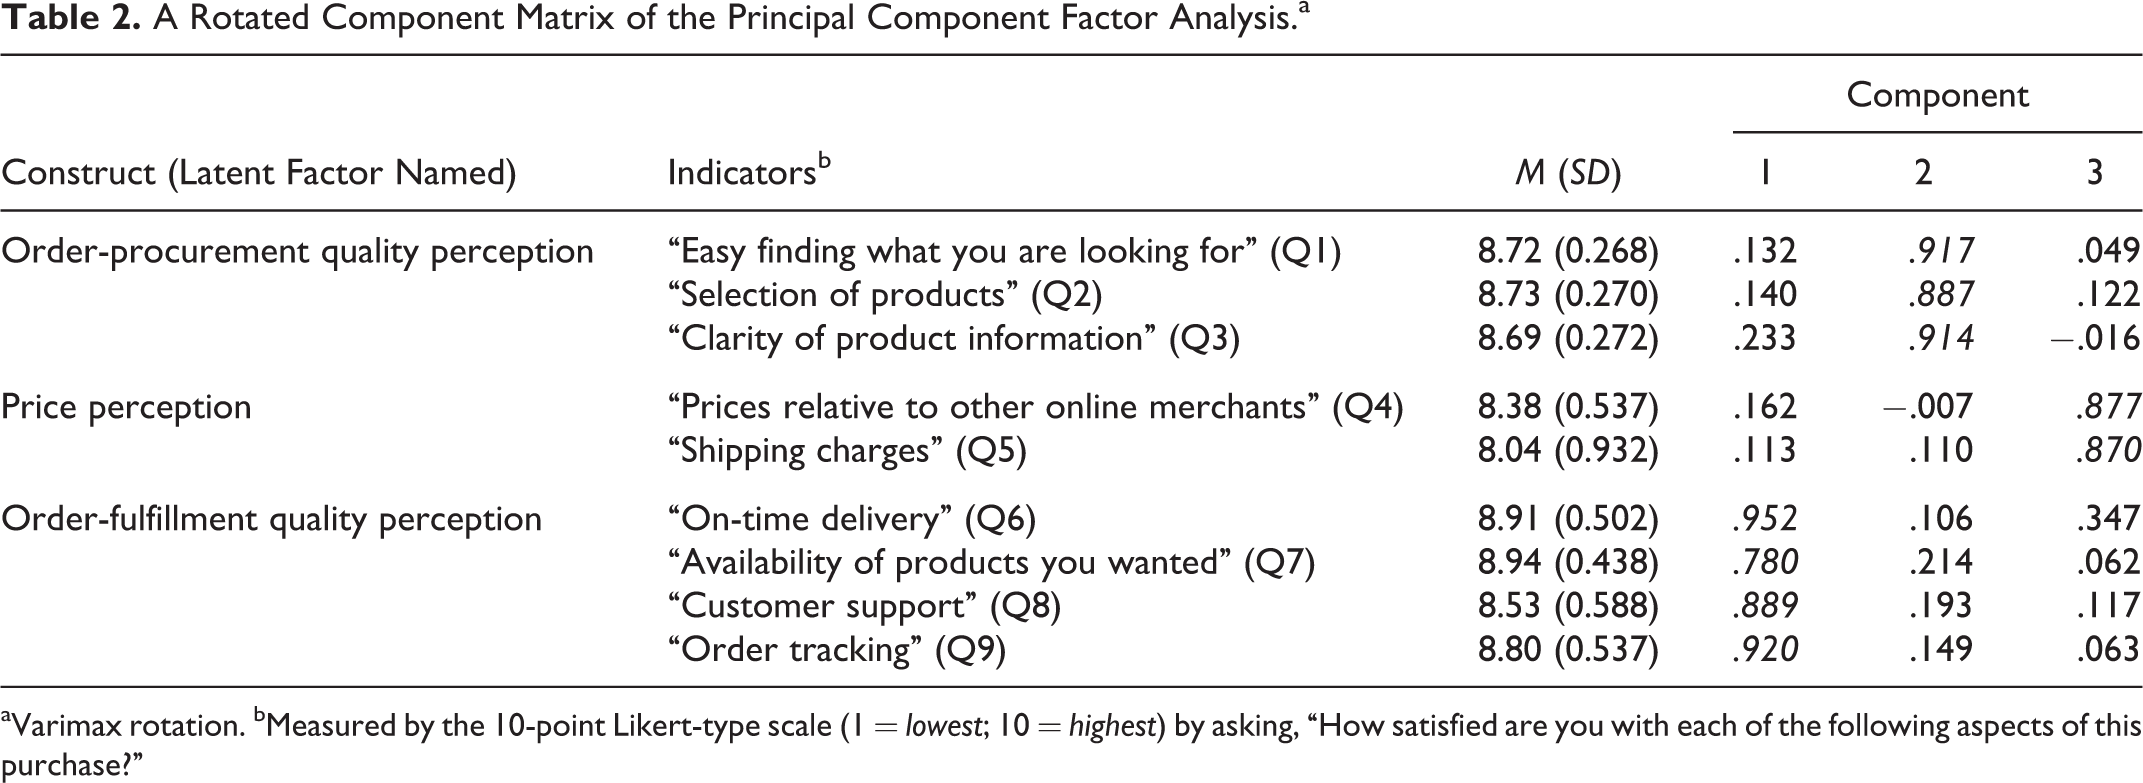
aVarimax rotation. bMeasured by the 10-point Likert-type scale (1 = lowest; 10 = highest) by asking, “How satisfied are you with each of the following aspects of this purchase?”
Results of the Scale Reliability Assessment.

aItem loadings were all statistically significant at p = .01.
Hypothesis Testing
Hypothesis testing was accomplished by using regression analysis. For examining the effect of home page presentation (Hypothesis 1), factor scores of price perception were used as dependent variables, and home page presentation factors were used as independent variables. Many of the home page presentation factors were categorical, as shown in Table 1, which required the use of dummy variables. To test Hypothesis 2, which posits mutual influences between order-procurement quality perception and price perception, each of the perceptions is included as an independent variable in the regression model where the other is used as a dependent variable. To test Hypothesis 3, another linear regression model was used where order-fulfillment quality perception was the dependent variable and price perception was used as one of the independent variables. Given the potential correlation between order-procurement quality perception and price perception posited in Hypothesis 2, the regression model included the interaction term between order-procurement quality perception and price perception. Throughout regression analysis, we used the number of customer reviews as a control variable. Before adding the control variable into the model, we took the common logarithm of the numbers of customer ratings. Brand reputation, recognized by Wikipedia, was used as another control variable because it was known to influence price perception (Monroe 1973; Smith and Brynjolfsson 2001). Wikipedia was useful for identifying retailers with strong reputations; it recognized a total of 135 reputable retailers among 516 with detailed individual information. This study used Statistical Package for the Social Sciences (SPSS) 19.0 for statistical analyses, including regression and exploratory factor analysis, and used Amos 19.0 for measurement validation.
The multicollinearity problem, driven by the high correlation between independent variables, can make correctly interpreting the regression results impossible because the regression coefficients become less valid under this condition (Abraham and Ledolter 2006). To minimize the multicollinearity problem, this study used factor scores of multi-item scales, which had been normalized. In addition, we analyzed multicollinearity indices for each independent variable while running regression models, such as tolerance and variance inflation factors (VIFs). The resulting data fell within the acceptable ranges, with more than 0.1 tolerance and less than 10 VIF, as presented with the regression results in Tables 4 and 5.
Results
Results of the regression analysis that tests the first hypothesis are summarized in Table 4, where price perception is used as the dependent variable. In the model summary, the significant F statistics (F = 6.388, p < .01) indicate that the regression model explains a significant part of the total variance. Among home page presentation factors, the number of vertical menu bars (p < .01) has a significant effect on price perception. However, other home page presentation factors do not significantly affect the dependent variable. The results indicate that Hypothesis 1 is supported but limited to web format and does not include home page information. Control variables, such as the number of customer ratings and brand reputation, are not significantly associated with price perception.
Regression Results for Hypotheses 1 and 2.
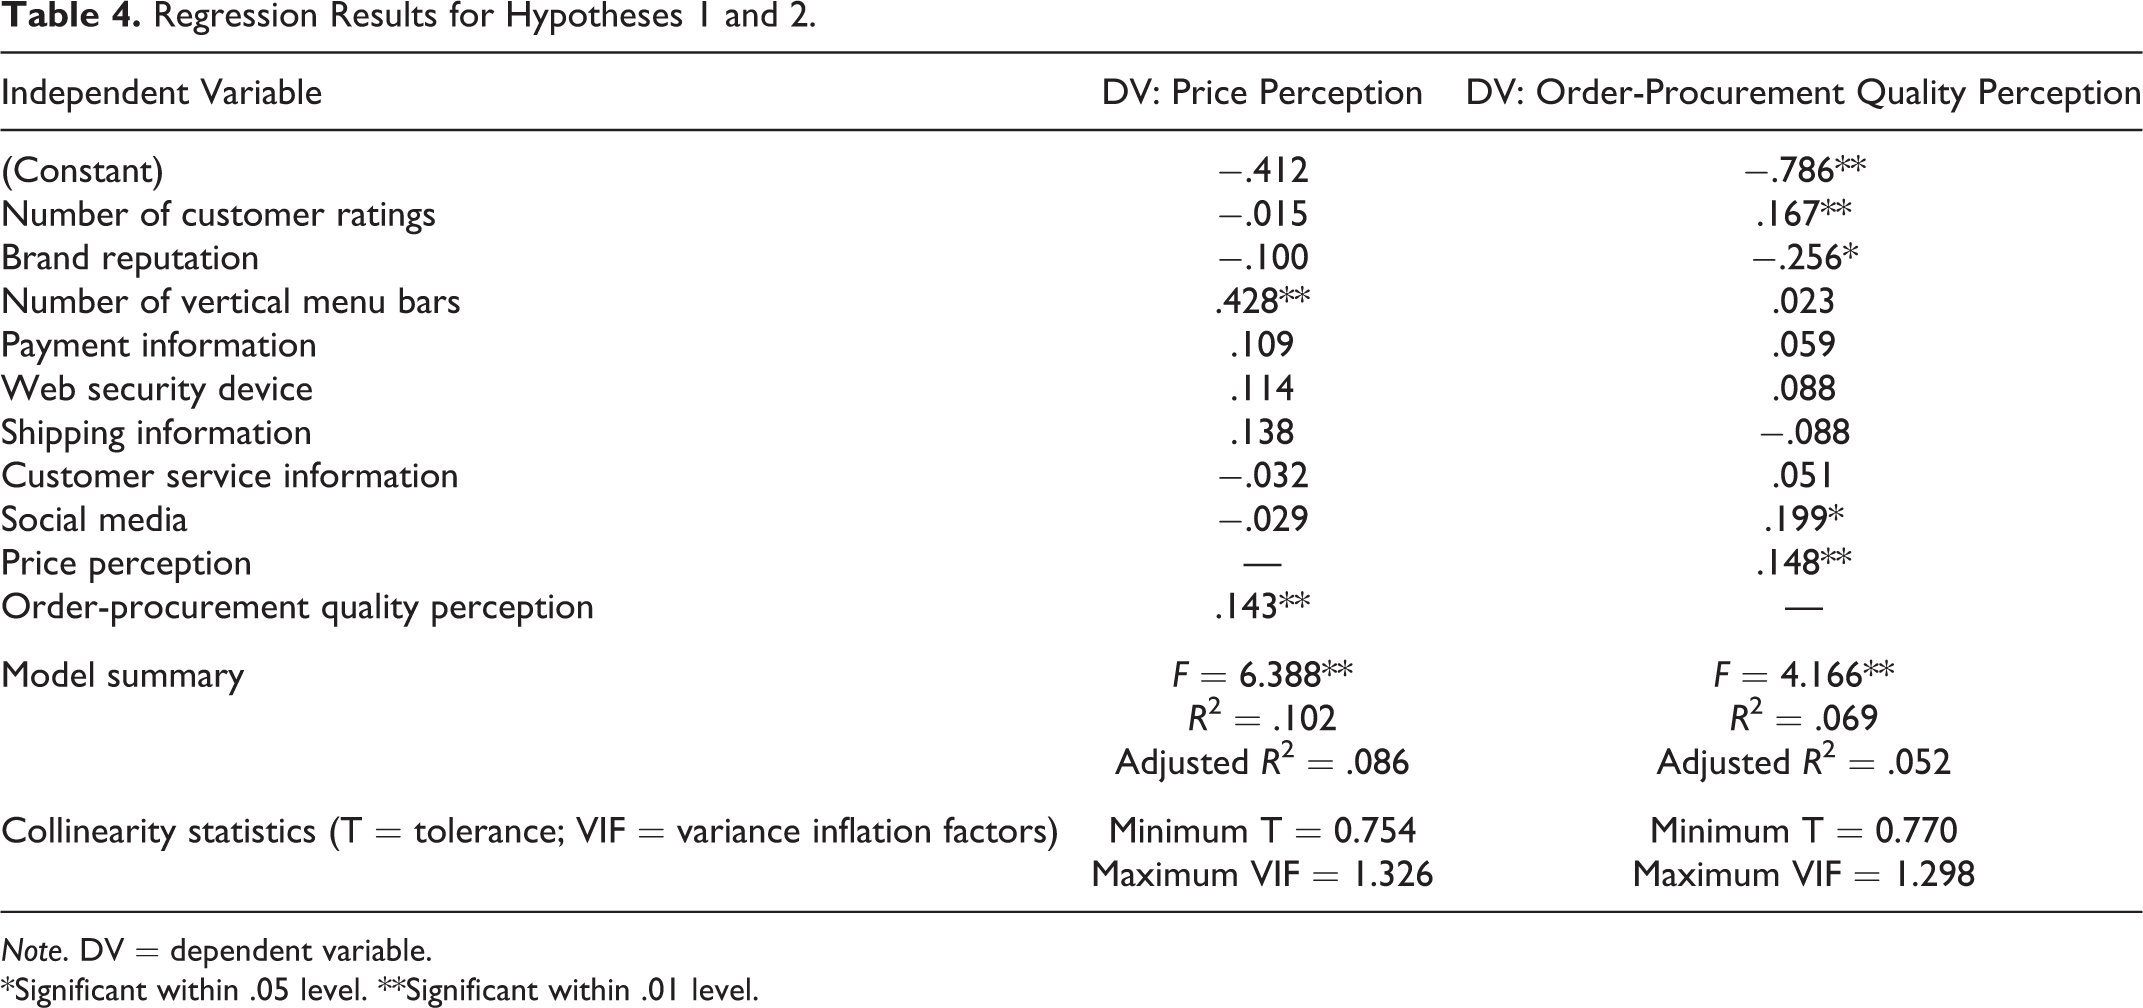
Note. DV = dependent variable. *Significant within .05 level. **Significant within .01 level.
To find the Hypothesis 2 test results, interpretation of both regression models in Table 4 is required because Hypothesis 2 posits mutual influences between price perception and order-procurement perception. In the model in which price perception is used as a dependent variable, order-procurement quality perception is a significant independent variable in the presence of control variables and home page presentation factors (p < .01). Likewise, in the model in which order-procurement quality perception is used as a dependent variable, price perception is a significant independent variable in the presence of control variables and home page presentation factors (p < .01). These results validate the mutual influences, supporting Hypothesis 2. In the model in which order-procurement quality perception is used as a dependent variable, two control variables are all significant (number of customer ratings, p < .01, and brand reputation, p < .05). The negative coefficient indicates that Internet retailers with a high brand reputation present a lower order-procurement quality perception than Internet retailers with a low brand reputation. The results also show that presenting social media icons on home pages is positively associated with order-procurement quality perception (p < .05).
Results of testing Hypothesis 3 in Table 5 also show significant F statistics (F = 32.96, p < .01) and reveal a statistically significant effect of price perception on order-fulfillment quality perception (p < .01). The interaction effect of price perception and order-procurement quality perception is significant, too (p < .01). These results strongly support Hypothesis 3.
Regression Results for Hypothesis 3.

Note. DV = dependent variable. *Significant within .05 level. **Significant within .01 level.
Discussion
This study advances our understanding of the relationship between customer perceptions of Internet retailers’ service quality and price by extending the scope of service encounters to three separate stages of service interaction. Findings in this study suggest that price perception and service quality perception are associated with each other along the chronological sequence of service interaction.
Internet retailers with multiple vertical menu bars in their home pages achieve significantly higher customer price perception. The finding is well aligned with that of previous studies that relate search efficiency to actual price (Rabinovich 2007; Rabinovich, Maltz, and Sinha 2008a). An effective home page format will increase search efficiency, which reduces price sensitivity during customer online shopping. An alternative explanation using the reference price is also possible. A well-organized home page presentation leads to the development of a high reference price, which increases a positive price perception. However, other home page presentation factors do not have a significant effect on price perception. The finding indicates that the effect of a web format is stronger than information accessibility from the home page. This impact is understandable to a certain extent because online customers’ primary interest in the early stage of online shopping might be to find product information, rather than other kinds of information.
The mutual influences between order-procurement quality perception and price perception are validated by this study. This result is expected, given that customer perceptions of order-procurement quality and price occur almost concurrently while customers are surfing retailers’ webpages. The mutual influences suggest that a high order-procurement quality perception reduces sensitivity to high prices and that the reverse—a positive price perception increases a customer’s satisfaction with the retailer’s website—is also true. Existence of these mutual influences can be examined by an alternative method, which is correlation analysis (Pedhazur and Schmelkin 1991). To confirm the influences, this study performed the Pearson correlation analysis and verified that it is statistically significant (γ = .156, p < .01). The positive mutual influences or correlation explain why a significant amount of previous research on e-service quality has focused on customer interaction with retailers’ websites (Rowley 2006). The stage of customer interaction with the retail website is proven to provide a major impression of the retailer’s services and prices to customers.
The positive effect of price perception on order-fulfillment quality perception provides another clue that customer interaction with a retailer’s website leaves a strong impression of the retailer’s services. In particular, the finding confirms the positive effect of price perception on tolerance to poor order delivery services, as Cao and Zhao (2004) suggest. In addition to the price perception effect, the positive effect of order-procurement quality perception on order-fulfillment quality perception in Table 5 advances our knowledge of e-service quality. Previous studies on e-service quality have developed many e-service quality dimensions (Parasuraman, Zeithaml, and Malhotra 2005; Rowley 2006), but most studies assume that those dimensions are independent rather than interrelated in their effects. This assumption is based on those dimensions being typically derived from latent factors of the exploratory factor analysis; any further causal connection is not hypothesized. As one of a few exceptions, Collier and Bienstock (2006) empirically validate a causal relationship between e-service quality dimensions, which they term process quality and outcome quality. In their study, however, no separation of different stages of service interaction is considered in the data collection process, unlike in our study. Seeing the carryover effect from the empirical data collected in different time frames is meaningful because the separation is believed to result in a more accurate assessment of customer perceptions at each stage.
The positive interaction effect between order-procurement quality perception and price perception on order-fulfillment quality perception is noticeable too. Given the significant correlation between order-procurement quality perception and price perception, and their strong individual effects on order-fulfillment quality perception, the significant interaction effect is conceivable, which is validated by this study. The finding suggests that both order-procurement quality perception and price perception produce a synergic effect. The synergic effect further strengthens the position that customer interaction with a retailer’s website is important for the development of impressions about the Internet retailer.
Finally, additional contributions of this study to hypothesis testing reside in finding the different pattern of customer price perception from that of actual prices. The results of our factor analysis indicate that the product price and the shipping price belong to the same latent factor. However, substantial evidence exists that retailers manipulate those two prices to realize a common margin (Rabinovich and Bailey 2004; Rabinovich, Rungtusanatham, and Laseter 2008b; Smith and Brynjolfsson 2001). In order to achieve a common margin, an increase in the product price should result in a decrease in the shipping price and vice versa. In this situation, the negative correlation is expected between the actual product price and the shipping price. However, the factor analysis in this study and the following Pearson correlation analysis show a strong positive correlation between perceptions of those prices (γ = .584, p < .01). The result clearly shows strong evidence that the pattern of price perceptions is different from that of actual prices. This finding has managerial implications to retailers who want to give a positive price perception to customers while achieving a maximum profit margin.
Managerial Implications
The findings in this study have several important implications for managers entering the fierce competition of Internet retailing as demonstrated by a gradual decrease in price dispersion among Internet retailers (Pan, Ratchford, and Shanker 2002; Ratchford, Pan, and Shankar 2003). From a strategic point of view, the positive relationship between service quality and price perceptions provides managers with a directive for handling the fundamental trade-offs between price and quality. Under intense competition, firms experience the pressure of price reduction directly connected with that of cost reduction (Maltz, Rabonovich, and Sinha 2004; Sinha 2000), but limited resources impede the simultaneous pursuits of cost reduction and quality increase. In other words, firms under such intense competition should operate their businesses close to the maximum output level that can be produced from a given set of resources, where the trade-off is inevitable (Schmenner and Swink 1998). Therefore, the finding of the positive relationships between retail prices and service quality in the perception level provides important insights for handling the trade-offs. This finding raises the possibility of an Internet retailer finding an internal mechanism that increases both service quality perception and positive price perception, overcoming the trade-offs between actual prices and service quality.
The significant home page presentation effect on price perception suggests that managers should develop a positive lasting first impression of their online stores. A straightforward interpretation of the research findings suggests that managers should consider presenting multiple vertical menu bars on their retail websites’ home pages. However, more broadly, the findings encourage retail managers to fully understand the potential impact of home page presentation on customers’ experiences with a retail website and to find out what kind of home page presentation factors appeals to their online customers in their specific industries. Based on that understanding, managers can then optimize home page design for their target markets.
The mutual influences between price perception and order-procurement quality perception suggest that Internet retailers should make price decisions in tandem with website design. In this study, the order-procurement quality perception is measured based on the convenience of searching for information, product selection, and the clarity of product information. Therefore, managerial efforts to align price presentation with web design for convenient information searching, well-curated product selections, and accessible information, are all required for creating positive impressions of an online retail store.
The positive effect of price perception on order-fulfillment quality perception suggests that Internet retail managers should be aware that customer satisfaction with retail prices during the web interaction is sustained through the order reception stage and creates a positive customer perception of order-fulfillment quality. The service encounter literature explains the significance of managing the interaction period within a service process, which generates a positive impression not only of the specific service but also of the entire firm (Bitner, Brown, and Meuter 2000; Rayport and Jaworski 2004). Our findings imply that an overall impression comes from orchestrating various factors of interaction in all stages (Cho and Menor 2010; Froehle and Roth 2004), which points to the need for managers to align outcomes of service interaction throughout the different stages.
The recent increase in the use of smartphones and tablets as a shopping tool makes service interaction more complicated (eMarketer 2013). In addition, marketing using social media such as Twitter, Facebook, and YouTube diverts customer attention from retailers’ websites to those social networking sites (Kumar and Mirchandanl, 2012; Rapp et al. 2013). However, the majority of online sales still occur using the retailers’ website via computer. Moses (2013) reveals that mobile devices will account for 15% of online sales in the United States in 2013 and will increase to 25% in 2017. In addition, customers will investigate and use a retailer’s website for shopping and buying until they are fully loyal to the retailer and its mobile application. Therefore, the importance of customers’ interaction with retailers’ websites does not appear to decrease rapidly as sales from mobile channels increase. Likewise, interactive customer perceptions of retail price and service quality will influence the process through which customers develop loyalty to an online store—a process that retail managers should review closely.
Limitations and Future Research
This study found empirical evidence of an association between customer price perception and service quality perception in the Internet retail context. However, this study uses cross-sectional data from different sectors, such as electronics, clothing, and health and beauty supplies, as a whole. The findings about the association are interesting and insightful but can be limited to general patterns gleaned from the mixture of heterogeneous data. Future research might refine research samples into individual industry sectors and collect more specific findings that would be applicable to certain sectors, which would further advance our understanding of the association. In such research, scrutiny in sample refinement would be required because many retailers, like Amazon.com, handle multitudes of products and thus do not identify themselves as belonging to any specific industry sector. However, given the findings of previous studies that customer needs during service interaction differ by industry sector (Pan, Ratchford, and Shanker 2002; Thirumalai and Sinha 2005), research targeted to such individual sectors would be meaningful. Similarly, future research could deepen our understanding of home page design. Our findings show that the effect of the number of vertical menu bars is significant. Hence, future research could further examine the effects of, for example, the location of each menu bar on the home page or its purpose (e.g., product classification or service classification). Combined with the need for study on individual industries, as discussed previously, is the need for investigating whether specific industry sectors might require certain home page presentation factors more than other sectors.
The major goal of examining price and service quality is to assess customer value (Varki and Colgate 2001; Zeithaml 1988). Therefore, a study of customer value would be required because it will show how customers weigh costs versus benefits when they shop in online stores. In an extension of this study, future research might show how the association of price perception on the cost side and service quality perception on the benefit side influences the retailer’s value to an online customer. Previous studies find that price and quality influence customer value in concerted ways (Zeithaml 1988). However, assessing the value to a customer is complicated because of the different stages of interaction. Future research could propose paths to customer value from multiple routes that encompass the different stages of service interaction, and test models using empirical data. Undoubtedly, the e-service economy will continue to grow by delivering value to customers. Examining the sources of customer value in Internet retailing promises important implications for both customers and retailers.
Another interesting finding in this study is the strong association of social media with order-procurement quality perception. As an extension of this study, a more in-depth examination of social media is needed. In this study, social media has been treated as a binary variable, which is suitable for testing its effect collectively but is inadequate for examining exactly how different social mechanisms are involved in this significant relationship. With regard to this mechanism, Cho and Menor (2010) classify social media along the four different types of e-service encounters: informational, self-directive, intervenient, and intensive. Kaplan and Haenlein (2010) also classify social media using the 2 × 3 matrix along two dimensions: self-presentation/self-disclosure and social presence/media richness. These frameworks provide a good starting point for future research since each type of social media can influence order-procurement quality perception in a unique way.
Footnotes
Acknowledgment
I thank Sey Yoon for her assistance with the data collection process. All errors and omissions in the process are the responsibility of the author. I thank the Journal Editors (Dr. Katherine Lemon and Dr. Mary Jo Bitner) and the three anonymous reviewers for their constructive comments, which allowed me to improve the article during the review process.
Declaration of Conflicting Interests
The author(s) declared no potential conflicts of interest with respect to the research, authorship, and/or publication of this article.
Funding
The author(s) received no financial support for the research, authorship, and/or publication of this article.
References
Supplementary Material
Please find the following supplemental material available below.
For Open Access articles published under a Creative Commons License, all supplemental material carries the same license as the article it is associated with.
For non-Open Access articles published, all supplemental material carries a non-exclusive license, and permission requests for re-use of supplemental material or any part of supplemental material shall be sent directly to the copyright owner as specified in the copyright notice associated with the article.