




Abstract
This article investigates the impact of service transition (the infusion of services in addition to goods to a manufacturing firm’s offering) on firm-idiosyncratic risk. The authors analyze a unique data set of 168 publicly traded manufacturing firms over a 6-year financial window (2006–2011), with the results showing that service transition produces a substantial increase in idiosyncratic risk. This effect, however, varies depending on critical firm contexts. First, strategic coherence (research and development intensity and service relatedness) mitigates market misgivings and causes idiosyncratic risk to decrease as service becomes more central to the offering. Second, misappropriation of resources (marketing expenses and resource slack) exacerbates the impact, resulting in increased firm risk. In light of the findings, the authors were able to expand the primary theoretical underpinnings concerning service transition by (1) providing a more holistic framework to view the phenomenon (behavioral theory of the firm), (2) demonstrating contextual boundaries around service transition, and (3) providing managers with useful insights to inform strategic firm-level decisions.
Keywords
In every strategic marketing action or decision, we always consider risk.
A major issue in business markets is commoditization, the convergence, and homogenization of goods’ characteristics and attributes such that differentiation is severely diminished or even lost (Antioco et al. 2008). Business-to-Business (B2B) firms have increasingly turned their efforts toward combating this phenomenon (Fang, Palmatier, and Steenkamp 2008). One option is to reconfigure the overall offering toward a service or solution-centered approach (Ordanini and Parasuraman 2011). The transition to service shifts a firm’s strategy away from the production of physical goods and toward service offerings (Eggert et al. 2014). Research argues that this transition leads to a stronger strategic position, as service offerings provide greater competitive advantage than solely physical goods (Bharadwaj, Varadarajan, and Fahy 1993).
While research notes certain advantages in service transition (Fang, Palmatier, and Steenkamp 2008), it also involves substantive departures from a firm’s core identity (Neu and Brown 2005). This departure has the potential to disrupt the market’s performance expectations, stemming from potential ambiguity in regard to the perceived quality and strategic intent of the service transition (Kirmani and Rao 2000). Specifically, service transition may signal a departure from existing goods-related core competencies, which can have serious implications regarding the variation in a firm’s stock price, that is, firm risk (Connelly et al. 2011). Stock price variation, that is, risk, stems from the financial market’s apprehension concerning a firm’s ability to integrate services in its offering and capture future revenue. In essence, financial markets may have a difficult time assessing the financial and strategic prudence of a firm’s service transition (e.g., Cyert and March 1963) increasing stock return volatility. Given the critical importance of risk in a firm’s strategic landscape and decision making, we investigate specifically how service transition affects it.
Using signaling theory (Spence 1973) and the behavioral theory of the firm (BTF; Cyert and March 1963) as our constructive lenses, we investigate how firm contextual factors affect the relationship between risk and service transition. Our theoretical framework suggests two important decision/coalition areas in the firm as primary contextual factors, strategic coherence and resource allocation (e.g., Argote and Greve 2007). Strategic coherence entails the commitment, congruency, and complementarity of a firm’s offering strategy, which we investigate in terms of research and development (R&D) intensity and service relatedness. Resource allocation involves a firm’s ability to provide and allocate sufficient resources to support strategic activities, which we investigate in terms of marketing intensity and resource slack (unabsorbed and absorbed). These factors act as signals to the market regarding the likely success or failure of a firm’s service transition and thus affect its impact on firm risk. Figure 1 depicts our conceptual model.

Conceptual diagram.
Our study offers several important contributions. First, we assess how a key strategic-level issue, the configuration of the overall offering portfolio, affects risk, a critical yet underresearched element of financial outcomes (Anderson 2006). Thus, our findings help to contribute to a comprehensive and systematic understanding of the financial implications of service transition specifically and strategic actions in general. Second, we extend our understanding of how firm contexts work to increase or amend risk generated by strategic action. Third, by investigating service transition through the lenses of BTF and signaling theory, we provide a solid theoretical context for the phenomenon. Importantly, we also provide managers with a critical perspective on decisions regarding a firm’s offering configuration so that they can make informed strategic choices.
Conceptual Development
Commoditization and Service Transition
Commoditization, the transformation of differentiated goods into commodities, represents a major business threat (D’Aveni 2010; Thull 2010). Indeed, the general nature of business offerings as (1) entering goods (e.g., timber, oil, wheat, etc.), (2) foundational goods (e.g., industrial grinders, forklifts, etc.), or (3) facilitating goods (e.g., office supplies, software platforms, etc.) predisposes many to the forces of standardization and homogenization. Even technology offerings that begin as highly differentiated eventually see competitive barriers erode over time, as market forces converge toward singular offerings (e.g., Xerox copiers, IBM computers, etc.; D’Aveni 2010; Levitt 1980; Porter 1985).
In addition, firms’ aversion to market uncertainty and subsequent attempts at environmental control hasten the commoditization phenomenon (Argote and Greve 2007). Firms accelerate commoditization by attempting to control market ambiguity through industry-wide convergence of product attributes, standard operating procedures, and even price schedules (D’Aveni 2010). Subsequently, firms must now attempt to differentiate commodity-like offerings or those vulnerable to industry convergence pressures; that is, they must now attempt to decommoditize offerings prone to homogenization (D’Aveni 2010; Levitt 1980). One viable means for coping with commoditization is to infuse services into a firm’s offering portfolio (Gebauer et al. 2010).
Service transition involves the deliberate infusion of services into a firm’s goods-based offering portfolio, such that services have increasing prominence (Antioco et al. 2008; Lay et al. 2010). The goal of the transition is to alter the competitive stance of the firm to ensure continual delivery of value (Fang, Palmatier, and Steenkamp 2008). Service transition extends beyond postsales service support or goods-based “add-ons” to include distinct yet related and complementary offerings such as consulting services and safety training, among others (Neu and Brown 2005). Firms use services not only to support their physical goods (repair and information and technology support) but also to complement and extend the reach of their offering (Neu and Brown 2005). For example, a prominent fuse manufacturer differentiated itself by expanding its offering portfolio to include safety training and consulting as their underlying technology became a commodity. The firm shifted its emphasis toward services as a means to provide additional customer utility.
Given service transition’s potential impact, extant literature has explored its effect on several firm outcomes, such as performance (Fang, Palmatier, and Steenkamp 2008), firm differentiation (Ulaga and Reinartz 2011), customer satisfaction (e.g., Bolton, Grewal, and Levy 2007), willingness-to-pay (e.g., Reinartz, Thomas, and Kumar 2005), and improving relationships (Eisingerich, Rubera, and Seifert 2009). However, no work to date has explored its effect on firm risk. Understanding risk is vital to gain a more complete understanding of service transition’s impact on shareholder and firm value (Gruca and Rego 2005). Although service transition is a potential way to deal with commoditization, it also involves substantive departures from a firm’s core focus in terms of identity, resources, and capabilities. This departure suggests serious implications for risk (Anderson 2006).
Firm Risk
Risk involves hazards faced by a firm that derive from its own strategic actions, competitors, or environmental forces (Bansal and Clelland 2004). These hazards create uncertainty in a firm’s ability to generate stable and predictable future cash flows (Luo and Bhattacharya 2009). The effect of this uncertainty plays out as changes, or variability, in a firm’s stock return, that is, risk (Fornell et al. 2006). The study of risk provides critical insights because it allows for the assessment of value produced by strategic actions (e.g., brand extensions, improving customer satisfaction, advertising, etc.; e.g., Fornell et al. 2006). Thus, risk can serve as a primary guidance mechanism in strategizing, since it indicates the market’s belief that firm action will result in a competitive advantage and stable/predictable cash flows (e.g., Anderson 1982; Moorman and Rust 1999).
Conceptually, financial risk is divided into two key components, systematic risk (i.e., market specific) and idiosyncratic risk (i.e., firm specific). Idiosyncratic risk is the “volatility in stock returns that cannot be explained by the stock market movements and therefore represents investor’s uncertainty related to future cash flows” (Bharadwaj, Tuli, and Bonfrer 2011, p. 91). We focus on idiosyncratic risk (Aaker and Jacobson 1987) and refer to it simply as risk because it derives directly from firm strategic action, in our case, service transition. Cash flows relate to all sales revenue and additional monetary sources, such as financing and investing activities, available to the firm (Brigham and Daves 2012). Strategic firm action, however, predominately influences a firm’s sales revenue more than its investment and financing activities (Anderson 1982). Therefore, in regard to cash flow perceptions and subsequent risk outcomes, we focus specifically on service transition’s effect on future revenue perceptions.
Importantly, risk is unique from other financial outcomes such as return-on-investment (ROI), market capitalization, or Tobin’s Q (Aaker and Jacobson 1987; Ferreira and Laux 2007). First, it affects firm vitality (Amit and Wernerfelt 1990). Greater risk demonstrates disruptive, dynamic, and turbulent cash flow expectations (Fama and French 1992) that suggest market uncertainty in firm stability and continuity (Luo and Bhattacharya 2009). Second, risk operates in conjunction with the inherent rate of return (Chakravarty and Grewal 2011). Strategic actions that fail to achieve a desired rate of return for a given level of risk are suboptimal investments of scarce resources (i.e., cash) that can lead to financial distress (Luo and Bhattacharya 2009) and shareholder dissatisfaction (Bansal and Clelland 2004). Third, risk affects investment attractiveness (Markowitz 1952). Firms characterized by high risk are undesirable for investment and encounter problems procuring external funds and financial capital.
Extant literature includes several examples of firm action influencing risk, such as customer strategies (Fornell, Mithas, and Morgeson 2009; Tuli and Bharadwaj 2009), brand management (Bharadwaj, Tuli, and Bonfrer 2011; Rego, Billett, and Morgan 2009), corporate social responsibility (CSR) initiatives (Luo and Bhattacharya 2009), and advertising and R&D (McAlister, Srinivasan, and Kim 2007), among others (Chakravarty and Grewal 2011). Typically, scholars (see e.g., Bansal and Clelland, 2004) explore this relationship through a standard sequence. First, a firm engages in strategic action (e.g., brand extensions, CSR initiatives, etc.) that sends a signal to the environment/market (i.e., customers, shareholders, etc.), which influences the market’s perceptions of a company’s future sales revenue. The firm’s stock price then fluctuates in conjunction with these perceptions, affecting firm risk. As an illustration, Bharadwaj, Tuli, and Bonfrer (2011) found improving brand quality lowers idiosyncratic risk because it increases customer loyalty and improves offering diversification. This produces a signal to the market that translates to lower volatility of expected future sales revenue. We expect the influence of service transition on firm risk to occur through this same signaling mechanism.
Service Transition and Firm Risk
Importantly, service transition differs from previous investigations into strategic action (e.g., Fornell, Mithas, and Morgeson 2009; Tuli and Bharadwaj 2009). Service transition can often represent a distinct and radical departure from a manufacturing firm’s core focus and identity (Neu and Brown 2005). Prior research has generally investigated strategic actions that are generally consistent with a firm’s core focus and identity. Thus, service transition brings its own unique risk implications for a firm (Anderson 2006). We address these aspects and our expectations through the lens of signaling theory (e.g., Connelly et al. 2011).
Signaling theory concerns information asymmetry between parties. Information asymmetry occurs when different people, entities, business, and so on, have different knowledge concerning another party’s quality and intent (Connelly et al. 2011; Elitzur and Gavious 2003). In business, information asymmetry manifests as outside investors, shareholders, and the market having difficulty discerning the quality and intent of firm actions (Kirmani and Rao 2000). Firms attenuate this asymmetry by signaling. If the signal produces apprehension, doubt, or misgivings, it results in a negative market response, that is, higher volatility in returns and increased risk; however, if the signals generate market faith and goodwill, a positive market response ensues, that is, reduced volatility in returns and lower risk. Service transition is such a signal.
Negative signal of service transition
First, service transition may signal a loss of strategic focus (Fang, Palmatier, and Steenkamp 2008). A firm’s strategic focus hinges on its core competencies (Porter 1985). For a B2B manufacturing firm, these associate with its traditional goods-based offering. Service transition breaks away from this primary focus. Markets may see the departure as a loss of strategic direction and lose faith or question the viability, prospects, and intent of a firm, with increased apprehension concerning its competitive position. A firm with a lack of strategic direction likely produces a signal that causes the market to question its ability to generate predictable future sales revenue. Additionally, this draws significant shareholder attention to the firm, which research shows increases firm risk (Bansal and Clelland 2004). Thus, the market’s perception of a loss of strategic focus creates stock volatility and increased firm risk (Luo and Bhattacharya 2009).
Second, service transition requires substantial resource commitments to succeed (Bolton, Grewal, and Levy 2007). A firm must either acquire additional resources or divert existing resources from other functional areas to support the transition. Spreading resources thinly over various activities may signal resource shortage (Bourgeois 1981). Shortages make a firm more vulnerable to market fluctuations and competitive threats, reducing its ability to generate substantial revenue from its offerings and heightening market apprehension. Further, insufficient resource support for service transition often results in a failure to meet customers’ expectations and may lower customer satisfaction (Zeithaml, Berry, and Parasuraman 1988). Lower satisfaction means that customers are more likely to switch to competitors, spread negative word of mouth, and ultimately may force an increase in marketing expenses (Gruca and Rego 2005). This results in greater market skepticism and apprehension toward future earnings potential, yielding volatile stock returns and increased risk.
Third, service transition requires significant intrafirm cooperation (Neu and Brown 2005). Unfortunately, the creation of additional firm coalitions due to new strategic initiatives, that is, service transition, may increase internal political tension and conflict. This occurs if new coalitions fail to align and integrate with existing factions (Cyert and March 1963; Neu and Brown 2005). Powerful intrafirm coalitions such as operations, R&D, and sales may feel threatened by the transition and align themselves against the infusion. This can result in goal incongruity between coalitions, causing internal strife and tension (Argote and Greve 2007), hindering the firm’s competitive position in their environment. Such actions would likely produce a negative signal that results in market mistrust and apprehension regarding expected sales revenue and increased risk.
Fourth, service transition can induce greater risk when it requires capability retooling (Fang, Palmatier, and Steenkamp 2008). Firms transitioning to service may have to cultivate seldom used or even new capabilities (i.e., consulting, safety training expertise, etc.). Cultivating new capabilities can result in ambiguity and confusion, disrupting the perceived stability of a firm’s revenue-generating activities until it has developed the necessary knowledge stores needed to succeed (Johnson, Sohi, and Grewal 2004). Further, the time requirement for this process can leave the firm vulnerable to competitive threats with no guarantee of success for their efforts. This ambiguity likely results in market hesitation and skepticism, manifesting as increased risk (Bharadwaj, Tuli, and Bonfrer 2011).
Positive signal of service transition
Despite factors suggesting that service transition increases risk, there are arguments suggesting the opposite. First, service improves the offering’s differentiation ability (Lusch, Vargo, and O’Brien 2007). An offering including service has the potential to be more durable, unique, and difficult to imitate or substitute (Gebauer et al. 2010). Given their intangible nature, services can be extremely difficult for competitors to imitate, diminishing competitive response, improving differentiation, and generating additional avenues for future economic growth (Eggert et al. 2014). Improved differentiation allows a firm to stand apart from competitors, deliver greater value to customers, and thereby have reduced volatility in their expected sales revenue (Fang, Palmatier, and Steenkamp 2008). Subsequent market reactions are likely to be positive, given the perception of enhanced firm quality (Connelly et al. 2011), resulting in less stock volatility (i.e., reducing risk; Chakravarty and Grewal 2011). Second, service makes the offering more flexible and adaptable to market changes (Vargo and Lusch 2004a). Services can move in parallel to changing customer needs more easily than physical goods (Neu and Brown 2005). This allows a firm to stay in front of dynamic market conditions and capture economic rents (Porter 1985).
Third, service transition creates stronger relationships (Bolton, Grewal, and Levy 2007), which can improve customer acquisition and retention, promotional efficiency, and willingness to pay (e.g., Reinartz, Thomas, and Kumar 2005). Additionally, service transition increases switching costs for customers, which minimizes customer defection and creates longer relationships (Fang, Palmatier, and Steenkamp 2008). Such customer improvements generate market goodwill concerning a firm’s future sales revenue potential, reducing stock volatility and firm risk. Finally, service transition diversifies the offering. By reconfiguring the offering to include physical goods and services, a firm relies exclusively on neither and can manage its portfolio to maximize its strategic effectiveness. Portfolio diversification has consistently been shown to lower volatility and reduce risk (Markowitz 1952).
Despite the positive signaling components of service transition, we argue that the combination of loss of strategic focus, resource acquisition, potential increase in intrafirm tension, and capability retooling related to service transition produce sufficient negative signals to trump potential risk reduction. Therefore, we expect that service transition’s dominant signals create market apprehension, resulting in greater stock volatility and increased risk. Importantly, however, the presence of these mechanisms, along with theory, suggests that key contextual factors will influence the market’s perception of the transition (Argote and Greve 2007; Cyert and March 1963).
Firm Context: Strategic Coherence and Resource Allocation
Service transition introduces a new coalition into the firm structure (Neu and Brown 2005). To succeed, this new coalition requires sufficient support in terms of resources and capabilities (Bolton, Grewal, and Levy 2007). Firms vary in their ability to provide support and manage the integration process (Ulaga and Reinartz 2011). We posit that differences in abilities produce market signals that affect the service transition-risk relationship (Kirmani and Rao 2000). We draw on the Behavioral Theory of the Firm (BTF) (Cyert and March 1963) to explore these effects.
According to BTF, a firm consists of a collection of coalitions (departments) aligned to achieve certain goals (i.e., profits, market share, sales, etc.). Goals change as new participants, or coalitions, enter the firm introducing conflict that must be resolved in terms of goal alignment (Cyert and March 1963). To ensure goal achievement, firm decision making revolves around two primary tasks: (1) determining overall strategic choice/action and (2) allocating resources and strategic efforts in pursuit of that choice (Argote and Greve 2007).
A firm’s strategic choices are based on its expectations, inferences from available information, performance aspirations, and referent firm performance (Cyert and March 1963). As the firm encounters the commoditization threat, it will favor strategic actions that present the best opportunities for countering it (D’Aveni 2010; Carter 1971). Service transition provides just such an opportunity and a critical signal to the market. However, our theoretical lens suggests that ancillary strategic choices made in conjunction and support of the service transition influence its signal to the market and thereby its impact on risk.
The ancillary strategic choices made in conjunction with service transition entail strategic coherence or the unification of firm goals. We consider strategic coherence in terms of (1) the focus on continual innovation and improvement of the offering assessed through R&D (D’Aveni 2010) and (2) the congruence between the service elements and the physical goods in the offering portfolio (Fang, Palmatier, and Steenkamp 2008), which we assess as service relatedness. Next, ancillary strategic choices made to support service transition, that is, resource allocations, encompass two critical dimensions: (1) the level of marketing support (i.e., marketing intensity; Bolton, Grewal, and Levy 2007) and (2) the availability of resources (i.e., resource slack) to all coalitions (Neu and Brown 2005).
Strategic Coherence: R&D Intensity and Service Relatedness
R&D intensity indicates the relative extent of financial resources a firm devotes to research and development. It represents a firm’s commitment to continual innovation and improving its offering (Gebauer, Gustafsson, and Witell 2011). It signals the effort and importance placed on developing future goods as well as a firm’s commitment toward offering line maintenance. Extant literature verifies that R&D intensity affects new offering development (Raassens, Wuyts, and Geyskens 2012) and critical firm innovation outcomes (Swaminathan, Murshed, and Hulland 2008).
R&D intensity provides a unique complement to service transition such that the presence of strong R&D provides a signal that can mitigate market apprehensions concerning service transition. Specifically, strong R&D intensity, a firm’s commitment and dedication to maintaining and improving its offering, can reduce market concerns regarding any potential loss of strategic focus to the product side of the firm. Thus, the existence of strong R&D coupled with service transition demonstrates a firm’s commitment to its existing goods-oriented competencies in addition to enhancing customer utility through its service offerings (Neu and Brown 2005). Moreover, R&D intensity could generate increased market goodwill as it improves diversification and differentiation abilities (D’Aveni 2010; McAlister, Srinivasan, and Kim 2007). Greater innovation also improves the primary platform that services are marketed through, garnering larger and more consistent sales revenue (Vargo and Lusch 2004a). When combined with service transition, both factors maximize the uniqueness and durability of the total offering, improving its chance to meet and satisfy complex customer needs (Neu and Brown 2005). This improves firm differentiation with an overall offering that is more difficult for competitors to imitate or duplicate (e.g., Barney 1991). The combination of R&D and services results in a positive market response due to a strong portfolio of both innovative goods and value-enhancing services, reducing overall volatility in projected future sales revenue. Therefore, we posit that coupling service transition with a strong innovation focus, that is, strong R&D intensity, mitigates market apprehension and enhances market goodwill, thereby reducing stock volatility and lowering firm risk overall. Thus:
Service relatedness refers to the level of congruency between a firm’s service offering and its goods. That is, it notes how closely a firm’s goods and service offering are linked (Fang, Palmatier, and Steenkamp 2008). Certain service offerings relate more closely to core goods than others. These can help augment or support physical goods (Neu and Brown 2005). As such, services related to core goods likely send a positive signal to the market. First, as with strong R&D, service relatedness lessens market fears regarding the potential loss of strategic focus. Services that are highly related to core goods signal a firm’s commitment to maintain its core competencies and strategic coherence (Neu and Brown 2005). Moreover, developing a service in conjunction with and complementary to the primary goods offering improves the delivery of service to external customers. This increases customer satisfaction to the overall offering. Satisfied customers produce more stable future revenue expectations and less stock price volatility (Fornell et al. 2006). Further, greater service relatedness improves the likelihood of developing synergistic partnerships between intrafirm coalitions. This improves the efficiency of firm knowledge stores and knowledge accumulation (Fang, Palmatier, and Steenkamp 2008). Improved synergistic effects also enhance goal congruence and help reduce tension between intrafirm coalitions (Cyert and March 1963). These improvements produce a positive signal that the market interprets with more stable expected future sales revenues and less stock volatility.
Second, relatedness enhances customer acceptance of the service (Bolton, Grewal, and Levy 2007). Importantly, the more related the service to the core goods, the more likely a firm maintains a strong strategic identity with customers and markets. This generates positive market goodwill through improved customer relationships and customer loyalty (Palmatier et al. 2006). Strong customer relationships and loyalty produce more stable expected revenue, that is, lower firm risk (Bharadwaj, Tuli, and Bonfrer 2011). Thus, we expect that greater congruency between the service and the goods offerings mitigates potential market apprehensions and enhances the generation of positive market goodwill, resulting in less stock volatility and a reduction in firm risk. Stated formally:
Resource Allocation: Marketing Intensity and Resource Slack
Marketing intensity refers to the level of financial resources a firm devotes to marketing activities. It involves a commitment to support the offering with vital marketing resources and effort. Thus, it encapsulates all activities used in the exchange with the environment, especially communications with customers and the market (Anderson 1982; Moorman and Rust 1999). In essence, it enhances or augments the firm’s signal to the market (e.g., Homburg and Jensen 2007). Therefore, we posit that by influencing the signal, strong marketing intensity in conjunction with service transition substantially affects firm risk.
Marketing intensity signals commitment to provide adequate marketing resources to the service transition. This likely has two beneficial effects. First, service transition requires significant investments of marketing resources to succeed (Neu and Brown 2005). Failure to provide these resources hinders service transition from realizing its potential performance gains, which can result in less stable/predictable expected future revenue. Marketing resources are especially value to the service transition because they can be used to help educate potential customers concerning the service offering, expand potential market opportunities for the service and goods offering, and even assuage potential concerns over strategic issues (i.e., loss of offering focus or potential problems with the offering line; Bolton, Grewal, and Levy 2007). These activities are essential for establishing strong customer utility concerning the service offering (Bolton, Grewal, and Levy 2007). Improved customer utility from service transition will produce positive market perceptions concerning future sales revenue and reduced stock volatility. Second, marketing intensity can reduce potential political tension caused by an additional intrafirm coalition. Coalitions are likely to reduce political maneuvering once assured of continual marketing support. Markets are likely to respond to such signals in a positive manner, that is, ameliorating risk. Stated formally:
A firm’s current resource position significantly affects outcomes of service transition (Kraatz and Zajac 2001), which we investigate through resource slack. Resource slack refers to the cushion of excess resources, financial and otherwise, that a firm can allocate in a discretionary manner (Bourgeois 1981). Slack includes absorbed and unabsorbed components (Bourgeois 1981). Unabsorbed slack consists of firm resources that are relatively free from commitments, readily available, and deployable as necessary. Unabsorbed slack ensures continual fulfillment of goal directives by repeatedly redistributing and redeploying spare resources throughout the firm (Sharfman et al. 1988). These resources include, among other things, cash, credit lines, and capabilities. Given a sufficient reservoir, resource redeployments have the ability to enrich certain coalitions without adversely affecting other important firm activities (Sharfman et al. 1988). Indeed, the normative expectation of BTF (Cyert and March 1963) is that spare resources from unabsorbed slack (i.e., retained earnings) are reinvested into exploratory-based innovation activities.
Thus, although unabsorbed resource slack might provide service transition with the requisite resources without disrupting other intrafirm resource flows (Bharadwaj, Tuli, and Bonfrer 2011), it may produce market confusion as it breaks normative expectations regarding the use of these resources (Levinthal and March 1993; Carter 1971). That is, given that unabsorbed slack is often linked to exploration in core products (George 2005; Mishina, Pollock, and Porac 2004), the failure to reinvest unabsorbed slack resources back into capability development or retooling may cause the market to lose confidence in the firm’s strategic outlook. Unmet market expectations concerning the appropriate distribution of resources may exacerbate negative perceptions regarding service transition even further. Thus, we expect such market apprehensions to amplify the service transition-risk relationship in the presence of high unabsorbed slack. Stated formally:
In contrast to unabsorbed slack, absorbed slack refers to a firm’s excess resources dedicated to current operations and can represent costs to the firm (Singh 1986). These can be difficult or even impossible to redistribute, as they involve excess production capacity, specialized skilled labor, and physical plant assets (Greve 2003). If resources are intractably committed, for example, to production capacity, the impact of holding such absorbed slack may not be desirable. Absorbed slack can thus constrain firm reactions and responses (George 2005). The subsequent inability to respond to market changes with resource deployments hinders service transition. This yields poor financial results, creating significant uncertainty regarding future revenue generation, and greater stock variability. Further, as the reservoir of resources dwindles, coalitions are likely to experience resource constraints and shortages. These shortages could result in increased political pressure and conflict, eroding market goodwill, increasing market apprehension, and further stock volatility. Therefore, while absorbed slack involves spare resources (e.g., excess production capacity) they lack flexibility. The lack of flexibility reduces a firm’s ability to move resources to support alternative strategic initiatives, thereby amplifying the impact of service transition on risk. Thus,
Research Methodology
Data Sources
Our data came from manufacturing firms in the United States with primary Standard Business Classification (SIC) codes between 08 and 39. These SIC codes represent major manufacturing industries on the U.S. stock exchange, such as aerospace, chemicals, forestry and agriculture, petroleum, and semiconductors (Fang, Palmatier, and Steenkamp 2008). We began our investigation with all publicly traded firms in these SIC codes between 2006 and 2011, but then excluded firms if they failed to report service revenue. This resulted in a final sample of 208 firms with 1,198 observations. 1 We tested for possible sample bias using a holdout sample of firms eliminated because they did not report service revenues and compared the means with our sample on firm size in terms of employees, R&D, slack, sales and general administrative expenses (SGA), and advertising. We found only one significant difference between the samples showing that the firms in the holdout sample were slightly larger in terms of number of employees (t = 1.92, p = .06). Our data came from several secondary sources including CRSP, COMPUSTAT, and French’s personal website (http://mba.tuck.dartmouth.edu/pages/-faculty/ken.french/data_library.html) as well as 10-K reports.
Measures
Firm risk
Based on previous research (Bharadwaj, Tuli, and Bonfrer 2011; Ferreira and Laux 2007; Luo and Bhattacharya 2009), we measured firm-idiosyncratic risk as the volatility in firm’s stock return after accounting for general stock market movements. We calculated risk using daily stock returns obtained from the CRSP database. We then linked these stock returns with daily FF4 factors from French’s personal website for every trading day. The four-factor model (Carhart 1997) suggests that a firm’s daily stock return (ri,d ) is a composition of (1) the market return factor (Rmkt – Rrf ), (2) the return difference in large and small stocks factor (Rd SMB ), (3) the difference in returns of high and low book-to-market stocks factor (Rd HML ), and (4) the momentum factor (Rd UMD ), along with an idiosyncratic residual (ui,d ). The model’s residual (ui,d ) measures idiosyncratic excess return not accounted for by general market movements (Ang et al. 2006; Cao, Simin, and Zhao 2008). The FF4 model is as follows:

where, α i is the intercept and ui,d = ρui,d−1 + δ i,d . δ i,d is assumed to be a normal random variable with mean 0 and variance of σδ 2, which helps Equation 1 control for serial correlation through its error term (Luo and Bhattacharya 2009).
Firm-idiosyncratic risk is calculated as the variance of the residuals, 1/n × (Σ n d = 1 ui,d 2 ), from Equation 1, scaled relative to total firm risk: 1 – Rit 2 (Luo, Kanuri, and Andrews 2014). Rit 2 is the coefficient of determination from Equation 1. Consistent with previous research (Luo, Kanuri, and Andrews 2014), we then conducted a logistic transformation to obtain the final measure of firm risk, which helps comparison across industries:

Service transition
We operationalized firm service transition using the Fang, Palmatier, and Steenkamp (2008) equation, which calculates service transition as the ratio of service revenue to total revenue for firm i in year t. We used COMPUSTAT and individual firm end-of-year financial reports (10-K) to determine total firm revenue and service revenue, done through an itemized investigation of firm income statements and different revenue earning segments. Specifically, we looked at yearly 10-K reports to determine revenue directly linked to services or not tied to products sales. 2 While accounting information for services are more standard in the recent years, it is still a voluntary disclosure by the firm (Fang, Palmatier, and Steenkamp 2008); therefore, our sample includes only those firms that reported service revenue between 2006 and 2011.
R&D intensity and service relatedness
Based on past research (Chi, Nystrom, and Kircher 2004), we operationalized R&D intensity as the ratio of R&D expenses to total revenue for firm i in year t. We obtained data for this measure from COMPUSTAT. Service relatedness involves the degree of closeness between the service offerings and the firm’s core goods offering. Consistent with the Fang, Palmatier, and Steenkamp (2008) approach, 3 we used expert judges to construct our measure. Anchoring on the firm’s primary four digit SIC code and individual firm 10-K reports, three judges with extensive industry experience independently assessed each firm’s identified product and service segment as either related (similar) or unrelated to the core four-digit description of the firm. As an illustration of the coding protocol, if a firm reported its service revenue from four segments of primary operations, with three in the firm’s core goods category, the firm’s service relatedness score was .75. Interrater reliability was high (>.96) with only three different scores reported by our expert judges. The research team, in coordination with the judges, reconciled those differences.
Marketing intensity and resource slack
Marketing intensity refers to the level of financial resources a firm devotes to marketing programs, which we measured as the ratio of SGA expenses to total assets for firm i in year t (Dutta, Narasimhan, and Rajiv 1999). We adapted our measures of resource slack from previous research (George 2005; Lee and Grewal 2004). We calculated unabsorbed resource slack using factor scores calculated from a principal components analysis of two financial ratios: (1) retained earnings to total assets and (2) working capital to total assets (Lee and Grewal 2004). Absorbed slack refers to the amount of resources tied to existing operations (George 2005), which given our context of B2B manufacturing firms, we operationalized as the ratio of total inventory to cash for firm i in year t. This allowed us to capture the amount of financial, freely disposable resources the firm has committed to functions that are not easily transferrable or flexible but are also integral to their strategic operations. We obtained data for these measures from COMPUSTAT.
Control variables
Our control variables reflect three factors that might influence firm risk in addition to the prime independent variables. Specifically, it is possible that (1) specific firm effects, (2) industry-level conditions, and (3) macro-level market conditions substantially influence firm risk and need to be accounted for before developing a service transition baseline. To address the possible confounding effects of these factors, we included six control variables in our analysis.
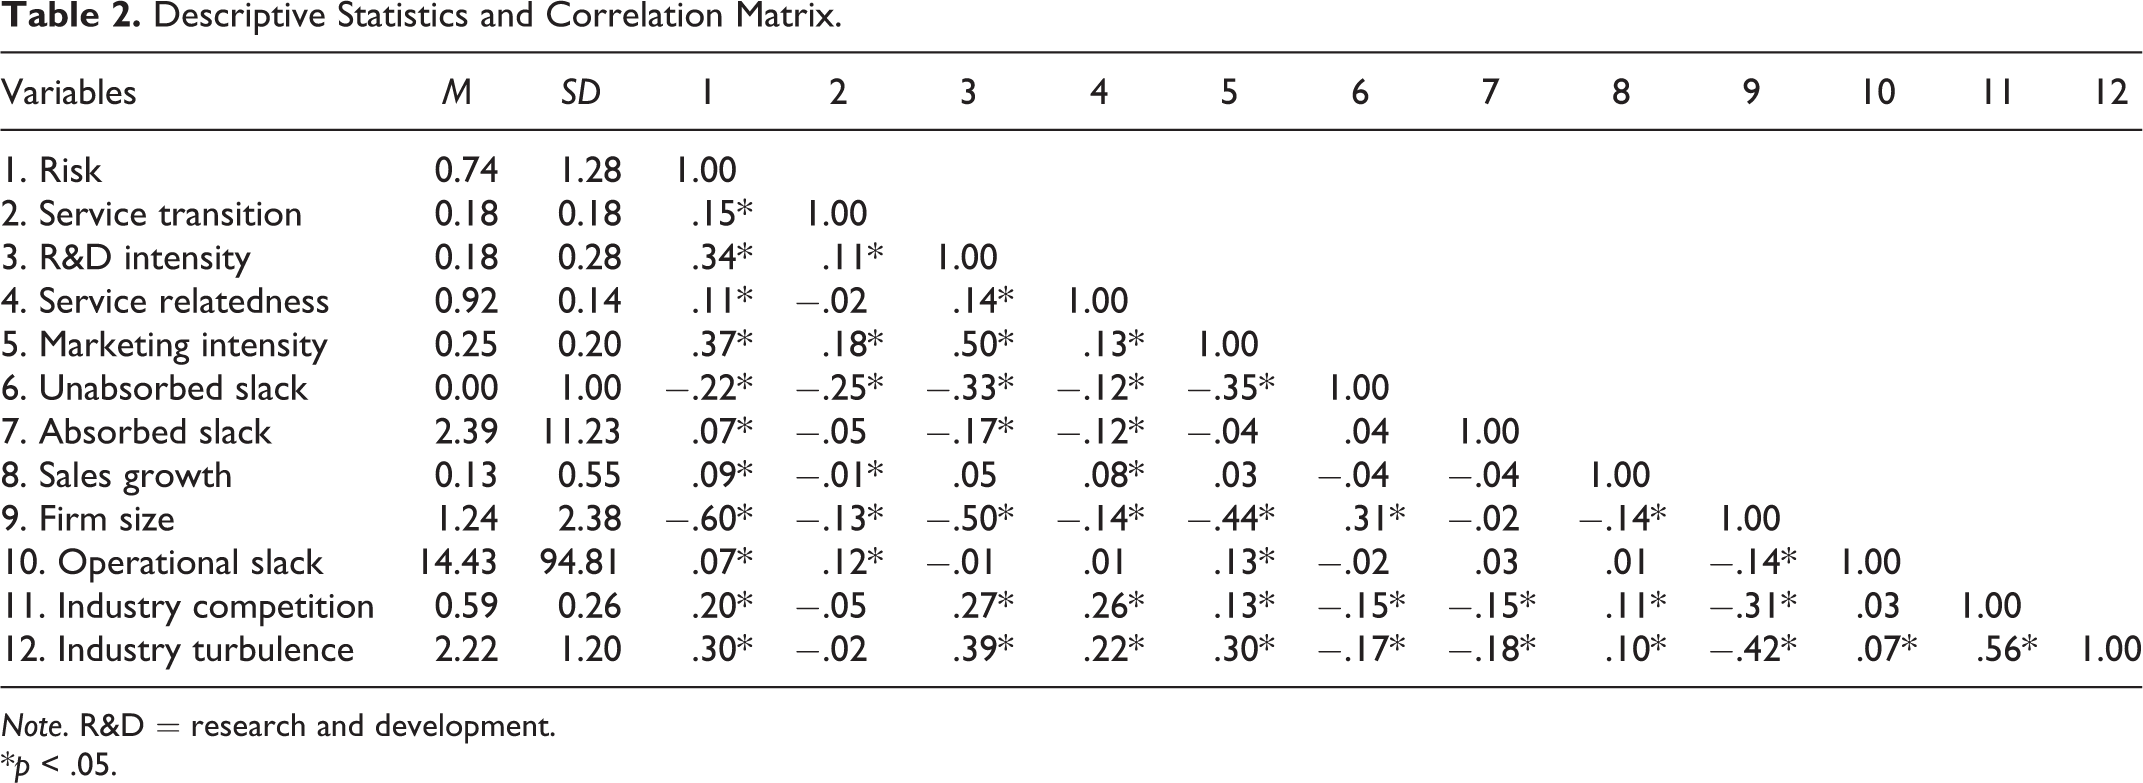
First, risk could vary simply because of yearly revenue changes not because of the service transition itself. We control for this effect with a yearly revenue growth measure. Second, we controlled for firm size. Larger firms generally have more resources, more diversification, and potentially lower levels of risk. We controlled for firm size using the log transformation of the number of employees. Third, we controlled for differences in operations and manufacturing through the ratio of yearly revenue to plant, property, and other assets (Hendricks, Singhal, and Zhang 2009). Fourth, we used two measures to account for industry effects: industry competition and industry turbulence. We used the Herfindahl index to measure industry competition. Each firm had its market share value in its primary industry squared, based on its four-digit SIC code. We summed the values over all firms in that industry and subtracted this value from 1 to determine the level of industry competition. We calculated industry turbulence as the standard deviation of total revenue in each firm’s industry, based on four-digit SIC codes, for the prior 4 years, divided by the mean revenue over the same time period. Finally, there could be period effects due to yearly macroeconomic conditions, which we control for with yearly fixed effects (year dummies). An advantage of using yearly dummy variables is that they account for the most possible period variance. Table 1 provides details of all measures used in the study. Table 2 summarizes the descriptive statistics and correlations for the measures.
Variable Definitions.

Note. R&D = research and development; SGA = sales and general administrative expenses.
Descriptive Statistics and Correlation Matrix.
Note. R&D = research and development.
*p < .05.
Model Development
Our data structure (multiple firms with multiple observations over multiple years) required the use of panel methods over traditional time series or ordinary least squares (Hox 2010). Further, because our data were nested, observations within firms and firms grouped in specific industries, we used a multilevel panel design (Hox 2010).
We tested the appropriateness of a multilevel modeling approach by measuring the amount of variance accounted for by higher level nesting effects. Industry-level effects account for 21% of the variance supporting a multilevel approach (Hox 2010). The multilevel model with a panel structure also allowed us to maintain a fixed-effects approach with firm-level variables (Level 1) while controlling for time-invariant random-effects factors (industry and year-effects) with unbalanced panels (Rabe-Hesketh and Skrondal 2012). Our analysis focused on repeated-measure, firm-level predictors hypothesized to vary within industry-level segments. Therefore, it was essential to evaluate idiosyncratic risk at the firm level separated by individual industries. This also removed any small sample size distortions (Hox 2010; Martin et al. 2007).
We also investigated several panel design issues that could bias our model. First, firm-idiosyncratic risk is potentially sensitive to nonstationarity, so we used a Fisher-type unit root test (augmented Dickey-Fuller Test). The results (inverse χ2 = 315.66, p < .01) indicated that risk was stationary over time. Second, we investigated serial correlation in risk using a Wooldridge (2002) serial correlation test. We found a significant test statistic (F = 46.13, p < .01), which required additional controls be included in the model. We controlled for serial correlation using a one-period lag of firm risk as well as with robust treatment of the error structure. The unbalanced nature of our data along with our lagged dependent variable resulted in a final empirical sample of 714 observations for 168 firms.
Results
Table 3 provides the results of our hypotheses testing. In support of our overall premise, we found that service transition has a significant and substantial positive impact on firm risk (γ = .55, p < .01). Increasing service transition appears to affect the market’s assessment of a firm’s future revenue. In terms of our hypotheses, Hypothesis 1 predicted that R&D intensity mitigates (i.e., reduces) risk resulting from service transition. The significant negative interaction between R&D intensity and service transition (γ = −2.06, p < .01) indicates support for Hypothesis 1. As shown in Panel A in Figure 2, greater R&D intensity mitigates the relationship between risk and service transition, whereas reduced R&D intensity enhances the effect. Likewise, Hypothesis 2 stated that service relatedness moderates the relationship between service transition and firm risk. The parameter estimate for the interaction of service relatedness and service transition on firm risk shows support for Hypothesis 2 (γ = −3.02, p < .05). As shown in Panel B in Figure 2, greater service relatedness mitigates the service transition-risk relationship, whereas it was exacerbated by service that stray away from the core offering identity of the firm.
Panel Analysis Results: Effect of Service Transition on Firm-Idiosyncratic Risk.

Notes. Level 3 (two-digit SIC code): n = 15; Level 2 (unique firms): n = 168.
All tests are reported at two-tailed levels: *p ≤ .05. **p ≤ .01.
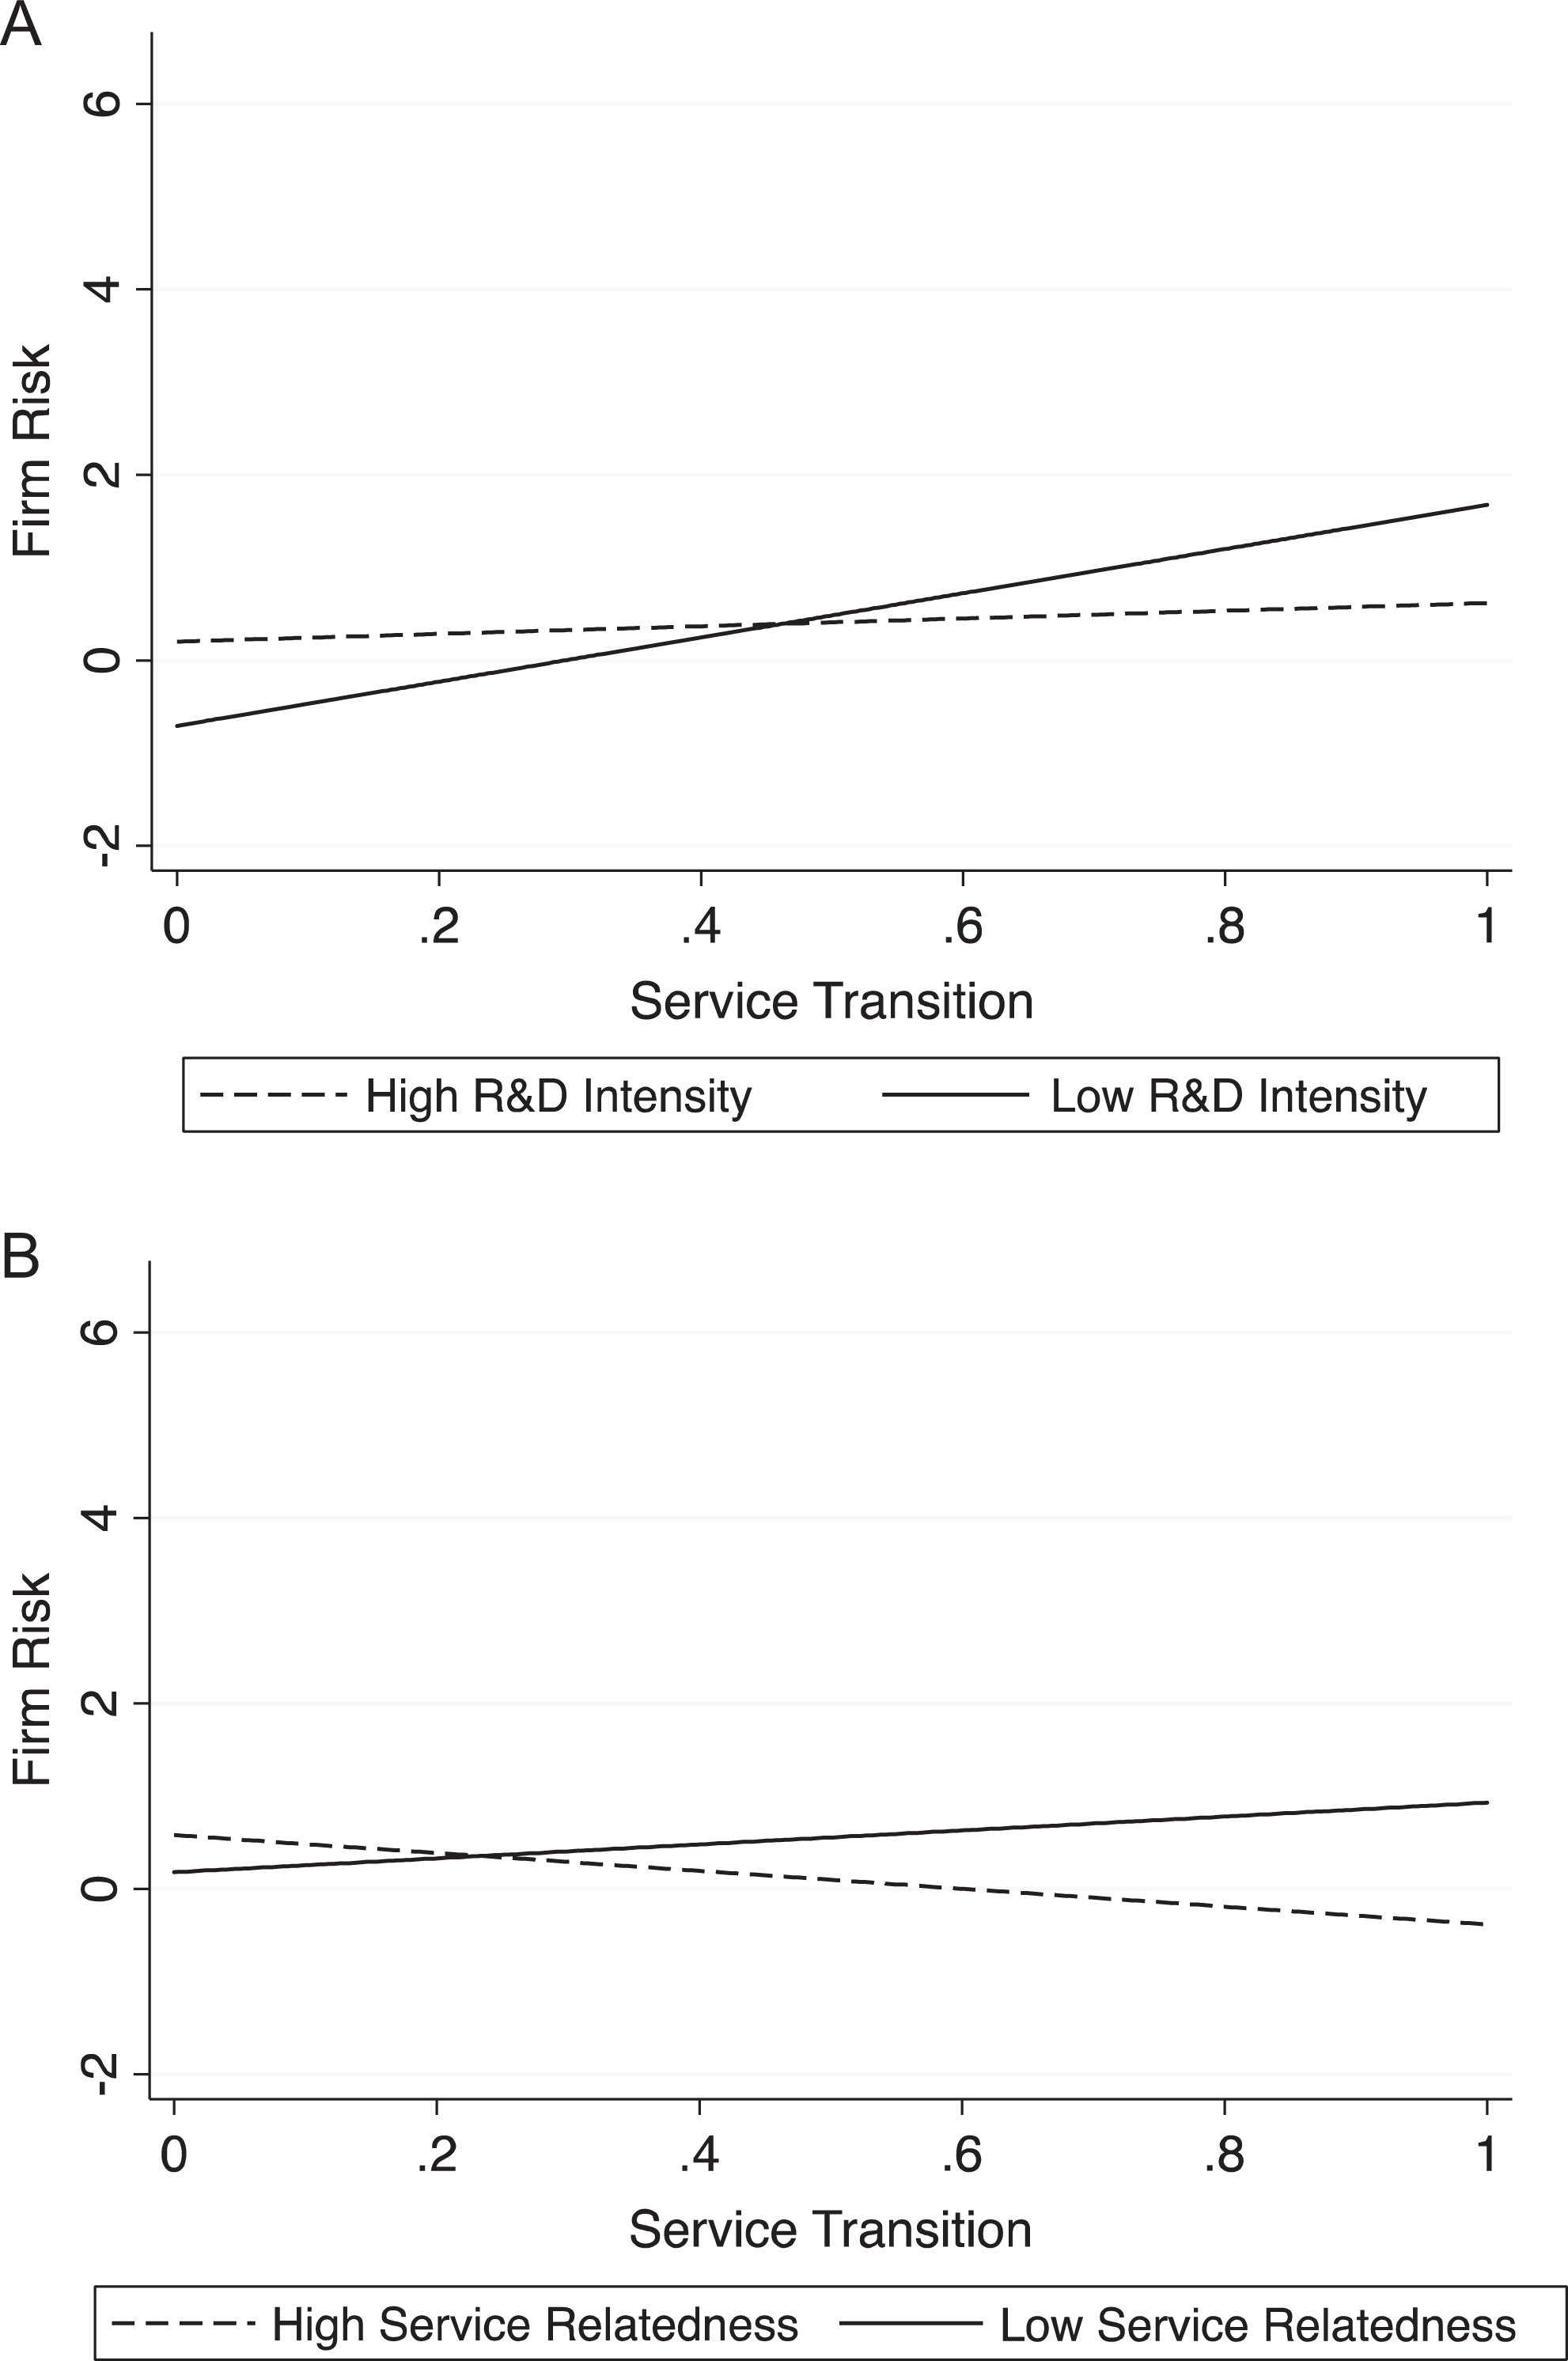
Strategic coherence moderation graphs. Panel A: R&D intensity moderation. Panel B: Service relatedness moderation.
Our second set of moderators (Hypotheses 3 and 4) examined the impact of a firm’s resource support in the service transition-risk relationship. Hypothesis 3 predicted that increasing marketing intensity mitigates risk resulting from service transition. Our results revealed a significant interaction between marketing intensity and service transition (γ = 3.18, p < .01); however, the sign was counter to our expectations. Rather than mitigating risk concerns, it appears that marketing intensity amplifies them. We offer suggestions for why this effect may occur in the discussion section. Panel A in Figure 3 shows the nature of the interaction. Hypothesis 4a stated that unabsorbed slack further increases risk resulting from service transition. Our results show a significant positive interaction between service transition and unabsorbed slack (γ = .49, p < .05), supporting our hypothesis. Panel B in Figure 3 indicates that firms holding more unabsorbed slack had increased risk from transitioning to service, whereas for firms holding less unabsorbed slack, risk was reduced. Hypothesis 4b predicted that absorbed resource slack would also increase risk associated with service transition. Our results fail to show a statistically significant parameter estimate for the interaction between absorbed slack and service transition (γ = .05, p > .10).
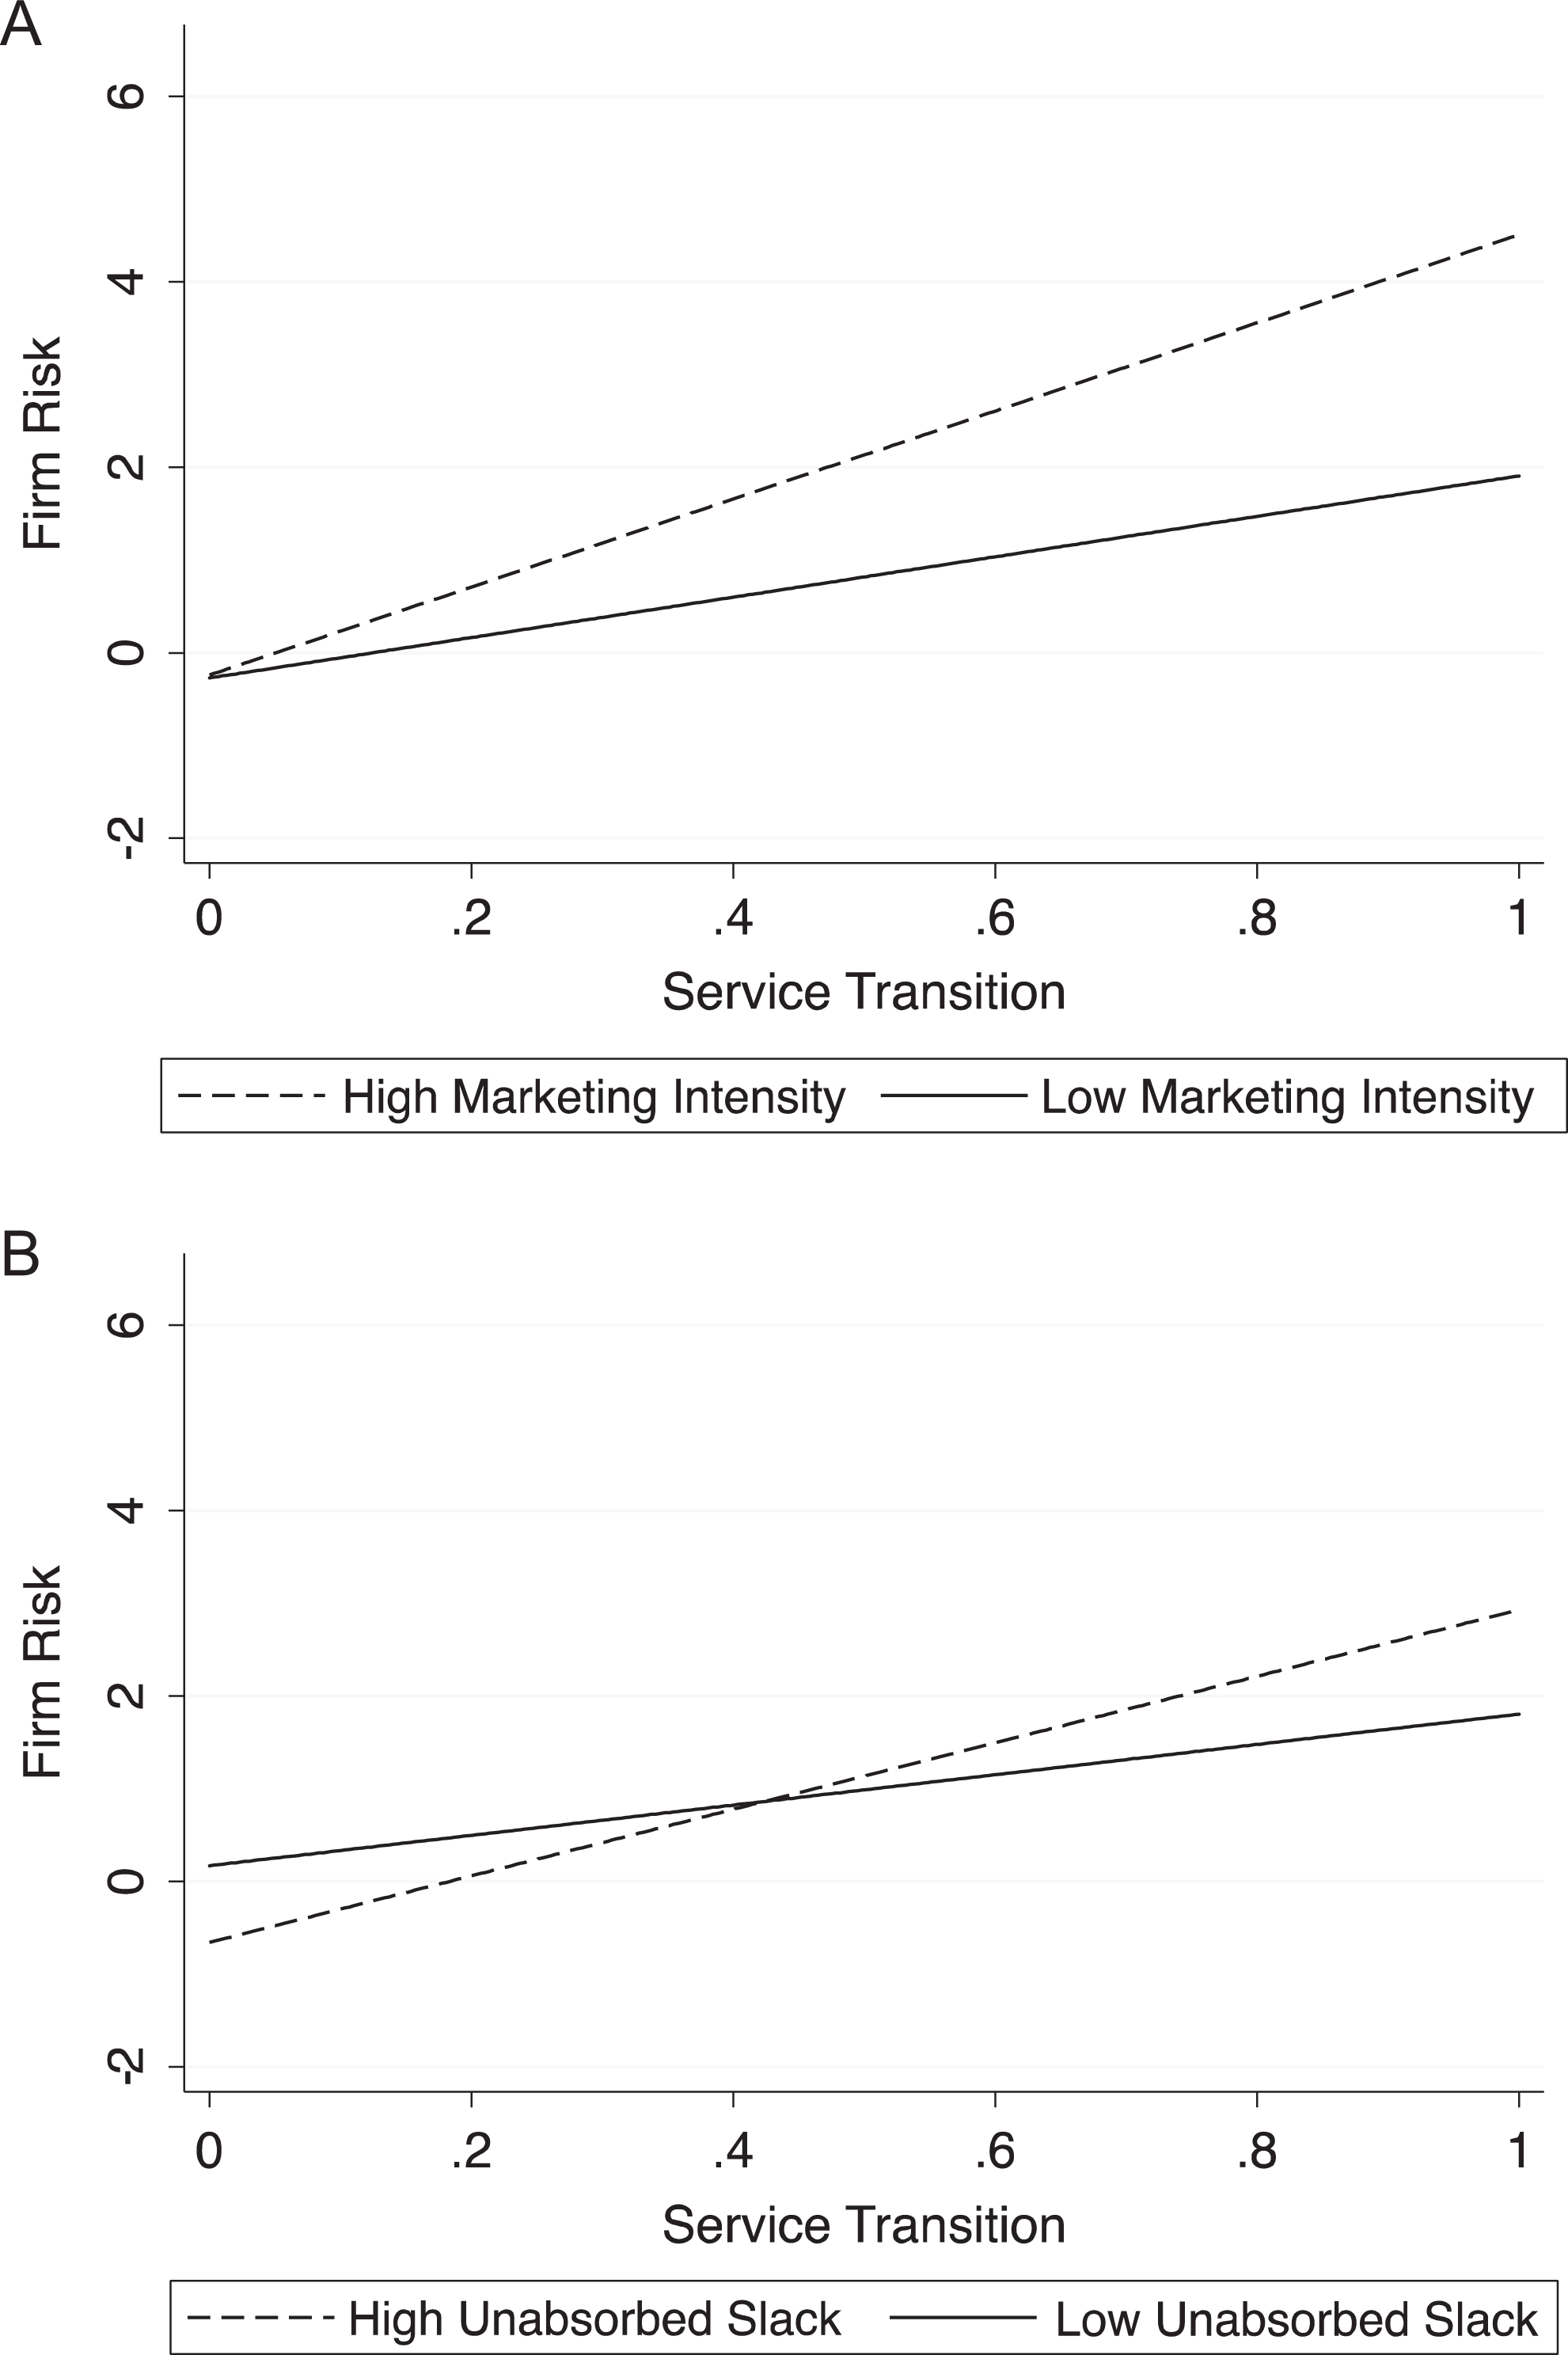
Resource portfolio moderation graphs. Panel A: marketing intensity moderation. Panel B: Unabsorbed resource slack moderation.
Robustness and Additional Analysis
To validate our results, we tested the robustness of our findings in two distinct ways. First, to show the methodological rigor of our results, we used another panel estimation technique. Instead of a multilevel nested panel analysis, we used regular panel regression with industry dummies included in the model. The results, shown in Table 4, mirrored those found by the multilevel technique in terms of both direction and statistical significance.
Methodological Robustness Check.

Note. R&D = research and development.
All tests are reported at two-tailed levels: *p ≤ .05. **p ≤ .01.
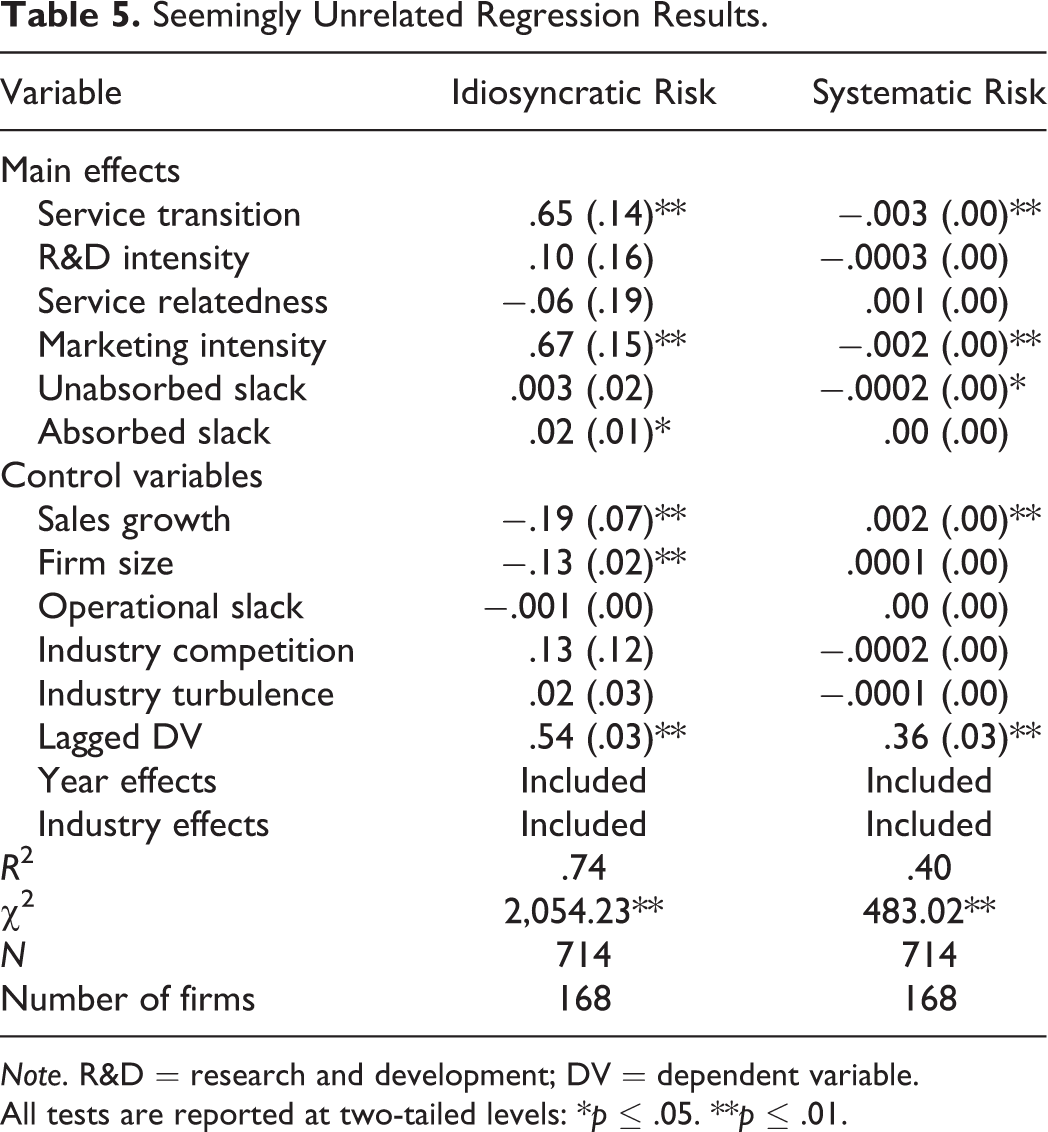
Second, to demonstrate the effect of service transition on stock return variation, we examined systematic risk as a dependent variable. Systematic risk is the beta value for the MKT variable in the Carhart four-factor model used to determine idiosyncratic risk (Dotzel, Shankar, and Berry 2013). We tested the effect of service transition on systematic risk using the same data set. However, in light of the fact that we used the same equation to calculate systematic and idiosyncratic risk, the corresponding errors could be correlated (Dotzel, Shankar, and Berry 2013). Therefore, we used a system of equations approach to deal with any potential correlation (Dotzel, Shankar, and Berry 2013). Table 5 shows our results. We found that service transition produced a significant negative effect on systematic risk (γ = −.003, p < .01), further demonstrating the strong impact service transition has on a firm’s stock return and its variation.
Seemingly Unrelated Regression Results.
Note. R&D = research and development; DV = dependent variable.
All tests are reported at two-tailed levels: *p ≤ .05. **p ≤ .01.
Discussion
A major threat in the contemporary competitive landscape is commoditization, the convergence and homogenization of goods characteristics and attributes (D’Aveni 2010; Antioco et al. 2008). Firms can battle commoditization by migrating their offering toward a combination of goods and services (Vargo and Lusch 2004a, 2004b). The infusion of services, often called service transition, creates advantages (Fang, Palmatier, and Steenkamp 2008) but also entails a shift in strategic focus (e.g., Chakravarty and Grewal 2011), affecting stock volatility and firm risk (Luo and Bhattacharya 2009). Therefore, we explored the effect of service transition on firm-idiosyncratic risk. Using BTF and signaling theory, we investigated how a firm’s strategic coherence (R&D intensity and service relatedness) and resource allocation (marketing intensity and resource slack) influenced the service transition-risk relationship.
Results supported our notion that the signal sent by service transition influences the market assessments of a firm’s expected revenue generation. Specifically, we found that service transition increased firm risk. This effect was consistent with our premise that the market has concerns over the transition emanating from fears regarding potential loss of strategic focus, resource constraints, and internal conflict. However, this relationship varied by firm context.
First, a continual commitment to innovation mitigates the service transition-risk relationship, ameliorating risk. R&D intensity complements service transition, sending a signal that alleviates apprehension and generates goodwill, thus reducing risk. Second, services highly related to the firm’s core identity demonstrate a firm’s commitment to its primary competencies, lessening market concerns and hesitations, thereby reducing risk.
Contrary to our expectation, however, we found that marketing intensity amplified the service transition-risk relationship. One possible explanation for this finding could involve perceptions of the marketing function in the firm. Marketing intensity is the firm’s ability to communicate to, and exchange with, the external environment (Anderson 1982). If the environment is already interpreting service transition with apprehension, marketing intensity may exacerbate feelings of confusion and misgiving. It might signal failings or difficulties with the transition that the firm is trying to cover or compensate for. Another explanation comes from our use of SGA, largely a sales-based proxy for marketing intensity. Research has shown the sales department to be risk averse and reluctant to champion new initiatives, products, and opportunities (Ahearne et al. 2010). It could be that market has concerns over whether the sales department will accept the service transition or wish to remain focused on its primary goods-based offering. These factors may exacerbate the impact of service transition on risk by increasing internal firm conflict. Alternatively, the alignment of marketing intensity efforts may not have been toward the service transition (Bolton, Grewal, and Levy 2007). If a firm intensifies goods-centric marketing and neglects support of service transition (Fang, Palmatier, and Steenkamp 2008), it would likely further market confusion.
Finally, our findings reveal the importance of resource portfolios for service transition. Unabsorbed resource slack, the amount of excess resources available for redeployment, exacerbates the service transition-risk relationship. Unabsorbed slack should be reinvested back into exploration activities or it should be redistributed out to shareholders. In terms of absorbed slack, we failed to find any significant moderation. For instance, firms may add services to improve customer retention (Neu and Brown 2005), or environmental sustainability (Wunderlich et al. 2003), among others, which may bring desirable outcomes apart from stock market implications.
Theoretical Implications
Our findings have several implications for strategy and service research. First, strategic actions have financial consequences that scholars often do not consider. By investigating risk, we extend understanding of firm financial performance and provide a more holistic picture of how critical strategic action, service transition, shape firm financial fortunes (see Anderson 2006). Moreover, we show that service transition produces a signal of inherent firm quality and intent that the market responds to with apprehension or goodwill, influencing firm risk. Importantly, in regard to this signal, we theorize that service transition differs from other strategic action, such as brand, customer relationship, and innovation strategies. This discrepancy extends theory by demonstrating that strategic actions differ in their underpinnings and influences and thus warrant individual investigation.
In addition, we contribute to understanding of service transition specifically in two ways. First, we provide a unified theoretical foundation for understanding service transition. Viewing service transition through BTF and signaling theory improves our ability to conceptualize its antecedents and consequences as well as formulate novel theory concerning its underlying mechanisms (coalitions, goal directives, learning, etc.). In addition, the integration of two theories represents a novel contribution and an advancement of knowledge concerning both theories (Corley and Gioia 2011). Second, we expand the theoretical boundaries and understanding of service transition by uncovering key internal mechanisms, as well as critical firm-level context effects. We demonstrate the interplay of service transition with R&D intensity, service relatedness, marketing intensity, and unabsorbed resource slack. Thus, we integrate service transition with other key theoretical perspectives and constructs.
Managerial Implications
Our study offers several implications for managers. First, our finding that service transition influences the consistency and longevity of projected sales revenue suggest that managers cannot focus exclusively on the size of immediate returns when judging performance (Aaker and Jacobson 1987). Being cognizant of risk as well as return allows managers to make the best long-term decisions that result in the largest possible return with the least amount of inherent risk. Second, our findings suggest that managers must consider carefully their key firm characteristics when deciding their overall strategic trajectory. Specifically, we confirm that maintaining a strong R&D focus is essential in B2B (e.g., Griffin et al. 2013) even while transitioning to services. Firms cannot afford to lose their exploratory capabilities, especially as the environment presses for commoditization. This ensures a competitive offering and the full use of traditional core manufacturing competencies. Managers should be strong advocates for creating innovative goods even while introducing services. Additionally, when designing their service offerings, managers must strive for congruency between their augmentations and their existing offering portfolios. Failure to do so creates significant market apprehension.
Third, our results help resource planning activities. Service transition requires the appropriate tools to assuage market apprehension and misgivings. Managers must use their marketing capabilities strategically to ensure that firm communication lessens market concerns and misgivings. Marketing messages should focus on services that remain closely tied to the firm’s identity, mentioning how services support existing goods and improve a customer’s experience with the firm’s offering. Additionally, managers must carefully monitor resource availability when strategizing and transitioning to services.
Limitations and Future Research
In terms of limitations, our sample contained only firms reporting service revenue. This limits the generalizability of our results. Further, our sample used 6 years of data. Future research could consider exploring these effects over longer time horizon to determine if the effect is consistent over a longer time horizon. In addition, we focused on stock market-based financial implications for service transition but that might miss other important performance outcomes. Researchers could explore other financial performance metrics, such as bond ratings to see how service transition affects the credit worthiness of a firm. We also only used U.S. firms. Future research could explore service transition from an international or cross-cultural context, as other national cultures and economies might result in a different service transition-risk relationship. In addition, secondary data have limitations in construct measurement. We relied on the Fang, Palmatier, and Steenkamp (2008) measurement for service transition. A more nuanced measurement approach could possibly uncover important underpinnings of the transition not captured by a secondary measure (Eggert et al. 2014).
Additionally, there may be moderating factors that could significantly affect the observed relationships. As advocated by Anderson (2006), future research could explore service transition’s interaction with other functional areas of the firm, like human resources or manufacturing in more detail. Finally, research could explore the role of marketing intensity and the types of marketing that work best in connection with service transition. Future research could also explore additional proxies and a more refined measure of marketing intensity.
Footnotes
Declaration of Conflicting Interests
The author(s) declared no potential conflicts of interest with respect to the research, authorship, and/or publication of this article.
Funding
The author(s) received no financial support for the research, authorship, and/or publication of this article.
Notes
References
Supplementary Material
Please find the following supplemental material available below.
For Open Access articles published under a Creative Commons License, all supplemental material carries the same license as the article it is associated with.
For non-Open Access articles published, all supplemental material carries a non-exclusive license, and permission requests for re-use of supplemental material or any part of supplemental material shall be sent directly to the copyright owner as specified in the copyright notice associated with the article.
