
Abstract
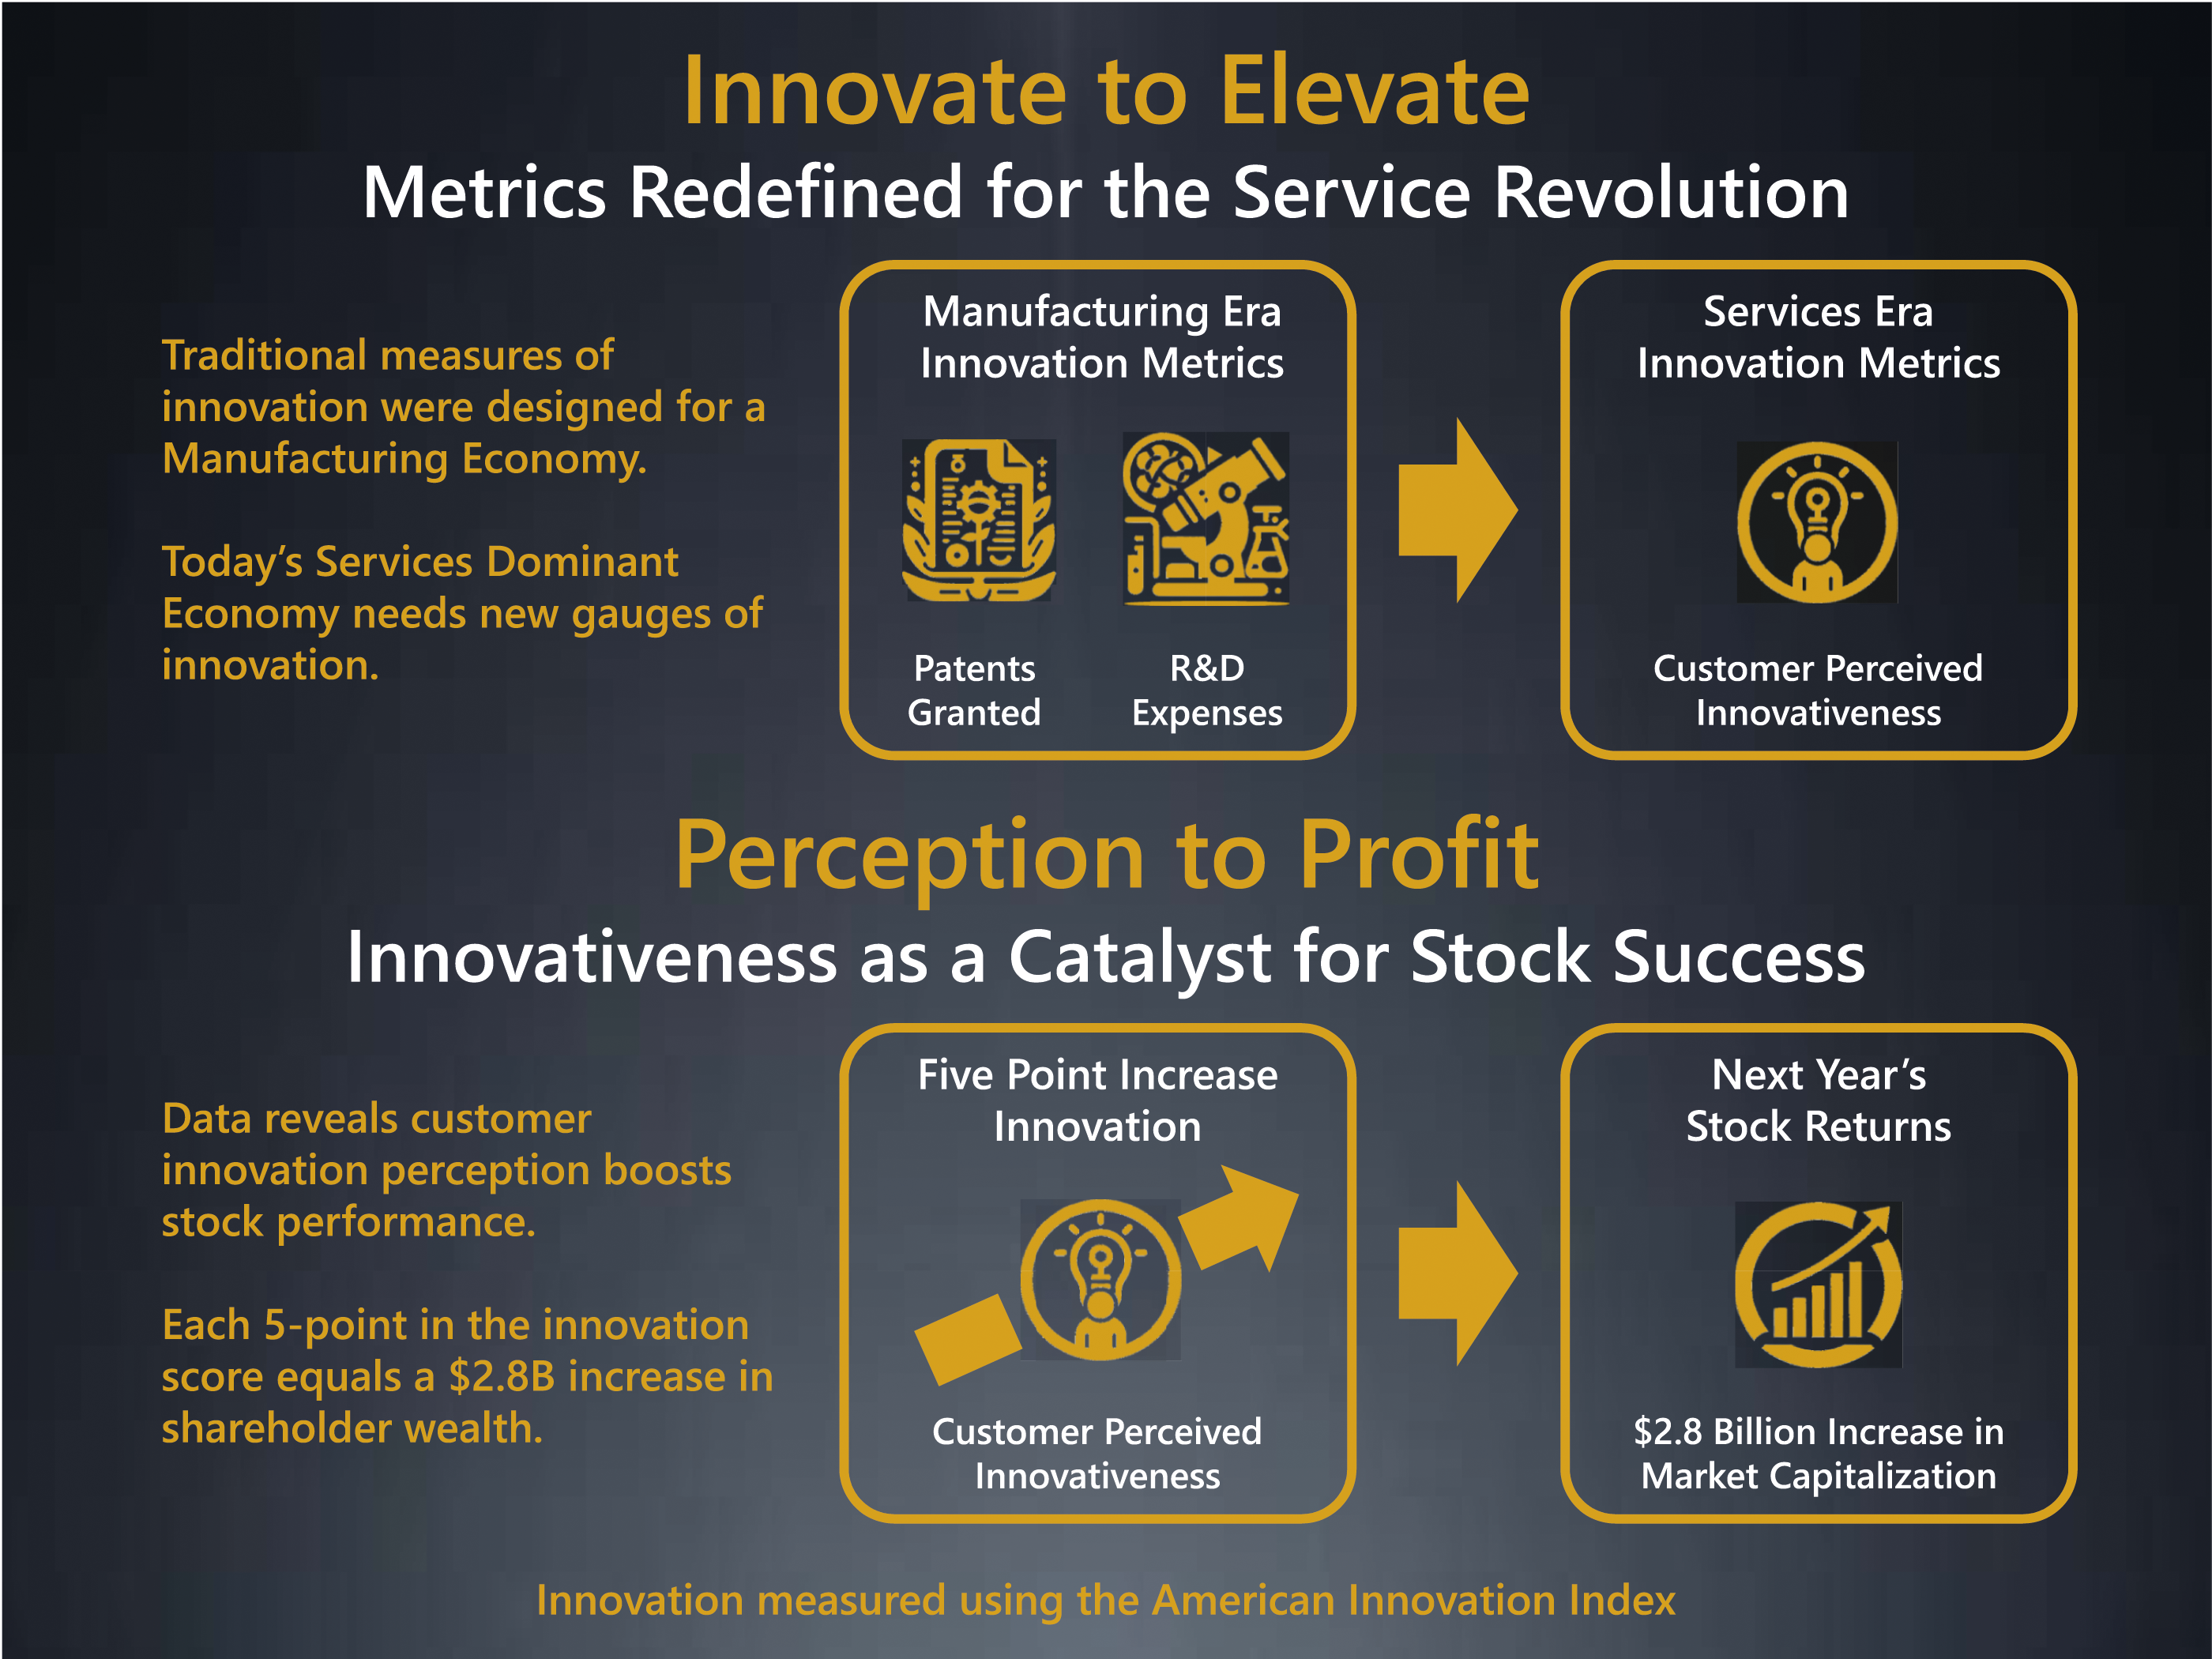
This paper highlights the importance of innovation in driving economic growth, noting that traditional measures of innovation have focused mainly on manufacturing-related metrics like patents and R&D activities. It addresses the need for new measures that better reflect innovation in service-dominant economies. Specifically, the study highlights nation-level measures of customer perceived firm innovativeness and examines their relationship with firm financial performance. Using data from the American Innovation Index covering 123 publicly traded firms across 20 industries over 5 years (2018–2022), the research finds that customers’ perceptions of a firm’s innovativeness are significant predictors of future abnormal stock returns. Additionally, it reveals a positive relationship between changes in customer satisfaction levels, as measured by the American Customer Satisfaction Index, and abnormal stock returns. Together, these findings point to the importance of customer perceptions on firm performance.
Keywords
Adapt or die! Charles Darwin’s landmark book, On the Origin of Species, showed that a species’ survival depended upon its ability to adapt to a changing environment (Darwin 1859). This truth applies equally well to business enterprises. For firms, however, there are two important differences: (1) the current pace of environmental change is measured using very short time frames (years, months—sometimes even weeks or days), and innovation (as opposed to random genetic mutations) is the mechanism for adaptation. Innovation generates new or enhanced “wealth-producing resources” (Drucker 2002, p. 95) and is the catalyst for competitive advantage (Porter 1985).
Innovation is one of the most important challenges for CEOs (Capozzi, Gregg, and Howe 2010; PwC 2017). It is also one of the most widely researched topics across business disciplines (Gök and Peker 2017). Research on innovation to date, however, is almost entirely firm-centric, that is, the focus is on organizational factors (Kurtmollaiev, Lervik-Olsen, and Andreassen 2022, p. 88). Service research, however, argues that value creation—and therefore the ultimate success of an innovation—requires customer interaction and acceptance, not simply invention (Vargo and Lusch 2004). As a result, there have been calls for new approaches to measuring innovation (e.g., Gustafsson, Snyder, and Witell 2020) that recognize that the ultimate success of most firm innovations rests on customer (not manager) assessments (Kunz, Schmitt, and Meyer 2011; Kurtmollaiev, Lervik-Olsen, and Andreassen 2022).
Recently, several university-affiliated national barometers of customer perceived firm innovativeness have been created (e.g., Norwegian Innovation Index, American Innovation Index, Spanish Innovation Index, Swedish Innovation Index, Finnish Innovation Index, etc.). The overriding argument supporting the business need for these indices is that customer perceived innovativeness improves the attractiveness of firms to consumers (Kurtmollaiev, Lervik-Olsen, and Andreassen 2022). This increased attractiveness leads to improved market performance via improved customer loyalty (NII 2021). The link between customer perceived firm innovativeness and market performance, however, has not been empirically proved. This research addresses this critical need.
Based on a broad-industry, nation-level analysis of the American Innovation Index (Aii) data spanning a period of 5 years (2018–2022), encompassing 123 publicly traded firms across 20 industries, this research reveals that customer perceptions of firm innovativeness, as gauged by the American Innovation Index (Aii), exhibits a significant positive association with abnormal stock returns. The economic implications connected to this relationship are managerially relevant. Research indicates that for every five-point enhancement in a firm’s Aii level for the firms in this investigation, there is an associated average increase of $2.8 billion in shareholder wealth. 1 Furthermore, due to the wide spectrum of Aii scores, there exists a substantial potential for many firms to enhance their performance.
Our analysis also reveals that customer satisfaction levels, as gauged by the American Customer Satisfaction Index (ACSI), exhibit an additional positive, financially significant association with abnormal stock returns. Furthermore, the relationship between customer perceptions of innovation and customer satisfaction on abnormal returns persists even after accounting for potential confounding factors.
These findings have important implications for managers and researchers. Currently, very few firms measure and manage customers’ perceptions of their firms’ innovativeness. While most public companies measure customer perceptions of satisfaction and brand image (Aksoy 2013), the factors that customers use to gauge a firm’s innovativeness differ from those that impact their satisfaction or brand image levels (Kunz, Schmitt, and Meyer 2011). Moreover, there is little research available on the factors driving customer perceptions of innovativeness that managers can use to guide their efforts. As a result, there is a need for managers to begin measuring and managing customer perceptions of their innovativeness, and for researchers to investigate the generalizable and industry-specific factors that drive these perceptions.
Background
Innovation Measurement
Innovation is widely believed to be important to economic success. In fact, “economists view innovation as the main driver of productivity growth, which in turn is viewed as the main driver of economic growth” (Engemann 2021). Innovation measurement, however, has primarily focused on activities associated with industrial production. For example, governments, businesses, and academics track patents granted as a “standard measure of innovation” (LaBelle and Santacreu 2021). Other common measures include research and development, patent citations (i.e., citations to a patent from other granted patents), and royalty payments received from the use of patents (Stamborski and Santacreu 2018).
These and other similar production-based metrics are widely used to gauge firm/country innovation levels. For example, the Bloomberg Innovation Index gauges countries based upon production-related metrics such as manufacturing value add (i.e., the value of a country’s manufacturing output relative to its GDP), R&D, and patent activity to determine innovativeness.
Another widely used gauge of innovation is self-reports from managers and experts (e.g., individuals with industry expertise, professional experience, thought leadership, etc.). For example, the Community Innovation Survey—one of the most widely used data sources for measuring innovation in Europe—surveys managers in firms from throughout the European Union to get feedback on their R&D activities, innovation strategies, and the impact of innovation on firm performance (Eurostat 2018).
While there is clearly value in gauging firms’ production intensity, and managers’ perspectives on their firms’ innovativeness, these measures by their nature reflect a firm-centric view of innovation. Specifically, they are confined to firm activities and managerial perceptions. Moreover, the underlying metrics tracked are primarily designed for an industrial economy. As the World Economic Forum noted, “The move over the past 60 years from products to services to an increasingly experiential economy has changed the nature of research and development (R&D). Traditional measures of innovation, such as R&D investment and patents, were fine when innovation mostly occurred in large manufacturing firms, but are of limited value when much of the action lies in services, business models, and entrepreneurial start-ups” (Gann and Dodgson 2019).
Another issue with traditional metrics is that their focus tends to be on invention as opposed to innovation (Kurtmollaiev, Lervik-Olsen, and Andreassen 2022). Business inventions typically result from the creation of unique devices, processes, or ideas. As such, they provide the raw material for innovation. For an invention to be innovative, however, it must be useful (Boyles 2022). For many, if not most business inventions, the primary judges of what is useful are customers, not managers or experts.
A customer-centric view of innovation assessment aligns with current theories on value creation, which argue that value is created from firm-customer interaction (Grönroos 2017; Vargo and Lusch 2004). The literature regarding the customer-centric view, however, tends to be limited to satisfaction, not innovation. [For a review of firm-centric and customer-centric views of innovativeness, see Kurtmollaiev, Lervik-Olsen, and Andreassen 2022]. This has led to calls for new customer-centric measures of firm innovativeness (e.g., Kunz, Schmitt, and Meyer 2011; Keiningham et al. 2019).
The most visible response to this call has been the creation of nation-level customer-based innovation indices. The first such index occurred in Norway with the launch of the Norwegian Innovation Index (NII). [For a detailed review of the methodology of the NII, see Kurtmollaiev, Lervik-Olsen, and Andreassen 2023.] This has been followed by indices launched or planned in Australia, Belgium, Denmark, Finland, Spain, Sweden, and USA based on the NII methodology.
This research utilizes data from the American Innovation Index (Aii) in the USA. The Aii gauges the innovativeness of more than 150 U.S. companies across 20 industries based on customers’ perceptions. The Aii is derived from the NII framework. [For a detailed review of the methodology of the American Innovation Index, see Aii 2018.]
The Aii uses a nationally representative survey of over 7000 U.S. adults comprising over 30,000 customer relationships covering over 150 firms grouped into 20 industries. To gauge firm innovativeness, the Aii measures customers’ responses to four questions covering issues related to a firm being: (1) innovative, (2) creative, (3) changing the market with its products and services, and (4) being a category pioneer (Woodall et al., 2018). These scale items are derived from the work of Kunz, Schmitt, and Meyer (2011) and empirically validated via research by the NII (Kurtmollaiev, Lervik-Olsen, and Andreassen 2022; Kurtmollaiev, Lervik-Olsen, and Andreassen 2023). The index values are transformed to a 0-to-100-point scale.
For the 123 publicly traded firms in the dataset, scores ranged from a minimum of 39 to a maximum of 85.4, with a mean of 67.0, a median of 66.8, and a standard deviation of 7.2. As the very close values of the mean and median suggest, the distribution is approximately symmetric, with a skewness of −0.142 (see Figure 1); note, a skewness between −0.5 and 0.5 indicates that any departure from symmetry is typically small. While a visual inspection of the data appears similar to a normal distribution, two tests of normality—Kolmogorov-Smirnov and Shapiro-Wilk—yield conflicting results. The Kolmogorov-Smirnov test supports a normal distribution (p = .165; note that for p > .05, data are presumed to be normally distributed). The Shapiro-Wilk test, however, supports a non-normal distribution (p = .019). Because the Shapiro-Wilk test is considered more reliable in most situations, the Aii data should not be considered normally distributed despite its symmetry (Razali and Wah 2011). Nonetheless, the symmetry of the data has many statistical benefits, including simplified statistical analyses (Fornell 1992). Distribution of American innovation index scores.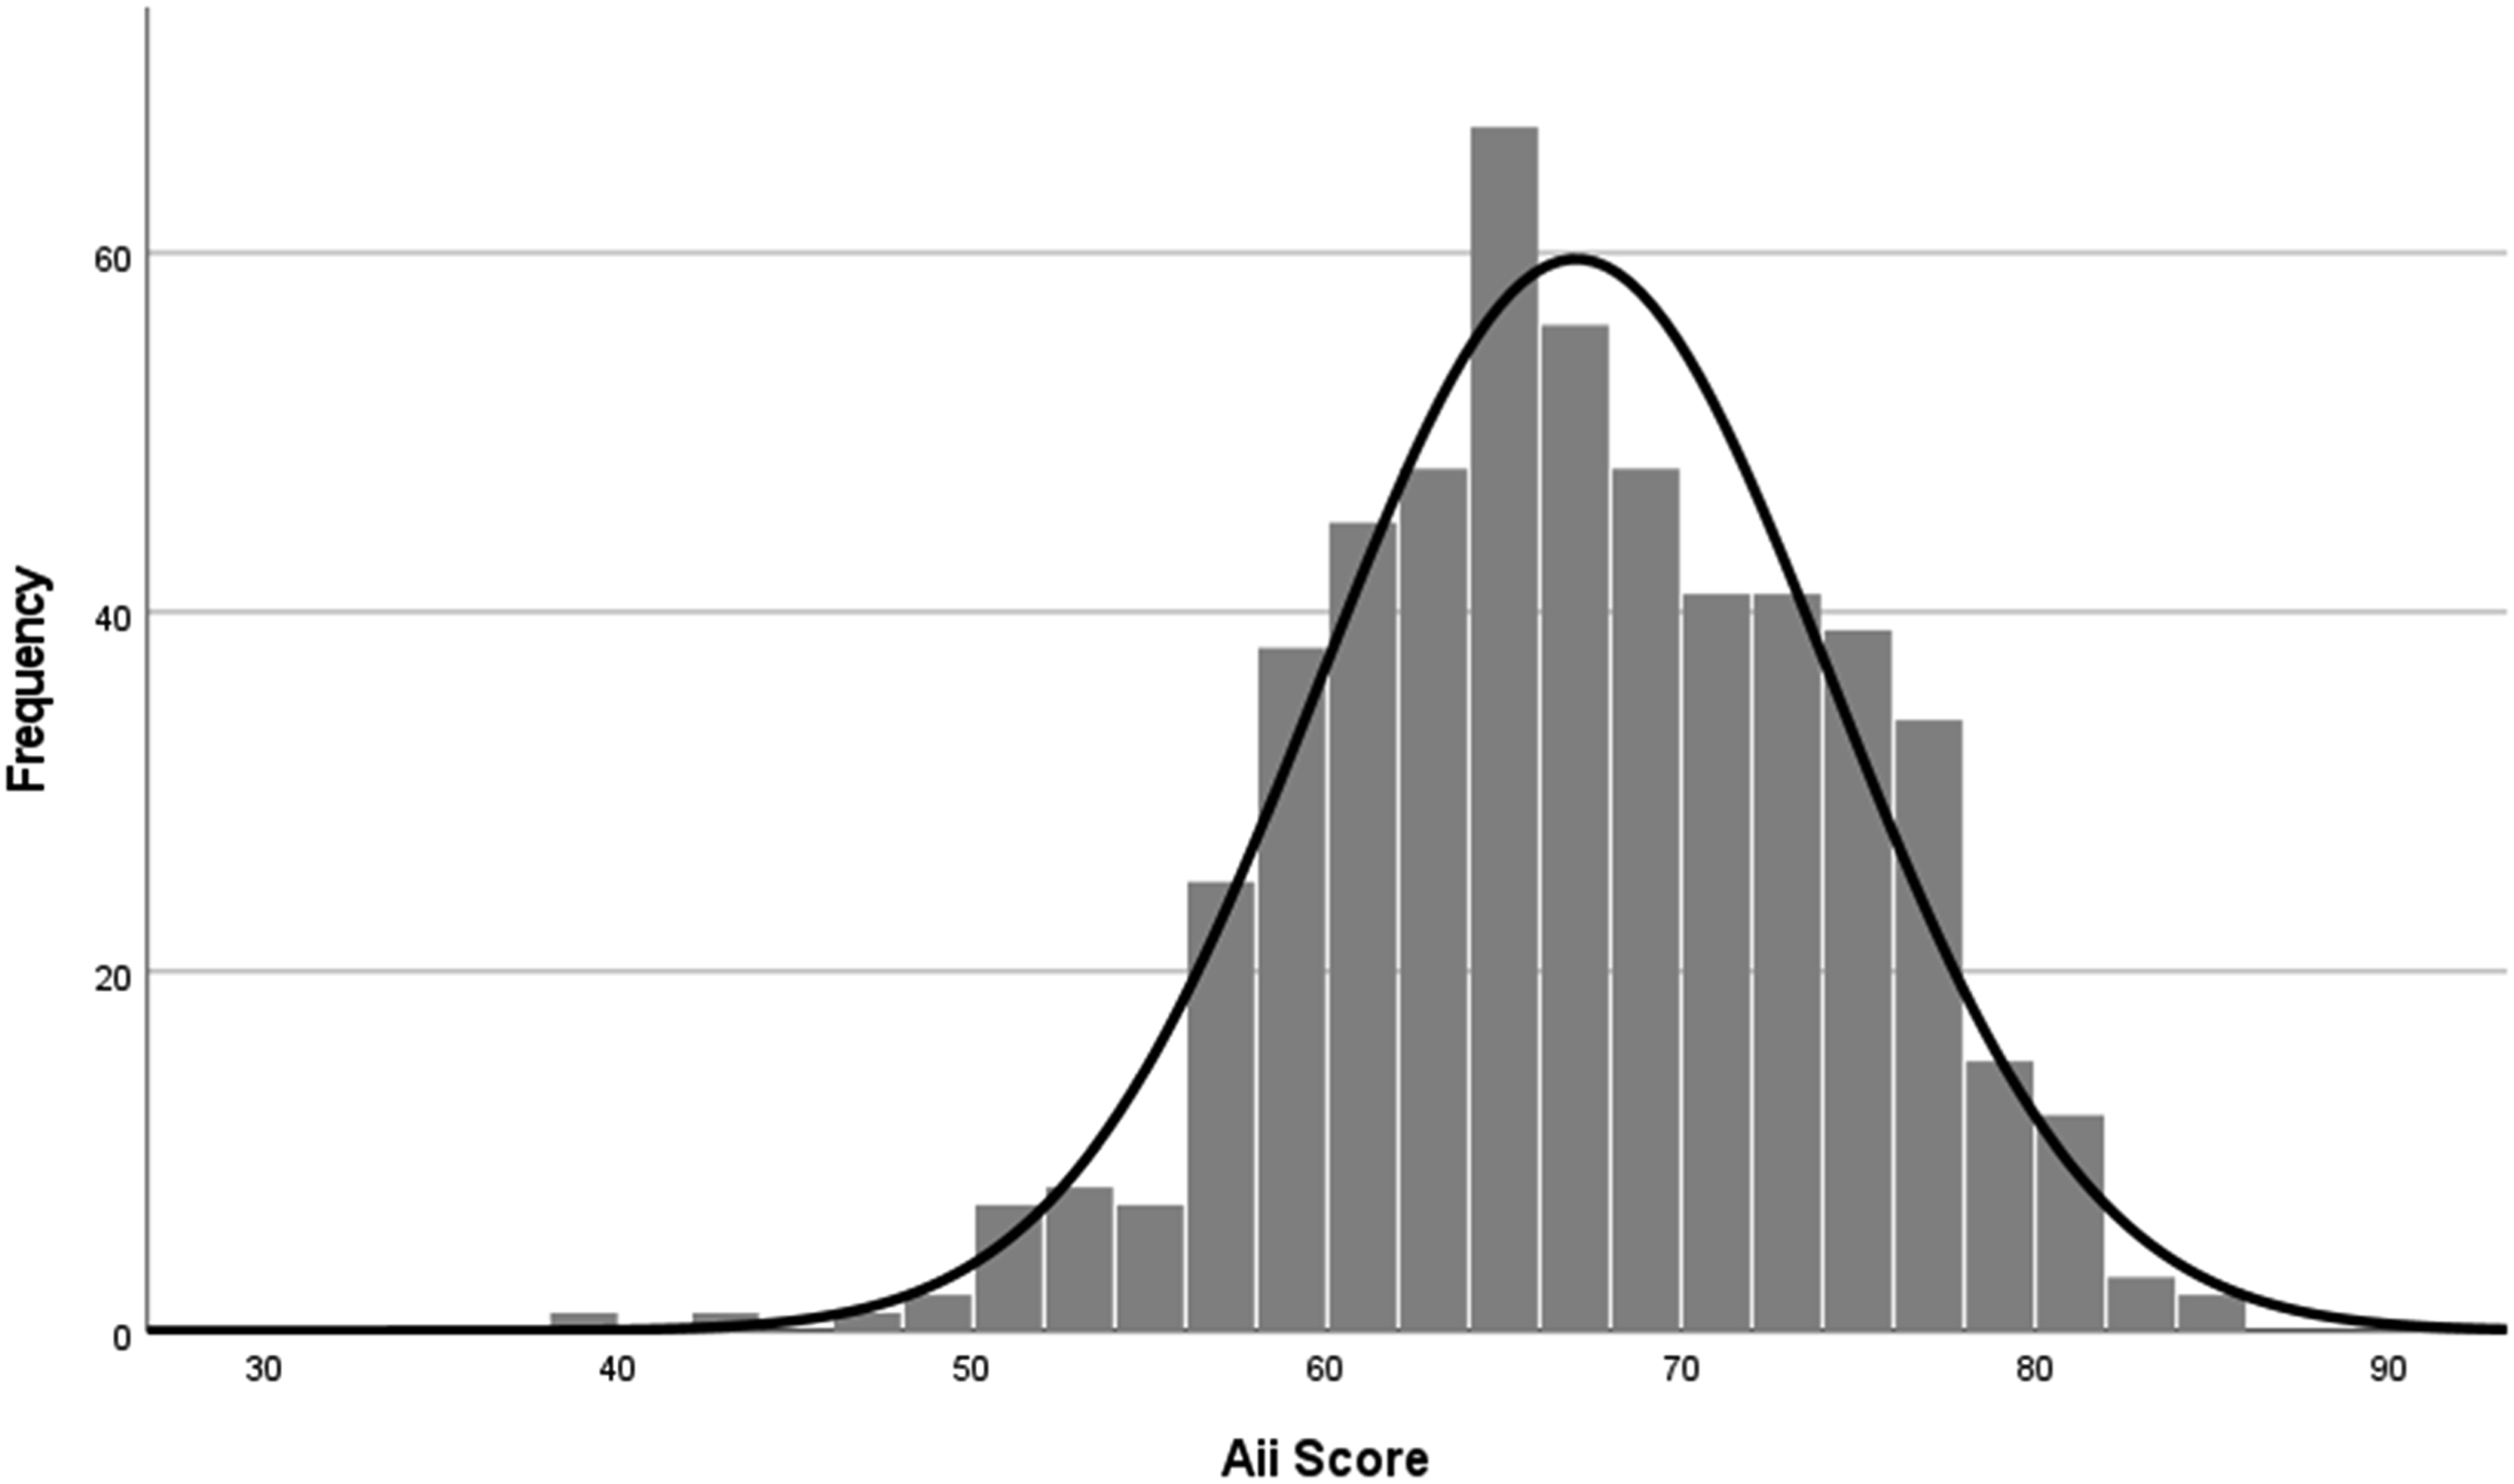
Innovation and Satisfaction
As noted earlier, most customer-centric literature related to innovation focuses on customer satisfaction (Kurtmollaiev, Lervik-Olsen, and Andreassen 2022). Because innovation often results in improved processes, performance, products, and services, these benefits would often be expected to positively impact customers’ experiences with firms. As a result, innovation is typically expected to be positively associated with improved customer satisfaction levels. Research investigating the innovation-satisfaction relationship supports this conclusion.
For example, research by Matear, Gray, and Garrett (2004) and Mahmoud, Hinson, and Anim (2018) find that service innovation is positively linked to customer satisfaction. Similarly, Ganesan and Sridhar (2016) find that service innovation improves firm reputation and customer satisfaction.
This research utilizes data from the American Customer Satisfaction Index (ACSI) (Fornell et al., 1996). The ACSI is a standardized, annual, cross-industry, national barometer that has been used in numerous academic studies as a reliable indicator of customer satisfaction (e.g., Aksoy et al. 2008; Larivière et al. 2016; Morgeson et al. 2020), which makes its use appropriate for this investigation.
Of the 123 publicly traded firms contained in the data, 107 are also tracked by the ACSI. Scores for the ACSI in this dataset ranged from a minimum of 55 to a maximum of 84, with a mean of 75.6, a median of 77.0, and a standard deviation of 4.9. As is typical of satisfaction data (Fornell 1992; Fornell et al. 1996), the distribution is negatively skewed (skewness = −1.659) (see Figure 2). Regarding the relationship between customer perceptions of innovation and customer satisfaction, this investigation supports prior research finding a positive relationship. An examination of the Pearson correlation between the Aii and ACSI shows a significant, positive relationship (r = 0.52, p < .001). Distribution of American customer satisfaction index scores.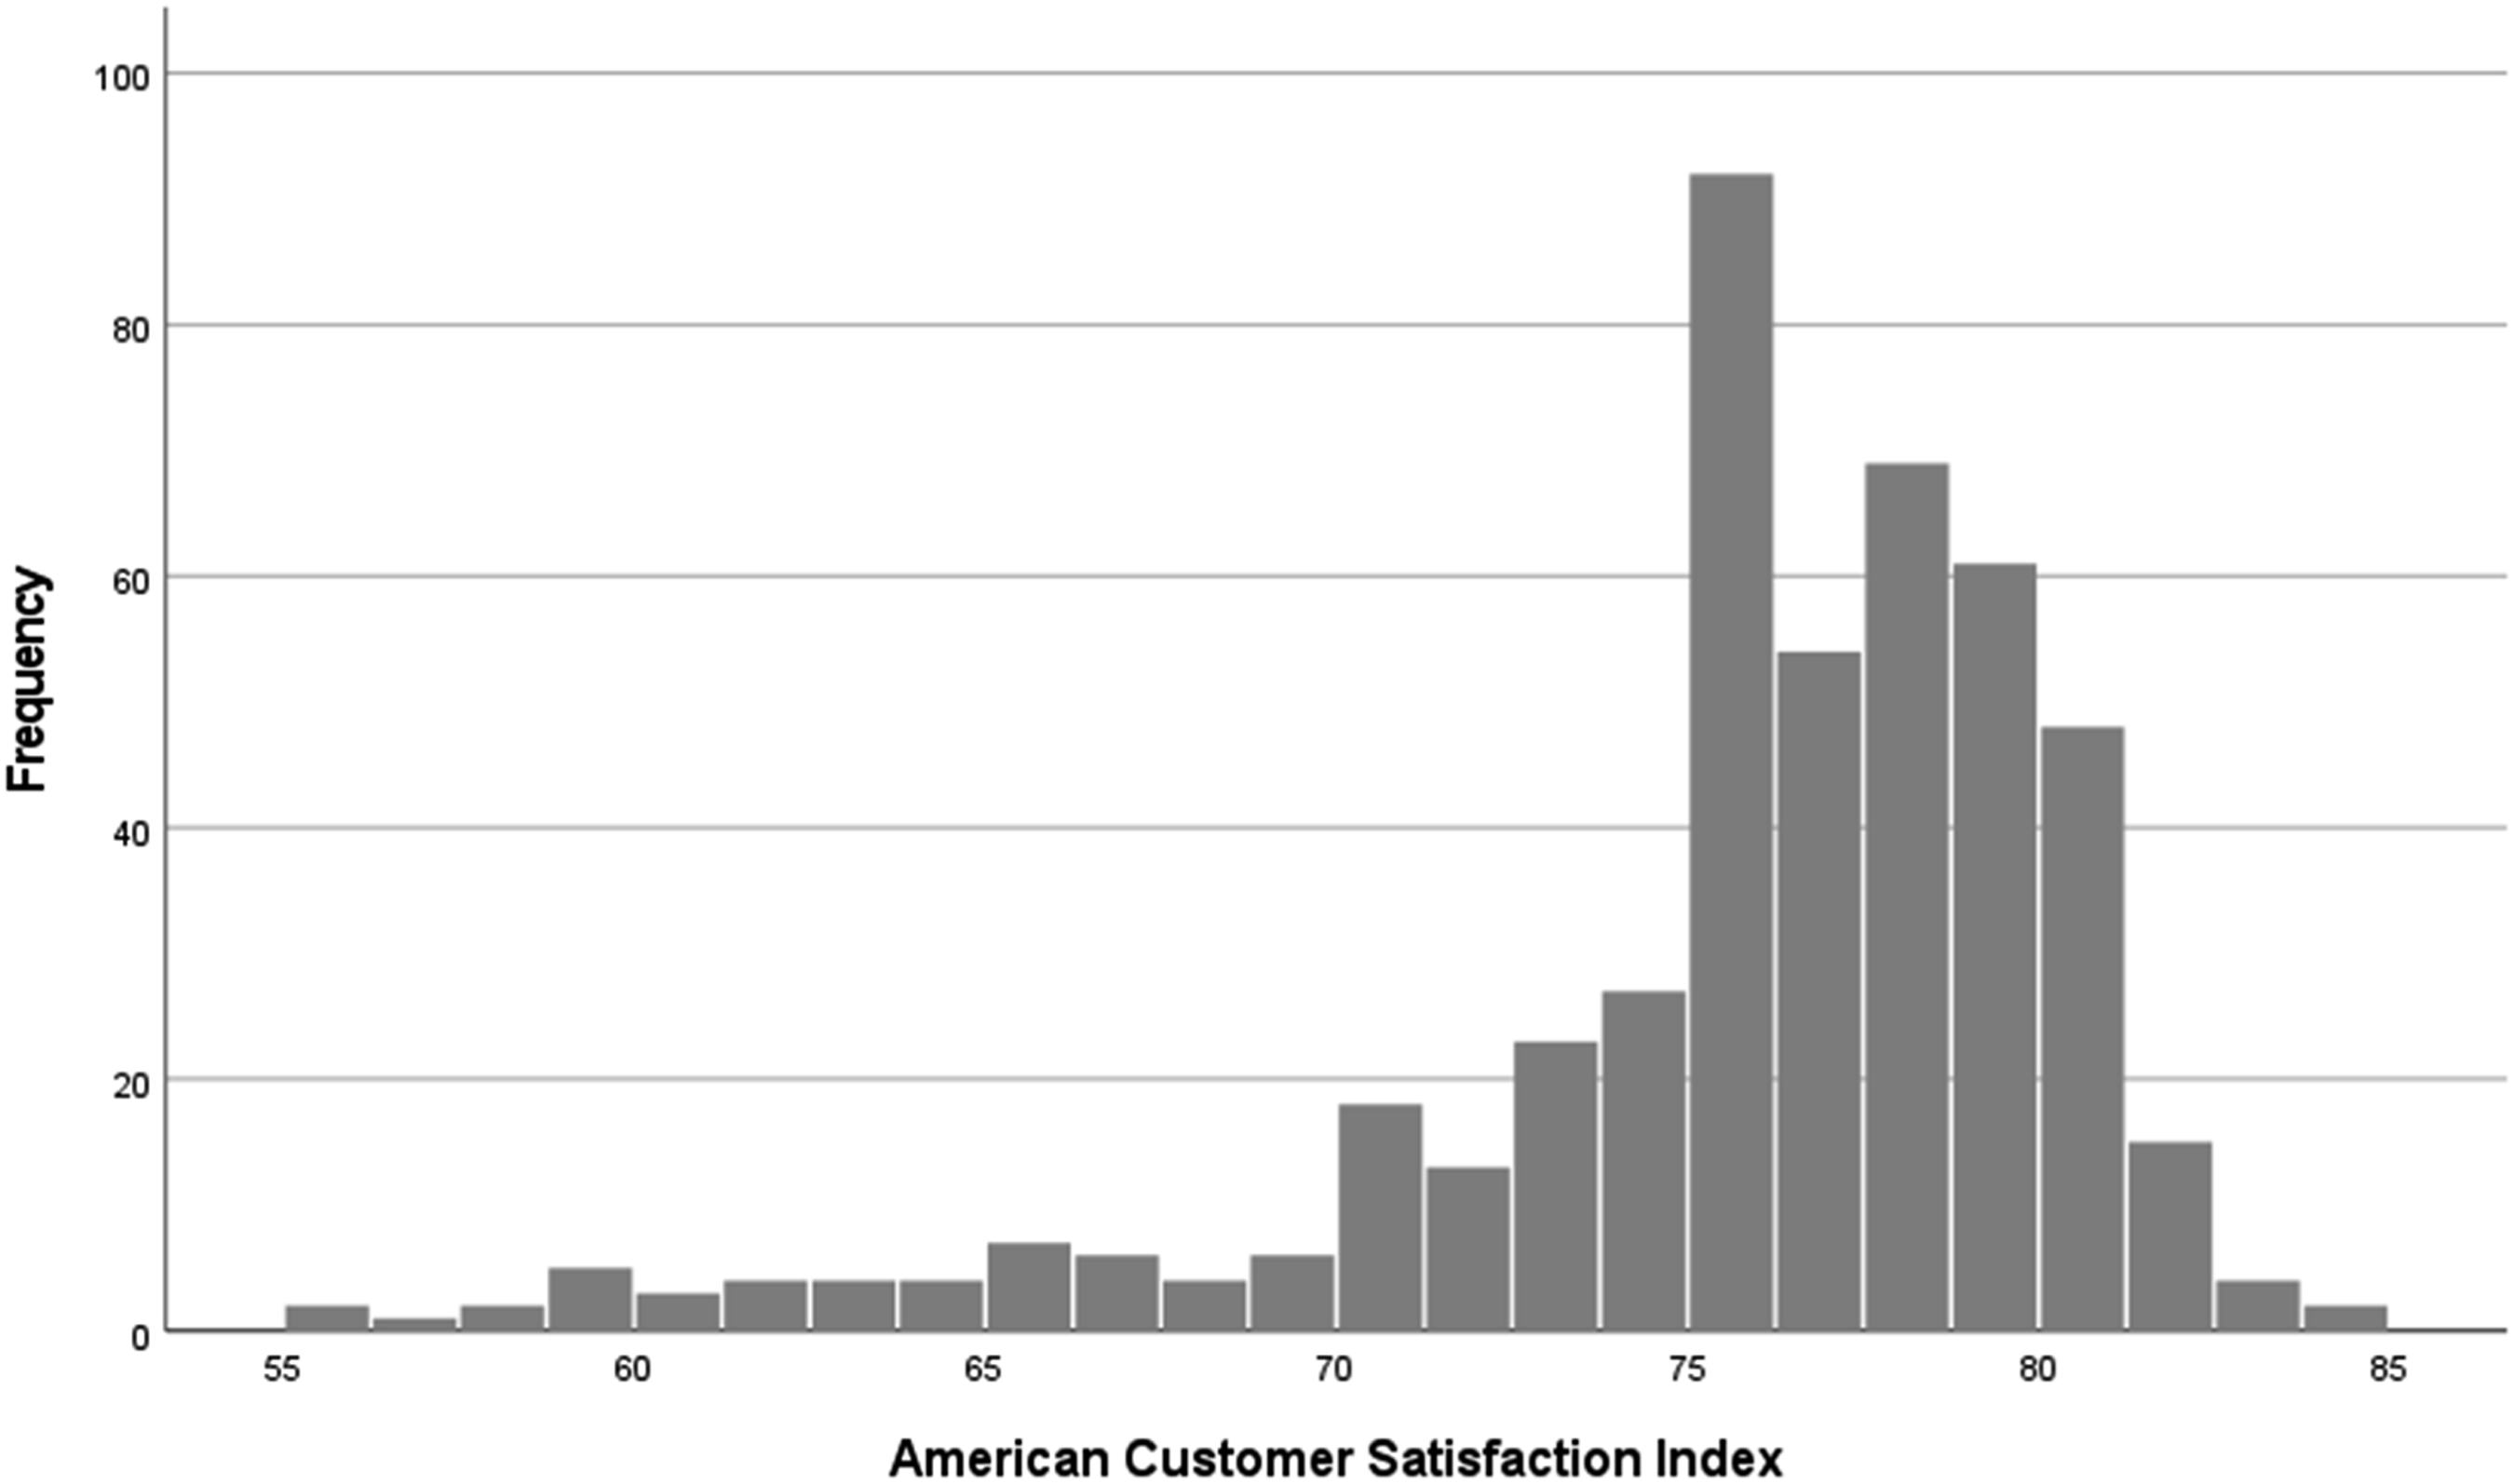
Innovation and Firm Performance
As noted earlier, economists believe innovation to be the primary driver of improved productivity, which in turn leads to improved economic performance. As a result, innovation would be expected to be linked to firm performance. Research findings, however, are mixed. Some investigations find a positive relationship (e.g., Bowen, Rostami, and Steel 2010; Cho and Pucik 2005; Geroski and Machin 1992; Subramanian and Nilakanta 1996), others find no impact or a negative relationship (e.g., Capon, Farley, and Hoenig 1990; Gök and Peker 2017; Ram and Jung 1991). It should be noted, however, that while finding a negative direct relationship between innovation and firm performance, Gök and Peker (2017) find that effect of innovation on market performance—defined as “the extent to which the firm achieves better market-related outcomes than its competitors with respect to metrics such as fast reactions to market opportunities, customer satisfaction and loyalty, and new customer acquisition” (pp. 610-611)—reverses this negative direct relationship. Finally, of direct relevance to this investigation, using both the Fama-French 3-factor (Fama and French 1992, 1996) and Carhart 4-factor (Carhart 1997) models, Sood and Tellis (2009) find that innovation projects result in significant positive total stock market returns.
Similarly, studies of service innovation and firm performance have mixed findings, with some reporting positive relationships (e.g., Grawe, Chen, and Daugherty 2009; Lin 2013), and others reporting negative relationships (e.g., Damanpour, Walker, and Avellaneda 2009; Visnjic, Wiengarten, and Neely 2016). A recent meta-analysis of 46 peer reviewed investigations into the topic, however, found a significant positive relationship between service innovation and firm performance (Feng, Ma, and Liang 2021).
In the literature, firm performance has been measured using a variety of metrics, for example, profit, revenue, earnings per share, Tobin’s Q, buy-and-hold stock returns, etc. In the case of this investigation, the measure of firm performance is abnormal stock returns (i.e., actual returns minus expected returns). Stock performance is selected because (1) innovation would be expected to result in improved shareholder value (Sood and Tellis 2009), and (2) stock performance is directly tied to shareholder wealth and the market value of firms. Stock performance also allows for the control of firm-specific and systemic factors known to impact performance.
As innovation has been shown to link to future stock returns (Sood and Tellis 2009), this research investigates whether customer perceived innovation (as measured by the Aii) links to future abnormal returns. An exploratory examination of the Pearson correlation between the Aii at time t (Aiit) and abnormal returns at time t + 1 (ARt+1) shows a significant, positive relationship (r = 0.156, p = .001). Moreover, the Pearson correlation between the Aii at time t (Aiit) and abnormal returns at time t + 2 (ARt+2) shows a significant, positive relationship (r = 0.172, p = .004).
An additional exploratory analysis related to the Aii and abnormal returns was conducted using Chi-square automatic interaction detection (CHAID) (Perreault & Barksdale, 1980; Tony, 1990). Aii levels at time t (Aiit) were used as a predictor of abnormal returns at time t + 1 (ARt+1). The results indicated that the optimal predictive relationship occurred when the Aiit variable was partitioned into two groups: (a) the bottom 30.0 percent of the sample in terms of Aiit levels (i.e., Aiit ≤ 62.7), and (b) the top 70.0 percent of the sample (i.e., Aiit > 62.7). For the bottom 30.0 percent of the sample, abnormal returns averaged −10.2 percent of their expected returns (adjusted p-value = .001, F = 16.212). Therefore, companies perceived by customers as being in the bottom 30 percent of innovation experience a precipitous drop in expected market capitalization, materially impacting investors’ financial returns. By contrast, abnormal returns for the top 70 percent averaged +1.5 percent of their expected returns (see Figure 3). Chi-square tests for abnormal returns at time t + 1 (ARt+1) by customer perceived innovation levels at time t (Aiit).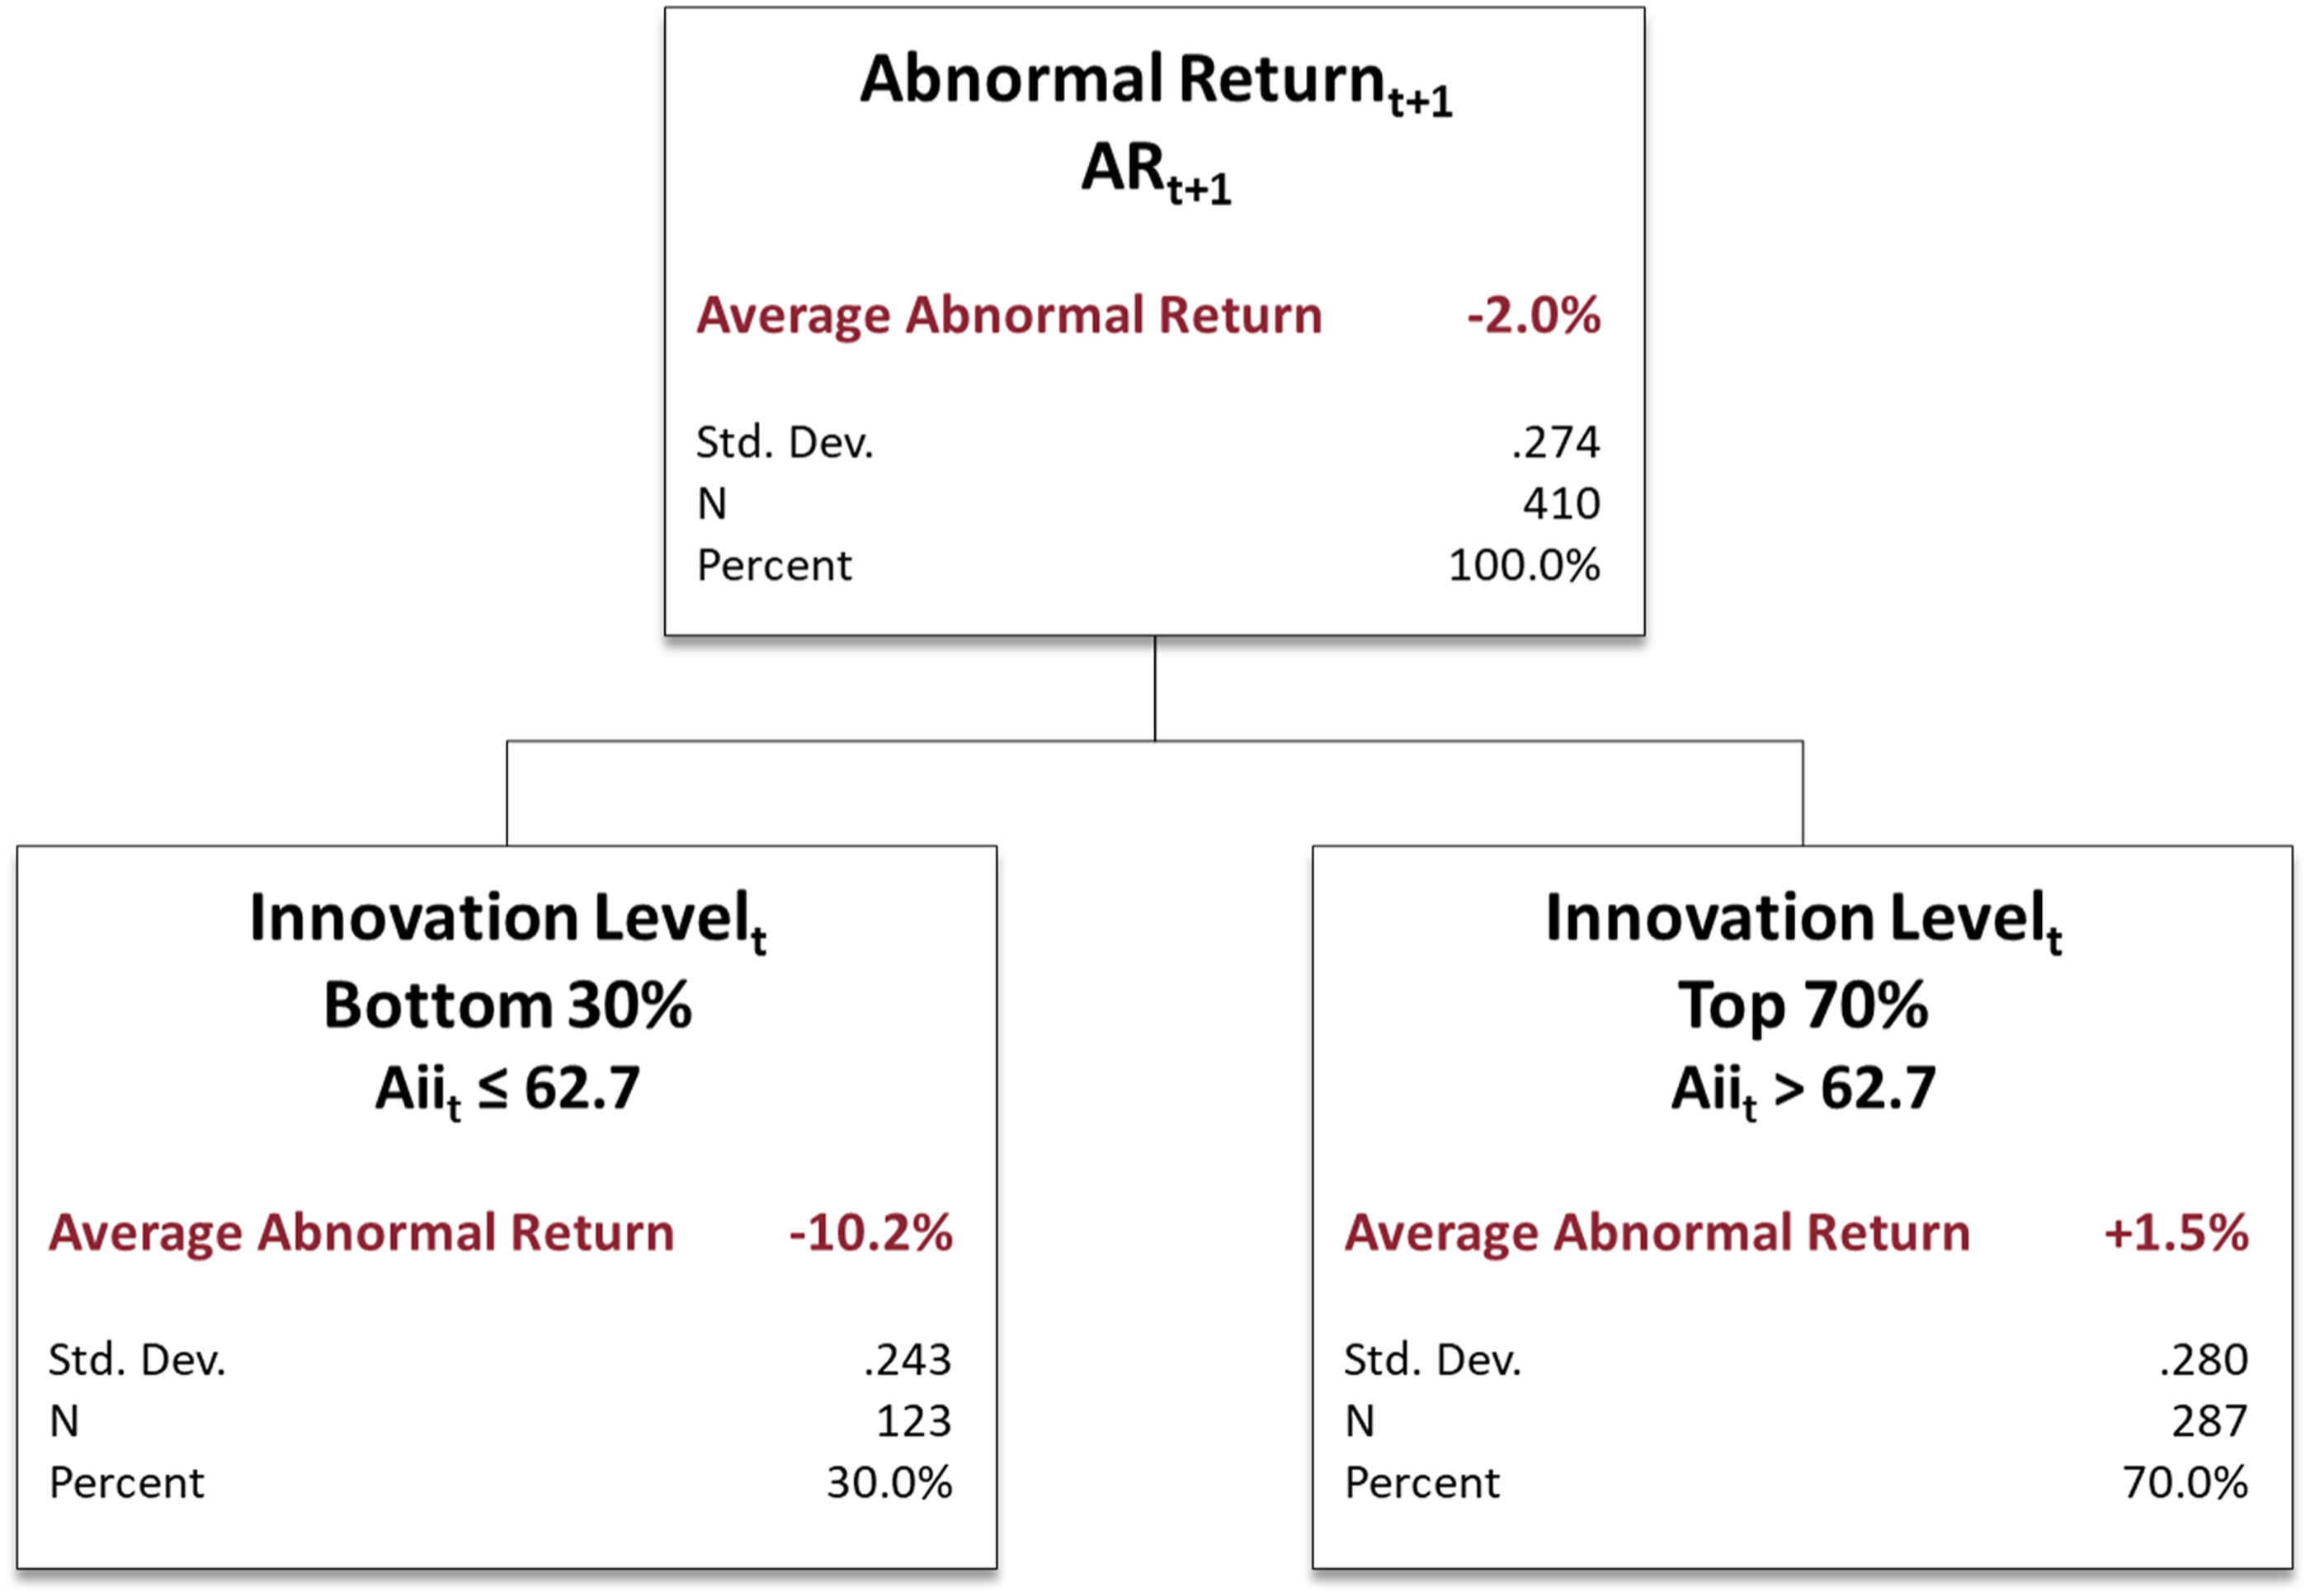
As noted earlier, customer satisfaction (as measured by the ACSI) and the Aii are significantly correlated. Moreover, numerous peer reviewed investigations find a positive relationship between the ACSI and future stock performance (e.g., Aksoy et al. 2008; Larivière et al. 2016). An examination of the Pearson correlation between the ACSI at time t (ACSIt) and abnormal returns at time t + 1 (ARt+1) is not statistically significant (r = 0.075, p = .157). However, an examination of the Pearson correlation between the ACSI at time t (ACSIt) and abnormal returns at time t + 2 (ARt+2) shows a significant, positive relationship (r = 0.123, p = .050).
An additional exploratory analysis related to the ACSI and abnormal returns was also conducted using Chi-square automatic interaction detection (CHAID) (Perreault & Barksdale, 1980; Tony, 1990). ACSI levels at time t (ACSIt) were used as a predictor of abnormal returns at time t + 1 (ARt+1). No significant groupings were found in the data.
Finally, it is important to note that abnormal returns at time t are not significant linear predictors of abnormal returns at time t + 1 (r = 0.030, p = .548), nor are abnormal returns at time t significant linear predictors of abnormal returns at time t + 2 (r = −0.022, p = .709). As a result, it is unlikely that the significant correlations between the Aii and ACSI on abnormal returns are the result of trends in abnormal returns.
Data and Research Methodology
Data Sources
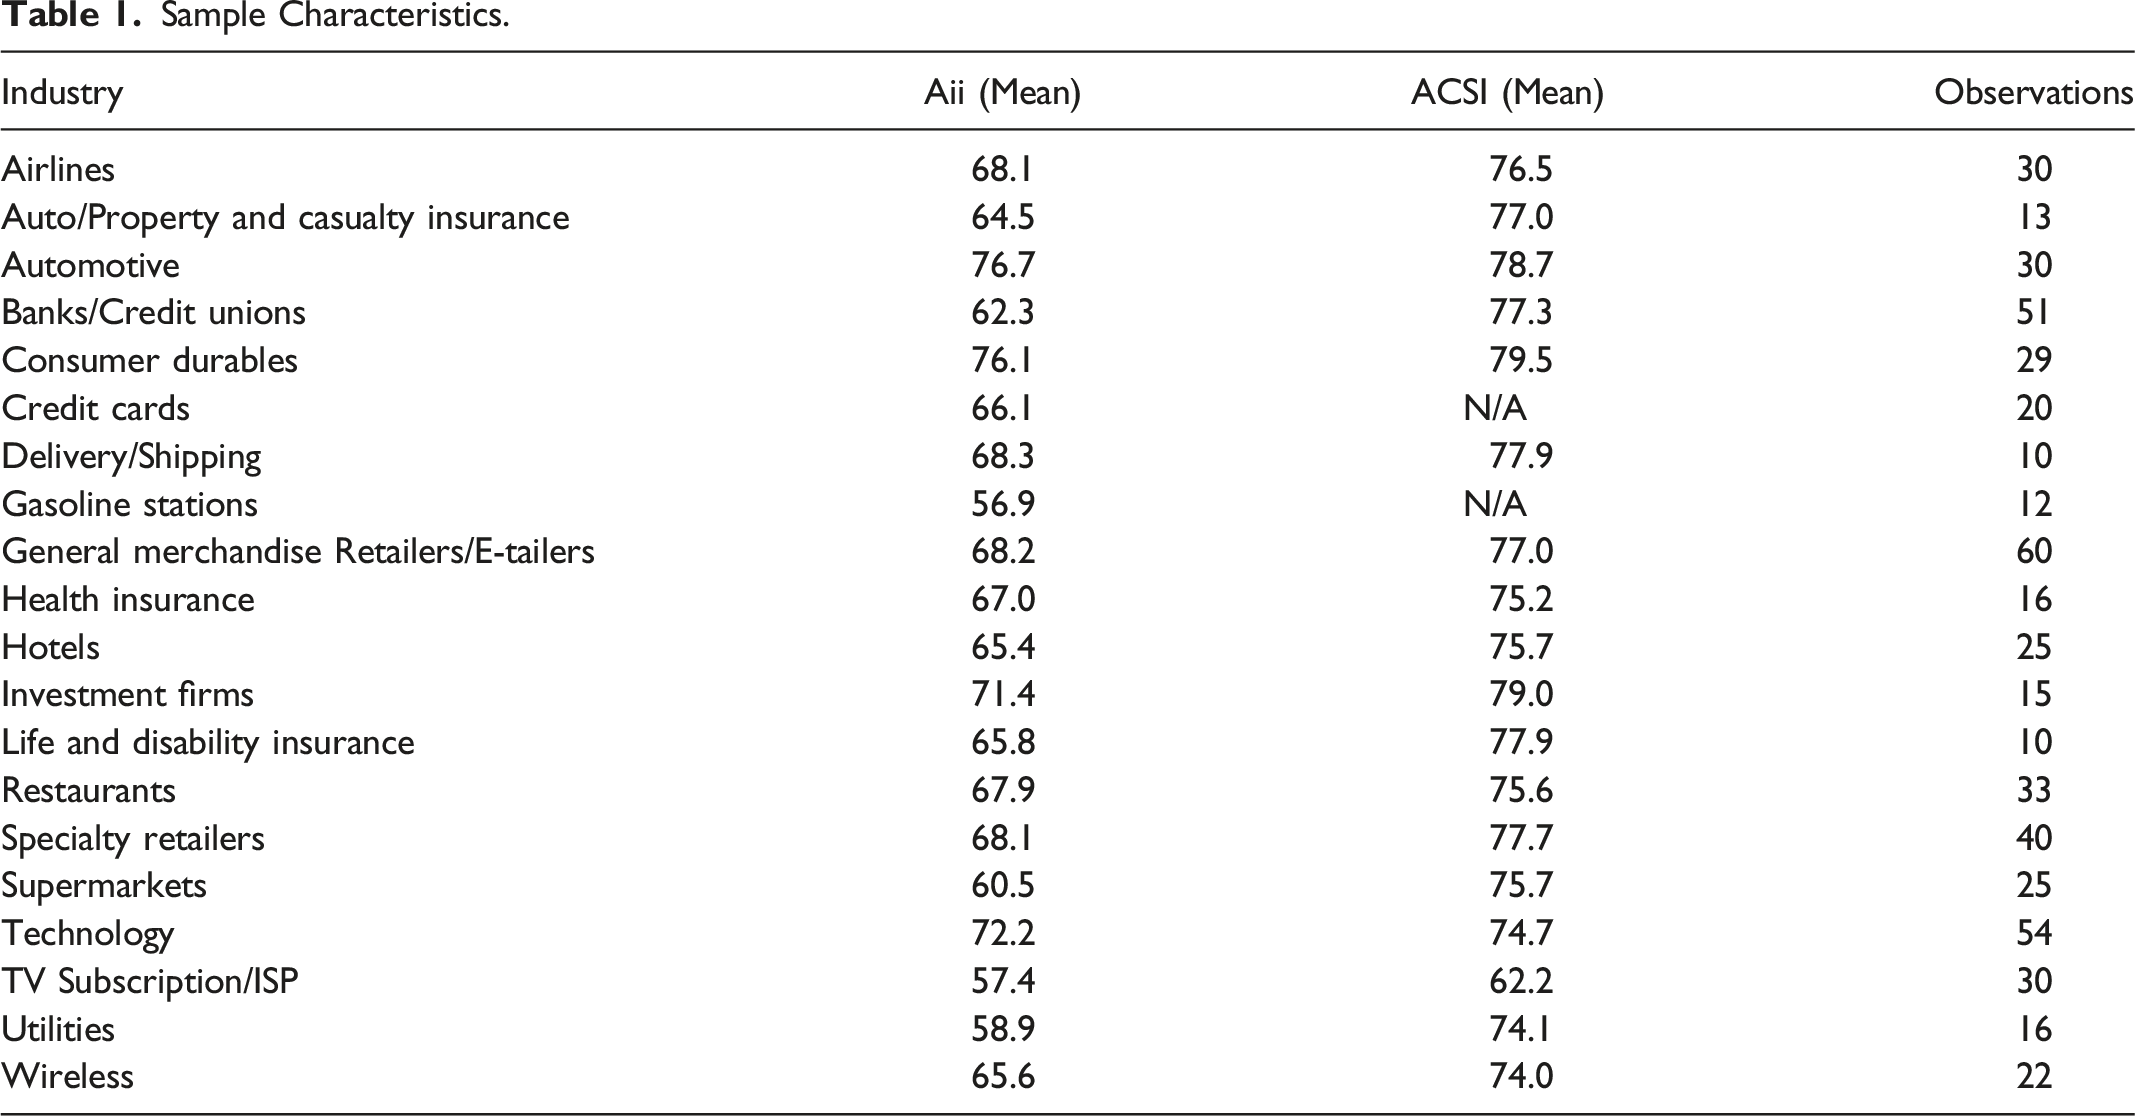
Sample Characteristics.
Many studies in the finance and accounting literature use market-adjusted returns as a proxy for abnormal returns (e.g., Brown and Warner 1980; Campbell and Shiller 1988; Barber and Lyon 1997; Loughran and Ritter 2000; Mitchell and Stafford 2000; Kothari and Warner 2007). Market-adjusted returns are used to investigate various aspects of financial markets, such as the reaction of stock prices to new information, the performance of securities following corporate events, and the efficiency of financial markets. Following these studies, 1 year buy and hold abnormal stock returns are calculated as the difference between the actual returns of a firm’s stock over a 1-year period and a broader market benchmark captured by the Annual NASDAQ Composite Total Return.
The distribution of abnormal returns in the data are approximately symmetric, with a mean and median very close to zero (−0.023 and −0.020, respectively), and a skewness of 0.423 (see Figure 4). As is typical of stock returns, the data are not normally distributed (despite being visually similar to a normal distribution) because of larger tails. This is confirmed by the Kolmogorov-Smirnov and Shapiro-Wilk tests, which support a non-normal distribution (p = .006 and p < .001, respectively). Distribution of abnormal stock returns.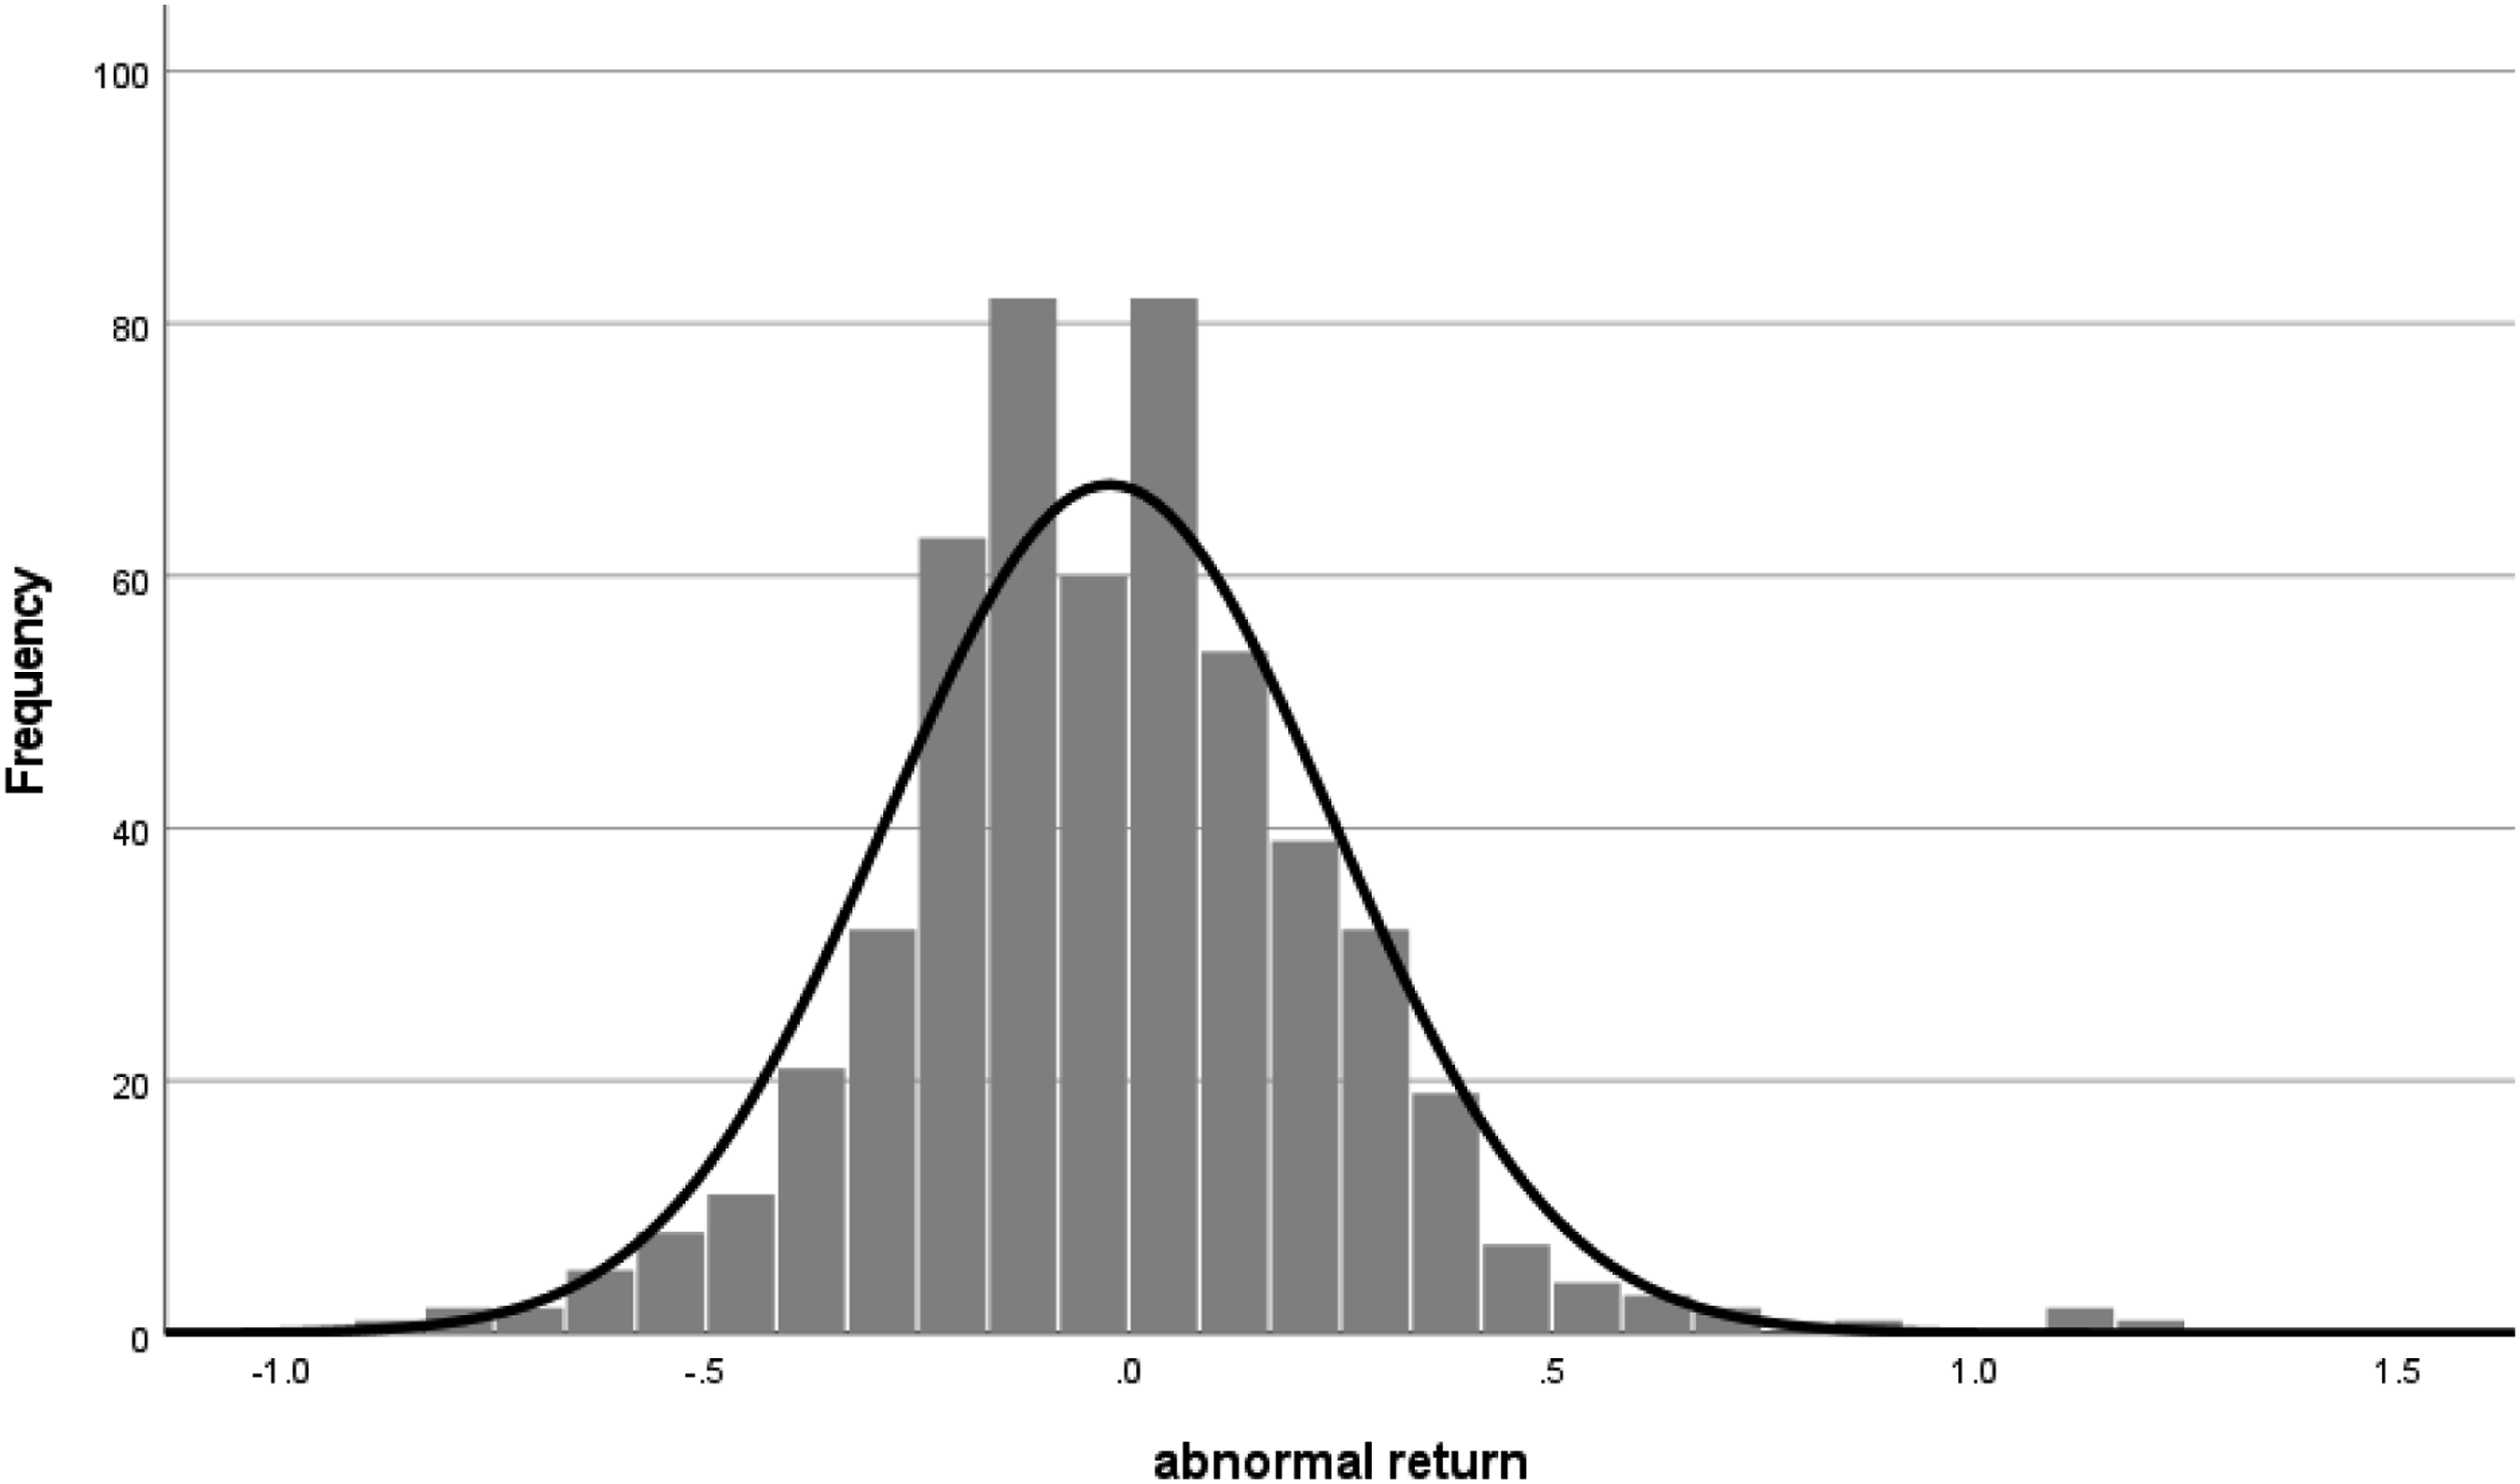
To control for industry and company specific factors that have the potential to impact stock returns, two time-varying covariates are examined: (1) market capitalization (i.e., the total value of all a company’s shares) and (2) market to book ratio (i.e., current market value relative to its net assets). Market capitalization and market-to-book ratio are metrics added to the risk-based CAPM estimate to calculate expected returns in the commonly used 3-factor model (Fama and French, 1992, 1996). Because both metrics vary within-firm, over time, they are especially appropriate to account for in panel data modeling. It is important to note that because abnormal returns are the difference between actual returns and expected returns, inclusion of actual returns in a model of abnormal returns would effectively cancel out the expected returns component, and therefore make it impossible to determine whether the deviation in returns from the expected values was caused by the performance of the stock or by random fluctuations in the market.
Measures
Dependent variable: Abnormal Returns at time t+1, as described above, where t represents a specific year between 2018 and 2021. In addition, we winsorized (Ruppert, 2006) the last two values on each end of the distribution to mitigate the impact of outliers. In a study of bond market momentum returns, Galvani and Li (2023) find that two-sided winsorization results in more robust, but conservative estimates of the effect.
Log of Market Cap (timet)
Market cap represents the total value of all of a company’s stock. To better manage the skewed distribution of the market cap values, we instead use the log transformation of this variable. The log transformation results in a more approximately normal distribution with no data loss. Market cap values are modeled at timet to ensure temporal priority vis-à-vis the dependent variable, which is measured at timet+1. For example, if modeling on abnormal returns for 2022 (t + 1), we use log of market cap in 2021(t) as the predictor.
Market-to-Book (time t ) is a ratio comparing the market price of a firm’s common stock with the stock’s book value per share. Essentially, it is the ratio of what investors believe a firm is worth to what accountants say it is worth according to generally accepted accounting principles. Market-to-book is also entered into the model at time t.
Aii (timet)
This variable is the Aii score of a firm in a given year. Like the log of market cap, we enter this value based on the prior year vis-à-vis the dependent variable. For example, if the record was for abnormal returns in 2021, the corresponding value of Aii in that row of data would be the firm’s Aii from 2020.
ACSI (timet)
This variable is the ACSI score of a firm in a given year, incorporated into the models in the same fashion as Aii.
ACSI Change (timet+1 − timet)
This variable represents the difference in ACSI score for each firm between time t+1 and time t and ranges from −6 to +6. For example, if a firm had an ACSI score of 47 in 2019(time t) and an ACSI score of 45 in 2020(time t+1), the ACSI change variable for that firm in 2020 would be equal to 45−47 = −2.
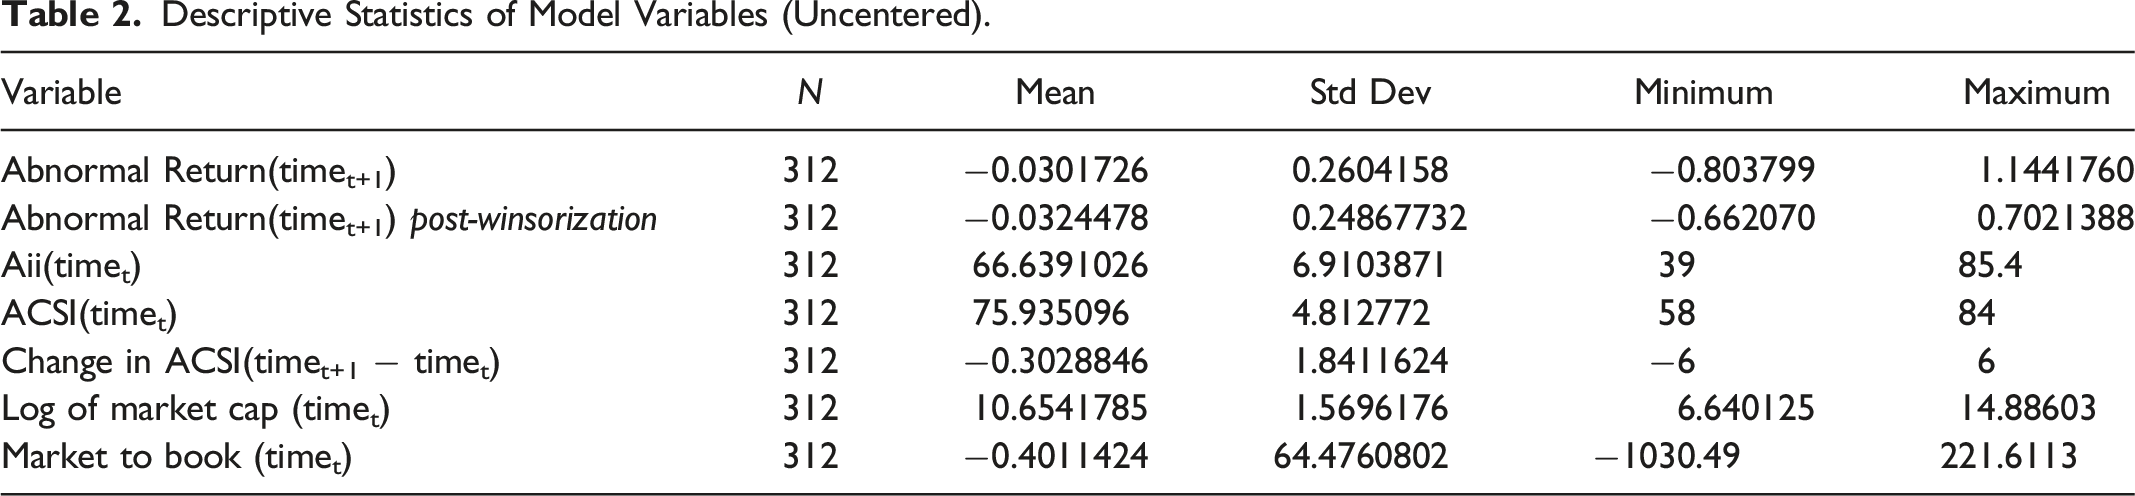
Descriptive Statistics of Model Variables (Uncentered).
Method
To evaluate the effect of Aii and ACSI on Abnormal returns and appropriately accommodate the panel structure of the data, we estimate one-way and two-way fixed effects and random effects models using both PROC PANEL in SAS, as well as the “plm” package in R (Wooldridge, 2002; Allison, 2009; SAS, 2014).
Fixed Effects vs Random Effects
In general, the one-way fixed effect regression model can be represented as
To obtain unbiased estimates of β, it is imperative that any unobserved time-invariant individual (in this case, company) characteristics are uncorrelated with the time-varying covariates in the model. In practice, this is a difficult assumption to satisfy. It is possible to sidestep this concern by time demeaning the data (e.g., subtracting the company’s mean of a variable across all time periods from its value in each of the time periods, a process also known as group-mean centering) before estimating the fixed effects regression. For example, in the one-way fixed effects model, demeaning produces the following:
Thus, the primary benefit of fixed effects panel data regression is that it controls for any unobserved time-invariant characteristics of the firms in the sample that could otherwise bias the model estimates. This approach effectively cancels out any of the potential between-company omitted variable bias that could otherwise distort the estimates of the impact of the time-varying attributes. As such, the model is solely focused on within-company variations over time.
Random effects models, by comparison, assume that individual (company) level heterogeneity is random and uncorrelated with the observed variables in the model. The one-way random effects model can be represented as follows:
An advantage of random effects models is that they allow for the analysis of the influence of time-invariant firm characteristics on the outcome variable, which cannot be assessed in fixed effect models. However, if unobserved individual effects are, in fact, correlated with the time-varying regressors in the model, this procedure will lead to biased estimates. The random effects model can be seen as a special case of the fixed effects model, where the individual-level effect is random and uncorrelated with the observed characteristics. As such, if the assumptions of the random effects model are true, the results should be consistent with the corresponding fixed effects model. And when this is the case, the random effects model is more efficient (estimates have less variability and smaller standard errors) and allows for the inclusion of time-invariant independent variables that can be used to assess differences between individuals as well as within.
To determine whether fixed or random effects are more suitable, we conduct Hausman Specification Tests (Hausman, 1978; Wooldridge, 2002), comparing the results of the fixed and random effects models. Simply put, a significant result (i.e., the random effects model is significantly different than the fixed effects model) indicates that the fixed effects model is more appropriate.
Between each pair of fixed effects and random effects models in our analysis, the Hausman test returned a significant result, indicating that the assumptions of the random effects may be violated. Consequently, we report only the findings of the fixed effects models in this analysis.
One-Way vs Two-Way Models
In one-way models, we account only for individual-level (i.e., firm) heterogeneity, while in a two-way model, we account for heterogeneity across both the cross-section and the time period. The two-way fixed effects model, for example, estimates an additional parameter, µ
t,
to account for the time fixed effects:
Findings
Fixed Effects Panel Data Models of Abnormal Stock Returns (Abnormal Return t + 1).
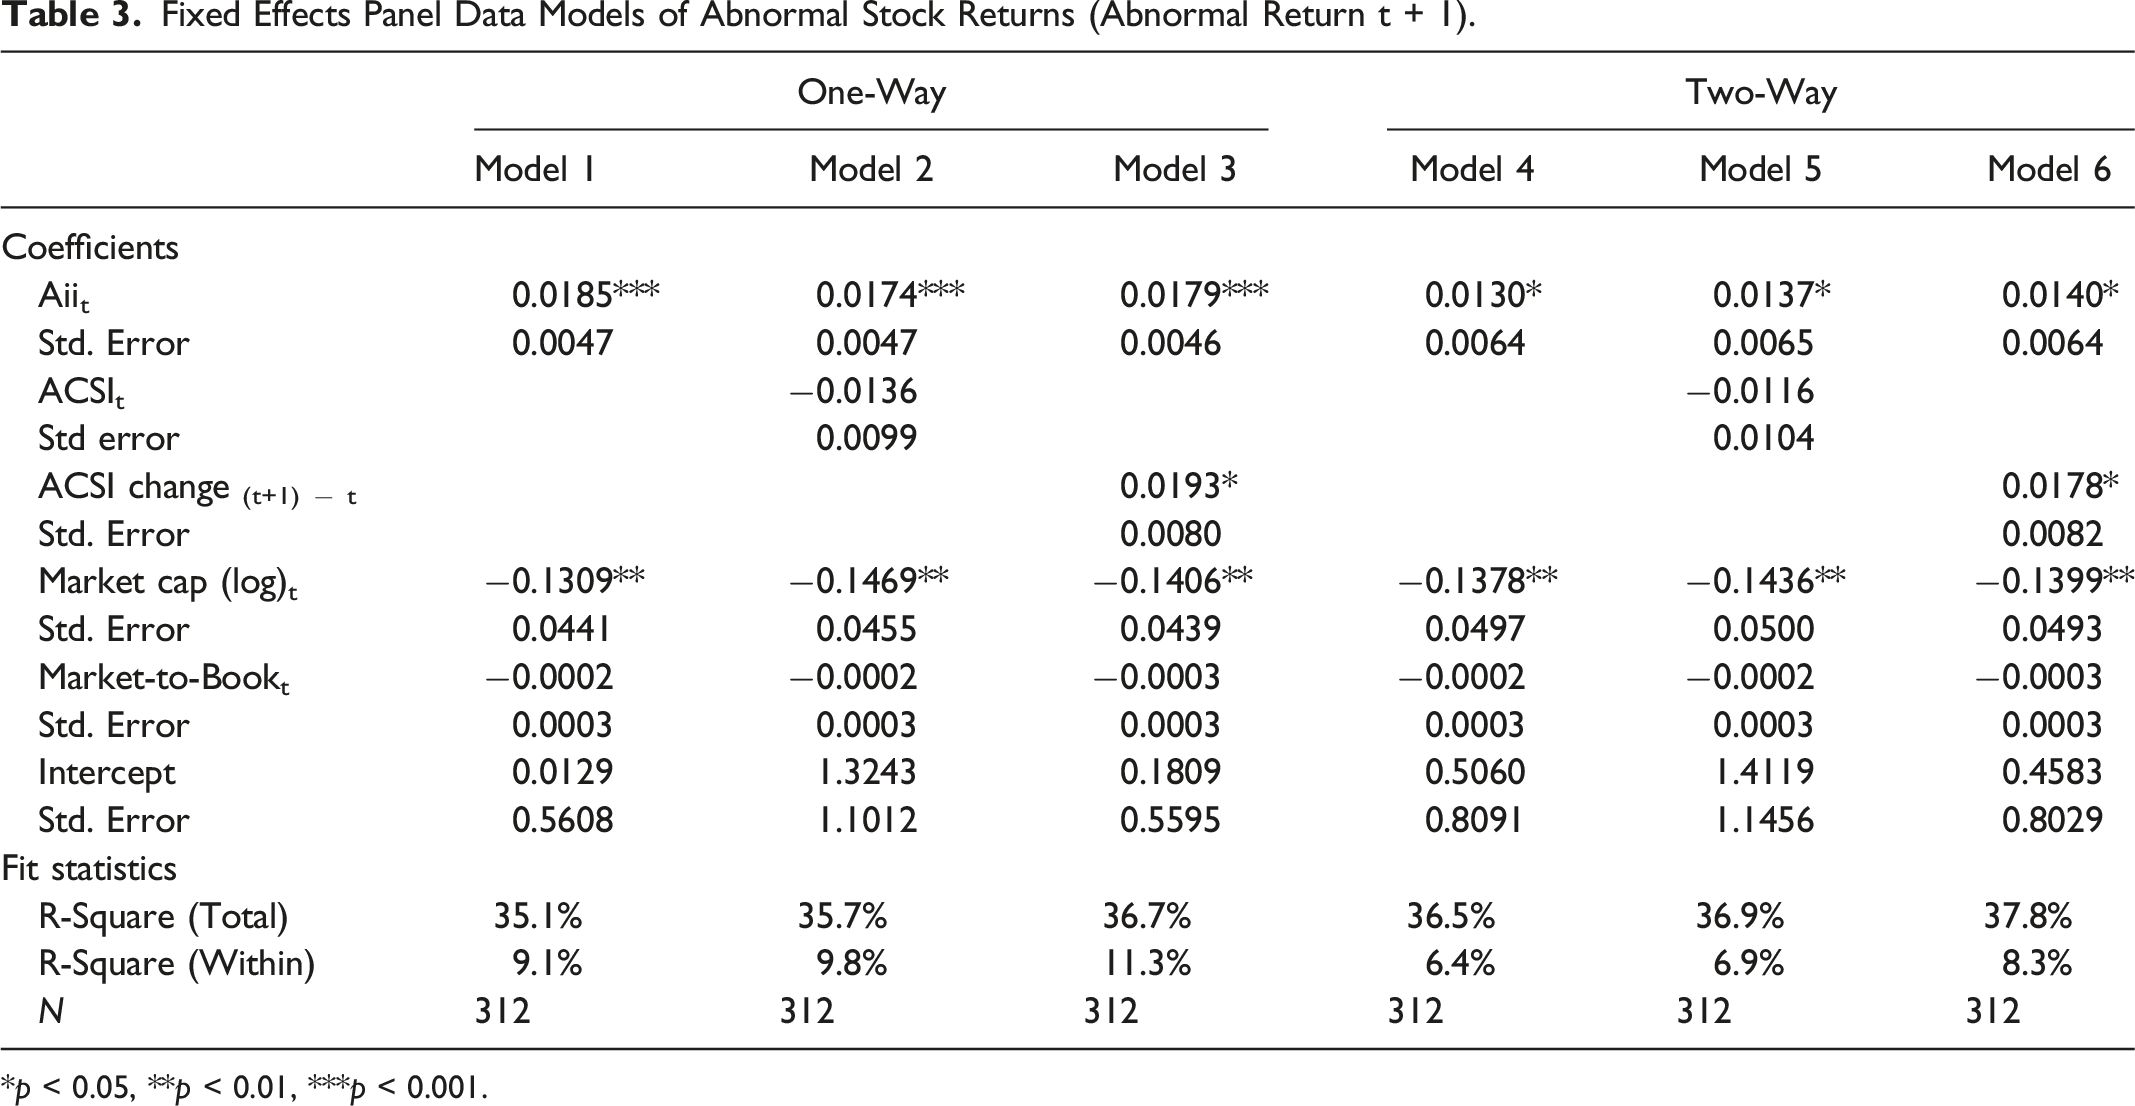
*p < 0.05, **p < 0.01, ***p < 0.001.
Models 1–3 present the results of the one-way fixed effects models, while Models 4–6 represent the corresponding two-way fixed effects models.
Model 1 includes only Aii as a predictor, along with the control variables of market cap and market-to-book. Aii (0.0185) demonstrates a positive and statistically significant effect on abnormal returns. The effect of market cap (log) is statistically significant, but negative, while market-to-book has no significant effect. The overall R-square (as reported by SAS PROC PANEL) for the model is 35.1 percent, while the within R-square (as reported by the plm package in R) is 9.1 percent.
Model 2 presents the results when ACSI (at timet) is added to the model. The effect of ACSI is not statistically significant, while the effect of Aii is attenuated (0.0174). The insignificant effect of ACSI in this model is consistent with findings of the exploratory CHAID analysis. Market cap (log) remains statistically significant. Model R-square increases to 35.7 percent overall and 9.8 percent within-firm.
Model 3 replaces ACSI at timet with the change in ACSI from timet+1 − timet. We tested several transformations of ACSI (ACSI at timet−1, ACSI at timet squared, etc.), and we were able to identify this particular delta as having a substantive and statistically significantly effect. Most importantly, distinct effects from prior year’s level of satisfaction versus a change in satisfaction is consistent with prior research. Cooil et al. (2007) identified separate effects of satisfaction level and percentile change on share of wallet.
Model 4 presents the results of the two-way fixed effects model, which includes time fixed effects. While two-way fixed effect results can be more challenging to interpret (Kropko and Kubinec, 2020), the results in this case are generally consistent and intuitive vis-à-vis the results of the one-way analysis. Inclusion of the time fixed effects (equivalent to adding dummy variables for year in the model) attenuates the effects of Aii (from 0.0185 in Model 1 to 0.0130 in Model 4). In fact, a consistent attenuation of effects between the respective one- and two-way models is clear among all of the significant predictor variables. Market cap (log) remains the sole significant control variable in all of the two-way models. Model 4 explains 36.5 percent of the overall variation in abnormal returns (1.4 percent more than the one-way model), but only 6.4 percent of the within-group variation (compared to 9.1 percent in Model 1).
The coefficient of Aii in Model 5 (0.0137) is smaller than in Model 2 (0.0174), though it is worth noting that it is higher than in Model 4 (i.e., the inclusion of the ACSI variable increases the effect in the two-way model, while it reduces it in the one-way model). Nonetheless, ACSI remains statistically insignificant in the two-way model. Market cap and market-to-book effects are consistent. Model 5 explains 36.9 percent of the total variation in abnormal returns and 6.9 percent of the within-group variation.
Model 6, similar to its one-way counterpart (Model 3), reveals significant effects for both Aii (0.0140) and ACSI Change (0.0178), albeit attenuated. The coefficient for log of market cap is significant and similar in magnitude to the coefficient in the one-way model, while market-to-book is again insignificant. Considering that the time period covered by the data includes the COVID-19 global pandemic, it is reasonable to expect that time itself may have an impact on both abnormal returns, as well as the relationship between innovation and satisfaction on financial returns. The overall R-square (reported by SAS PROC PANEL) for the two-way model is 37.8 percent, indicating only a modest gain in overall explanatory power from the addition of the time fixed effects (36.7 percent in Model 3), while the within R-square (reported by R) actually decreases to 8.3 percent. The lower within R-square for the two-way models may indicate that the one-way models are more appropriate. But since the two-way models provide more conservative estimates, they may provide the basis for a more prudent interpretation.
General Discussion
This investigation corroborates prior research regarding the importance of customer perceptions to firm performance. Specifically, the research finds that customer perceptions of both firm innovativeness and satisfaction significantly impact future stock performance. Moreover, the impact on market capitalization—and therefore shareholder wealth—is managerially relevant. The findings have important implications for researchers, managers, and investors.
Implications for Researchers
Currently, there is very little research regarding customer perceived innovation. Moreover, this is the first study that examines the relationship between customers’ perceptions of innovation and firm financial performance. 3 As a result, there are many opportunities to create new knowledge related to the topic.
There is a need for research on the key drivers of customer perceived firm innovativeness. Currently, most of the research regarding the drivers of customer perceptions focuses on customer satisfaction (e.g., Kekre, Krishnan, and Srinivasan 1995; Perkins-Munn et al. 2022). The drivers of perceived firm innovativeness likely differ significantly, however, from the drivers of customer satisfaction. Therefore, research needs to uncover the attributes that customers use to gauge a firm’s innovativeness. As many of these elements are likely to differ by industry, level of competitive intensity, type of customer interaction with the firm (e.g., contractual, transactional, etc.), and other market specific factors, research should identify both generalizable and context specific drivers of perceived innovativeness. Moreover, the impact of companies’ marketing communications and brand positioning efforts in driving customer perceived innovation should be examined.
Research is also needed to determine potential mediators and moderators in the perceived innovation-abnormal stock returns relationship. For example, customer loyalty levels may mediate the relationship as it would be expected to impact customer retention, share of wallet, and word of mouth. These downstream effects are positively associated with firm performance. Brand reputation may similarly mediate the innovation-returns relationship. A firm’s reputation as an innovator may make customers more aware of and receptive to its innovation efforts, thereby enhancing its position vis-à-vis competitors. Market conditions such as economic factors (e.g., inflation, monetary policy, etc.) and investor sentiment may also moderate the relationship between innovation perceptions and stock returns.
A more in-depth examination of the impact of perceptions of innovation over longer time periods, via methodologies such as latent growth modeling, may also provide a more thorough understanding of how persistent perceptions of Aii are over time, as well as how changes in Aii scores can have longer lasting downstream impacts on firm financial performance.
As this investigation covers only one country, that is, the United States, research is needed to determine the cross-cultural influences in how customers perceive firm innovativeness, and its impact on firm financial performance. Research on customer satisfaction shows significant cultural differences (e.g., Morgeson et al. 2011). Therefore, it is likely that customer perceptions of innovation will have similar national and cultural differences. Given that there are now several countries with national barometers of customer perceived innovation, there should be many opportunities to explore how culture impacts perceptions of firm innovativeness.
Research suggests that investments in innovation can crowd out investments in environmental sustainability and vice versa (e.g., Hottenrott and Rexhäuser 2015). Moreover, research finds no correlation between objective measures of environmental, social, and governance metrics and customer perceptions of firms’ social innovativeness (Aksoy et al. 2022; Peloza et al. 2012). Therefore, there is a need to investigate the relationship between customer perceived innovation and environmental outcomes. If there is evidence of a crowding out effect, research should offer insight into conditions that exacerbate (e.g., financing constraints) and ameliorate (e.g., government subsidized environmental technology) the problem. Similar research should investigate the relationship between customer perceived innovation and social outcomes (e.g., corporate social responsibility, ethical business practices, etc.) to determine if customers’ innovation perceptions are impacted by firms’ social performance.
Research designed specifically to guide management practice must also take place. For example, there is a need to understand the relationship between firms’ innovation management practices and customers’ perceptions of firm innovativeness. Researchers can explore how practices such as customer co-creation, design thinking, and blue ocean strategy sessions impact customers’ perceptions of firm innovativeness.
Because there is little research currently available regarding customer perceptions of innovation, there are numerous opportunities for new, important research. Pursuing research in these areas will not only advance our knowledge, it will also advance the practice of management by providing much needed insight into what drives perceptions of innovativeness, how country/culture impacts these perceptions, and what practices work best.
Implications for Managers
Currently, managers do not measure, manage, and monitor customers’ perceptions of their firms’ level of innovativeness. Many firms, however, do track customer satisfaction perceptions (Aksoy 2013), as well as a number of other perceptual or attitudinal customer metrics (e.g., brand image, customer effort score, customer (attitudinal) loyalty, etc.). Given its linkage to abnormal returns, managers need to track customer perceived innovation.
Therefore, the most obvious first step is to begin actively tracking customer innovation perceptions for the focal firm and its competitors. As noted earlier, firm innovativeness for the Aii was assessed using a battery of four questions. Therefore, managers may need to capture customer responses to more than a simple, single “how innovative is the firm” survey question to have a robust metric that behaves similarly to the metric used in this investigation. Nonetheless, developing and using a valid customer innovation metric is clearly doable.
Knowing a firm’s level of innovativeness vis-à-vis its competitors, however, is not enough. To guide action, managers need to understand the aspects of innovativeness that distinguish firms in their industry, and to use this information to identify strengths and weaknesses that will guide innovation initiatives. For example, to evaluate how representative a firm is within its industry (i.e., Centrality) and how unique customers perceive a firm’s offerings to be relative to competitors (i.e., Distinctiveness), managers should consider incorporating Centrality-Distinctiveness (C-D) Maps into their analyses (Dawar and Bagga 2015; Keiningham et al. 2019). The ultimate goal of these analyses is to identify areas where managers can and should invest resources that will positively impact customer perceptions of their firms’ innovativeness.
Managers also need to manage evidence with customers related to their innovation efforts. Managing evidence is a common theme in services marketing, particularly as it relates to making intangible elements of service more concrete for consumers (e.g., Shostack 1977). Berry and Parasuraman (2004) proposed three categories of evidence: the physical environment, communications, and prices. Each of these categories are applicable to making innovations tangible to consumers. As the categories are not mutually exclusive, the rollout of any innovation should consider the appropriate actions across these three categories that would best convey the benefits of the innovation to customers. Incorporating service design into the planned launch of new innovations can enhance their customer awareness, usage, and satisfaction. Additionally, marketing that makes tangible the benefits to customers of new innovations should be considered for any that have the potential to differentiate the firm from its competitors.
Currently, managers’ efforts to enhance customers’ appreciation of firms’ innovations are inconsistent and ad hoc. This lack of attention naturally occurs because most managers do not measure customers’ perceptions of their firms’ levels of innovativeness, and as a result it is not something that they can easily manage. Given its observed importance to firm financial performance, however, this could be an area for managerial focus.
Implications for Investors
The financial implications revealed by this investigation are managerially significant. As noted earlier, every five-point increase in the Aii metric used in this analysis was associated with a $2.8 billion increase in shareholder wealth. Moreover, because Aii scores ranged from a low of 39 to a high of 85.4, with a mean of 67.0, and a standard deviation of 7.2, most firms have significant upside potential.
Despite the use of traditional innovation metrics (e.g., patents, R&D expenditures, etc.) by investors in their investment decisions, the inclusion of customer perceptions of innovation remains overlooked. However, the demonstrated link between customer perceptions of innovation and abnormal stock returns indicates the potential for incorporating these measures. Therefore, it could be beneficial for investors to broaden their analyses by including measures of customer perceived innovation, as this provides insights in identifying firms that are more likely to generate positive abnormal returns.
Investors already incorporate customer perceptions in their decision-making, primarily by considering customer satisfaction. For example, CSat Investment Advisory utilizes customer satisfaction data in the selection of stocks for its portfolio. Given the observed link between customer perceptions of firm innovativeness and abnormal stock returns, however, investors should consider broadening their focus to include measures of customer perceived innovation alongside customer satisfaction.
In addition to guiding investment decisions, investors should also consider using customer perceptions of firm innovativeness in their evaluations of company performance. Innovative firms are more likely to create long-term value. Hence, value investors should be concerned with customers’ perceptions of firm innovativeness. Investors should hold management accountable for customers’ perceptions of firm innovativeness, and ask for regular reporting on its performance akin to company reports on customers’ satisfaction levels.
By recognizing the impact of customer perceptions on stock performance, investors can make better investment decisions by identifying firms that are likely to generate long-term value. Such an understanding not only keeps management focused on innovating but also sends a clear message that serving customers must always remain a top priority for management. Ultimately, this alignment between investor expectations and company actions should benefit all stakeholders by fostering a culture of innovation, service, and customer satisfaction.
Limitations
While this research investigates 123 firms representing a significant percentage of the U.S. economy over a period of 5 years, the results are nonetheless from a single country. Research is needed to confirm these findings across other countries and cultures to assure generalizability.
Additionally, this research investigates a single measure of firm performance: abnormal stock returns. Other measures of firm performance (e.g., market share, revenue, profit, etc.) should be investigated.
Finally, while this investigation offers compelling evidence highlighting the significant link between customers’ perceptions of innovation and future stock market performance, it does not establish causality. Where possible, researchers should develop causal tests for the innovation-firm performance relationship.
Conclusion
In conclusion, this investigation provides compelling evidence that innovation as perceived by the consumer and changes in customer satisfaction levels over time impact firm financial performance. Moreover, the economic value of the impact is managerially significant. As a result, researchers should investigate the underlying mechanisms that drive customers’ perceptions of firm innovativeness to help guide managers and investors, and to create new knowledge. Managers should measure, manage, and monitor customer perceived innovation for their firms and their competitors to identify opportunities to differentiate their offerings, enhance customer satisfaction, and ultimately improve financial outcomes. Finally, by including perceptions of firm innovativeness in their evaluations of firms, investors may improve their likelihood of positive abnormal returns while fostering an environment that prioritizes innovation and customer satisfaction, thereby benefiting all stakeholders.
Supplemental Material
Supplemental Material - Customer Perceptions of Firm Innovativeness and Market Performance: A Nation-Level, Longitudinal, Cross-Industry Examination
Supplemental Material for Customer Perceptions of Firm Innovativeness and Market Performance: A Nation-Level, Longitudinal, Cross-Industry Examination
Footnotes
Declaration of Conflicting Interests
The author(s) declared no potential conflicts of interest with respect to the research, authorship, and/or publication of this article.
Funding
The author(s) received no financial support for the research, authorship, and/or publication of this article.
Supplemental Material
Supplemental material for this article is available online.
Notes
Author Biographies
References
Supplementary Material
Please find the following supplemental material available below.
For Open Access articles published under a Creative Commons License, all supplemental material carries the same license as the article it is associated with.
For non-Open Access articles published, all supplemental material carries a non-exclusive license, and permission requests for re-use of supplemental material or any part of supplemental material shall be sent directly to the copyright owner as specified in the copyright notice associated with the article.