



Abstract

Reprinted with permission © 2018 Caglecartoons.com

As 2017 came to an end, the popular story was that the U.S. economy was doing very well. On December 9, The New York Times, under the headline, “Sizzling Economy Heightens Fears of Overheating,” told its readers that “The economy’s vital signs are stronger than they have been in years.” And in its December 14 edition, The Economist reported that “America’s economy is in good shape.” 1
These stories had some empirical foundation. The unemployment rate was down to 4.1 percent. The stock market and corporate profits were soaring to record heights. Family incomes, including those of low-income families, were increasing sharply. In the second quarter of 2017, Gross Domestic Product (GDP) had grown by 3.1 percent, and then by 3.2 percent in the third quarter. Neither the Times nor the Economist attributed the favorable conditions of 2017 to the ascension of Donald Trump to the presidency, seeing the year’s economic record as a continuation of the trend well established in the Obama years.
“Good” and “well,” however, are relative concepts. Seen against the backdrop of the Great Recession and the slow economic recovery of subsequent years, a GDP growth rate of just over 3 percent does look good, if not great. By other standards, this is not so good, even if sustained for more than those two quarters of 2017. During the decade-long economic expansion of the 1990s, the average annual growth rate of GDP was 3.6 percent. And in the nine-year expansion of the 1960s, the annual rate was 4.6 percent. Indeed, even with the growth in 2017, the economic expansion since 2009 has been slower than in any other expansion since World War II. 2
Still, as of the end of 2017, the expansion had been going on for 102 months, the third longest expansion on record—exceeded in length only by those expansions in the 1990s (120 months) and the 1960s (106 months). 3 Given the severity of the economic downturn in 2008 and 2009—when it appeared that the economy was about to implode—and the limited fiscal stimulus that was provided by the federal government to restart the economy, it is reasonable to ask, “Why has the economy done as well as it has? Why has the debacle of the Great Recession been, at least to a degree, overcome?”
Why Has the Recovery Continued So Long?
Part of the answer, ironically, is that the expansion has continued for so long because it has been so slow. U.S. expansions have generally been driven by rising demand, often supplied by the government through tax cuts or increased spending. Government spending, though insufficient to stimulate a strong recovery (as we will explain), did contribute significantly to the initiation of recovery in late 2009 and 2010. But as this stimulus ebbed, continuing expansion relied on low costs.
With slow growth, there has been minimal upward pressure on labor costs. Even with the unemployment rate close to 4 percent at the end of 2017, wages are only rising slowly. As has become increasingly evident, however, the unemployment rate is not such a good measure of labor market conditions. The unemployment rate measures the people who do not have jobs and are looking for jobs as a percentage of the labor force, and the labor force is defined as people who have jobs plus those who are looking for jobs. In the Great Recession, many people simply gave up looking for jobs and are not counted as in the labor force. The percentage of people sixteen years and older in the labor force—the labor force participation rate—dropped from a pre-recession peak of 66.4 percent (December 2006) to 62.5 percent in late 2015 and stood at only 62.7 percent in October and November of 2017. 4 Although there are reports of “discouraged workers” reentering the labor force as the economy has expanded, these data suggest that there are still many capable people who are not looking for employment.
If the labor force participation rate had remained at its December 2006 level, then, with the number of jobs that existed in November 2017, the unemployment rate would have been over 9 percent. Under these conditions, workers’ bargaining power and ability to push up wages are less than that indicated by the official unemployment rate. And the slow growth of wages has probably been one of the most important factors contributing to the length of the expansion. (The sharp rise in family incomes, mentioned previously, has been primarily a result of more people working, not the result of higher wages.)
5
Another part of the answer as to why economic growth in the United States has continued so long is that commodity prices fell and remained low—that is, prices of basic raw materials, everything from copper and oil to soy beans and corn. Low commodity prices, like low labor prices, contribute to low costs of production. In 2017, the Bloomberg index of commodity prices was about 50 percent lower than it was in 2011, just after it had recovered from the Great Recession.
6
Slow growth in the United States, while not the main factor, has contributed to keeping down the price of commodities. Also, similarly slow growth in Europe has been a factor. But perhaps the most important factor has been the slowdown of economic growth in China. GDP in China grew at 9.4 percent in 2008 and 2009, rose to 10.6 percent in 2010, but has since dropped in each year and was down to 6.7 percent in 2016.
7
One commodity price, the price of oil, has been especially important. Before the Great Recession, the per barrel price of oil had risen to $100 in 2008; it fell during the recession, recovered briefly, and then plummeted to $43 in 2016. As with commodities in general, the low oil price has allowed firms to grow. A major factor pushing oil prices lower was the great increase of oil production (supply) in the United States, which rose by almost 90 percent between 2006 and 2016. In addition, the rapid increase in production of natural gas, rising by close to 50 percent in the 2006 to 2016 decade (fracking) put downward pressure on the price of energy. 8
And then there are interest rates. Responding to the emergence of the Great Recession, the Federal Reserve, using its authority to control the money supply and interest rates, began to push down interest rates. The federal funds rate is the rate at which banks borrow short-term from each other and is the rate most directly affected by the Fed. This rate, in turn, affects interest rates throughout the economy. The federal funds rate dropped from about 5.25 percent in the middle of 2007 to 2 percent by the middle of 2008 and was virtually zero by the beginning of 2009. The Fed only began raising the rate in small increments at the end of 2015, and it remained below 2 percent in late 2017. 9 When inflation is factored in, through most of the period since early 2009, the “real” federal funds rate has been zero or negative, so the cost of borrowing was very low throughout the economy.
Interest rates, like wages and commodity prices, are part of the cost of production. This collection of cost factors has been sufficient to keep the economy growing—though growing slowly.
It is somewhat surprising, however, that the uncertainty created by the Trump presidency and the threatened disruption of economic conditions has not had visible negative impacts on the growth of GDP. At this point, it is only possible to speculate as to why the uncertainty surrounding the Trump presidency has not brought about a negative economic impact. It is likely, however, that the negative impact has been tempered by two factors. First, while concerned about the uncertainty, most business officials have long railed against taxes and regulations. On these two important issues, the uncertainty has been largely over the extent of reductions, and any reduction would be positive in the minds of business officials. With passage of the tax bill and the record on deregulation, their hopes have been realized. Second, on some other aspects of uncertainty—particularly surrounding international trade agreements—it is likely that business officials did not believe that Trump would bring about changes to the extent he threatened during the campaign.
Why Has the Recovery Been So Slow?
Although the economy has grown, it has grown remarkably slowly. This slow growth has been in large part a consequence of government actions.
As the Great Recession emerged in the United States at the end of 2007 and beginning of 2008, the political choice of Congress and President Bush was to do virtually nothing to provide a fiscal stimulus—that is, to boost total spending in the economy by raising government spending or lowering taxes or both. Treating the crisis primarily as a financial crisis and fearing that the financial system would collapse, government officials focused on providing loans to bail out financial institutions. By late 2008, the financial system was saved (with the important exceptions of Bear Stearns, Lehman Brothers, and some relatively small banks). But by this point, the declines in production and employment were in full swing.
Within a month of taking office in January 2009, President Obama’s American Recovery and Reinvestment Act (ARRA) was enacted (with support of only three Republicans in the Senate and none in the House). The Act, though providing $787 billion in new spending, was too little to provide the sort of stimulus that was needed. Although the ARRA did contribute to the cessation of economic decline by the middle of 2009, recovery was slower than it would have been with a larger stimulus. Not only were private firms cutting their workforces and holding off on new investment and employment, but across the country, state and local governments, experiencing sharp drop-offs in revenue, were eliminating jobs. The depth and breadth of the recession suggest that a federal stimulus some 50 percent larger than the ARRA would have been needed to set the economy on course for an effective recovery. 10
The Federal Reserve, as noted earlier, provided more support for economic growth by lowering interest rates to historically unprecedented levels. But this had limited impact. Low interest rates are supposed to spur investment and economic growth, as the lower cost of credit is expected to lead firms to borrow, invest, and generate expansion. Following 2009, net private investment (i.e., investment other than replacement of old capital equipment and facilities) did grow, but only slowly—as shown in Figure 1. By 2015, net private investment (inflation adjusted) was still 20 percent below the 2006 level and fell off 14 percent between 2015 and 2016. In the wake of the mortgage crisis of the last decade, residential investment has been especially weak. However, nonresidential investment (new machinery and buildings) also has not risen to pre-recession levels, and the 2016 fall-off was all in nonresidential investment. 11
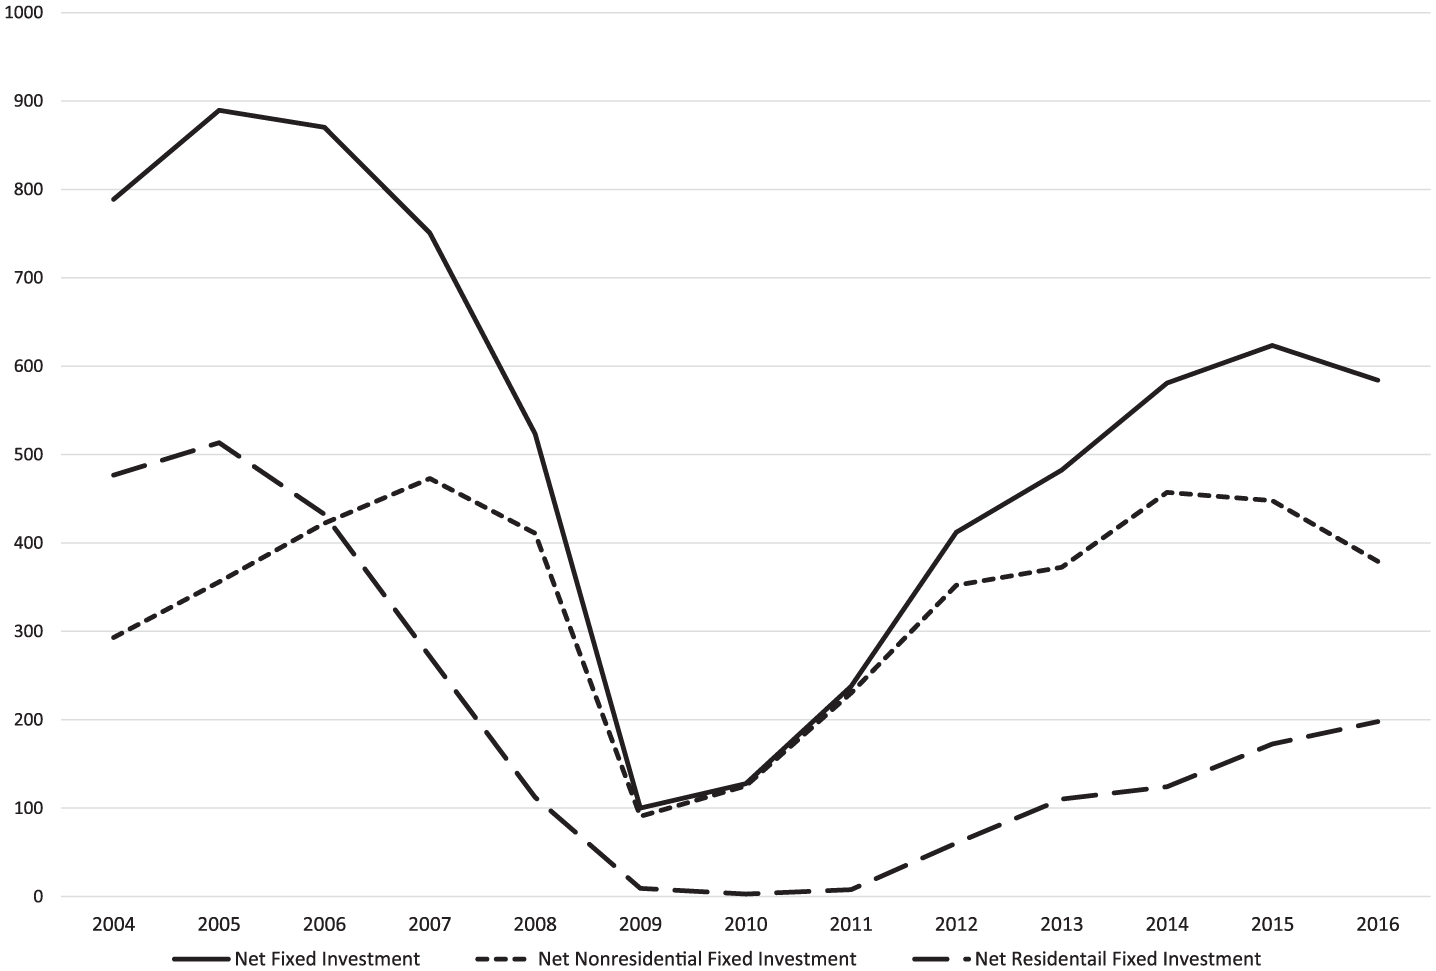
Net fixed private investment, 2004-2016, billions of 2009 dollars.
The experience since the Great Recession indicates that lower financing costs, even when combined with other low production costs, are insufficient to generate a strong surge of investment when total spending or aggregate demand is weak. Economists sometimes liken the situation to pushing on a string: if you push on the back end of the string without anyone pulling on the front end, the string will not move forward. Demand is what pulls the economy forward.
The large and rising amount of cash and liquid assets that U.S. firms are holding provides further evidence that investment, nonresidential investment in particular, is not constrained by a lack of funds. In May of 2017, the rating agency Standard and Poor’s (S&P) reported that cash and liquid investments held by U.S. firms “rose by 10 percent to $1.9 trillion in 2016 as the rich got richer.” S&P goes on to say that $1.1 trillion of this is held overseas, with the remaining $800 billion held in the United States. 12 Other sources indicate that in total U.S. firms were holding $2.6 trillion overseas. 13 Stronger demand would surely have led firms to use these assets—certainly a share of the $800 billion held in the country—for more real investments that would boost economic growth and create jobs.
Government investment—in particular, in infrastructure—has also been weak. During the recovery from the Great Recession, public investments by federal, state, and local governments have declined substantially. In 2013, 2014, and 2015, the levels of public investment (inflation adjusted) were 14 percent to 15 percent below their 2009 peak, and were lower than in any year since 2001. 14 Combined with the weakness of private investment, these figures show that investment was not driving growth of the economy—to say nothing of failing to provide a strong foundation for long-term growth.
Moreover, after 2010, when the ARRA had had most of its impact, total government spending (inflation adjusted) fell continuously to 2014. Although this spending rose slightly in 2015 and 2016, it remained below pre-recession levels. In almost all post-World War II recoveries, government expenditures have increased. 15 Also, since 2012, with weak government spending, the federal budget deficit as a percent of GDP (one measure of federal stimulus) dropped to levels similar to those of the mid-1980s and early 1990s—about 4 percent or a little less. 16 As expressed in the Economic Report of the President in January 2017 (the last report of the Obama years), “Fiscal restraint in the United States continued in fiscal year 2016.” 17
“Fiscal restraint,” under the existing circumstances, is simply a euphemism for austerity. Slow economic growth, a continuing weak labor market, relatively stagnant wages, and growing inequality are all signs that the federal stimulus at the time of the Great Recession should have been greater and continuing stimulus should have been the order of the day in subsequent years.
Furthermore, the shift of government’s role in public investment is not simply a phenomenon of recent years, but is evident in a comparison of the current period with earlier decades. For example, gross government investment (federal, state, and local) in the 2010 to 2016 period averaged 3.7 percent of GDP; in the 1950s and 1960s, the figure was greater than 6 percent, close to 5 percent in the 1970s and 1980s, and just over 4 percent in the 1990s and 2000s 18 (see Figure 2). While the decline has thus been long term, regarding the most recent period, the Financial Times commented in a 2013 article: “Public investment in the U.S. has hit its lowest level since demobilisation after the Second World War because of Republican success in stymieing President Barack Obama’s push for more spending on infrastructure, science and education.” 19

Gross and net government investment as a percent of GDP, 1950s to 2010-2016.
All this is to say that the growth of the economy over the past nine years did not have to be so slow. The recovery was kept weak by political choices, choices about government stimulus and government investment, and about a variety of policies that limited wage growth and exacerbated economic inequality. 20
Inequality and Economic Growth
The expansion of the economy (GDP), whether slow or fast, does not tell us much about people’s actual economic conditions. As is well known, economic inequality has been increasing in the United States for decades. 21 The economic conditions of people in the bottom half of the income distribution have stagnated, or even declined. At the same time, the material conditions of the top 1 percent have skyrocketed. In 1975, the bottom 50 percent received 20.2 percent of pre-tax income, while the top 1 percent obtained 10.5 percent. By 2006, with inequality rising almost steadily, the share of the bottom 50 percent was only 13.5 percent and the top 1 percent was getting 20.1 percent. 22 According to French economist Thomas Piketty and his colleagues, government redistributive actions have offset only a small fraction of the increase in pre-tax inequality. 23
The long-term trend of rising economic inequality has continued in recent years. Between 2008 and 2016, the household Gini ratio (a standard measure of inequality) rose from 0.466 to 0.481 (an annual rate of increase only slightly lower than the rate of increase since 1975). 24 Slow economic growth has maintained a weak labor market, which tends to undermine workers’ bargaining power and limit wage growth. Thus, the slow growth in the recovery has certainly been a major factor contributing to rising inequality.
The ethical and social problems of such a high degree of inequality are myriad. Here, however, we want to emphasize that just as slow growth of GDP has contributed to inequality, inequality tends to undermine the growth of GDP. With the publication of their 2014 study, the International Monetary Fund (IMF) joined the growing consensus among economists that inequality tends to have a negative impact on economic growth. 25 Central points of the IMF study explaining this negative impact can be summarized as follows:
Highly unequal societies tend to produce highly unequal health and education systems, which leads to lower rates of productivity increases. In addition, great inequality generates high levels of stress, which is detrimental to health outcomes across society. 26
Great economic inequality generally yields political polarization, which, in turn, creates a degree of instability and uncertainty in political affairs (as witness the situation in Washington, D.C., in recent decades). This uncertainty—having its practical manifestation in tax policy, regulations, and other aspects of economic policy—weakens investment.
This political polarization, which has its roots in the breakdown of social solidarity associated with extreme economic inequality, makes it difficult for the political authorities at all levels to respond to economic shocks—most important, the emergence of recessionary indications.
Beyond these growth-inhibiting forces mentioned by the authors of the IMF study, additional factors include the weakness of consumer demand resulting from inequality, as higher income people tend to spend a lower share of their income than do people with low incomes, 27 and the increasing political power of the rich, who tend to support the financial excesses (e.g., the deregulation of banking) that can lead into growth-disrupting crises. 28
Globalization and technological change, often cited as causes of rising inequality, have played their roles. In today’s world, when workers demand higher wages, they can often be replaced by lower wage workers abroad or by machines (including robots). Yet, it is clear that more is involved. European countries have been exposed to the same global and technological forces. Yet, they have generally experienced a significantly lesser increase of inequality. Indeed, by way of example, as Thomas Piketty and his co-authors have pointed out, in the years of the twenty-first century, “The bottom 50 percent of income earners makes more in France than in the United States even though average income per adult is still 35 percent lower in France than in the United States . . .” 29
Important for our story here, it is apparent that political actions have played a substantial role in bringing about rising inequality. Globalization and technological change are relevant, but to an extent, these forces are shaped by political decisions—the particular structure of international trade and investment regulations in particular. Also, and essential, the government has shaped many markets in ways that exacerbate inequality. Examples include the strengthening of patents and copyrights, limiting financial regulations, and limiting the enactment and enforcement of regulations on business (now exacerbated by the Trump administration).
And, especially important from our perspective is the way the government has affected the labor market. At several points in recent decades, the federal and state governments have taken actions that have weakened unions and contributed to their declining membership. Under Republican administrations, appointees to the National Labor Relations Board (NLRB) have undermined unionization. As a result, for example, with weak enforcement of labor law by the NLRB, the likelihood that workers attempting to organize unions in their workplaces would be illegally fired rose substantially in the period since 1980. 30
At the state level, direct actions to weaken unions and prevent wage increases have been widespread. Several southern states have had “right to work” laws in place for decades, and recently, other states have enacted such laws. In 2011, the attacks on unions in Wisconsin highlighted this trend. In many cases, where authorities in cities and towns have enacted pro-labor regulations, state governments have overridden (“pre-empted”) those local regulations. On issues ranging from raising minimum wages to mandating paid leave to establishing fair scheduling, since 1997, twenty-six state governments have overridden local actions a total of sixty-seven times, with fifty-five of these pre-emptions coming since 2011.
31
Political actions, by increasing inequality, have in this way weakened the foundations of economic growth. Furthermore, an important aspect of these inequality-exacerbating actions has been the weakening of unions. The relationship between union strength and the distribution of income is illustrated in Figure 3. Over the last century, when union membership as a percentage of the labor force is high, income inequality is relatively low. And low union membership is associated with high inequality.

Union membership as share of labor force and share of income going to the top percent, 1917-2014.
This connection between union membership and income inequality is partially direct, as unions are able to gain a larger share of income for their members and also as unions tend to promote government policies that support low-wage workers—for example, a higher minimum wage. Rising inequality, however, also has other causes—slow growth in itself, as we have pointed out, tends to weaken workers’ bargaining power regardless of unionization and thus exacerbates inequality. Also, the decline in union membership since the 1960s has had some other causes beyond political decisions (e.g., the decline of manufacturing, which has been in part due to globalization and technological change). Nonetheless, the connection from political actions to weakening unions to greater inequality is clear.
The Economy and Political Choices
Capitalist economies, and the U.S. economy in particular, have a strong capacity for economic growth. What has been unusual about the expansion that has taken place since the Great Recession of 2008 and 2009 is not that growth has taken place, but that it has been so slow. Indeed, as we have pointed out, this expansion has been slower than any other in the post-World War II era. On the other hand, although slow, the expansion has been relatively long, and at this writing, substantial signs of an end to the expansion have not yet appeared.
For us, the lesson that comes out of a review of economic experience since the severe 2008-2009 recession is that political choices play a major role in determining the course of the economy. These choices operate through policies explicitly directed at economic growth and through policies that affect growth by their impact on economic inequality. Forces beyond direct political control—the long-run integration of the world economy and aspects of technological change—are also relevant, but they do not remove the role of political choices. Which is to say: there are alternatives.
Footnotes
Declaration of Conflicting Interests
The author(s) declared no potential conflicts of interest with respect to the research, authorship, and/or publication of this article.
Funding
The author(s) received no financial support for the research, authorship, and/or publication of this article.