
Abstract
When service firms are challenged by their aging brands to become “innovation oriented,” they depend in part on key organizational competencies, such as employee competency and market orientation. These competencies are at the core of innovation in a service firm such as a hotel or a restaurant franchise. An innovation-oriented service franchise knows how to listen to its employees and customers; however, choosing which customer or employee to listen to might be paramount to finding radical innovative ideas. Learning from the past, this article investigates sources of innovation in the hospitality industry and tests the lead-user method borrowed from the manufacturing industry to extract innovative service ideas from the market before they materialize as competing market offerings. Using a downtown hotel as an empirical example, this study shows that not only are innovative service ideas present in the marketplace, but also that the best ideas most likely exist within the minds of current and past dissatisfied clients, the latter of which is often referred to as “service defectors.”
“It is the customer who determines what a business is, what it produces, and whether it will prosper.”
Introduction
With services now dominating the global economy (Berry, Shankar, Parish, Cadwallader, & Dotzel, 2006), competition is fierce and differentiation through innovation is paramount (Ottenbacher, 2007). Incremental innovations no longer suffice to acquire new customers, but radical, or breakthrough service innovations are now needed. Despite its economic importance (Berry et al., 2006; Menor, Tatikonda, & Sampson, 2002), the service sector remains underresearched by analysts of innovation (Ottenbacher & Gnoth, 2005; Tether, 2003). Services are seen as innovation “laggards” (Miles, 1993), with weak intellectual protection (Howells, 2000), and R&D spending growing only in technology intensive service companies. Innovative ideas capable of creating new markets (Berry et al., 2006), come much more sporadically once the company is in the growth phase (Price, 1997). Past the initial innovative creation phase, the service firm, seeking controlled rapid growth, imposes on each unit of its chain a set of standard operating procedures that allows for high client satisfaction but stifles the creativity needed to generate radical ideas. Service firms that adapt well to the dynamics of the market are more likely to have an orientation toward innovation. The challenge of becoming “innovation oriented” depends in part on key organizational characteristics such as employee competency and market orientation (Siguaw, Simpson, & Enz, 2006).
Employee competency seems to be required at high levels of the organization (i.e., CEO), as evidenced by examples of innovation in hospitality that seem to be significantly affected by individual outstanding “champions,” but disappear once the champion moves on to a new job (Enz & Siguaw, 2003). A case can be made that once the CEO leaves, although the innovation stays (e.g., Heavenly beds at Westin, Filet-O-Fish at McDonald’s), the innovation orientation may be weakened.
It is suggested that market orientation (Narver & Slater, 1990), for its part, may be an antecedent to a firm’s innovative output (Siguaw et al., 2006). Firms that listen to their customers using voice-of-the-customer techniques such as surveys and focus groups, and that routinely scan the market for intelligence, are better at being innovative (Urban & Hauser, 2004).
This article argues that listening to the customer can be of strategic importance for the future of hospitality firms as well as service firms in general. A large majority of innovation has come from entrepreneurs who were dissatisfied as customers, not industry experts. These customers-entrepreneurs reside at the forefront of innovation and often create disruptive services that become market changers.
Learning from the past, this article investigates the sources of innovation in the hospitality industry and tests a method borrowed from the manufacturing industry to extract innovative ideas from the market before they materialize as competing market offerings.
We show that not only are innovative service ideas present in the marketplace, but also that the best ideas most likely exist within the minds of current and past dissatisfied clients, the latter of which is often referred to as “service defectors” (Reichheld, 1993, 1996; Reichheld & Sasser, 1990).
Sources of Innovation in the Hospitality Industry
With possibly the exception of a few, such as E. M. Statler, 1 most innovators seem to originate from outside the hospitality industry, having diverse backgrounds (e.g., bankers, architects, realtors, home builders, and sales people). One common characteristic unites these innovators: they were all customers who became so dissatisfied by their experience that they decided to create their own hotel or restaurant to satisfy their unmet needs. Some of the most innovative ideas in well-established franchises, such as Starbucks’s Frappuccino or McDonald’s Egg McMuffin, came from customers, employees, or franchisees rather than the corporate R&D department (Kroc & Anderson, 1977; Schultz & Yang, 1997). Examples of hotel or restaurant customers turning entrepreneurs are prevalent in the last 100-year history of hospitality (American Hotel & Lodging Association, 2009).
In fact, 60% of the top 10 hotel corporations in the world, representing 65% of the world industry, have been created by entrepreneurs who did not receive any formal training in hotel management. Similarly, 80% of the top 10 restaurant concepts were brought to market by “non-restaurateurs” (see Table 1).
Analysis of the Sources of Innovation in the Top Service Concepts
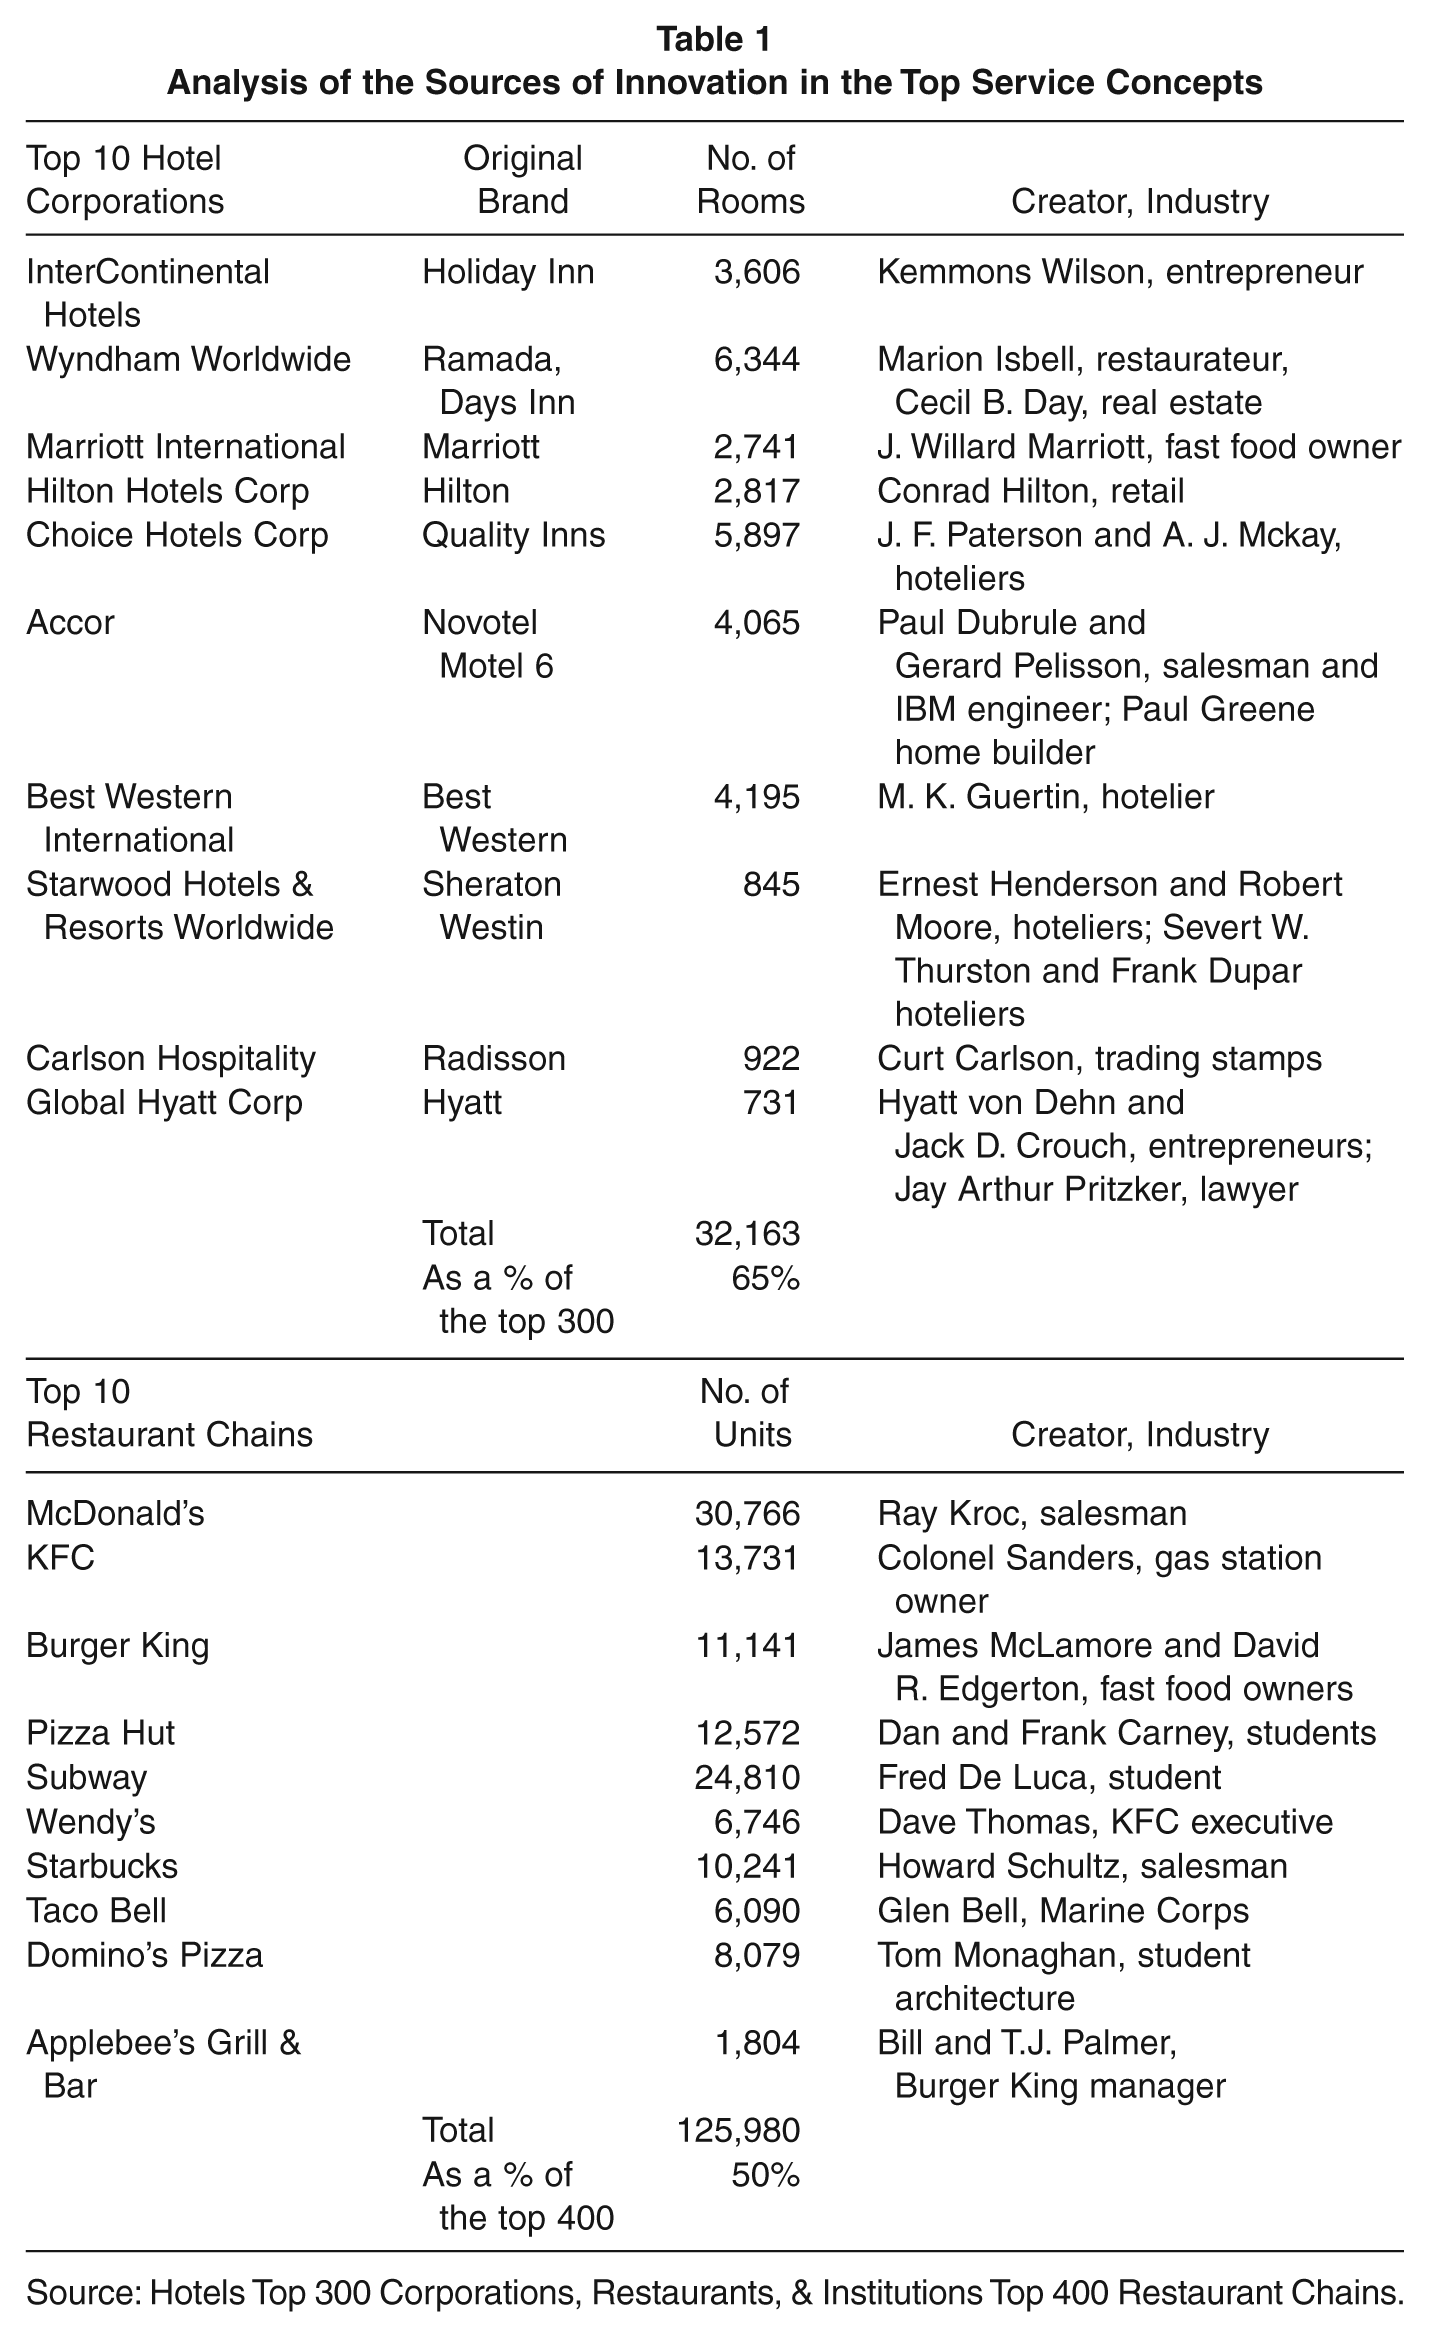
Source: Hotels Top 300 Corporations, Restaurants, & Institutions Top 400 Restaurant Chains.
These astonishing numbers are also fairly consistent with innovative service practices as evidenced by the Siguaw, Enz, Kimes, Verma, and Walsh’s (2009, 2010) two-part report: “Cases in Innovative Practices in Hospitality and Related Service.” More than 47% of these current innovative practices have been created by entrepreneurs outside of the hospitality industry who were more often than not disappointed by their previous experiences.
These innovators fit Eric von Hippel’s (2005) description of a particular category of customers called lead-users. We will first review the characteristics of lead-users and argue that industry examples cited above fit the profile depicted by von Hippel; then we will argue, in light of the current literature, that potential lead-users can be identified in the service industry by seeking dissatisfied customers, service defectors, and frequent service switchers with high level of industry knowledge.
Lead-Users
Lead-Users Characteristics
Lead-Users have four specific characteristics and motives (Lüthje, 2004, von Hippel, 1986). First, they have a strong personal need that is ahead of the marketplace; and will become a general market need, months or years later. Second, they are positioned to personally benefit significantly from their ideas, hence motivating them to create a solution to their problem. Third, they are willing to share their ideas freely. Finally, they have sufficient knowledge of the industry, or alternatively of an analogous industry, to be able to technically produce their innovation.
Lead-users also exhibit characteristics such as opinion leadership and innovativeness (Rogers, 2003). In that respect, lead-users are ahead of the diffusion curve. Numerous studies of major innovations created by users have been identified in industries as diverse as scientific instruments (von Hippel, 1986), semiconductors (Urban & von Hippel, 1988), windsurfing (Franke & Shah, 2003), software development (Weber, 2004), and sporting goods (Piller & Walcher, 2006). Between 9.0% and 37.8% of innovations in these industries are attributed to lead-users (von Hippel, 2005).
Thus, we hypothesize that potential lead-users will be found within the group of dissatisfied customers, left with unmet needs they seek to fulfill and are willing to share with the service provider.
Hypothesis 1: Dissatisfied customers will produce better innovative service ideas than satisfied customers.
Identifying Potential Lead-Users
Given the unique service context of intangibility and co-creation, it is typically not be possible to detect lead-users in the process of creating service prototypes before they actually become implemented, more likely by competitors. At this point, it might be too late for the incumbent service provider to capture the innovative idea, develop it, and market it. Hence, capturing the ideas in the mind of a creative customer needs to be timely and needs to use a specific process of identification.
This article proposes that the probability of detecting potential lead-users or innovative customers is greater when tapping into the service provider’s defectors as a primary source.
Why Would the Most Innovative Customers Be Defectors?
Customers’ innovative service ideas are triggered either by their unmet needs and/or by their knowledge of an analogous service at an alternative provider that was most likely acquired via switching behavior and motivated by variety seeking tendencies.
Although ordinary users have been shown to have innovative ideas (Magnusson, 2009), they often lack the technical knowledge to implement them. Capraro, Broniarczyk, and Srivastava (2003) observe that the level of knowledge about alternatives advances the understanding of (lack of) defection. For instance, it helps to explain why dissatisfied customers sometimes do not defect. If they simply have a lower level of knowledge about alternatives, this would explain why dissatisfied customers may not defect.
Research has shown that consumer knowledge is intimately linked to search behavior (Moorman, Diehl, Brinberg, & Kidwell, 2004) and switching behavior.
Switching Behavior
An examination of the service-switching literature (including the literature subsumed under the umbrellas of “loyalty,” “customer retention,” “service quality,” and “satisfaction” research) reveals that the most commonly studied predictors of service provider switching include “transactional” variables such as quality, satisfaction, switching costs and alternative attractiveness, and “relationship” variables such as customer commitment and trust.
Satisfaction and the conceptually close construct of service quality have received the most attention in this research. As Jones, Mothersbaugh, and Beatty (2000) point out, the primary empirical and conceptual focus in customer retention research has been on satisfaction, yet the predictive abilities of this variable have shown considerable variability across studies. There is abundant evidence that quality, the consumer’s overall impression of the relative superiority of the service (Taylor & Baker, 1994), and satisfaction, “the summary psychological state resulting when the emotion surrounding disconfirmed expectations is coupled with the consumer’s prior feelings about the consumption experience” (Oliver, 1981, p. 27), is related to switching intentions (e.g., Cronin & Taylor, 1992; Taylor & Baker, 1994). The higher the perceived quality and the more satisfied the customer, the less likely he or she is to switch service providers.
Two other predictors that have received considerable attention are switching costs and alternative attractiveness. Switching costs are “the perceived economic and psychological costs associated with changing from one alternative to another” (Jones et al., 2002, p. 441). Burnham, Frels, and Mahajan (2003) found evidence of eight types of switching costs: economic risk costs, evaluation costs, learning costs, set-up costs, benefit–loss costs, monetary loss costs, personal relationship loss costs, and brand relationship loss costs. As switching costs increase, the likelihood that customers will switch service providers decreases (Bansal, Taylor, & St. James, 2005; Burnham et al., 2003; Ping, 1993). The attractiveness of alternatives to a customer’s current service provider may also influence his/her intentions to switch service providers. (Bansal et al., 2005; Ping, 1993). The more attractive the alternative service providers, the more likely customers are to switch.
Recently, researchers have begun to include “relationship variables” in their service switching models; the most prominent being customer commitment and trust. Customer commitment is defined as a “force that binds the consumer to the service-provider out of desire” (Bansal, Irving, & Taylor, 2004, p. 238) or an individual’s “psychological bond” (Gruen, Summers, & Acito, 2000, p. 37) with a service provider. Trust refers to the consumer’s feeling that the seller will fulfill promises (Morgan & Hunt, 1994). There is growing evidence that commitment and trust drive switching intentions and behaviors (e.g., Bansal et al., 2004; Gruen et al., 2000).
Although much of the extant research would suggest that evaluative responses (service quality and satisfaction) are likely the primary drivers of customer defection (e.g., Cronin, Brady, & Hult, 2000; Jones et al., 2000; Keaveney, 1995; Susskind, 2005), there is growing evidence that this may not always be the case. Capraro et al. (2003) argue that “satisfaction explains a relatively small proportion of variance (less than 8%) in repurchasing behaviors” (p. 164). Recently, several researchers (Bansal et al., 2005; Burnham et al., 2003) found that variables that facilitate the decision to switch (such as switching costs) play a more important role than quality and satisfaction do in customer defection.
In particular, Burnham et al. (2003) have conceptualized the experience with a particular product domain in the study of switching cost perception. These authors have shown that domain expertise is an antecedent to consumer switching behavior when the expertise is high and leads to higher mental structures, making encoding and retrieval easier and faster, while reducing the perception of uniqueness of an existing provider, hence weakening the strength of the current relationship.
Studies have found that a vast majority of consumers fail to act through a complaint (Chebat, Davidow, & Codjovi, 2005). Switching cost perception is suggested as a reason for consumers to take no action (complaints or switching) when dissatisfaction occurs (Day & Landon, 1977; Singh, 1988). However, Chebat et al. (2005) argue, in light of the cognitive–emotive theory (Lazarus & Folkman, 1984), that some consumers with low levels of assertiveness will not seek redress via complaint behavior because they might perceive the cause of service failure to be outside of the control of the provider. Thus, these consumers seem to rationalize that it is not worth mobilizing their energy for a confrontation with the firm.
Therefore, it is possible for a customer to defect to a new service provider because he or she is dissatisfied not with the current level of performance of the service provider, but rather with the existing gap between the current provider and the best provider he or she is aware of in the marketplace. In some cases, we argue that the customer switches in hope of finding a better provider that will satisfy his or her unmet needs, knowing that the possibility of not finding a better service is entirely possible. This behavior would be consistent with variety seeking, a personality trait often associated with innovators and early adopters also identified as a cause for switching (Keaveney, 1995; Keaveney & Parthasarathy, 2001).
Variety-Seeking Behavior
Variety seeking is defined as “the tendency of individuals to seek diversity in their choices of services and goods” (Kahn, 1995, p. 139). It has been linked to the underlining reason for varied consumption (Givon 1984; Menon & Kahn, 1995) and identified as a cause for switching (Keaveney, 1995; Keaveney & Parthasarathy, 2001). Variety seeking is a cognitive need for stimulation (Ratner, Kahn, & Kahneman, 1999) or curiosity (Raju 1980). Huber and Reibstein (1978) suggest that consumers seek variety because they are not able to find a single option that contains all of the attributes of an ideal product.
The literature focusing on the explanation of variety-seeking behavior can be summarized into two streams of research: variety-seeking behavior is the result of some other motivation (derived) or is a motivation in and of itself (direct).
If derived, varied behavior is either an artifact of multiple needs (multiple use of the same purchase, multiple users within the same household, multiple situations leading to varied behaviors) or of changes in the choice problem (changes in constraints or taste, changes in alternative availability). More pertinent to our discussion, if variety-seeking behavior is direct, then it is inherently rewarding (variety seeking leads to an optimum level of stimulation). Inherent rewards have been hypothesized to be both intrapersonal and interpersonal (McAlister & Pessemier, 1982).
Three components seem to be the basis of intrapersonal direct motives for varied behavior: the desire of the unfamiliar, the desire for information, and the desire for alternation among familiar alternatives (McAlister & Pessemier, 1982; Raju, 1980).
Among the interpersonal motives for variety seeking, authors have outlined the desire for group affiliation or individual identity. The obvious link between the desire for social distinctiveness and a tendency to buy “new products” was affirmed by Szybillo (1973). Fromkin (1976) suggests that innovators are expressing the desire to see themselves as different from their peers in a socially acceptable way (McAlister & Pessemier, 1982).
Whether the consumer’s motives are intrapersonal or interpersonal, the variety-seeking behaviors will likely result in the early adoption of a new product/service. This is consistent with previous research (Franke & Shah, 2003; Morrison, Roberts, & Midgley, 2004; Urban & von Hippel, 1988). Variety seeking can, therefore, be a characteristic shared between early adopters/innovators and innovative users.
Users with high levels of consumer knowledge and variety-seeking tendencies will resort to frequent switches to search for a satisfactory provider. At the same time, the most creative of these users, faced with unmet needs, will more likely be in a better position to create solutions to their problems and become true lead-users.
In conclusion, unmet needs might, in the most settled cases, trigger a decrease in expectations with no expressed dissatisfaction, or in the most severe cases, despite the service provider’s best efforts (i.e., the service was “perfect” from the firm’s perspective), trigger a switching behavior that might or might not be preceded by expressed dissatisfaction. It is, therefore, not surprising that customer satisfaction models have always some unexplained reason for dissatisfaction and switching behavior, implying that no matter what the firm does to address the situation, the needs of these customers are not met. These customers have a high probability to carry unmet needs and should be the object of systematic recruitment into an idea generation processes, as they potentially have the most innovative ideas. On the basis on this argument the following hypothesis is proposed:
Hypothesis 2: Defectors will produce better innovative service ideas than current customers.
These hypotheses are consistent with past research. For instance, Reichheld and Sasser (1990) assert that “customers who defect to the competition can tell you [the firm] exactly what parts of the business you must improve” (p. 107).
Using the Lead-User Method in the Hospitality Industry
Inviting Customers and Collecting Innovative Ideas
This study uses an electronic brainstorming (EBS) mechanism for extracting ideas from a random sample of customers. The EBS consists of a web-based bulletin board, where invited customers participate freely in idea generation for the host firm. Customers are invited by the firm they patronize (or have patronized in the recent past) and their participation is voluntary and anonymous.
Previous research has shown that the most creative customers tend to self-select in such idea forums (von Hippel, 2005). Their motivation ranges from material (i.e., gift certificate), to brand attachment, to altruism (Piller & Walcher, 2006). Several studies have shown the positive effect of incentives on the creativity and participation of creative users (Toubia, 2006). Sometimes the mere recognition gained via the process and the exposure is sufficient motivation (Hars & Ou, 2002; Hertel, Niedner, & Herrmann, 2003; Lakhani & Wolf, 2005).
Additionally, several methods have been tested to unleash more ideas by addressing blocking mechanisms such as: production blocking, or fear of evaluation, and uncreative strategies such as cheating or free-riding. EBS is such a method, allowing participants to stay anonymous, while giving ideas at their own pace (in an asynchronous session); hence, reducing production blocking and fear of evaluation (Nunamaker, Applegate, & Konsynski, 1987; Toubia, 2006).
A brief creative direction is given allowing the customer to “think-outside-the-box” and not let their domain knowledge limit their creativity. Examples are given such as the following:
Think of the hotel as a hospital. What should the hotel do to better serve you?
Think of the hotel as a private mansion, and you are a millionaire, what would exclusive service look like?
Evaluation of Ideas
Creations are often evaluated by a panel of experts (Amabile, 1982, 1996). The present research evaluates the ideas on the basis of the consensual assessment technique based on the following criteria:
Originality of the idea
Benefit of the idea to the customers
General appeal of the idea
Experts’ ratings are evaluated for level of agreement, and ratings can be averaged across raters (Rust & Cooil, 1994) once the reliability is equal to or greater than .70 (Boulding, Staelin, Zeithaml, & Kalra, 1993).
Following the scoring by experts of each idea, the most innovative idea can be determined by looking at the distribution of the ideas’ scores and by using a cutoff point along the Gaussian curve (Piller & Walcher, 2006).
Additionally, to separately evaluate the level of “radical-ness” of the idea (to the firm and to the industry), the panel will be asked to judge how radical they consider the idea to be.
Identification of Likely Defectors
Noncontractual services such as hotel and restaurants have a major drawback in the study of switching behavior; one can never know for sure if a customer has defected or not. Therefore, for the purpose of the present study, defection will be calculated in a probabilistic manner following research methods suggested by Schmittlein and Morrison (1985) and used by Kumar and Reinartz (2006) and many others (Fader & Hardie, 2009).
The formula used to classify customers is based on an underlying Poisson distribution of the population. Schmittlein and Morrison (1985) describe a simple and insightful test of the hypothesis that a customer is still alive:

where P is the probability of being “alive” or still a client of the firm, t is the time of last purchase, and n is the number of purchases by that individual in the period of study. Thus, a small P(Alive) value strongly suggests that the customer is no longer “active,” that is, a defector.
Establishment of a Cutoff Threshold for Classification
The threshold of choice in the classification literature is .5 (Reinartz & Kumar, 2000; Sharma, 1996). If the customers’ P(Alive) is greater than .5, they are assigned the status alive; otherwise, they are assigned the status defector. Recognizing that a .5 threshold might be suboptimal, Reinartz and Kumar (2000) conducted a sensitivity analysis over three periods, testing several cutoffs (from .1 to .9) on existing databases. After comparing the predicted classification to the actual state, they concluded that the threshold of .5 produced the highest percentage of correct classifications for the three samples (p. 23).
As a result, for the purpose of our analysis, we use .5 as the cutoff threshold. Using .5 as a threshold, as opposed to say .95 (as one would do under a strict hypothesis testing rule), allows us to missclassify (Type II error) some customers as defectors even if they have a high probability to be alive (for P > .5 and P < .95). For the purpose of the present study, the chances of finding alive customers in the defector group is less important than the small probability of having a defector in the alive group.
Data Collection
E-mail addresses were made available from the customer base of a mid-scale 262 room independent hotel property located in the U.S. mid-Atlantic area.
Two databases were combined to make the sampling frame. First, the past 12 months of unique records was extracted from the property management system resulting in 5,175 e-mail addresses. Because it is likely that customers failed to give complete contact information during the reservation process, or on check-in, the sampling frame was then augmented with a direct marketing list collected on the property website. As the general public has access to the property website, a cross-check between the two databases needed to be done. This avoided sending an invitation to customers who have yet to stay at the hotel (i.e., future reservations and simple information subscribers) and eliminated duplication of addresses between the lists. The final sampling frame resulted in 9,127 unique addresses. Thus, the sampling frame encompasses 21 months of the firm’s activity leading to a higher probability to include a representative sample of the hotel’s clientele.
A letter of introduction signed by the general manager was electronically sent to the sampling frame outlining the “idea contest” and giving an immediate reward for the survey participants in the form of planting a tree on their behalf (using a third party: http://www.plantabillion.org) for each response. A “grand prize” of a $400 Southwest Airline gift certificate was also listed to motivate the customers to engage in the idea generation competition.
A total of 273 completed surveys (a response rate of 4.43% of the 6,167 valid e-mail addresses) with participation in the idea generation were achieved. Participation in online surveys has gradually decreased over the years, and ranges from a low 9.4% to a high 31.4% (Deutskens, De Ruyter, Wetzels, & Oosterveld, 2004). The relatively low participation in the present experiment might be the resultant of several factors. First, hotel customers are not used to being involved in such a process. Some participants made comments such as, “why do you ask your clients for things that are obvious?” Second, the relatively “low-tech” and traditional setting of the hotel industry possibly frames the customers’ mind into not seeing the possible positive outcome of such an experiment. Finally, customers are possibly inundated by emails and similar survey requests on a daily basis and might not even have time to open them within the time required before the email is pushed to a lower level of visibility in the inbox and eventually gets forgotten or deleted “en masse.”
More relevant to the present study, lead-user studies have seen percentages of user involvement as low as 9% and as high as 38% (Lüthje & Herstatt, 2004; von Hippel, 2005). Given that these studies used a snowball sampling strategy to recruit innovative users, the involvement proportions are likely to be skewed toward a higher number of participation. Hence, this could explain the relatively low participation in this study.
Sample Characteristics and Classification as Defector
To evaluate the representativeness of the final sample, several tests were conducted. Taking the property’s year to date (including Quarter 3 and 4 of 2008 and Quarter 1 of 2009), customer satisfaction survey responses (the only demographic data available from the hotel), comparable means, proportions, and frequency distributions were assessed against the sample statistics.
The sample’s gender proportion (46.2% female, 53.8% male) was not significantly different from the property’s satisfaction survey (47.01% female vs. 52.99% male) and age frequency distributions were also not significantly different (see Table 2) using a chi-square test at an alpha level of .05.
Age Distribution
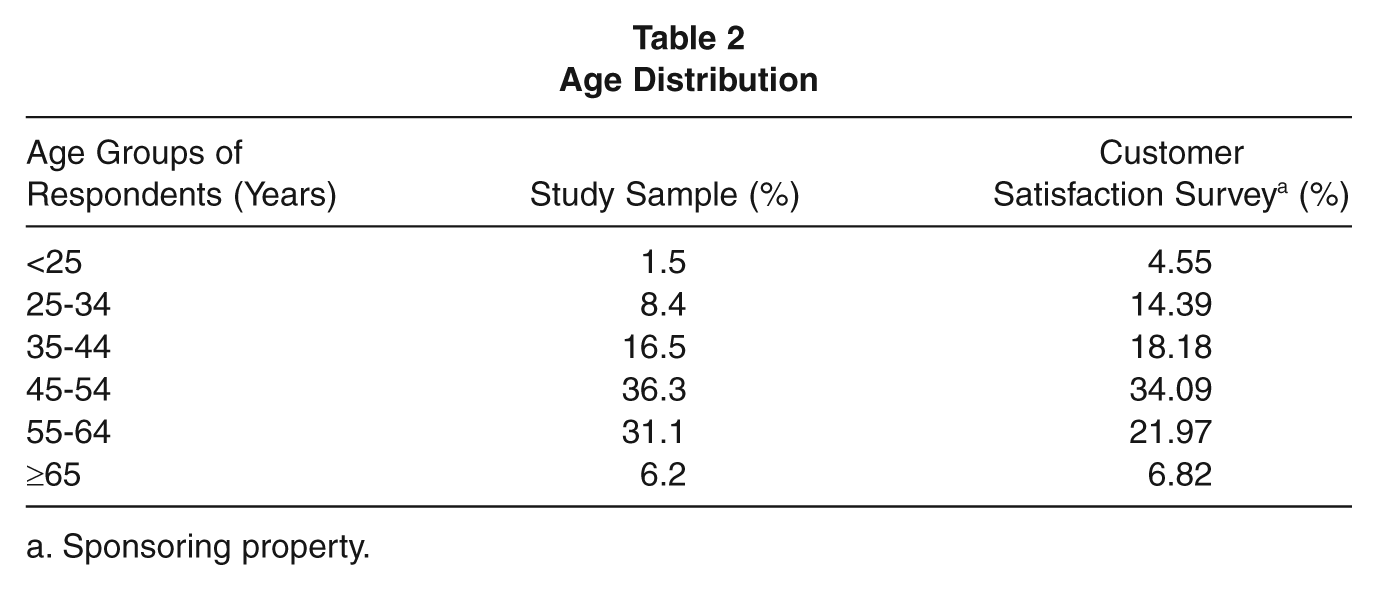
Sponsoring property.
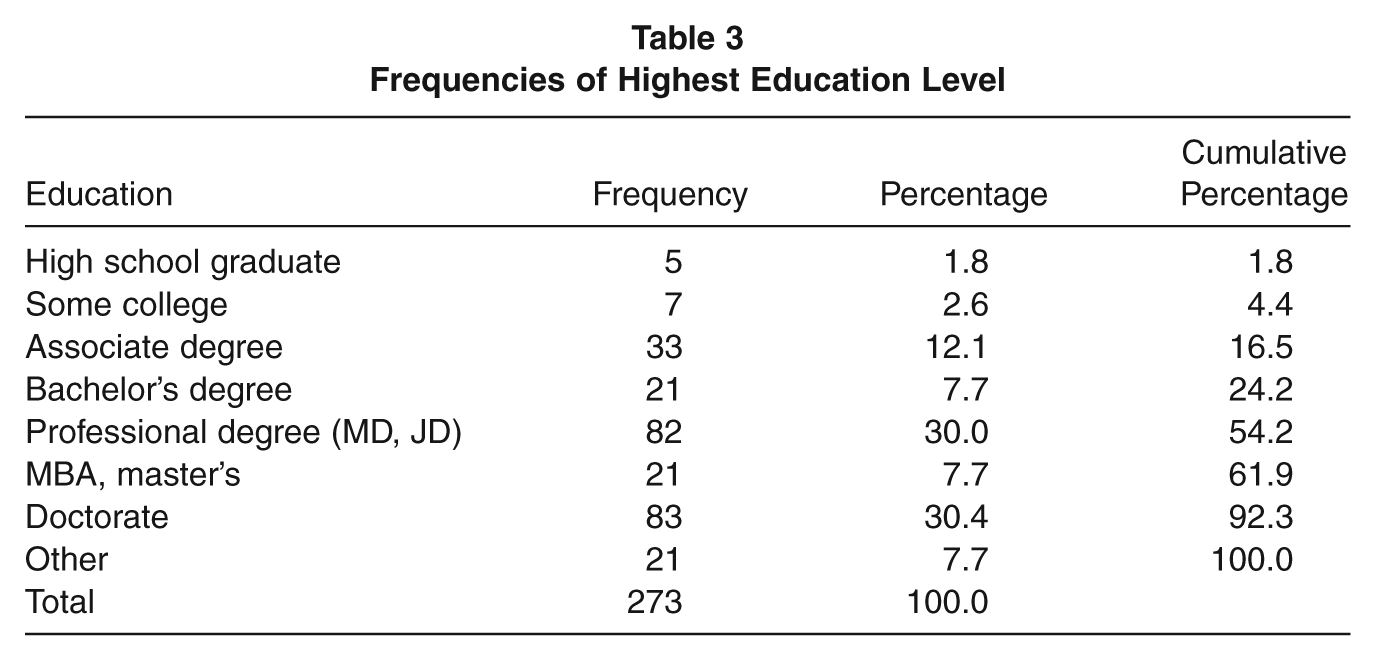
Other statistics were collected to get a better profile of the respondents. Such statistics could not be compared with the property population, since traditionally no record is kept of customer’s income, age, or education level. Mean income in the sample is about $97,000 per year; the median highest level of education is greater than a bachelor’s degree (see Table 3). The relatively high frequencies of professional degree and PhD holders in the sample can be explained by the fact that the hotel is located near a downtown University and in the heart of a business district hosting many legal firms as well as many other hotels.
Frequencies of Highest Education Level
During the past 15 months, survey respondents have stayed, on average, at two other competitors’ hotels, while they typically traveled 8 times out of their home.
Nonresponse Bias
A comparison of early to late respondents was conducted to evaluate nonresponse bias (Armstrong & Overton, 1977). This method has been used frequently in the marketing literature. We found no significant differences between the means or proportions of the main variables of interests (P[Alive] p = .27, Gender p = .95, Age p = .93, Education p = .92, Income p = .52) between the early (n = 122) and late respondents (n = 151). However, the relatively small response rate and the sampling strategy used indicate that self-selection bias is present. This is not uncommon in the lead-user literature (von Hippel, 2005). In fact, research shows that self-selection is an appropriate method of recruitment for creative users (Lüthje & Herstatt, 2004; von Hippel, 2005).
Classifying Defectors
An analysis of the property management system database (n = 2,152) of all customers’ purchase (stay) patterns for the period June 2007 to July 2008 shows a mean P(active) of .63, median of .67, and mode of 1 (see Figure 1). Comparatively, this study sample (n = 273) shows a mean P(active) of .43, median of .40, and mode of .07 largely skewed positively toward defection (see Figure 2). This is consistent with the mean satisfaction of the sample (mean = 3.36; SD = 1.85) based on a 7-point Likert-type scale.
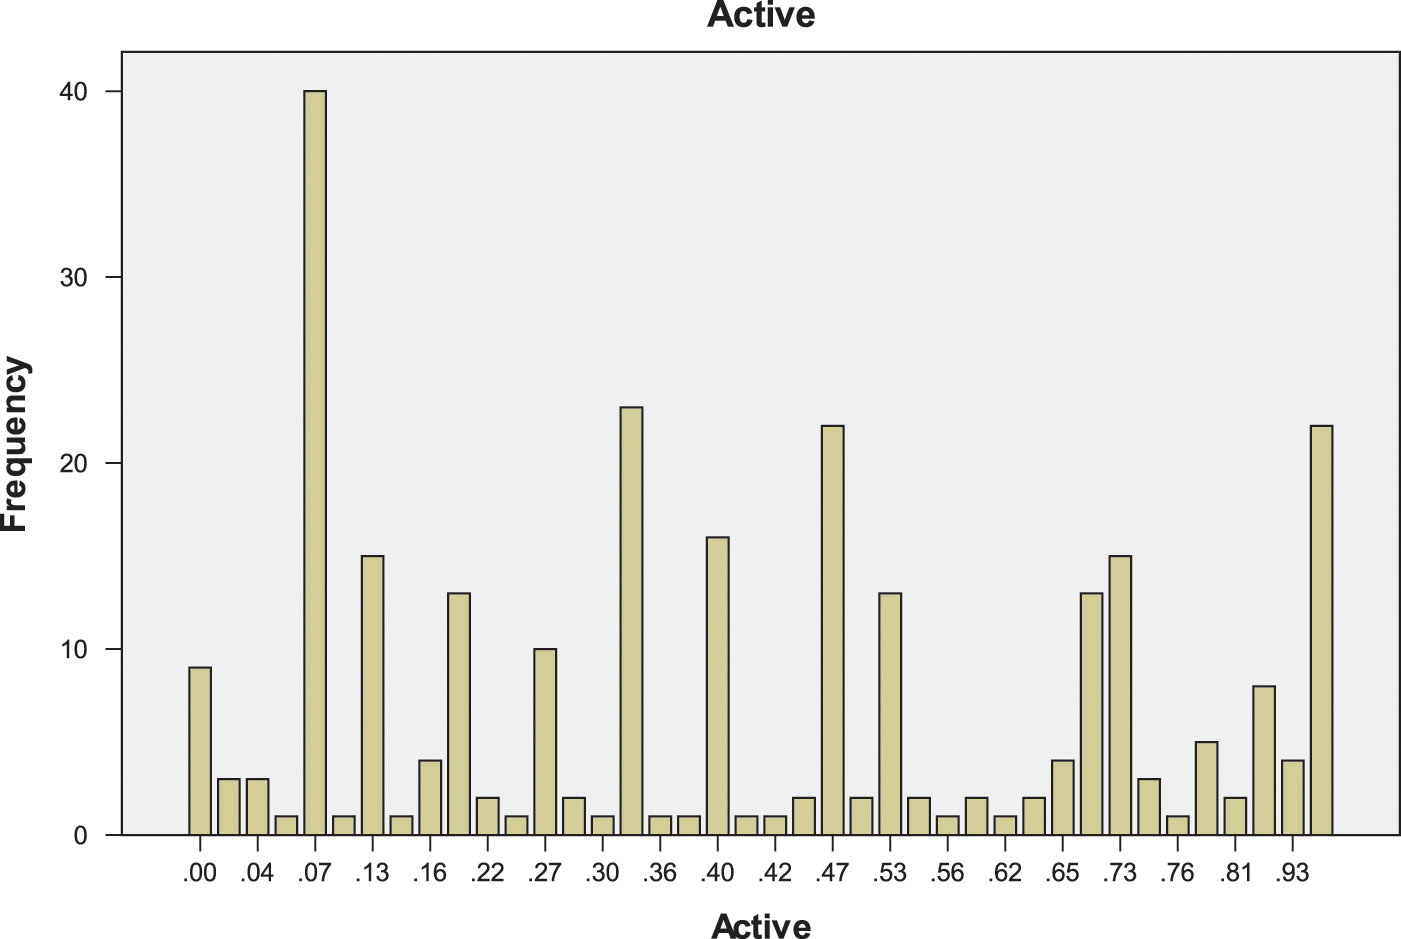
Frequency Distributions of P(Active) in the Sample
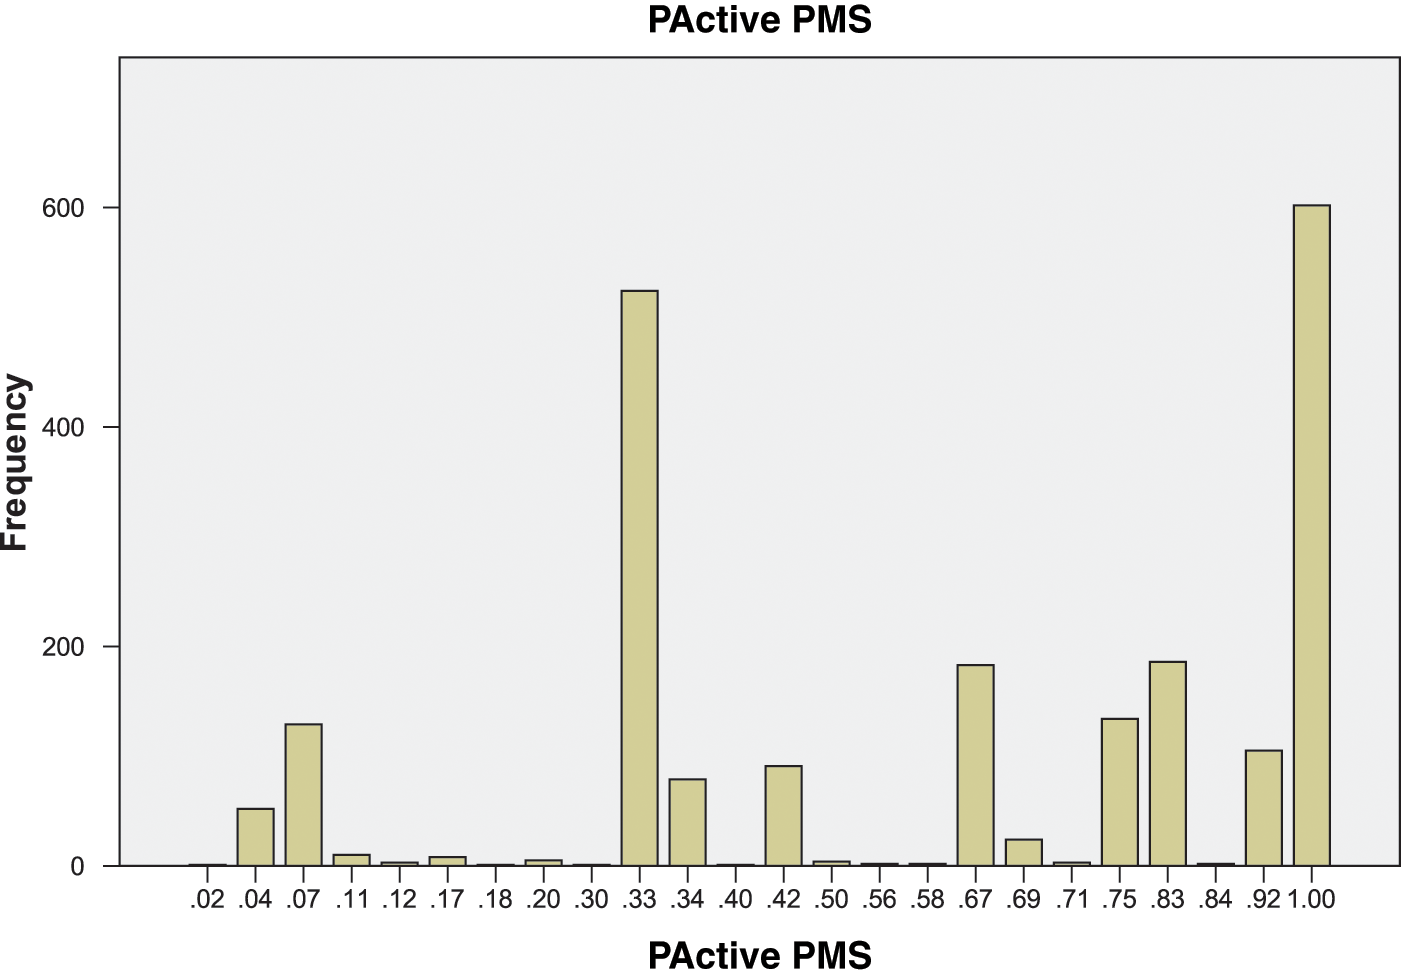
Frequency Distributions of P(Active) in the Property Population
Given the P(active) value, the sample’s respondents are coded as a defector if the value of P is less than .50 and as active if the value of P is equal to or greater than .50. Thus, the sample counts 174 defectors (63.7%) and 99 active customers (36.3%).
Based on the defector/active classification, several significant differences are worth mentioning (see Table 4). Mean income in the defector group is significantly lower ($95,249, SD = $266.46) than in the active group ($100,000, SD = $288.53). This is counterintuitive to early adopter theory (Rogers, 2003); among the number of possible explanations for this difference, one could be that it is consistent with the behavior of a value conscious consumer switching to a more attractive alternative (Bansal et al., 2005). All other demographic variable do not show significant differences between groups.
Characteristics of the Sample

Note: Values in parentheses are the standard deviations.
Significant differences between the active and the defector groups.
As stated previously, variety seeking and switching behavior explain in part that defectors might have more domain knowledge and might therefore be in a better position to give innovative ideas. Hence, we would expect to see a higher level of travelling behavior in the defector group in the form of more frequent miles, more reward points collected, and more hotel stays than in the active group. The second portion of Table 4 only shows a significant difference in the right direction for the number of stays at the competition, where defectors stayed an average of close to 3 times at the competition within the past 15 months, and active customers stayed only 2 times (t = 2.21, p < .05). This is an indication that customers in the defector group might stay at the competition for reasons consistent with variety-seeking behavior or that they have switched to the new provider due to unmet needs.
P(Alive) for the defector group is significantly lower (.23) than in the active group (.79) resulting from the classification mechanism. The mean satisfaction of the sample’s active respondents is 4.34 (SD = 1.65) significantly greater (p < .0001) than the mean of 2.81 (SD = 1.73) for the defector respondents. This allows for a manipulation check of the classification and shows that defectors are less satisfied than active customers, possibly forcing them to switch to the competition more often than the active/more satisfied customers.
Assessment of the Customers’ Ideas and Testing of Hypotheses
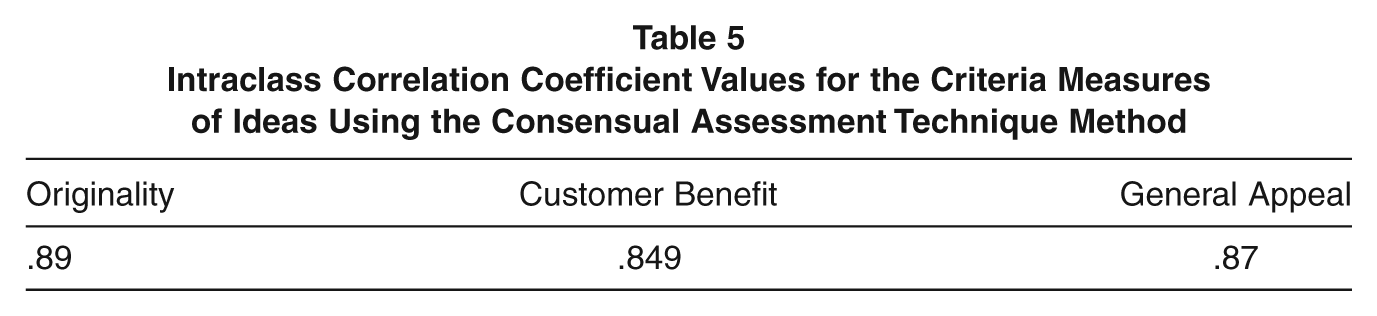
A panel of experts composed of three corporate-level executives and four hotel-level managers, averaging 4.6 years of experience with the property and 8.6 years of managerial experience in the hotel industry, rated each idea in manageable batches of 30 ideas at a time. Each idea was evaluated on the basis of creativity, value for the customers, and overall appeal to the market (Amabile, 1982, 1996). The three scoring criteria were phrased as follows: “How much do you agree with the following statements? This idea is very creative for our hotel (using a 5-point Likert-type scale, anchored at 1 = strongly disagree, 5 = strongly agree). This idea will be very difficult to implement (reversed scale). Our clients would benefit greatly from that idea.” An intraclass correlation was calculated and led to a high level of agreement between the judges (see Table 5; Shrout & Fleiss, 1979).
Intraclass Correlation Coefficient Values for the Criteria Measures of Ideas Using the Consensual Assessment Technique Method
The question, “how much do you agree with the statement that this idea is a radical idea for the hotel industry?” was asked of the expert panel for each idea they had to evaluate. Although this question was not included in the score of the ideas, it showed high levels of agreement evidenced by an intraclass correlation of .71. Table 6 shows that the idea level of “radicalism” correlates highly with appeal (ρ = .961, p < .001), benefit to the customers (ρ = .567, p < .001), and creativity (ρ = .346, p < .05).
Correlations Between the Score Measures and the Level of Radicalism of the Ideas
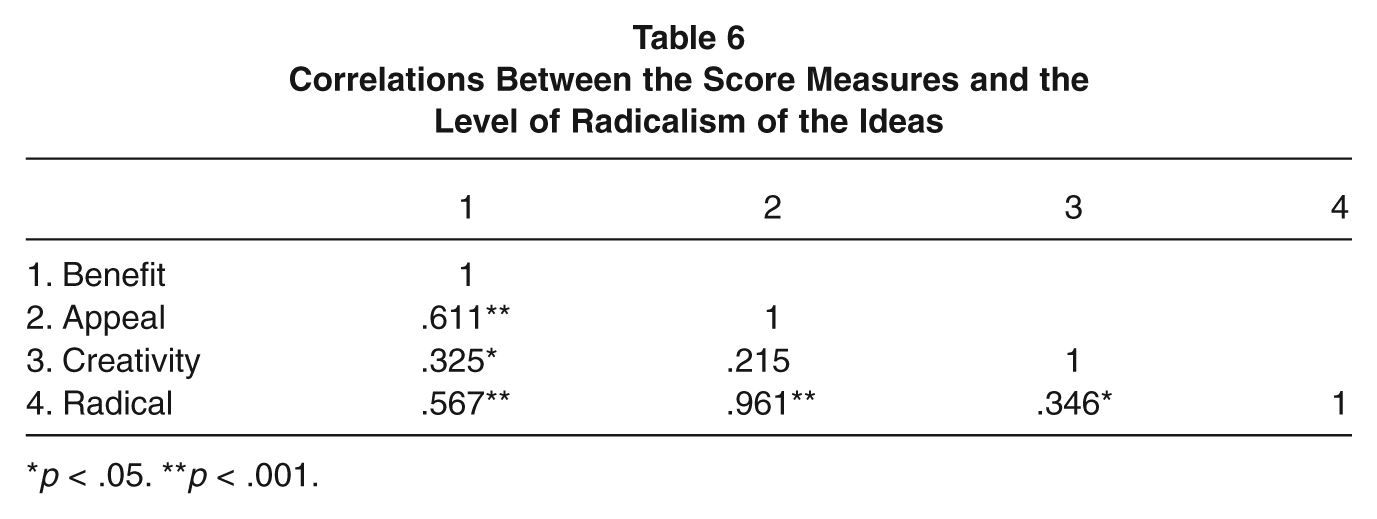
p < .05. **p < .001.
The high correlation coefficient with appeal might suggest collinearity between the two variables. This might be due to the fact that single item questions were used as opposed to typical multivariate construct measures. However, previous research also showed a high level of shared variance between most innovative users’ ideas’ value and originality (Magnusson, 2009). Overall, 13 out of the top 20 ideas were also judged to be radical (above the mean of the radical scale); and 7 out of the bottom 20 ideas were radical (see Table 7 for some examples). This shows that the panel of experts used their domain knowledge in assessing ideas that were not only creative but also valuable and beneficial to the firm.
Examples of Ideas Collected
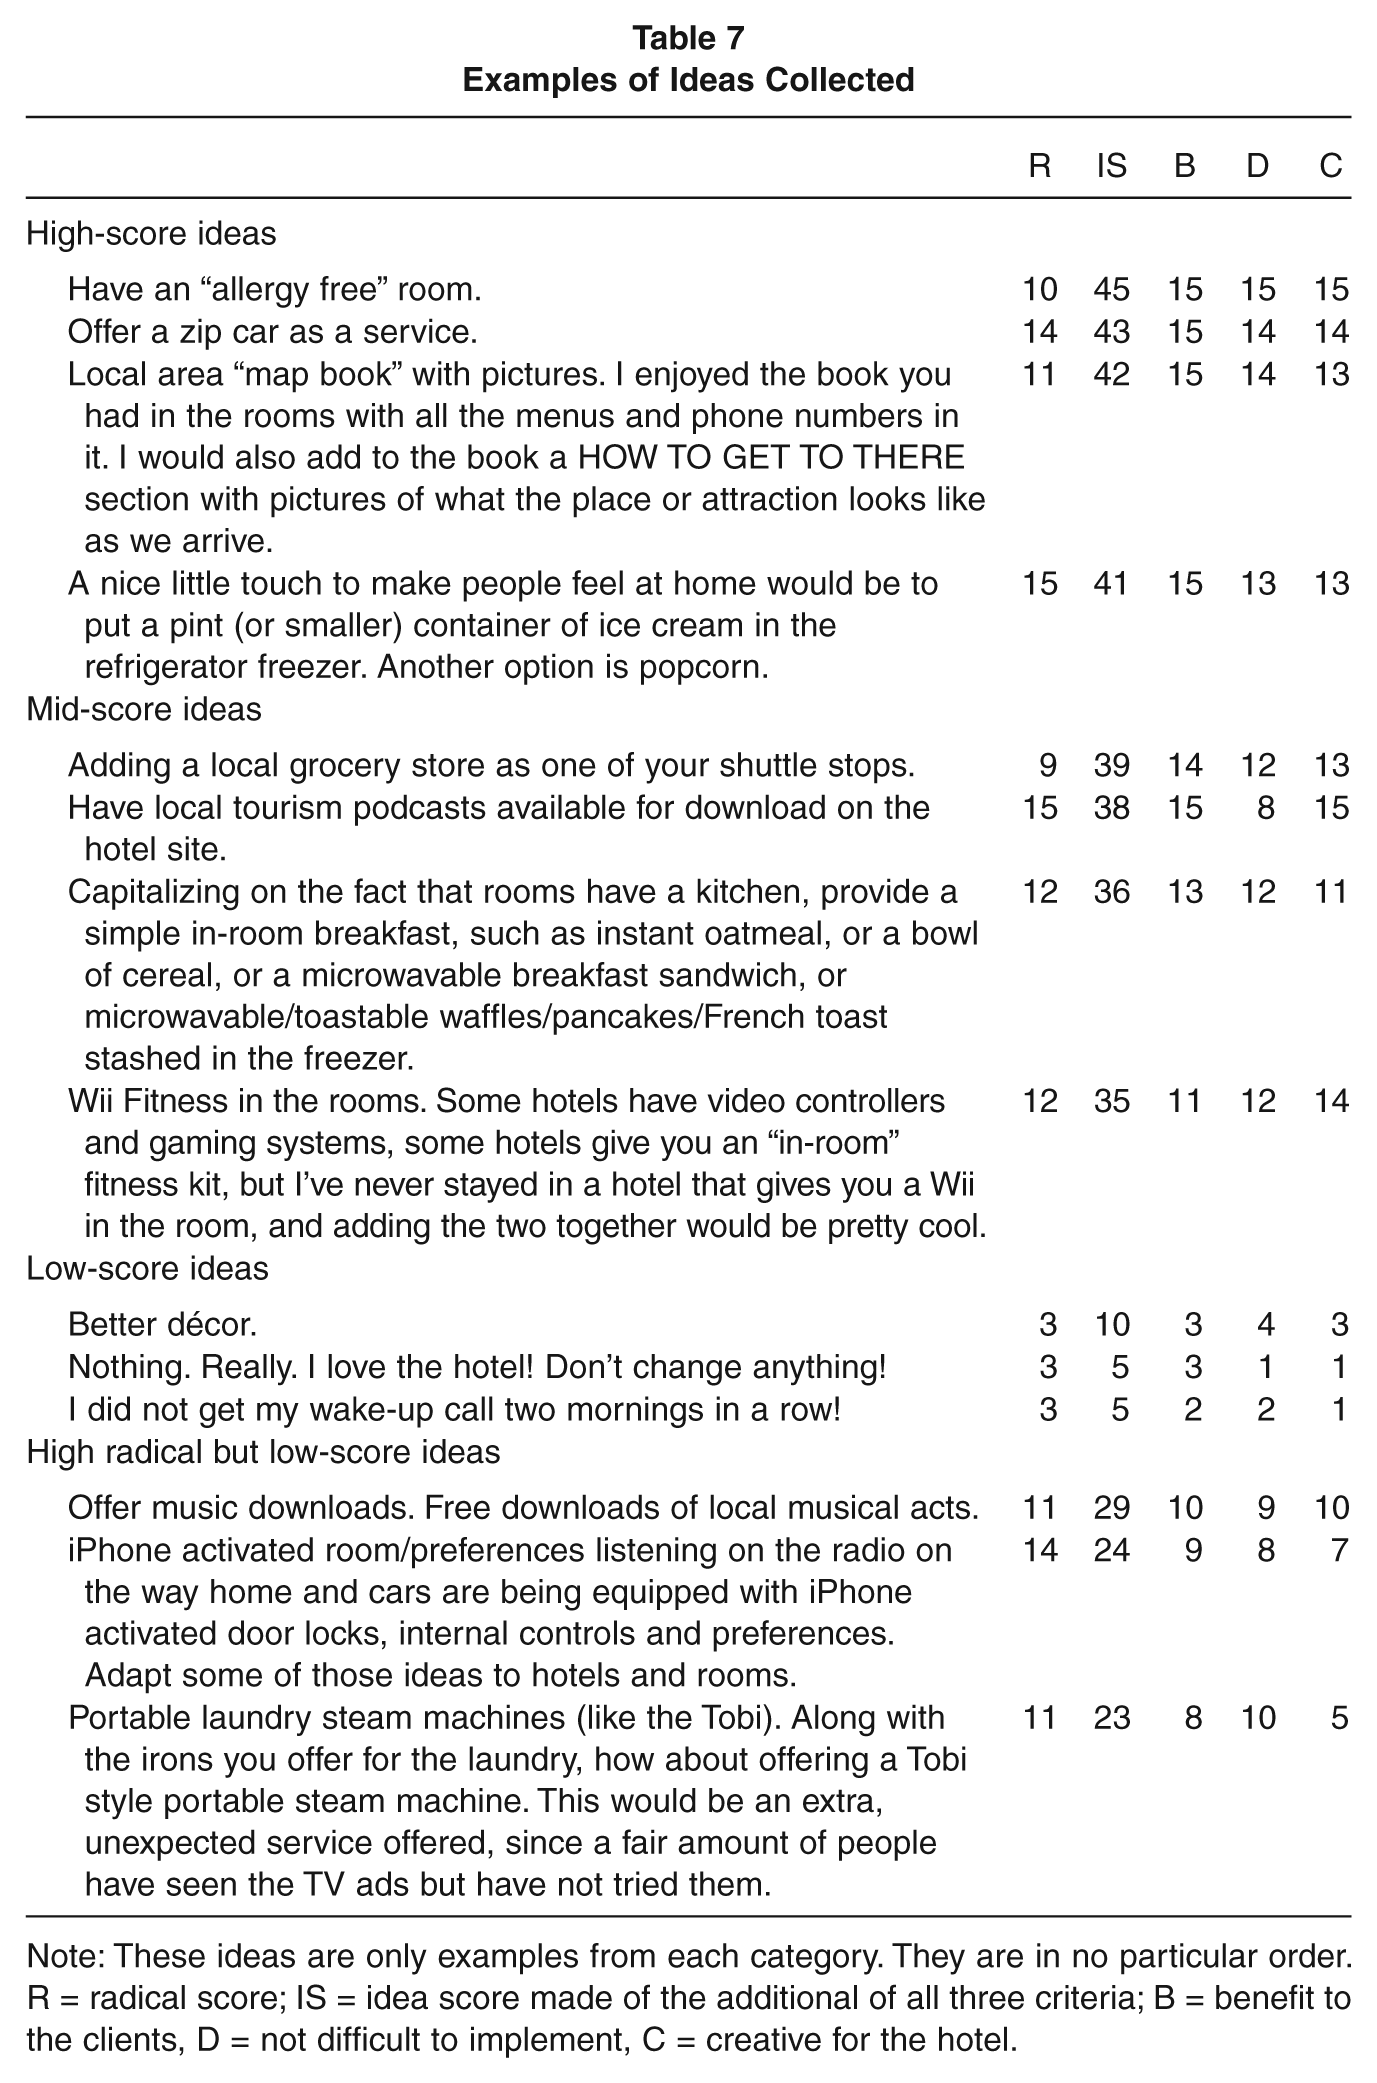
Note: These ideas are only examples from each category. They are in no particular order. R = radical score; IS = idea score made of the additional of all three criteria; B = benefit to the clients, D = not difficult to implement, C = creative for the hotel.
Looking at Figure 3 one notices the high number of low-rated ideas in both groups. These ideas (See Table 7) are largely comments, complaints with no ideas, or praises with no ideas. No difference between defectors and active customers was found in the proportion of low-scoring ideas (z = .917).
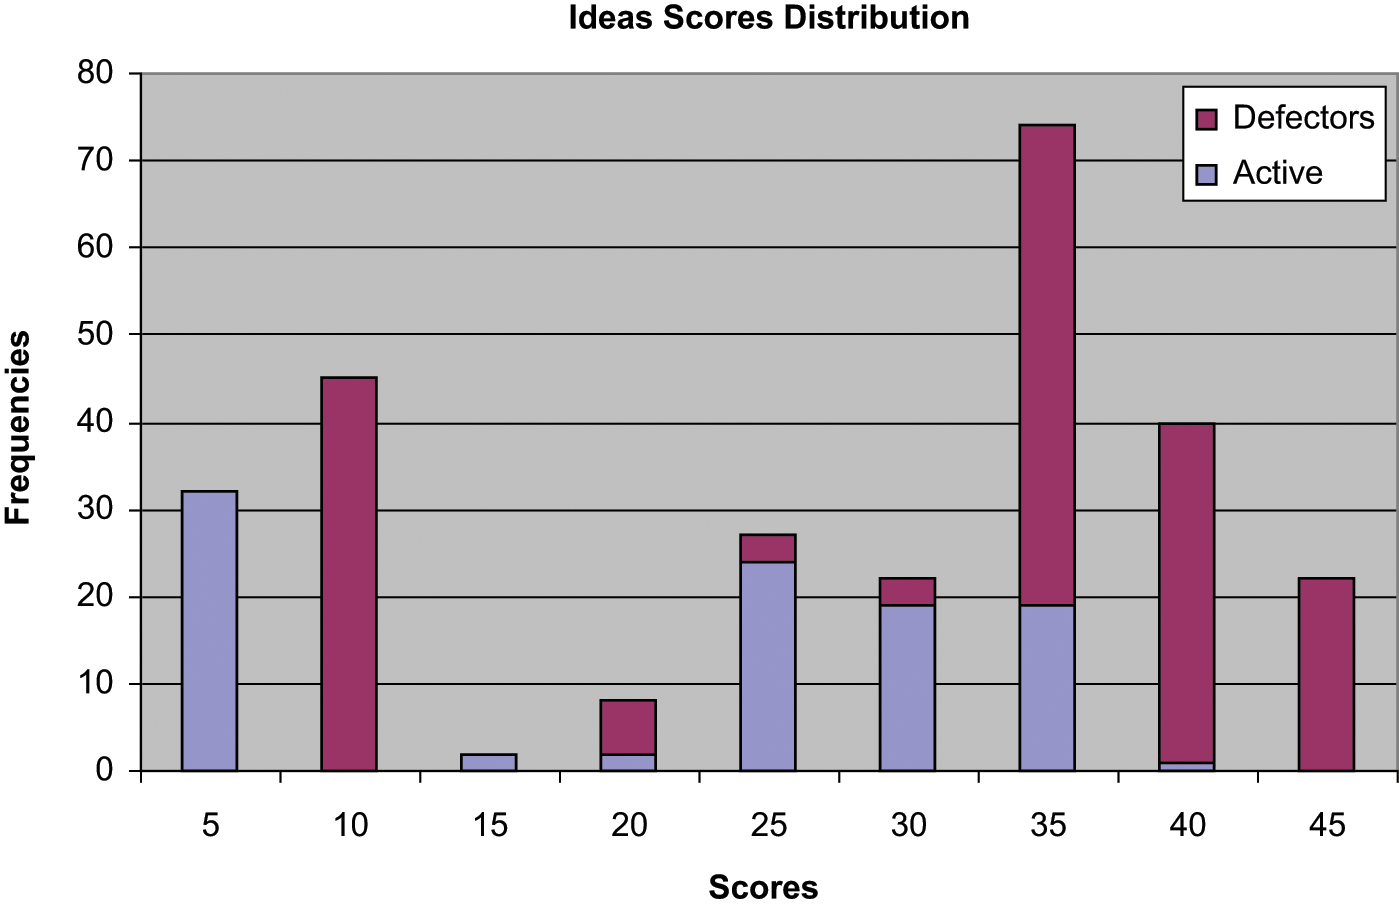
Graph of Idea Score Distribution by Class
Distribution of Ideas Score Between Groups
We first look at Figure 3 and see some evidence that the defector group produces a larger amount of high-scored ideas.
Hypothesis 1, which states that less-satisfied customers will have better innovative ideas than more satisfied customers, was tested first. We dichotomized the sample using a “top 2 box” method, whereby, customers who showed a rating of 6 or 7 on the 7-point Likert-type scale of satisfaction were classified as satisfied (n = 36), and the customers who rated less than 6 were classified as dissatisfied (n = 237). Ideas originating from satisfied customers score lower (14.51, SD = 11.48) than those originating from the dissatisfied group (29.99, SD = 13.01; t = 6.752, p < .0001). 2
The difference in idea score between the defector and the active customer groups was the second hypothesis tested. In agreement with our Hypothesis 2, the distribution of the idea score between groups (see Figure 3 and Table 8) shows that defectors tend to create more innovative ideas. Defectors have a mean idea score of 31.13 (SD = 12.59) and active customers have a mean idea score of 22.21 (SD = 13.47). The difference is significant as evidenced by a t test of means difference (t = −5.43, p < .001). Furthermore, ideas were grouped in a low score (ideas’ score one standard deviation below the mean), high score (ideas’ score one standard deviation above the mean), and medium scores (ideas’ score one standard deviation around the mean). A Chi-square of homogenous distribution of frequencies shows significance (χ2 = 219.35, df = 31, p < .001), further suggesting that the defectors’ group’s ideas score significantly higher than the active customer group.
Distribution of Idea Scores Between Active Clients and Defectors
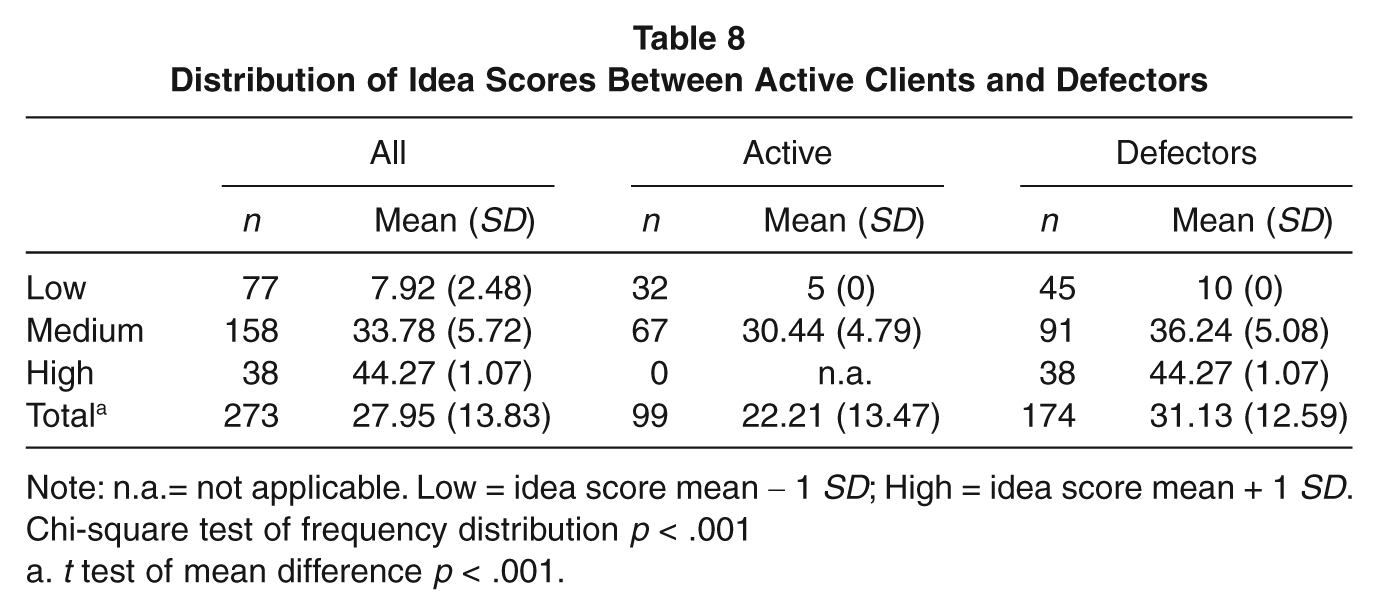
Note: n.a.= not applicable. Low = idea score mean − 1 SD; High = idea score mean + 1 SD. Chi-square test of frequency distribution p < .001
t test of mean difference p < .001.
Furthermore, a side by side comparison of the distribution of idea scores between the two groupings, satisfied/dissatisfied and active/defectors (see Table 9), shows some differences in both distribution of ideas and scores. For example, the mean idea scores of the ideas located around the overall mean (Medium group in Tables 8 and 9) shows a significant mean difference (t = 2.93, p < .001) between the Defectors (M = 36.24, SD = 5.08) and the Dissatisfied groups (M = 34.11, SD = 5.66). However, the highest idea scores show identical means (M = 44.27, SD = 1.07) between groups. This further supports the fact that the most creative groups of customers can be found within the dissatisfied defectors.
Distribution of Idea Scores Between Satisfied and Dissatisfied Clients
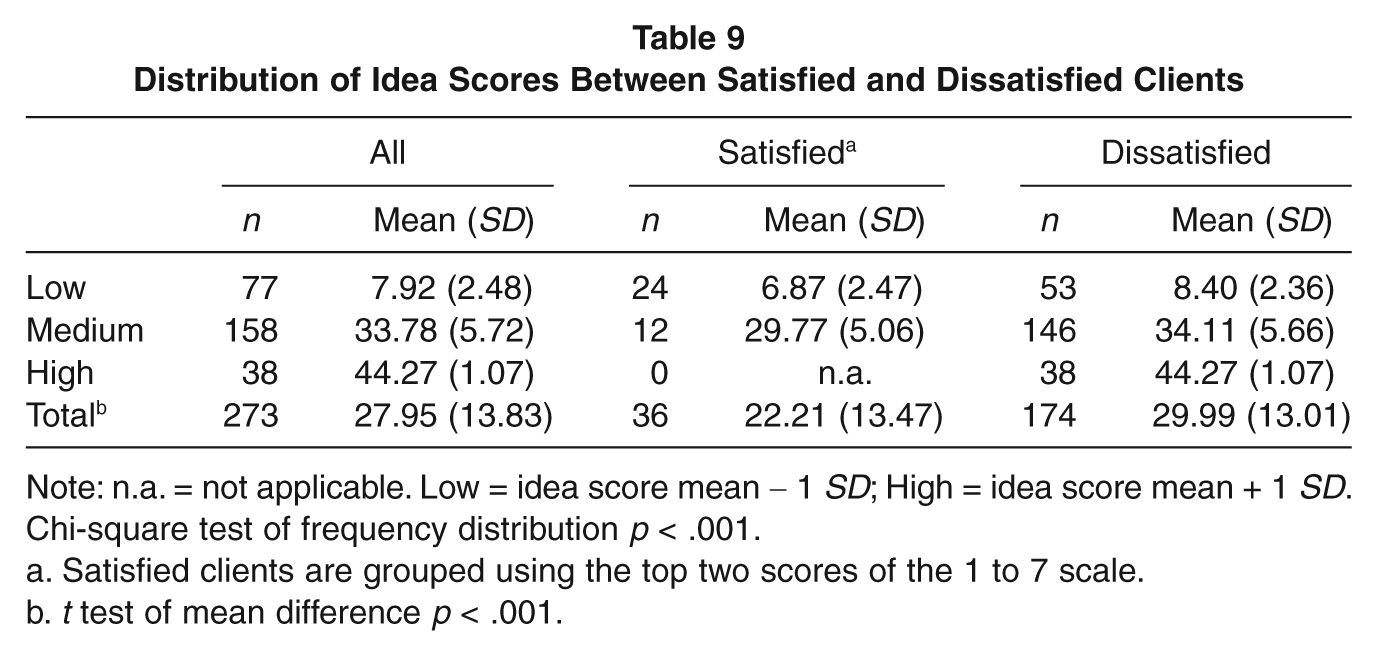
Note: n.a. = not applicable. Low = idea score mean − 1 SD; High = idea score mean + 1 SD. Chi-square test of frequency distribution p < .001.
Satisfied clients are grouped using the top two scores of the 1 to 7 scale.
t test of mean difference p < .001.
Discussion and Managerial Implications
This study has demonstrated that dissatisfied customers generate better service innovation ideas than satisfied customers, and that engaging defectors in the idea generation process may yield the most innovative ideas. Hotels, and service firms in general, can use the EBS as a cost-efficient method to identify potential innovative users, whether defectors or active-current clients, and invite them to participate in the idea generation process, while offering a way to recognize and reward them.
The lead-user method adapted for the service industry, allows brands to invite defectors and current clients in a closed, yet free, creative environment allowing the service firm to keep the first-mover advantage on the implementation of innovative ideas. In that aspect, it is a convergence mechanism (Veryzer, 1998) at the fuzzy front end of service idea generation, whereas the consensual assessment technique formalizes a nonbias evaluation screening and acts as a strategy and culture gate (Edvardsson, Gustafsson, Johnson, & Sandén, 2000) in congruence with the firm’s strategic objectives. This was evidenced by a number of “radical” ideas being found impractical and given a low score by the panel of experts.
The present study confirms previous research (Kristensson, Gustafsson, & Archer, 2004) that “ordinary users” such as clients of a hotel, without particular technical knowledge about the hotel industry, can have ideas deemed innovative by the expert panel. Furthermore, the study identifies that among these “ordinary users” the defectors seem to possess characteristics leading them to generate superior ideas that were judged to be more radical by the panel of experts. In addition, the study establishes a relationship between the underlying unmet needs, switching behavior, and the creative participation of customers. The most strongly dissatisfied customers, more likely defectors, have a stronger need and they are willing to engage in an idea generation process freely and constructively with the firm they defected from.
Thus, the defectors, rather than the current clients, might be a better group to “data-mine” for ideas, or to recruit an idea generator from. Strategies linking customer relationship management (CRM) and service recovery efforts should reach this defector group in an attempt to extract ideas while rewarding and recognizing them in order to regain their business. Further research could investigate the pertinence to measure service recovery efforts’ return-on-investment with brand “switch-back” as a dependent variable.
For example, call center employees’ listening behaviors has been shown to be the most important factor in call center satisfaction (Mount & Mattila, 2002). One could imagine training the call center employees to listen-in on the level of the unmet need expressed and its potential for innovation. Then, redirect the customer to a dedicated idea generation center.
The Defectors’ Value Is in the New Market They Open for the Firm
Firms are in constant need of innovative ideas, and service firms, particularly, are in need of ideas that will keep the brand relevant to their customer base. This is what customer-centric strategies (Shah, Rust, Parasuraman, Staelin, & Day, 2006) attempt to do by leveraging such tools as CRM. Among other objectives, CRM attempts to increase customer value (Bolton & Drew, 1991), customer equity (Rust, Zeithaml, & Lemon, 2000), and customer-based brand equity (Keller, 2003), leading in turn to a higher customer life-time value (CLV; Rust, Lemon, & Zeithaml, 2004), proxy of overall firm value (Gupta, Lehmann, & Stuart, 2001). However, CLV is often concerned with profitable current and future customers, and assumes that low-CLV customers and defectors have low value, should not be part of the model, and, therefore, should be fired or left to the competition (Mittal, Sarkees, & Murshed, 2008).
This study shows that defectors can be valuable to the service firm and might be accounted for in the CLV whether they choose to come back or not. A defector that gained recognition by participating in a new service development process could potentially become a strong opinion leader or promoter of the brand and switch back to the service firm he or she helped rejuvenate.
Defectors Help Find New Markets for Brands
History has shown that some entrepreneurial defectors went on to materialize their service idea into a successful business that later challenged the firm they defected from, and even sometimes earned market leadership (e.g., Virgin Airlines, Starbucks, McDonald’s).
In attempting to find new markets, new meaning for the brand, or new customers, brands need to involve their customers. Keller (2003) explains that customer-based brand equity is enhanced over time by strategies that reinforce or revitalize the brand such as innovation in product/service design; manufacturing or service design; and delivery, merchandizing, “back to basic,” and reinvention strategies. Innovation is an integral part of the life of a brand (Lehu, 2006), however, franchise models and large retail service companies are often successful only if they apply a rigorous operational system that does not allow much freedom to the operator or the staff in general (Price, 1997). That is the paradox facing Starbucks (Adamy, 2007), Holiday Inn hotels (Kiley, 2007), and other aging service concepts. At the fuzzy front end of service idea generation, the service firm has to have a system, such as the one presented here, for gathering ideas and screening them (Edvardsson et al., 2000). The firm should also allow for enough freedom to create and screen the ideas congruent with the brand values and brand promise (Keller, 2003).
Lead-User Method as a First-Mover Advantage Mechanism
Lead-user methods such as the use of the EBS do not guarantee radical or disruptive service idea generation. Yet in this study, more than 20 high-scoring ideas were deemed radical service innovations by the expert panel, and a majority were thought to be worthy of market testing. Some of these ideas might only be radical at the level of the property; some might be radical at the level of the industry. Only one good idea is needed for a service company to gain first-mover advantage and open a new market segment. McDonald’s breakfast, thanks to the Egg McMuffin (invented by a student-employee named Clyde W. Froehlich), counts for 30% of total sales. Starbuck’s Frappuccino (invented by a barista–customer interaction) achieved 7% of total sales the first year it was introduced, demonstrating that even one good idea warrants consideration to customers’ unmet needs.
Focusing on defectors as idea generators is the major contribution of this study. Current research considers that by leaving the service company to patronize another provider, defectors are technically looking for a better fit between their needs and the new company, potentially becoming the service firm’s “terrorists” (Heskett, Jones, Loveman, Sasser, & Schlesinger, 1994) and spreading negative word-of-mouth. Defectors know what they want, but due to the coproduction and intangibility characteristics of services, they cannot create their own service unless they become entrepreneurs. Innovative customers and potential lead-users in the service industry have to be identified in the past clientele base as well as within the current dissatisfied client base. However, as demonstrated in the present study, potential defectors constitute the best “fishing pond” to identify the most innovative users. Service providers should, therefore, make sure that their databases are accurate and complete, and that their CRM processes allow for an identification of the potential defectors by possibly calculating P(Active) as part of monthly report generation.
Limitations
A different screening of clients and defectors could produce a richer group of participants; however, that process might be challenging in the service context due to the relative difficulty that service companies, such as hotels or restaurants, seem to have in maintaining complete and accurate databases. For example, one could use creativity scale, or other measures incorporated in a satisfaction survey and identify potential innovative customers. A bridge between service innovation and CRM would certainly facilitate the development of methods that would benefit idea-generation initiatives by incorporating a salient set of screening questions that would allow the defector or potential defector to be identified and re-routed into a different voice-of-the-customer process such as the EBS idea generation. Other limitations of the study include the localization of the study and the potential lack of generalizability of the ideas to a different hotel setting. Additionally, the sampling strategy lacks a full sampling frame limited by the hotel data availability and suffers from participants’ self-selection bias. There could be potential defectors with greater ideas that either where not invited, or chose not to participate.
Despite these limitations, the EBS idea generation is an appropriate process in the context of service innovation, in that it can produce ideas that, if not radical, are highly relevant for the service company and its clients. Future research should extend the method to other context (i.e., restaurant, airlines, or car rental firms) and evaluate the efficacy of the idea-generation method at a brand or chain level.
Footnotes
Acknowledgements
The author wishes to thank Dr. Salah S. Hassan, George Washington University, and the journal editor as well as the three anonymous reviewers for their comments and constructive criticisms.