
Abstract
Destination competitiveness has become a prominent part of hospitality and tourism literature. Competitiveness, however, is not easily defined or uniformly calculated because a number of diverse factors must be considered. Although meeting planners’ site selection criteria has been studied in existing convention destination research, the attendees’ perspective has rarely been examined. Therefore, the purpose of this study was to investigate the indicators that affect a convention destination’s competitiveness in the eyes of convention attendees. Data were collected from three trade shows hosted by three different convention destinations, which resulted in 696 usable responses for data analyses. Importance-performance analysis (IPA) was implemented on seven attributes of convention destination competitiveness. In addition, the overall destination competitiveness indices were calculated to see the relative competitiveness among the destinations. Repeated measures of MANOVA were conducted to complement and to offer valid interpretation of the IPA results.
Keywords
Introduction
An essential factor for the success of a destination is its ability to compete against other destinations (Crouch & Ritchie, 1999; Go & Govers, 1999; Kim & Dwyer, 2003; Mangion, Durbarry, & Sinclair, 2005; Wootten & Stevens, 1995). Due to the increase of competition in the tourism industry, destinations have strived to identify and develop their competitive advantages (Hudson, Richie, & Timur, 2004). Consequently, destination competitiveness has become a prominent part of hospitality and tourism literature. Although destination management organizations (DMOs) consider the proper assessment of competitiveness as a key to a successful marketing strategy, policy makers are concerned with the identification of direct tourism revenue generators (Hawkins & Mann, 2007).
As Kim and Dwyer (2003) noted, however, inclusion of a variety of factors makes it very difficult to define or uniformly calculate destination competitiveness. Gooroochurn and Sugiyarto (2005) pointed out that competitiveness is a complex concept with various elements that are often hard to measure. It is also a relative measure with considerable variability depending on what is being measured, where, and when. Considering these two key characteristics of destination competitiveness, relativity and multidimensionality, this study focuses on one particular sector of business tourism, the convention industry, to identify more easily defined and measurable indicators for destination competitiveness.
The convention business can be a key contributor to the success and growth of a destination’s economy with numerous benefits, such as attracting convention tourists who have higher daily expenditures than leisure travelers, the possibility of increased bookings during off-peak travel periods, and multiple spinoffs for local businesses (Bradley, Hall, & Harrison, 2002; Braun & Rungeling, 1992; Oppermann, 1997; Suh & McAvoy, 2005; Wootton & Stevens, 1995). Chacko and Fenich (2000) argued that hosting meetings and conventions could generate significant revenues for the local hospitality industry, and that major convention elements in a destination such as accommodation and meeting facilities influence its competitiveness. Bradley et al. (2002) cited four key attributes that meeting organizers take into account when selecting their meeting venues: the quality of meeting facilities, costs, accessibility, and image of potential locations. Although the debate on the importance of a destination’s image in determining its competitiveness may continue (Bradley et al., 2002; Zelinsky, 1994), it has been suggested that the destination must also be able to attract convention business with adequate convention infrastructure, in particular accommodation and convention facilities (Qu, Li, & Chu, 2000).
Although many studies have considered site selection criteria from the meeting planners’ point of view (Chacko & Fenich, 2000; Go & Govers, 1999; Kang, Suh, & Jo, 2005; Qu et al., 2000; Weber & Ladkin, 2003), attendees’ perspectives rarely have been examined. The lack of these key stakeholders’ opinions may result in an incomplete picture of destination competitiveness. Chacko and Fenich (2000) found that cost factors such as hotel room rates and food and beverage costs are not important in meeting planners’ evaluations of the quality of a destination because the planners are not the end users who pay for these services. Moreover, meeting planners and meeting hosts (e.g., the executive board of an association) consider their customers’ satisfaction as the foundation of their decision (Getz, 2003), even though their customers, convention attendees, are not directly involved in the decision-making process. Fenich (2001) tried to evaluate the community attractiveness for conventions and compared the four major convention cities in the United States (Atlanta, Chicago, New York, and Washington, DC) with secondary data. Although his approach is meaningful for developing a scale that assesses the factors that attendees consider when they decide to travel for conventions, the study merely compared the infrastructure among the cities based on the published secondary data instead of using primary data to ask attendees about their perceptions of how attractive those cities are. Therefore, the purpose of this study was to examine key attributes that make a convention destination competitive from the convention attendees’ perspective. Based on a review of the previous literature, a survey questionnaire was developed and distributed to attendees at three conventions held in three U.S. destinations. The respondents were asked about their experiences at these convention destinations.
To develop the weight of the attributes, importance-performance analysis (IPA) was used, and a composite index of each destination was calculated to determine the comparative advantage of the destination. Repeated measures of MANOVA were conducted to check the validity of the IPA results. Findings from the two analyses were compared to derive conclusive answers regarding whether the destinations showed significant differences in the attributes of convention destination competitiveness.
Theoretical Background
Destination Competitiveness
Crouch and Ritchie (1999) defined destination competitiveness (DC) as the destination’s ability to enhance the quality of life of its residents. Other researchers have repeated and confirmed this definition (Dwyer, Forsyth, & Rao, 2000; Enright & Newton, 2004; Hudson et al., 2004). DC may, however, be more comprehensive in nature. Dwyer and Kim (2003), for example, introduced three major threads of competitiveness: a comparative advantage and/or price competitiveness perspective, a strategy and management perspective, and a historical and sociocultural perspective. Despite these efforts to define and to identify components of DC, few models have been created to evaluate the competitiveness of a destination. Some tourism researchers like Chon and Mayer (1995) adopted Porter’s generic industrial competitiveness model into the tourism sector. They modified Porter’s model and developed a tourism competitiveness model that includes five dimensions: appeal, management, organization, information, and efficiency. Tourism industry–specific issues such as the intangible nature of the product and service and the renewable feature of tourism resources were incorporated into the modified model (as cited in Hudson et al., 2004).
Hassan (2000), however, believed that there are limitations to the modified Porter model. He argued that the indicators of that model are necessary but insufficient in the tourism context. He suggested a model of sustainable tourism based on the development of Singapore as “a travel destination miracle.” In his proposed model, the four categories of tourism market competitiveness are as follows:
Comparative advantage: These are the factors associated with both the macro- and microenvironments that are critical to market competitiveness.
Demand orientation: The destination’s ability to respond to the changing nature of market demand will influence its competitiveness.
Industry structure: The existence or absence of an organized tourism-related industry structure can be associated with the destination’s ability to compete.
Environmental commitment: The destination’s commitment to the environment will influence the potential for sustained market competitiveness. (Hassan, 2000, p. 242)
This model, however, also has been criticized. Hudson et al. (2004) believed that the model fails to identify key variables such as market and environmental sustainability.
The most frequently cited model of tourism destination competitiveness was developed by Crouch and Ritchie (1999). It is called the competitiveness–sustainability (C/S) model because the goal of tourism development lies in achieving sustainable destination competitiveness through the enhancement of residential well-being in a particular destination. Based on the dichotomy of comparative (resource endowment) and competitive (resource deployment) advantages in tourism, they proposed a model that characterizes the relationship between tourism and societal prosperity. The C/S model, which has been continuously revised by the authors since its introduction, has been regarded as the most comprehensive and rigorous model so far. It covers almost all components of the tourism industry and explains the complicated, fragmented, and interdependent nature of the industry (Hudson et al., 2004). The multifaceted and complicated features, however, lead to difficulty in empirical testing. Consequently, a few studies that tried to measure the components of the model were forced to focus only on specific components or miss the measurement of multiple components because of their complexity and inseparability (Dwyer, Mistilis, Forsyth, & Rao, 2001; Hudson et al, 2004; Kim & Dwyer, 2003).
Gooroochurn and Sugiyarto (2005) attempted to provide an empirically tested model that may not be a comprehensive one. They measured the tourism competitiveness of more than 200 countries by using eight main indicators: price, openness, technology, infrastructure, human tourism, social environment, natural environment, and human resources. Using confirmatory factor analysis, they calculated weights for each indicator to compute the Composite Tourism Competitiveness Index, whereas cluster analysis was used to group countries based on their performance as tourist destinations. They seemed, however, to develop the indicators by relying on the availability of published secondary data, despite the fact that a holistic view of destination competitiveness could not be developed from these data alone.
Given the nearly immeasurable nature of the issue, this study focused on destination competitiveness specifically for the convention sector of the tourism industry. The narrow focus of the study made it possible to measure the indicators more accurately, and a perception-based approach may enhance the clarity of the concept of competitiveness by focusing on the customer’s view of the convention destinations.
Convention Destination Competitiveness
The convention industry has been viewed as one of the most prosperous and more profitable segments in the hospitality and tourism industry (Braun & Rungeling, 1992; Ching-Fu, 2006) that may serve as a high revenue generator for a destination with benefits from powerful word-of-mouth promotion and repeat visitation (Go & Govers, 1999). Furthermore, meetings and conventions that are held by many corporations and associations during traditionally soft tourism seasons can contribute significantly to shoulder-season and off-season tourism demand in host destinations (Oppermann, 1996).
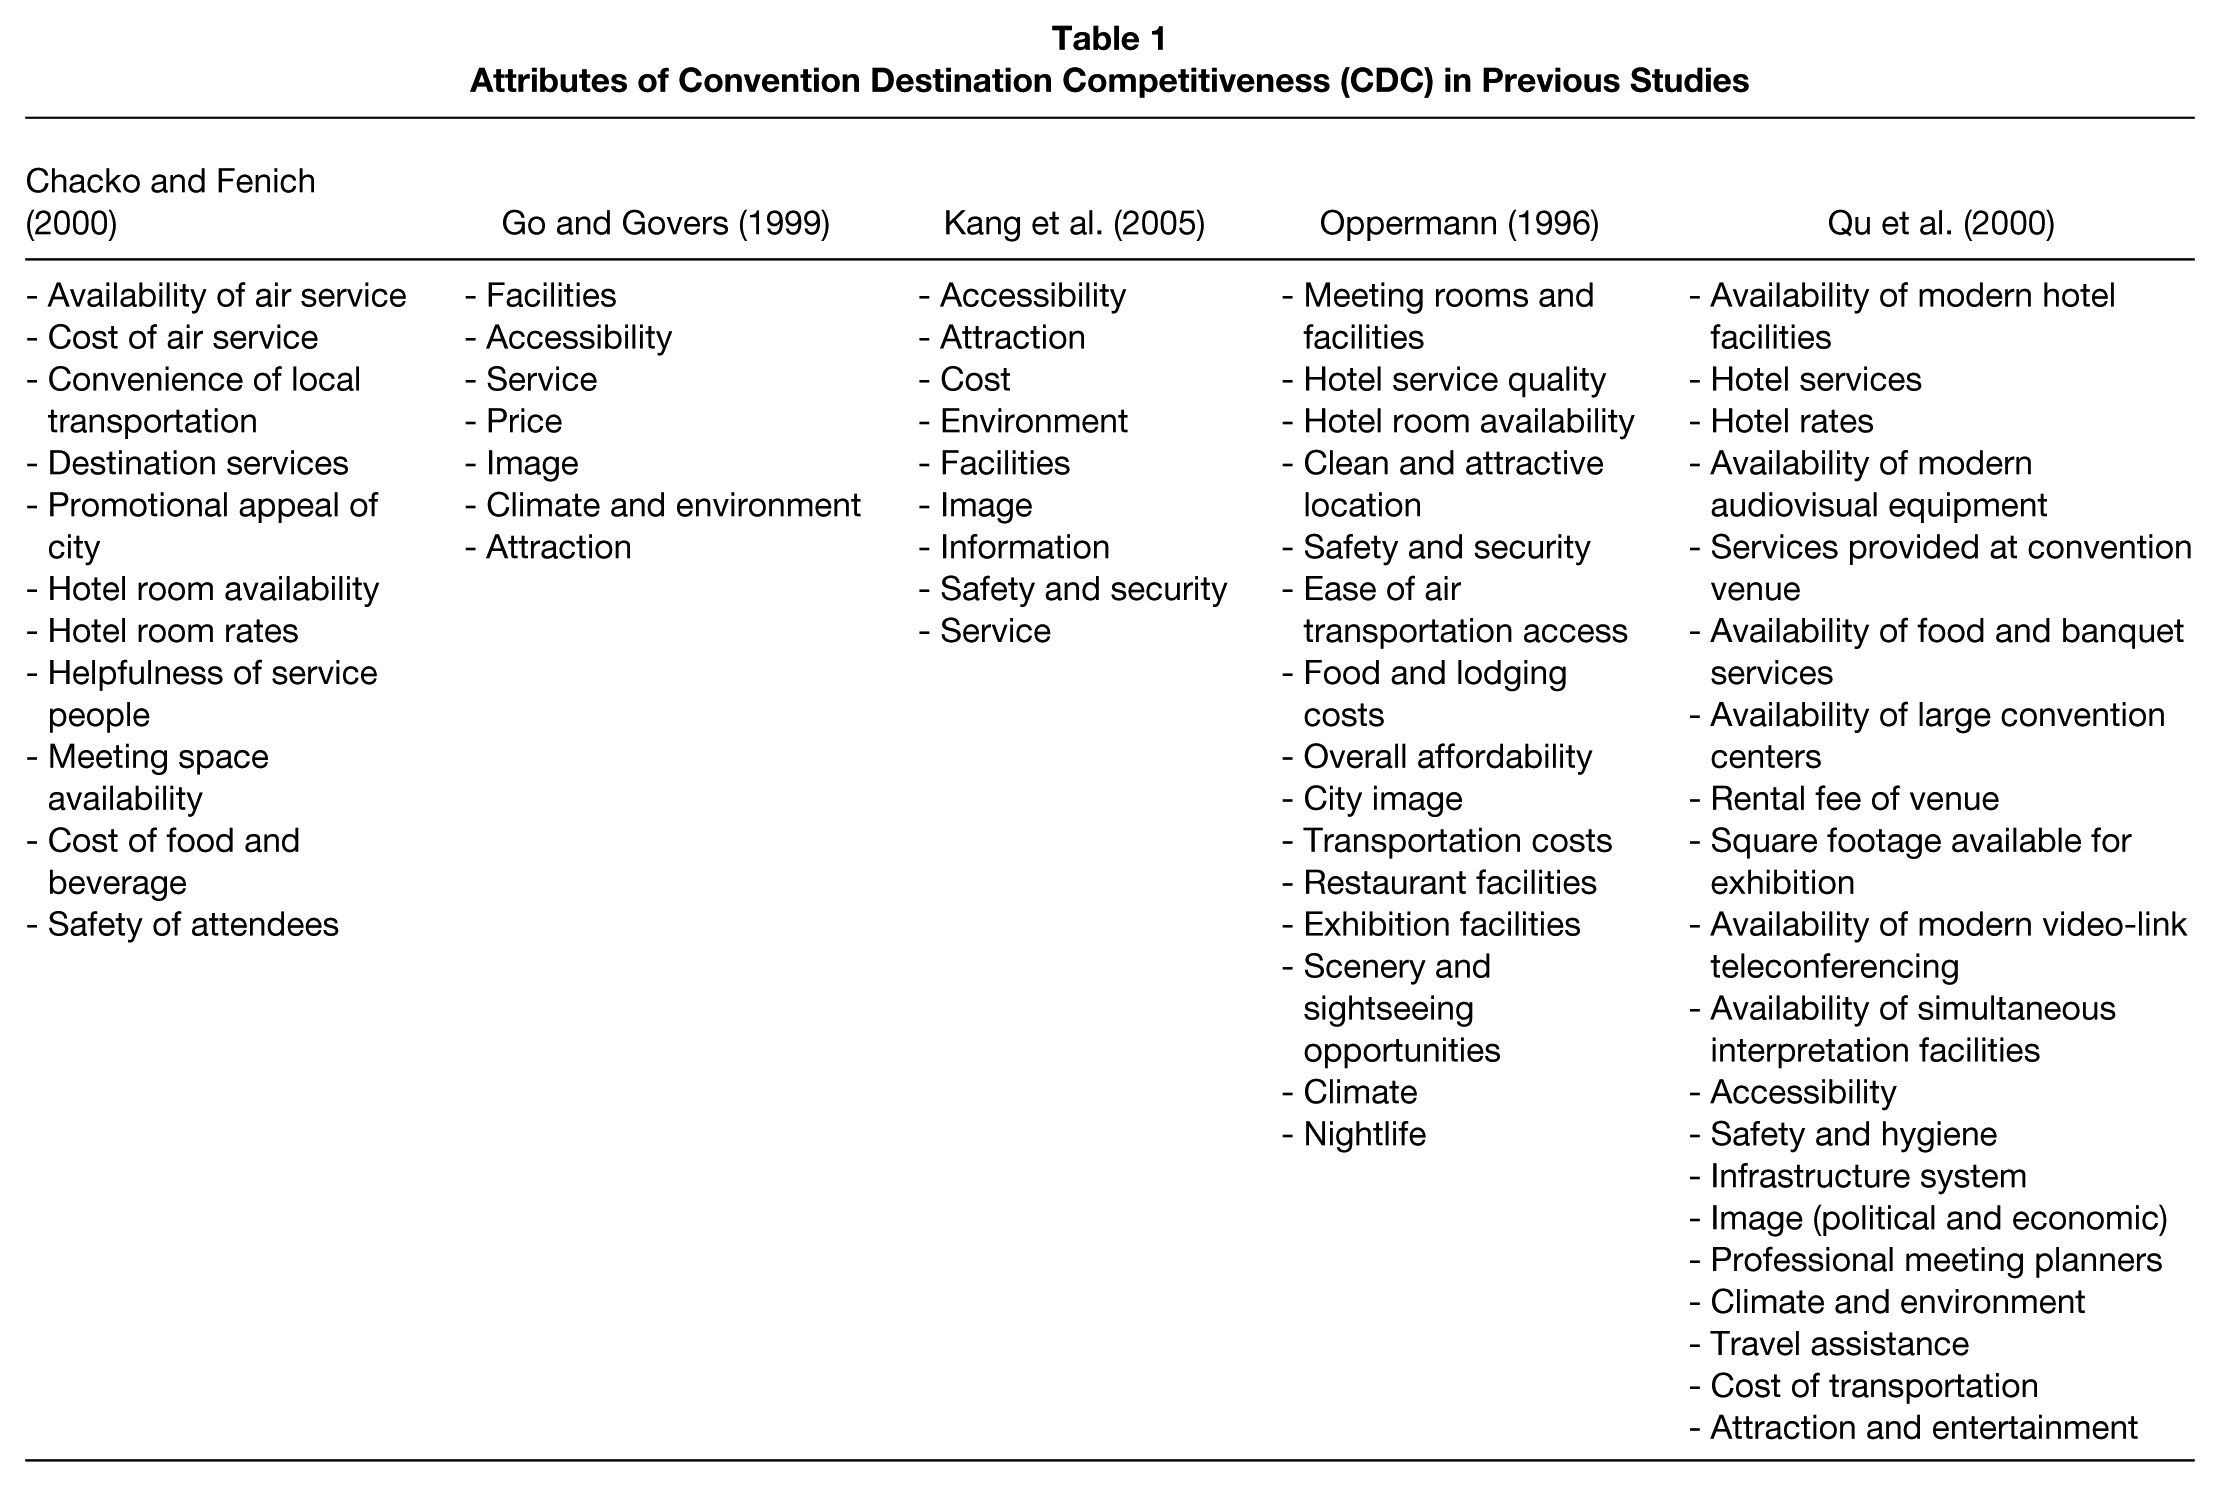
Hence, the competition among convention destinations is getting fiercer than ever (Weber & Ladkin, 2004), and it becomes critical for those destinations to understand key success factors to establish themselves as competitive destinations and to satisfy customers’ expectations (Go & Govers, 1999). Consequently, several studies have tried to identify key convention destination competitiveness factors based on the perceptions of major stakeholders, mainly meeting planners (Chacko & Fenich, 2000; Go & Govers, 1999; Kang et al., 2005; Oppermann, 1996; Qu et al., 2000). The reason why the five studies listed in the previous sentence were chosen for content analysis is twofold. The first reason is that they addressed convention destination competitiveness and the determining factors for competitiveness, whereas other studies merely provided a checklist for site selection. In other words, other studies focused only on the demand side (the meeting planners’ perspective), whereas these studies also looked at the supply side’s view—usually, DMOs. The second reason is that the studies reflected current trends and included a comprehensive examination of essential factors for the larger convention industry. They were not restricted to specific types of conventions such as corporate meetings, association conventions, academic seminars, or trade shows, but strived to provide a holistic view of the convention industry. (See Table 1.)
Attributes of Convention Destination Competitiveness (CDC) in Previous Studies
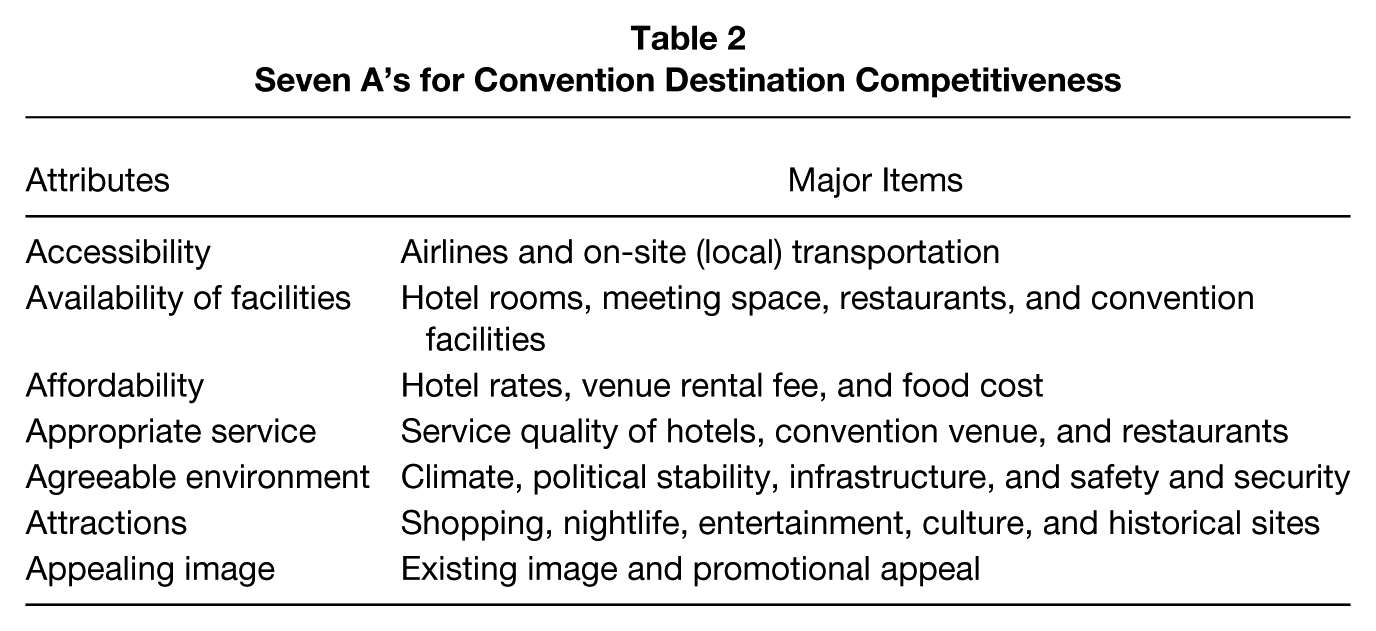
Based on the content analysis of the five studies, this study developed a new typology to evaluate convention destination competitiveness. Although the previous studies grouped and defined attributes in a somewhat repetitive and overlapping manner, this new categorization can provide a holistic view when it comes to the evaluation of convention destinations. This study named the new sets of attributes the Seven A’s of CDC; they are mutually exclusive and collectively exhaustive criteria.
As summarized in Table 2, the first attribute is accessibility, which covers how accessible a particular destination is. It includes airline service, on-site (local) transportation, as well as the time and effort to travel to the destination. The second element is the availability of facilities. This covers not only available hotel rooms, meeting space, and restaurants but also unique facilities for conventions, such as modern audiovisual (AV) equipment, simultaneous interpretation, and video-link teleconferencing. The third attribute is affordability, which is related to monetary costs. In other words, it measures the affordability of accommodations, transportation, food, the rental fee of the venue, and so forth. Appropriate service evaluates the efficiency and quality of service as well as the helpfulness of service people at hotels, the convention venue, restaurants, and all other hospitality businesses at the destination. The fifth element is agreeable environment, which covers climate, social and political stability, the infrastructure system, and safety and security issues such as hygiene and the crime rate. The sixth attribute is attractions, which covers tourism features such as shopping, nightlife, entertainment, and cultural and historical uniqueness. The last element is the appealing image of a destination. It includes both the existing image built by historical perception and the promotional appeal of a city for building a new image.
Seven A’s for Convention Destination Competitiveness
Methodology
Survey Instrument
The survey questionnaire was developed based on a thorough review of the attributes found from previous studies. It was revised after discussion with professors in a hospitality program at a university in the southeastern United States. To measure the perception of the attributes for convention destinations, a 5-point Likert-type scale was used in the questionnaire. The first section of the survey asked respondents to rate the importance of the attributes. The next section was related to the performance of the selected convention destinations. Respondents were asked to rate the designated destinations on each competitiveness attribute. Considering that respondents tend not to spend much time completing online surveys, the measurement items were reduced to the seven A’s, and subitems were provided as examples of the attributes. Show management and the researchers chose this approach so that respondents would be rating the attributes from a holistic perspective. The final section of the study gathered background information of respondents (e.g., convention attendance history and demographics). The study used an online survey that was developed by the researchers in this study (hereinafter, referred to as “the researchers”). An invitation email was sent to attendees soliciting their participation in the survey. The email invitation letter contained a hyperlink, which led the respondents directly to the survey web page. A follow-up email was sent 2 weeks later as a reminder to increase the response rate.
Sampling
After the researchers’ considerable efforts to find conventions from which to collect data, an independent show management company agreed to allow the researchers to survey attendees who participated in conventions hosted by three destinations (Orlando, Florida; Columbus, Ohio; and Birmingham, Alabama). To enhance the homogeneity of the samples for the data’s reliability and validity, the researchers chose three conventions that serve the same industry. The three conventions were held in June (Orlando), September (Birmingham), and October (Columbus), respectively, and are managed by the same company. The online-survey respondents, who received emails, voluntarily visited the survey website by clicking the hyperlink. In consequence, it was a purposive sampling method.
Data Collection and Analysis
A total of 18,278 attendees of the three conventions received emails, and 696 respondents completed the survey. This study calculates a composite index for destination competitiveness comparison. A formula introduced by Opperman (1996) and revised by Go and Govers (1999) was adopted to calculate a Convention Destination Competitiveness Index (CDCI) as follows:

where
CDCId = Convention Destination Competitiveness Index of destination d;
Ia = importance of attribute a (a = 1 … N); and
Pad = performance of destination d with respect to attribute a.
With this composite index, an overall competitiveness comparison among the convention destinations can be conducted.
Oh (2001) posited that there are many controversial issues in terms of the conceptual and practical validities of IPA when interpreting the results. Considering the risk of an invalid interpretation on the IPA grid, this study used IPA mainly to develop the composite indices of the convention destinations, and interpreting the competitiveness of a destination on the action grid was supplementary. In other words, the importance scores played a role as the weight of the proposed attributes, and the performance scores represented measurement of the attendees’ perceived quality in each attribute-based operation.
To examine the group differences between the importance and performance scores of the attributes, repeated measures of MANOVA were implemented (Yavas & Shemwell, 1997). The results from the repeated measures of MANOVA and IPA were compared to produce valid interpretation of the results and to provide insightful implications to the convention industry. This study comprises a within-subject independent variable (i.e., importance and performance), a between-subjects variable (i.e., convention destinations: Orlando, Columbus, and Birmingham), and dependent variables that represent the seven attributes of convention destination competitiveness. The assumptions for repeated measures of MANOVA were checked to see if there were any significant violations.
Results
Profile of the Subjects
The population for this study includes attendees of three Premiere Beauty Shows; one of these shows visited Orlando, Florida (Premiere Orlando & Premiere Day Spa Conference—hereafter referred to as Premiere Orlando); another visited Birmingham, Alabama (Premiere Birmingham); and another Columbus, Ohio (Premiere Beauty Classic). Because the three shows were held at different times, the attendees were contacted in August, November, and December 2009, respectively. After two rounds of email invitations (initial and reminder emails), a total of 696 responses (response rate = 3.81%) were collected with a majority from Premiere Orlando. The response rate from the attendees in Premiere Orlando was 5.26% (448 out of 8,523), whereas that of Premiere Birmingham was 3.30% (115 out of 3,486) and that of Premiere Beauty Classic was 2.12% (133 out of 6,269).
Approximately 50% of the respondents have been attending conventions for 5 years or less (47.0%). Just fewer than 15% of respondents indicated that they have been attending conventions for 6 to 10 years, and 38.2% have more than 10 years of convention industry experience (see Table 3).
Demographic Characteristic of the Respondents
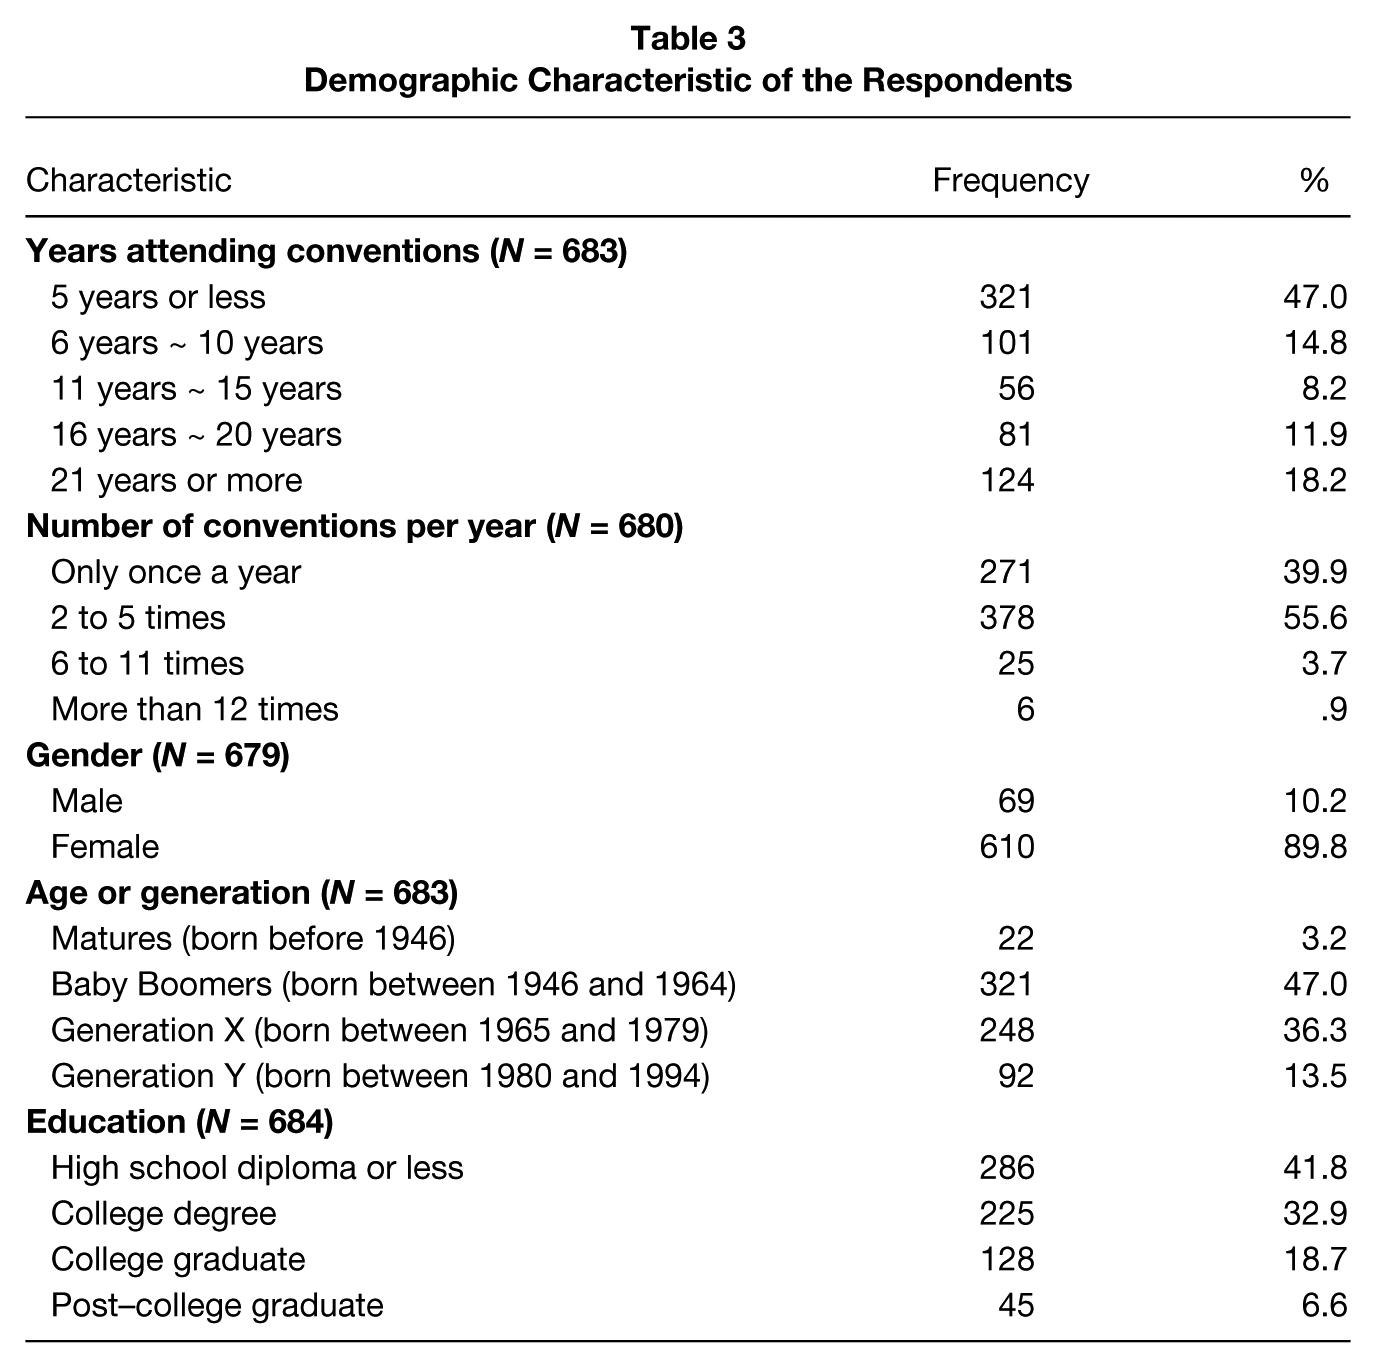
With regard to the frequency of attendance at conventions, a majority of the respondents (55.6%) attended two to five conventions a year. As shown in Table 3, 39.9% of the respondents attended one convention per year, and 4.6% attended more than five conventions. Only 0.9% of the respondents attended more than 12 conventions a year. The average respondent, therefore, can be described as a person who has about 10 years of experience (10.41 years) and attends two or three conventions per year (2.41 times).
The sample was composed of 610 (89.8%) females and 69 (10.2%) males, as depicted in Table 3. This type of gender disproportion was expected because the Premiere Beauty Shows were open only to beauty industry professionals and students who are interested in hair, nails, and the day spa business. The age of the respondents was divided into four different groups (generations): 3.2% were included in the Matures, 47.0% were Baby Boomers, 36.3% were Generation X, and 13.5% were Generation Y. Generation classification by Chester (2002) was adopted for this study. Last, respondents were asked about their level of education. More than half of the respondents (58.2%) received higher education (i.e., a bachelor’s degree or higher).
Importance-Performance Analysis
The importance and performance of competitiveness attributes were measured for individual convention destinations. It is typically recommended that importance be measured prior to the actual consumption experience, whereas performance should be measured after completion of the experience so that importance can be used as a weighting variable of performance (Oh, 2001). The two measurements, however, were conducted on the same survey due to a limitation in data collection opportunity. Importance and performance scores were then directly compared in a two-dimensional IPA grid, which consists of vertical and horizontal axes scaling the importance and performance ratings (Martilla & James, 1977).
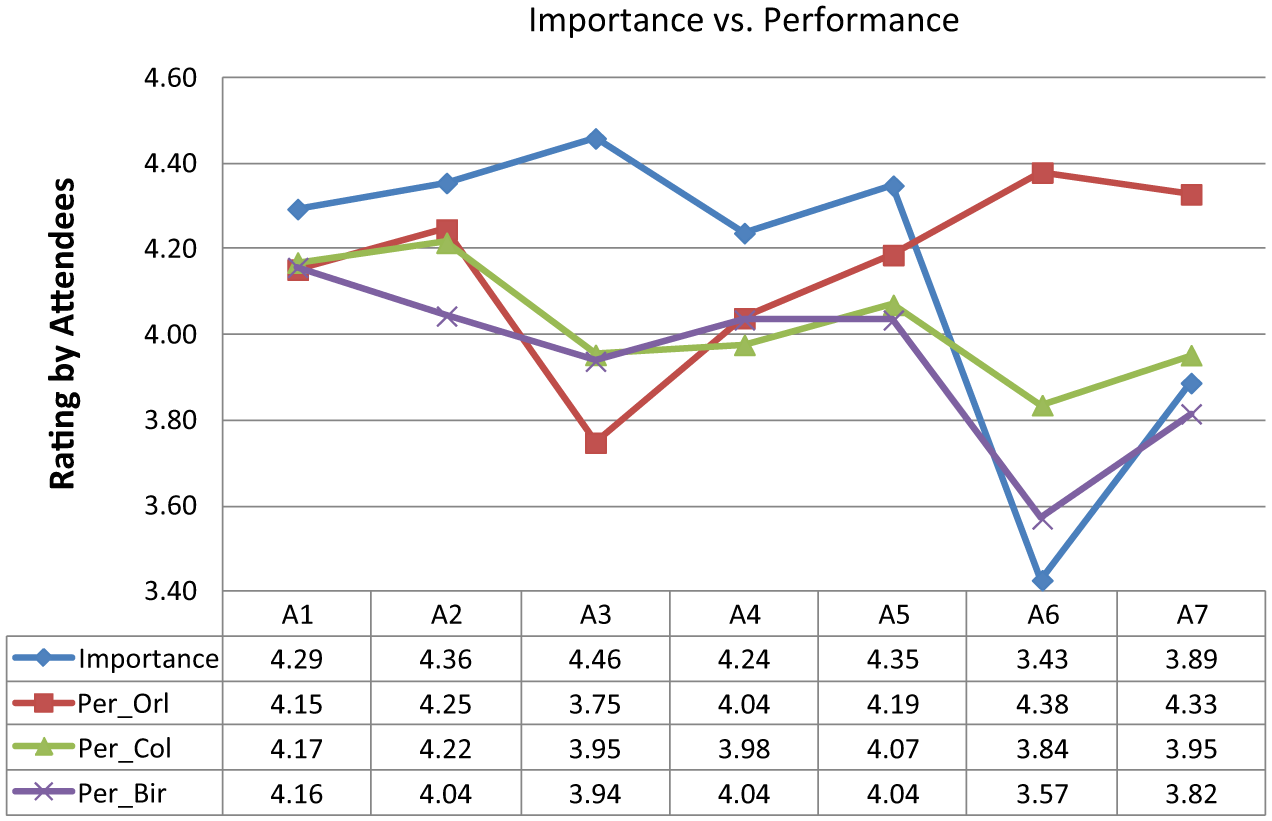
As shown in Figure 1, the study results indicate that the attendees perceived the first five attributes as more important than the last two attributes. The most important attribute was affordability (A3; 4.46 out of 5.00), whereas attraction (A6; 3.43 out of 5.00) was considered the least important attribute for the attendee’s convention participation decision.
Comparison Between Importance and Performance
The respondents showed slightly different ratings for the performance of the three convention destinations. Considering the difficulty in analyzing overall performance among the destinations, the results of the destinations were analyzed separately using the mean score as the crosshairs in the IPA grid.
The top-tier convention destination in this study, Orlando, seems to do well in terms of its average performance scores on the seven attributes (4.15). Respondents rated the affordability performance of Orlando relatively low, however. On the contrary, the respondents gave the highest scores to the city for the two relatively unimportant attributes (A6: attraction; and A7: appealing image), which likely results from its fame as the theme park capital of the world and one of the best family-oriented destinations in the United States. Although Birmingham, Alabama, and Columbus, Ohio, are the largest cities in their respective states, the two cities can be regarded as second-tier convention destinations. Although their overall performance scores are slightly lower than that of Orlando, very little difference in the two cities’ performance ratings compared to Orlando’s was detected in most attributes except for A6 (attraction) and A7 (appealing image).
Furthermore, the two destinations may have a slight competitive edge over Orlando in A3 (affordability). Nelson and Rys (2000) indicated that costs might be an advantage for second-tier convention destinations compared to top-tier ones. They also wrote that cooperative convention staff, the friendliness of the local residents, appeal to specialized or targeted audiences, safety and security, and family-friendly environments could also be advantages for second-tier convention cities. The differences in attributes 2 (availability), 4 (appropriate service), and 5 (agreeable environment) were negligible, however, between Orlando and the two second-tier cities. Respondents from all three destinations rated accessibility (A1) relatively high. This seems to contradict Nelson and Rys (2000), who claimed that a major disadvantage of second-tier cities is that they are inconvenient for travel. They may have been considering conventions that are national or international in scope, however, rather than regional events like Premiere Beauty Classic (in Columbus) and Premiere Birmingham in this study. In contrast, lack of a “clearly identifiable image” and attractions (A6 and A7) comprised the major weaknesses of Columbus and Birmingham compared to Orlando.
The IPA grids for the individual convention destinations are constructed using the grand means of importance (GM = 4.14) and performance (GM = 4.09) as the crosshair points. The crosshair point could provide a guideline to decide which attributes are better than average and which need to be improved. According to the IPA grid depicted in Figure 2, Orlando should concentrate more on improving its affordability. Although the attraction elements and a desirable destination image might be comparative advantages to attract general tourists, those attributes may be relatively less important for convention attendees and consequently have limited impact on the destination’s competitiveness.
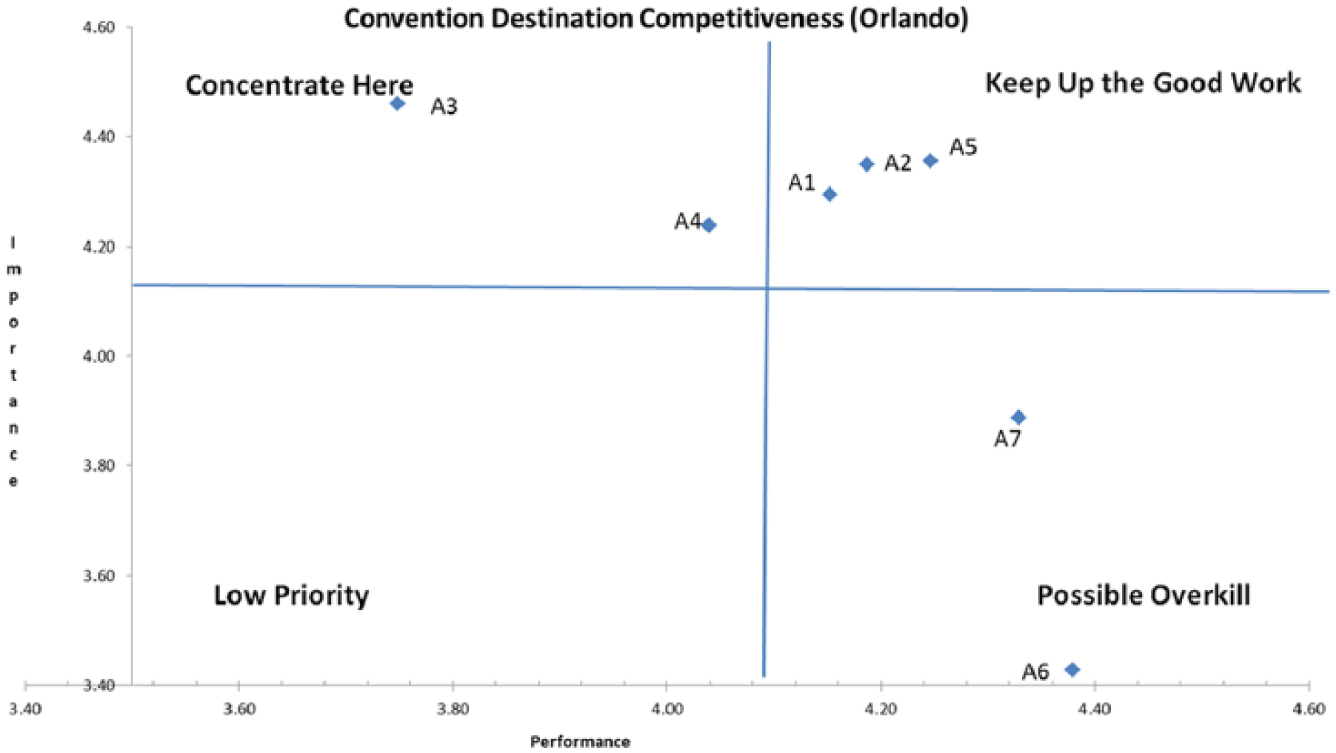
IPA Grid of Orlando as a Convention Destination
The two second-tier destinations showed very similar patterns in the IPA results. Specifically, the scores for accessibility of Birmingham and Columbus, the largest cities in their states, were quite high, whereas the availability of the facilities in Columbus appears better than that in Birmingham (compare Figures 3 and 4). Although Nelson and Rys (2000) claimed that the environment of second-tier destinations is more favorable than that of top-tier ones (usually big cities), the cities in this study do not have a distinctive edge over Orlando, which showed better performance in A5 (agreeable environment).
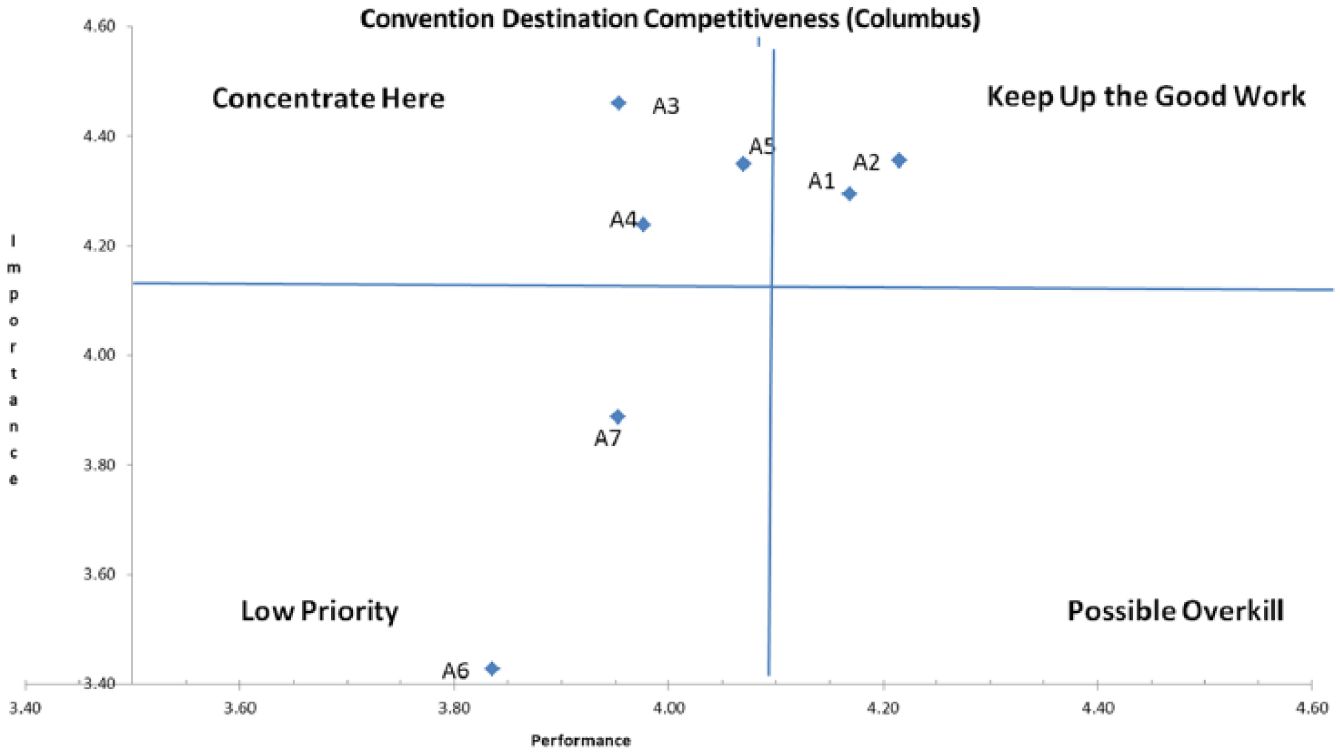
IPA Grid of Columbus as a Convention Destination
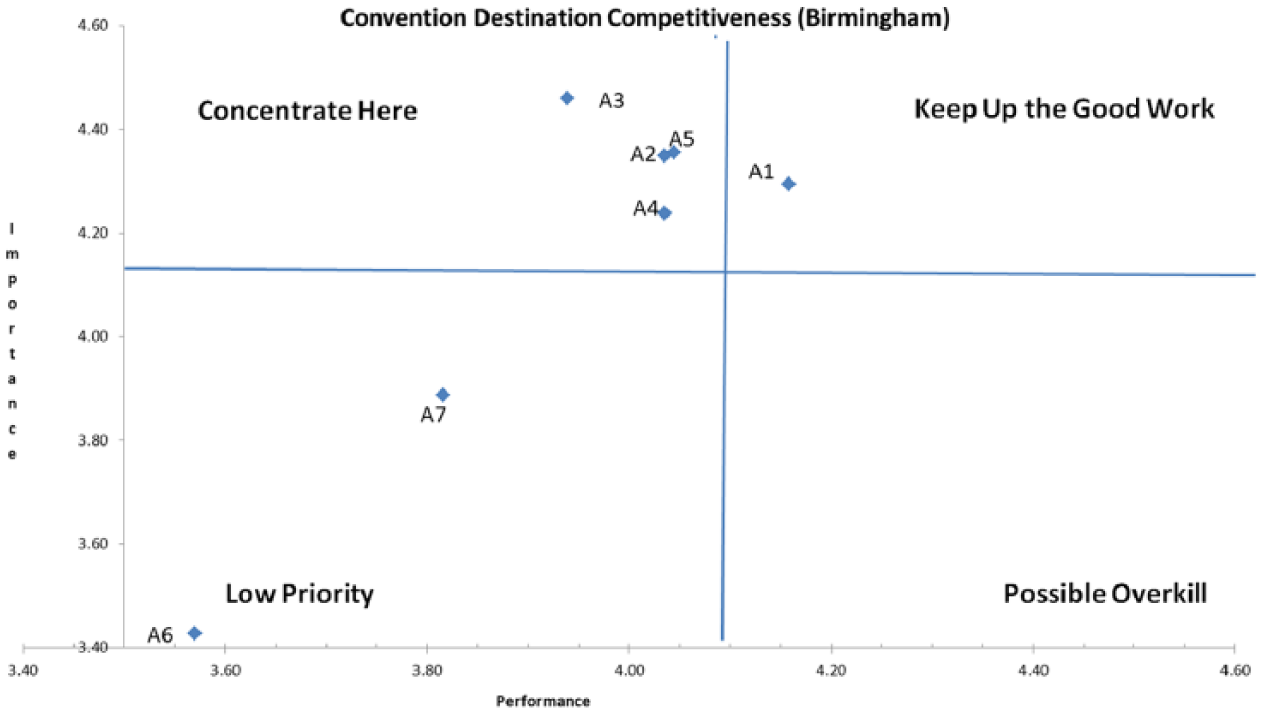
IPA Grid of Birmingham as a Convention Destination
Although there were no significant differences between the two second-tier destinations and Orlando in terms of the attendees’ ratings of attributes A1, A2, and A4, the second-tier destinations showed weak performances in the two relatively noncritical attributes (A6 and A7). Comparisons between Orlando and destinations such as Columbus and Birmingham may provide critical implications, particularly for the second-tier destinations’ development of their destination positioning strategies.
Convention Destination Competitiveness Index
Based on the survey responses, the CDCI score for Orlando turned out to be 4.14, which was followed by Columbus (4.03) and Birmingham (3.96). To examine if significant differences exist among the composite indices, a series of ANOVA for individual attributes was conducted.
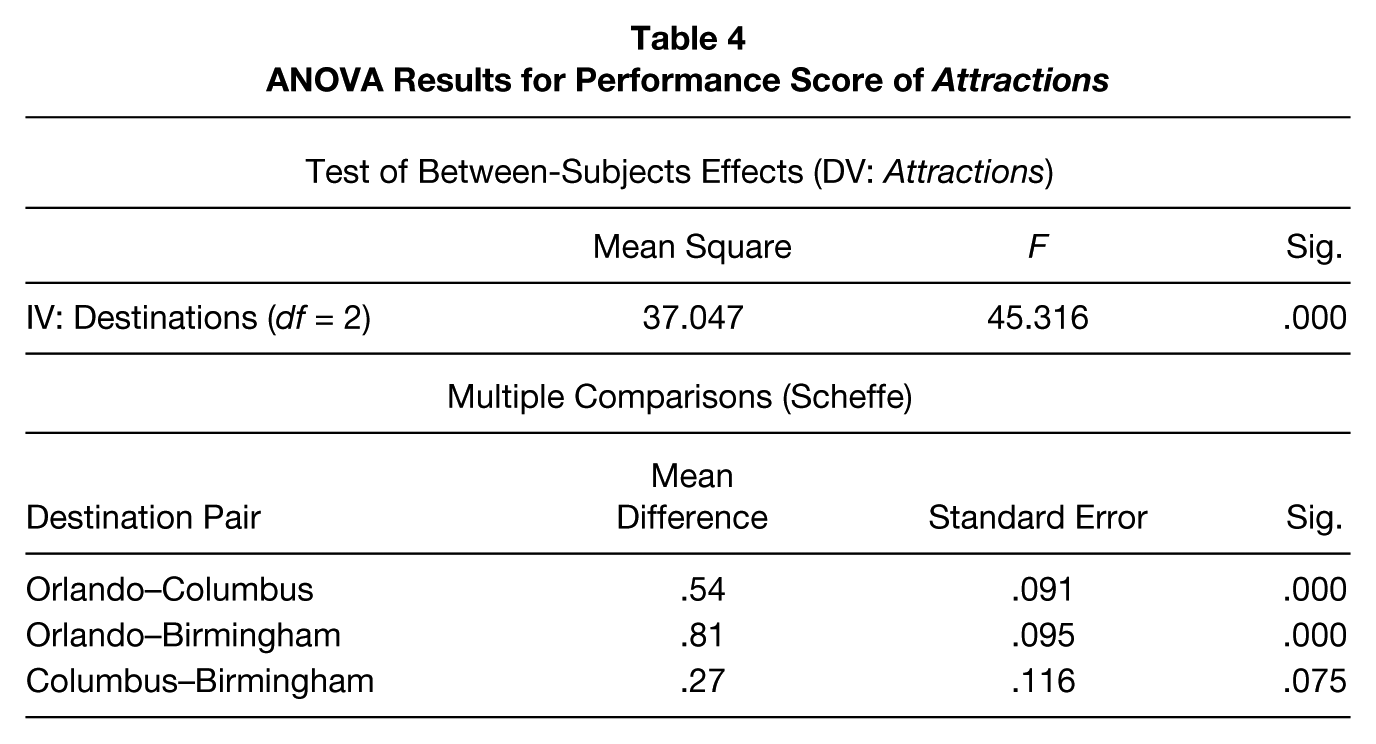
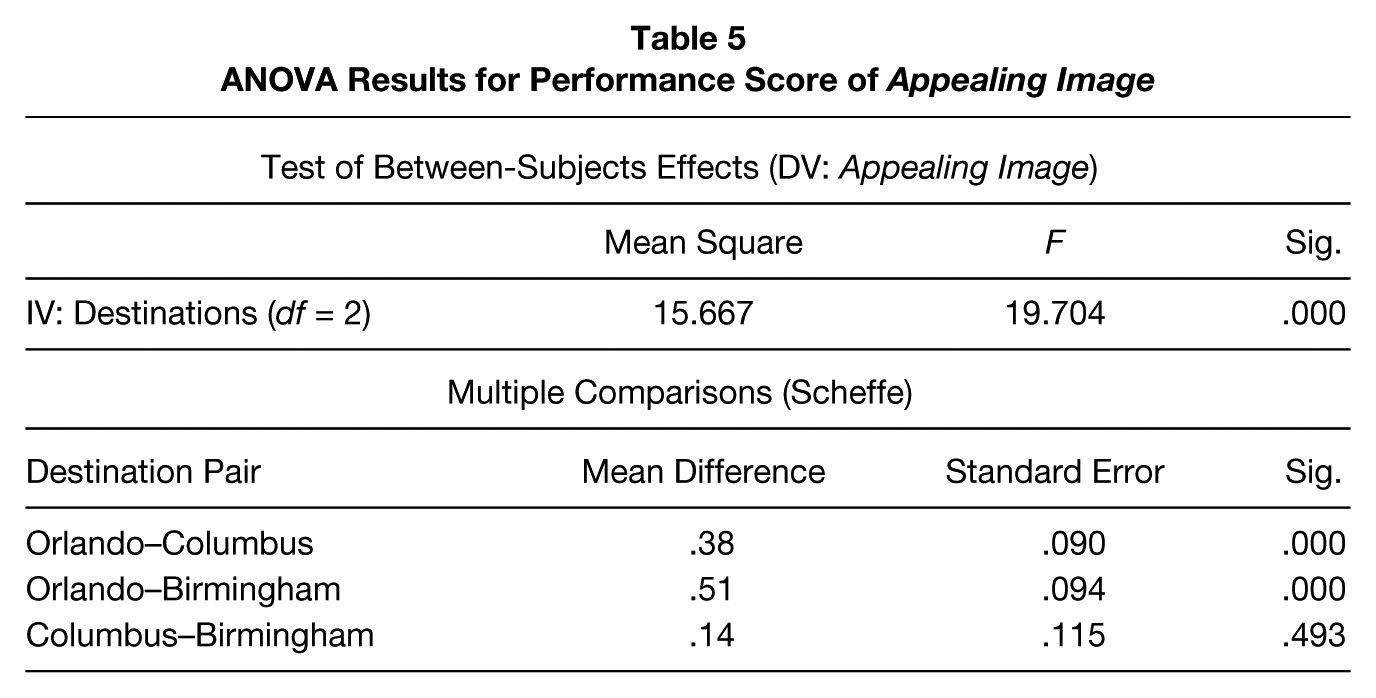
The ANOVA tests were conducted on performance ratings to investigate which attributes contributed to making the difference. Although most of the attributes did not show statistically significant differences, the last two attributes showed significant differences among the three destinations. More specifically, post-hoc tests (Scheffe) revealed significant differences in the sixth (attraction) and seventh (appealing image) attribute ratings between the first-tier destination (Orlando) and the second-tier ones (Columbus and Birmingham). Tables 4 and 5 display these results.
ANOVA Results for Performance Score of Attractions
ANOVA Results for Performance Score of Appealing Image
In addition, five statistical tests were conducted to see whether the significant differences exist in the importance score based on demographic factors. No statistically significant difference was found in four ANOVA tests (regarding attendees’ convention experience, frequency of convention attendance, age, and level of education) and in an independent sample t test for gender.
Results From Repeated Measures of MANOVA
The three destination groups were also analyzed by repeated measures of MANOVA on the seven attributes to compare the results with those from IPA. Mauchly’s W value was 1.00 (χ2 = .000; all p-values >.05), meaning that the sphericity assumption was met. Moreover, both Greenhouse–Geiser and Huynh–Feldt estimates of epsilon turned out to be 1.00, which also indicates that the sphericity assumption was met. The repeated measures of MANOVA results show several things: the interaction effects between importance-performance and destinations followed by simple effects, the main effects for within-subjects (importance-performance differences), and the main effects for between-subjects (destination differences) in the seven measures.
Interaction effects
A significant interaction effect between importance-performance ratings and destinations was found on the combined measures of the seven attributes [F (14, 1268) = 3.760, p < .0005]. Follow-up univariate ANOVA showed that the interaction between destination and importance-performance was statistically significant on A3 (affordability) [F (2, 640) = 4.414, p = .012 < .05, partial η2 = .014]. Moreover, there were also significant interaction effects on A6 (attractions) [F (2, 640) = 34.133, p < .000, partial η2 = .096], and A7 (appealing image) [F (2, 640) = 20.089, p < .000, partial η2 = .059], indicating relatively bigger effects than that of A3. No significant interaction effects, however, were found in the other four attributes. Based on the results, follow-up simple effects were measured on these three attributes both for a within-subject factor (importance-performance) and for a between-subject factor (destination).
First, differences between importance and performance ratings for affordability (A3) were compared at each destination (at the conservative level: .05/2 = .025). For all three destinations, mean scores of importance of A3 were significantly higher than those of performance (ps < .001), which means that these destinations’ affordability level measured via the attendees’ evaluation was significantly lower than the attendees’ perceived level of the attribute’s importance. In case of attraction (A6) and appealing image (A7), only Orlando showed significant differences between importance and performance ratings.
Second, regarding between-subject factors, the destination difference on A3 was compared for importance and performance (at the conservative level: .05/3 = .017). There was, however, no difference among the destinations regarding the attribute for both importance and performance. In regard to A6 and A7, Orlando showed significant differences from the other two destinations in performance scores (ps < .000), whereas the importance scores were not different. The performance scores between Columbus and Birmingham were not statistically different.
Main effects
Within-subjects for importance-performance differences. From the tests of within-subjects effects, a significant main effect was found in the combined measures of the seven attributes [F (7, 634) = 22.046, p < .000, partial η2 = .196]. The subsequent univariate tests showed that significant differences between importance and performance ratings were found in all seven attributes: A1 [F (1, 640) = 8.745, p = .003 < .005, partial η2 = .013], A2 [F (1, 640) = 17.433, p < .000, partial η2 = .027], A3 [F (1, 640) = 70.765, p < .000, partial η2 = .100], A4 [F (1, 640) = 17.182, p < .000, partial η2 = .026], A5 [F (1, 640) = 28.178, p < .000, partial η2 = .100], A6 [F (1, 640) = 38.958, p < .000, partial η2 = .057], and A7 [F (1, 640) = 3.890, p = .049 < .05, partial η2 = .006]. All of the measures indicated that, overall, the attendees’ evaluations of importance on the key attributes were higher than their performance ratings except for the last two, relatively minor attributes to the attendees (A6 and A7). Attractions (A6) and appealing image (A7) showed significantly lower importance scores than performance scores: A6 (mean of importance: 3.43 vs. mean of performance: 4.13) and A7 (3.88 vs. 4.17).
Main effects
Between-subjects for destination differences. Statistically significant differences were found among the destinations in the last two attributes: A6 (F (2, 640) = 7.864, p < .000, partial η2 = .024) and A7 (F (2, 640) = 4.792, p = .009 < .05, partial η2 = .015). Attendees of Orlando rated significantly higher scores for attractions (p = .001) and appealing image (p = .008) than those of Birmingham. However, no significant difference was found between Orlando and Columbus or between Columbus and Birmingham.
Conclusion
Discussion on Findings of the Study
Based on the review of previously published studies, this study established indicators that can be used to measure convention destinations’ competitiveness and explored the following research objectives:
Finding empirically valid indicators that represent various aspects of convention destination competitiveness
Developing the composite index for convention destination competitiveness that shows the status of each destination and further indicates the strengths and weaknesses of a convention host city
Analyzing the results through both IPA and repeated measures of MANOVA
Inferring the attendees’ perception about an optimal convention destination based on their experience from convention attendance
It can be inferred that affordability, the weakest attribute of Orlando in its IPA, may be a common problem of a few top-tier convention destinations in the United States that have the infrastructure required to host big citywide conventions. The demand on top-tier convention destinations that exceeds the supply for mega-events has driven the costs in those destinations higher (Fenich, 2008). Due, however, to the development of infrastructure in newly emerging convention destinations, the expansion of existing venues, and the recent economic recession, the weakness in affordability may cause a top-tier destination such as Orlando to lose its competitive edge in the long run. Consequently, policy makers and destination marketers of Orlando and other top-tier destinations need to address this concern. The results of the study also indicate that convention attendees are price sensitive and that even second-tier destinations are not exempt from criticism for high prices.
Accessibility is a common strength among the three destinations in question, possibly due to well-developed transportation systems, for both air and automobile travel, in the United States. Orlando hosts more national and international conventions that require good airlift, whereas Columbus and Birmingham host more regional shows that are dependent on good highway systems.
Although Orlando demonstrates relative strength in A5 (agreeable environment) over the other two destinations, it may not be a critical concern for Columbus and Birmingham, whose ratings for A5 are very close to the crosshair of IPA grids and are not statistically different from that of Orlando. Likewise, performance ratings for A2 (availability of facilities) for Orlando and Columbus were higher than that of Birmingham, but the difference was not statistically significant.
The prominent competitive edge of Orlando over the two other destinations lies in A6 (attractions) and A7 (appealing image), indicated by the results from ANOVA, the repeated measures of MANOVA, and the graphical presentation of IPA results (i.e., the IPA action grid in Figure 2). This finding, however, may not necessarily be considered a detriment to Columbus and Birmingham’s image as convention destinations because these two attributes were considered relatively unimportant by the respondents. In addition, it is likely that these attributes are more important to leisure travelers than to business or convention travelers. Second-tier convention destinations such as Columbus and Birmingham may focus on the other attributes (e.g. affordability or exceptional service), which are more directly related to convention destination competitiveness, as ways to differentiate themselves from top-tier destinations. This finding supports previous research by Nelson and Rys (2000) and comments from many other leading industry professionals (Russell, 2011).
Implications of the Study
This study may have meaningful implications for meeting planners who strive to select the best convention sites for their clients. When developing goals and objectives for their events, they can begin to consider appropriate destinations that offer as many of the Seven A’s as possible and that best serve their and their attendees’ purposes. For example, a planner who knows that a meeting is designed to attract delegates from a certain geographic area can select a destination that offers good air or ground accessibility. If delegates like to combine a family vacation with their convention, the planner can select a destination that offers high-quality attractions (A6) and a desirable image (A7).
Also, DMOs and policy makers in a convention destination may find the study results helpful in guiding their decisions regarding the development of convention-related factors that influence meeting planners’ site selection processes (Go & Govers, 1999; Qu et al., 2000). Based on the results of the study, limited resources can be invested effectively and efficiently based on the priorities that are set by the DMOs and policy makers of the convention host cities.
To address the issue of affordability, the DMO might work with local businesses to provide discount programs for convention attendees. DMOs could develop various promotions that appeal to cost-conscious convention attendees for dining, attractions, and shopping. Although some might suggest that hotel and car rental taxes be reduced to make the destination more affordable, this strategy could end up hurting the DMOs because many of them rely on these taxes for their funding. In the long run, Orlando, Florida, may need to improve its affordability because it may lose their competitive edge over about 300 or more U.S. cities that have convention centers in competition with them (Fenich, 2001). Without proper measures to enhance affordability, Orlando may lose clients just as Chicago has lost customers to their more cost-effective competitors like Las Vegas and Orlando.
Second-tier destinations such as Columbus, Ohio, and Birmingham, Alabama, can use the results of this study to develop their competitive advantages. First, they may better understand their status in the U.S. convention market and the ways to become more competitive as a convention destination. They may focus on specific target markets that tend to look for more affordable and service-oriented destinations (e.g., social, military, educational, religious, and fraternal [SMERF] markets). This kind of differentiation strategy will help the destination establish its unique position in the meeting and convention marketplace.
Convention attendees, who are ultimately the consumers of the events and generate positive economic impacts for the host destinations, have generally been ignored in the literature of research on destination selection processes. This study was an attempt to discover their perceptions of important convention destination attributes. Analysis of convention attendees’ opinions may lead to improved marketing strategies for not only convention planners who want to attract more attendees but also destination marketers who want to host as many successful conventions as they can.
Limitations of the Study
There are several limitations of this study. First, the limited number of destinations studied leads to low generalizability. Any convention city can now compete against other destinations to attract convention tourists except when there is a capacity-specific limitation. Hence, the comparison between a top-tier destination and two second-tier destinations is much more meaningful than ever. It still, however, may be more beneficial to compare Orlando, Florida, with comparable top-tier convention destinations such as Chicago, Illinois, or Las Vegas, Nevada. The unique characteristics of the beauty shows can also limit the generalizability of this study’s findings. The female-dominant and retailing-focused atmosphere may be somewhat different from that of trade shows that attract more male attendees and wholesalers. Although the sampling from the beauty shows was appropriate in terms of homogeneous sampling pools, it is hard to represent all the attendees in major conventions.
Also, the fact that the survey was distributed to convention attendees after their experience at a destination might have led the attendees’ experiences to affect their importance ratings. In other words, it would have been ideal to get attendees’ opinions of the importance of the attributes prior to their visits to the destination.
A self-selection bias may be another concern. This is not unique to this study but rather a common issue for a self-administered, Internet-based survey that can be easily ignored by respondents who decide not to complete it. Although incentives are often used to increase the response rate, it can also promote self-selection bias. Due to the lack of incentive or any measure for increasing the response rate, this study resulted in a low response rate (3.81%) and might be subject to nonresponse error.
Recommendations for Future Studies
First, to validate the results of this study, it is highly recommended that the research method be replicated to include more first- and second-tier destinations. If this study were performed with representative samples from various destinations, it would assist in establishing the generalizability (external validity) of the results. If a meaningful sample size could be collected from various-sized cities (i.e., more top-tier and second-tier destinations), different characteristics of each type of destination would be examined with the specific focus on the similarities and differences between the top-tier and second-tier destinations. It is also crucial to have a bigger sample of attendees who have different demographic and behavioral characteristics. Comparisons between the present study and the recommended studies could yield useful insights for DMOs. Also, more attention needs to be paid to exhibitors, another important stakeholder in the convention industry. Exhibition managers need to understand how their exhibitors perceive destination competitiveness and its effect on the exhibitor’s decision to participate in the event. Comparing their perceptions of convention destinations with perceptions of attendees could yield interesting insights for convention planners.
In consideration of the globalization of the convention industry, future studies might want to compare a variety of international destinations. How potential attendees perceive the importance of the seven A’s through a prism of cultural, economic, and political differences could help planners determine the viability of promoting their events or holding their events outside of their home countries.
Footnotes
Authors’ Note:
This research received no specific grant from any funding agency in the public, commercial, or not-for-profit sectors.