



Abstract
The hotel industry has experienced changes brought on by growth, customer expectations, and the proliferation in the use of e-commerce and online distribution channels. Future hotel success depends on how effectively hotel revenue managers are able to manage different booking channels to maximize hotel revenue. A Data Envelopment Analysis–Balanced Scorecard (DEA-BSC) model to measure efficiency of distribution channel mix using BSC results is presented. DEA-BSC was used because DEA-BSC incorporates multiple metrics simultaneously while traditional business models typically focus on one performance measure such as profit. Inputs for the model include the five distribution channels of C-Res/Voice, GDS, Brand.com, OTAs, and property/relationship sales. Output is the consolidated BSC average. The model was tested and results presented, demonstrating support for the usefulness of the model.
Keywords
Introduction
The hotel industry has become a major force in the world economy with an estimated $550 billion in revenue worldwide (Hospitalitynet, 2015). In the United States, hotels support over 8 million jobs and contribute $600 billion to the U.S. economy each year (American Hotel & Lodging Association, 2017). Technology has become a major disruptor in the hotel industry creating a new “era of growth and transformation” (Deloitte, 2017, p. 3). Growth, along with changes in the hotel industry have forced a shift from a product-focused, physical asset-intensive industry to a more customer focused, brand-intensive industry with the goal of value maximization for investors, owners, and property-level managers (Hecht, Mayier, & Perakslis, 2014).
According to Xu, Zhao, and Xu (2014), the Internet has changed the way people live and purchase goods and services in profound ways. This phenomenon has been especially true for the hotel industry. The rapid growth of the Internet e-commerce environment has made the relationship among the electronic channels easier to access and use for consumers (Hua, Morosan, & DeFranco, 2015) but the revenue streams are more complicated to understand for hotel personnel (Chawla, 2014). Customer behavior and continually evolving technology are constantly challenging traditional revenue management strategies (Webb, 2016). Noone, Enz, and Glassmire (2017) argued that there has been a call “for a shift in focus from revenue to profitability” (p. 3) and revenue management will need to consider both top line revenues and costs for improved performance. Given the new hotel industry landscape, developing and implementing an effective model to measure and improve hotel performance and efficiency has become contextually complex and challenging (Beck, Knutson, Cha, & Kim, 2011) and yet necessary.
In recent years, hospitality researchers and practitioners in the fields of revenue management, marketing, and hotel performance have sought to explore ways that can measure hotel performance and efficiency comprehensively and accurately for business improvement (Chawla, 2014). One such method is a Balanced Scorecard (BSC). The BSC is more than a single measure of performance but instead considers key indicators that take into account both financial performance and key stakeholder feedback (Dudin & Frolova, 2015). A challenge of using BSC as an external benchmarking tool is the various ways data are collected and measured. To overcome this obstacle, using BSC in conjunction with a different type of methodology should be considered.
Data Envelopment Analysis (DEA) is a nonparametric (not requiring any prior assumptions or connection among variables) method of measuring efficiency for the purposes of benchmarking (Zhu, 2014a). DEA is a linear programing method that employs mathematical programming by taking inputs in the form of measurements and comparing them with peer inputs and reports a “score” based on the output measures introduced to the program. The purpose of this research is twofold (a) to develop a model using DEA that measures the optimal revenue channel mix performance as determined by the BSC results and (b) determine if the model can identify benchmark hotels and provide non-benchmark hotels with information to assist them in improving their performance.
Review of Literature
Over the past three decades, revenue management has moved from analyzing inventory-related factors to examining the right price for the inventory (Noone, Canina, & Enz, 2013) with the right channels ultimately optimizing revenue for the hotel. Early research focused on yield management, with pricing and forecasting as their central themes (Cross, Higbie, & Cross, 2009). By the early 1990s, yield management morphed into revenue management (Cross et al., 2009). For the purposes of this research and consistent with the academic research literature, the terms of yield management and revenue management will be used interchangeably throughout this study.
Revenue Distribution Channels
Distribution channels play an important role in hotel business strategies, profitability, and customer supply and demand (Kracht & Wang, 2010). The proliferation of new ecommerce and online revenue channels has changed the way that revenue and performance are considered in the hotel industry. Traditional revenue distribution channels, while still in existence, are being overshadowed by online channels. With more than 50% of all hotel bookings made online (Hospitalitynet, 2015), hotels and hotel revenue managers need to be able to manage all of the various revenue channels better than their competition, create sustainable profit streams by investing in the channels that yield the greatest returns, and maintain the integrity of their pricing strategy (Green & Lomanno, 2012) to achieve their business goals and financial results.
The number of revenue distribution channels has also evolved and multiplied over the past 40 years (Green & Lomanno, 2012). Online channels have grown at a disproportionate rate and are constantly changing, merging, and bypassing one another, while simultaneously cooperating and competing with each other (O’Connor & Frew, 2002). The rapid growth of the Internet e-commerce environment has made the relationship among the electronic channels easier to access and use for consumers (Hua et al., 2015) but the revenue streams are more complicated to understand for hotel personnel (Chawla, 2014).
The goal of a hotel is to sell every room, every night, at the right price. Each room sold comes from a revenue channel. Each channel has a different revenue and expense associated with it. The role of traditional revenue management was to develop strategies to maximize revenue through each channel (Noone et al., 2017).
Traditional revenue management and the channel that includes a Central Reservation System (C-Res) used by hotel companies include both telephone reservations made by customers who have not migrated online and through reservations made at a hotel property using a property management system that is linked to the C-Res (Emmer, Tauck, Wilkinson, & Moore, 1993). C-Res systems are historically foundational to the growth of revenue management processes and systems (Maier, 2012). Several studies on the use of technology have determined that not all customers have migrated to a completely online model yet (Parasuraman & Colby, 2001) and those that have not continue to make reservations in person or on the phone (Simplotel, 2016). TravelClick (2016) reported that the C-Res channel contributed approximately 14% to hotel revenues in the United States as of first quarter 2016.
The Global Distribution System (GDS) has been identified as the first channel in the digital era of the hotel industry, where travel and tour agencies had the ability to book airline tickets and hotel rooms from their offices (Green & Lomanno, 2012), making it the first technology to allow bookings provided by a third-party intermediary. Christodoulidou, Brewer, Feinstein, and Bai (2007) defined GDS as “a technology system used to display services, bookings, and ticketing in tourism globally” (p. 93). While the travel and tour agencies and the GDS channel are not as strong as they were in the past, both are still important conduits for business in the hotel industry. TravelClick (2016) reported that approximately 16% of hotel revenues came from the GDS channel in the United States as of first quarter 2016.
The next evolution in e-commerce for hotels was the development of a series of online travel agencies referred to as OTAs. Expedia, PreviewTravel, Priceline, and TravelBids were early examples included in the OTA channel that began to provide their customers with direct access to online travel products (Xiang, Wang, & O’Leary, 2014). The advent and growth of this channel has added layers of complexity and placed more decisions in the hands of hotel managers, revenue managers, and customers (Maier, 2012). By 2010, 57% of the rooms from the top 30 brands were booked online (Guo, Zheng, Ling, & Yang, 2014). TravelClick (2016) reported that the OTA channel contributed approximately 16% to hotel revenues in the United States as of first quarter 2016.
By 1996, three major brands (Marriott, Hilton, and Hyatt) had hotel web sites (Green & Lomanno, 2012) creating the first “Brand.com” channels. Nearly every chain or brand now has an e-commerce website or its own Brand.com site. This channel concept grew to counteract intermediaries’ attempts to control the rapidly growing OTA distribution channels (Kimes & Wirtz, 2015). As intermediary channels continue to proliferate, hotel brands are dedicating more time and money to developing their own respective websites (Liu & Zhang, 2014). TravelClick (2016) reported that the Brand.com channel contributed approximately 35% to hotel revenues in the United States as of first quarter 2016.
The in-house sales channel has been about building relationships with targeted customers by sales professionals. In the late 1980s, when the discipline of revenue management was in its infancy, many firms focused on this direct channel and the techniques that sales people could employ to build long-term relationships, resulting in value creation for customers, suppliers and the firms themselves (Weitz & Bradford, 1999). TravelClick (2016) reported that in-house sales channel contributed approximately 19% to hotel revenues in the United States as of first quarter 2016.
Distribution Channel Mix
Each distribution channel contributes to hotel channel mix and “operates parallel to and in competition with other channels” (Tan & Dwyer, 2014, p. 4). Each channel in the mix represents a percentage of the overall revenue. Each comes with different costs and benefits. Traditional channels such as C-Res and the GDSs have significantly lower costs to the hotels but are declining as customers continue the transition to online channels (Law, Lo, Lo, Leung, & Fong, 2015). In-house sales can build long-term relationships but on a much smaller scale and tend to be more effective in the group sales arena. Brand.com offers customers the opportunity to book online with lower hotel costs. Beritelli and Schegg (2016) have suggested Brand.com is “10 to 15 times cheaper than the OTA channel and 4 to 10 times cheaper than the GDS” (p. 72). However, Brand.com does not have the same marketing power and hotel exposure, as does the much more expensive channel of the OTAs.
The challenge of revenue management is to maximize revenues and minimize expenses while still ensuring maximum marketing exposure and meeting customer preferences and expectations. The right combination or channel mix drives the optimal hotel exposure and high levels of overall hotel performance (Green & Lomanno, 2016). One challenge in the hotel industry is in the way to measure channel performance. Another challenge is lack of a universal industry standard that measures optimal channel mix. While an increasing number of studies are focusing on individual channels, online channels (Masiero & Law, 2015), and effective channel marketing, there are few research studies investigating the impact channel mix has on hotel performance.
One possible way to consider measuring optimal channel mix is through benchmarking. Zhu (2014a) suggested, “benchmarking positively forces any business unit to constantly evolve and improve in order to survive and prosper in a business environment facing global competition” (p. 3). For benchmarking to be effective, the first step is to consider a measure for hotel performance. Using traditional financial accounting measures like return on investment and earnings per share can give misleading signals for continuous improvement and innovation.
Measuring Business Performance
Turuduoglu, Suner, and Yildirim (2014) contended that performance measurement has been an important topic of research and study for many years. Measuring performance can be defined as a process “where performance is correlated with actions converted into numbers” (ul-Arifeen et al., 2014, p. 39) and includes both financial and nonfinancial indicators that can also seek to identify causal links among measures, strategies, and outcomes (Sainaghi, Phillips, & Corti, 2013). A firm’s ability to measure its performance is critical to its long-term success. J. B. Brown and McDonnell (1995) argued, “it has been recognized for some time by both practicing managers and academic researchers alike, that no one performance measure can adequately meet the needs of management in a competitive environment” (p. 7). Determining that traditional financial accounting measures like return on investment and earnings per share can give misleading signals for continuous improvement and innovation, Kaplan and Norton (1992) developed a framework to measure performance evaluation.
In a seminal article in the Harvard Business Review, Kaplan and Norton (1992) introduced the BSC as a new method for systematically measuring business performance. The BSC was based on their work with 12 companies over a 2-year time frame. Initially conceived as a performance measurement tool, over the past 20 years, it has grown into a blended strategic tool that considers the management system of an organization and has been considered “one of the most influential innovations contributing to the transformation of contemporary management” (Modell, 2012, p. 475). It has been “estimated that half of Fortune 1000 companies utilize it” (Kala & Bagri, 2014, p. 167).
Of the various approaches and models to measure performance, the BSC approach has been identified as one of the best approaches in evaluating a combination of financial and nonfinancial performance results in service industries (Kala & Bagri, 2014). While it has been estimated that at least 60% of the major companies in the United States and Europe have adopted a BSC approach to measure performance (Antonsen, 2014), findings of several studies in hospitality scholarly research provide evidence of a significant gap in BSC-related investigation regarding the hotel industry (Hoque, 2014). Neves and Lourenco (2009) argued that the BSC is a better way to measure performance because it provides a balanced approach that includes not just ratios, but nonfinancial measures that affect performance as well. Gesage, Kuira, and Mbaeh (2015) further argued that the key to successful use of the BSC is choosing the right measurements and the right quantity of them.
The original framework for the BSC included four categories: financial, customer satisfaction, business processes, and learning/growth (Kaplan & Norton, 1992). The categories of the BSC can vary from company to company or industry. The BSC framework used in this study included three categories: revenue performance in the form of market share, profitability/flowthrough, and guest satisfaction scores. One challenge of using a BSC is that while it can measure the performance within a hotel, it cannot compare that performance with other hotels for benchmarking. Combining BSC with DEA can be very effective in benchmarking both efficiency and performance measurements.
Data Envelopment Analysis
Efficiency measurement has been a subject of tremendous interest as organizations have struggled to improve productivity for many years (Osman, Anouze, & Emrouznejad, 2014). Charnes, Cooper, and Rhodes (1978) developed a model that introduced the idea of a data envelopment model (DEA) that used linear programing methods to construct a nonparametric, piecewise linear frontier (Barros, 2005; Cook & Zhu, 2013). Its goal was to employ a mathematical programming approach to the construction of production frontiers, the measurement of efficiency in developed frontiers (Barros, 2005) and a new way for “estimating external relations from observational data” (Charnes et al., 1978, p. 443). Since the seminal work of Charnes et al. (1978) on economic and production theories, many different DEA models and their corresponding real-world applications have continued to appear in the literature (Osman et al., 2014; Zhu, 2000) and have been widely applied to various industrial sectors (Zhu, 2000).
The value of the use of mathematical programming in DEA is derived from its ability to estimate inefficiencies or performance, and compare them against peer or a combination of peers with individual decision-making units (DMUs) by using multiple inputs and multiple outputs (Zhu, 2014a). Inherently, DEA has the ability to provide a way for organizations to look at data and use it to be more efficient, reduce operating costs, and improve profitability in ways that are not as easily seen using other methods (Paradi & Sherman, 2014). One of its strengths is that it can be used as a performance model that can show trade-offs among various financial measures (Zhu, 2000). It is a multivariate technique that can handle several different inputs and outputs at the same time (Johns, Howcroft, & Drake, 1997). DEA allows each unit to identify a benchmarking group following “the same objectives and priorities” (Amado, Santos, & Marques, 2012, p. 391). Another strength of DEA, according to Johns et al. (1997), is that it “can use any type of measurement quantity to make its comparisons and is not limited to monetary units” (p. 122).
Many different forms of DEA have been used to measure the efficiency of the hotel industry. Botti, Briec, and Cliquet (2009) used DEA to measure efficiency between hotels in companies that are either completely franchised, completely company owned or a combination of both. J. R. Brown and Ragsdale (2002) used DEA to investigate market efficiency with results that showed that more efficient hotels had less customer complaints and higher perceived value than those less efficient. Johns et al. (1997) looked at productivity using DEA for 15 hotels and found that all of the hotels under study performed with similar efficiency. While much of the research in the hotel industry using DEA has been focused on the bottom line in the form of efficiency and profitability, there has been very little research done specifically about the efficiency regarding the components of revenue management.
Data Envelopment Analysis–Balanced Scorecard
Avkiran and Parker (2010) advocated that DEA is a maturing methodology and suggested that future applications should leverage other methods with complementary differences. Ultimately, the key is to use DEA in tandem with other methods to achieve all the goals of a study. Chang, He, and Wang (2005) argued that combining the methods of DEA and BSC is helpful in evaluating outcomes and measuring achievement. While there are studies using DEA-BSC for measuring performance in a variety of industries, very few studies explored DEA-BSC use in the hotel industry.
Chang et al. (2005) developed a framework using DEA to evaluate the interrelationships among BSC categories for hotels located in Taiwan and Vietnam. Min, Min, and Joo (2008) used a DEA-BSC approach to develop a model for Korean luxury hotels to be able to benchmark performance and through the model concluded that increasing revenue does not necessarily enhance profit. Amado et al. (2012) developed a framework for assessing DMUs from different perspectives using DEA-BSC.
After conducting an extensive review of the literature, no studies involving DEA were found that investigated the relationship between topline sales in the form of distribution channels and their efficiency as measured by BSC results. Therefore, the purpose of this study was to measure optimal channel mix and provide benchmark hotels as identified through hotel performance results using a DEA-BSC approach. While DEA is very effective in analyzing performance that includes multiple data points (Zhu, 2014a), BSC is effective in measuring organizational performance. The combination of a DEA-BSC model is a useful tool in providing balanced benchmarking that can identify benchmark hotels and provide benchmarking information to those hotels that are not performing with data to assist them in reaching effectiveness.
Methodology
The DEA-BSC model was developed for this study to provide the opportunity to measure the most efficient combination of inputs in the form of hotel revenue channels as defined by a consolidated BSC performance in the form outputs for a specific hotel (DMU) using a DEA-BSC approach (see Figure 1). Since DEA does not need a priori weighting or have a priori input and output relationships, DEA works well within the framework of the BSC (Min et al., 2008). DEA efficiency scores can be easily embedded within a framework of the BSC allowing hotel management to address the issues of (a) how the hotel looks regarding financial stability and how to strengthen its long-term financial position, (b) recognizing areas for improvement, and (c) providing services from the customer value proposition point of view (Min et al., 2008).
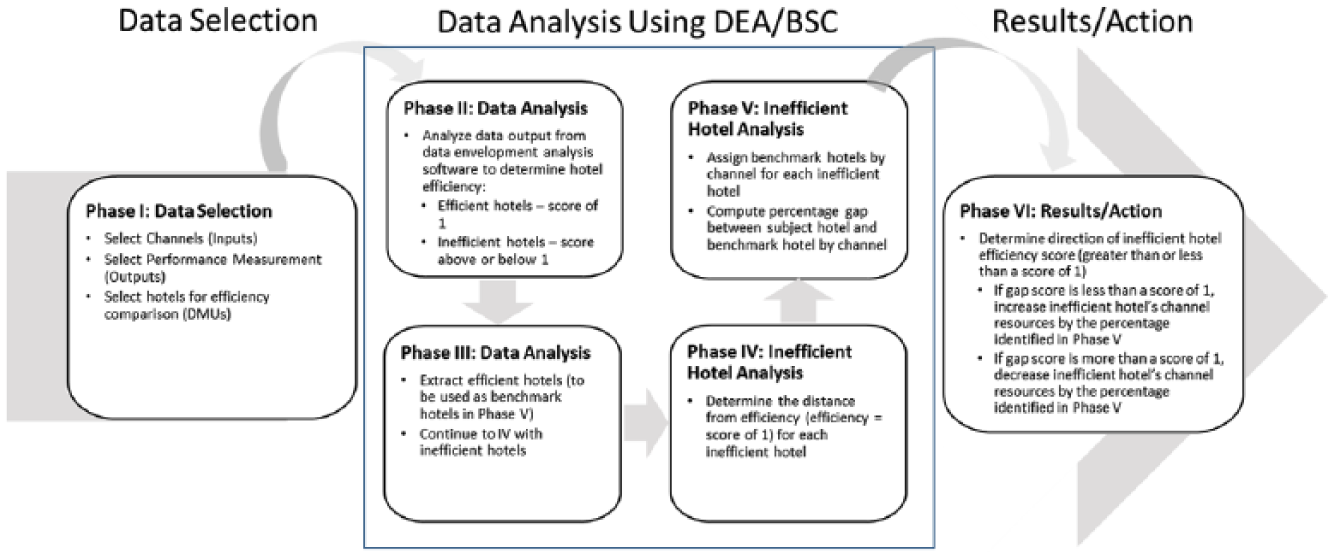
Identification of Ideal Hotel Distribution Channel Mix Model
Background of the Research Methodology
DEA-BSC was chosen for this model because, while traditional business models typically focus on one performance measurement like profit, it considers multiple metrics simultaneously (Zhu, 2014a). As shown in Figure 2, using a more traditional linear or parametric method like regression analysis could generate a production function for a given data set but has three important disadvantages (Rickards, 2003). First, inherent in the regression analysis, it is assumed that all observations input their factors in the same way but the business practice does not follow this expectation (Rickards, 2003). Second, regression analysis can only determine an average, which may not represent any individual unit result, prohibiting it from providing specific benchmarks (Rickards, 2003). Third, each equation can only be analyzed one output at a time, causing the researcher to repeat the regression analysis a number of times equal to the number of outputs required by the study (Rickards, 2003). Another consideration is that using “a single performance indicator to evaluate performance tends to ignore interaction or tradeoff among various separate measures” (Cook & Zhu, 2013, p. 22).

DEA Efficient Frontier Sample
DEA has none of the disadvantages associated with a linear regression approach and it focuses on an efficiency frontier rather than a line fitted through the center of the data (see Figure 2). Linear regression can also hide relationships that are discoverable with DEA (Zhu, 2014b). DEA methods focus on individual performance of each DMU integrating specific benchmarking measures that then generate a composite based on those measures and provides a benchmark set of DMUs (Zhu, 2014a).
If the DMU input–output combination lies on the DEA frontier, it is considered efficient, and conversely if the input–output combination lies above or below the DEA frontier, it is considered inefficient. Thus, the ultimate objective of DEA is to determine which DMUs are operating on their efficiency frontier (i.e., achieve an efficiency score of one) and which are not (Johns et al., 1997).
In a DEA model, production units (in this study, hotels) are evaluated by measuring the efficiency of each unit based on the performance of inputs (channels) and outputs (BSC results). Input and output weights are then determined by means of an optimizing calculation. Next, the relative efficiency of a production unit is derived from the ratio of total weighted outputs to the total weighted inputs. Then based on the calculation of efficiency = output/input, each unit is classified as efficient or inefficient. In DEA, efficiency means to maximize outputs at a given level of inputs. Each unit/efficiency score is then plotted on a frontier.
The frontier is a series of points, a line, or a surface connecting the most productive units, determined from the comparison of inputs and outputs of all units under consideration (see Figure 2). The DEA process then calculates a productivity score for all other units producing similar outputs that are not on the isoquant (Hu, Morosan, & Defranco, 2015). Ultimately the model “floats a piece-wise linear surface to rest on the top of the observation,” and efficiency is defined by the facets on the plane, and the degree of inefficiency is determined by measuring distances from the isoquant using a series of metrics (Barros, 2005, p. 465). DEA answers both the questions of “how well a unit is doing” and “which dimension and how much the unit could improve” (Sigala, 2008, p. 43).
Data Selection
The data used in this study were secondary data provided by a multiunit hospitality company headquartered in the United States. The data included channel mix and BSC data for 54 select service hotels from same family of brands and having similar attributes and amenities. The median size hotel in the data set had 132 rooms, with a mean of 142 rooms. The hotels were located in similar markets throughout the United States. Data for the study were provided in Excel spreadsheets with individual, monthly, and annual distribution channel and BSC information.
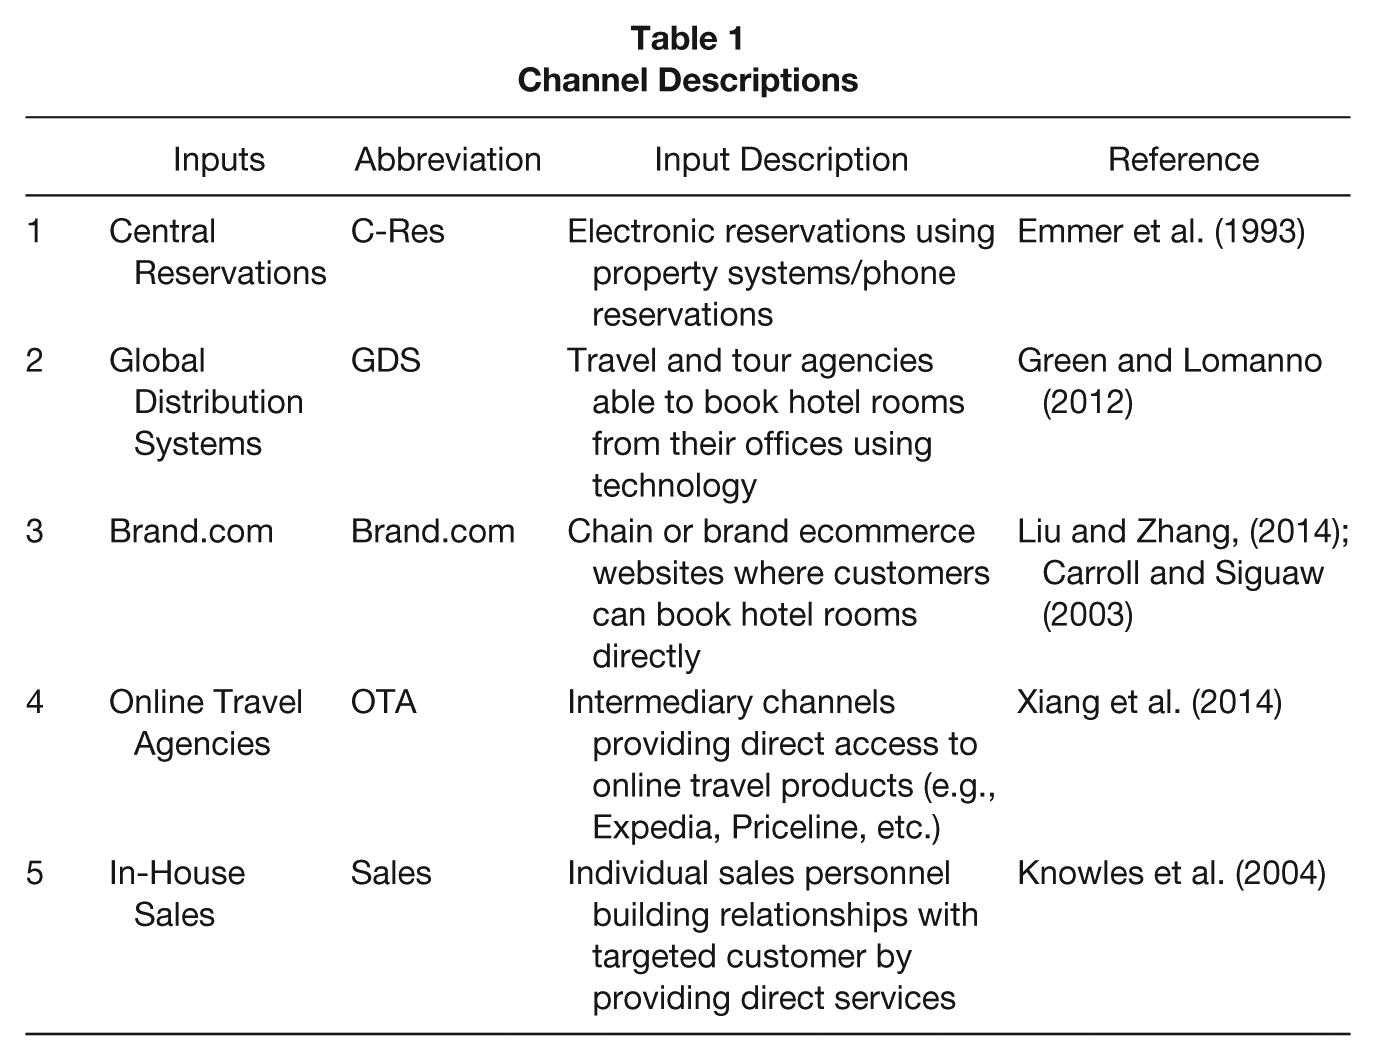
In statistical research, a representative sample is taken from a larger population to be used for the analysis. When using DEA, the group of units (DMUs) under investigation is considered the entire population for that specific analysis. The hotels (DMUs) investigated in this study included all 54 select service hotels. Inputs for the study were the channels of C-Res, GDS, Brand.com, OTAs, and In-house sales. Descriptions for each channel are included in Table 1. The optimal channel mix under investigation for this study is composed of these five channels. The channel measurement used for this analysis was percentage of rooms sold. This measurement was chosen as it is recognized as a common measurement of channel performance in the hotel industry (Green & Lomanno, 2016) and is critical to overall success (Kimes, 1989).
Channel Descriptions
Output for this study was consolidated BSC results for each hotel (DMU). Raw data for the BSC included customer satisfaction, topline revenue/market share and profitable flow-through. To create the ability for comparison, each BSC category was ranked using category-specific calculations determined by the company that provided the data. The category’s rankings and definitions used by the company are shown in Table 2. While the criteria varied for each category of the BSC, each was converted into the same scale with a rank of ten being platinum to a rank of zero being red based on the performance of that category against its respective performance criteria (see Table 2). Once each category was given its specific rank, the three categories were then consolidated and an average was calculated. The measurement used for the analysis in this study was a consolidated BSC average. A consolidated BSC measurement was chosen because it represents a hotel’s average overall hotel performance and includes both financial and nonfinancial measures.
BSC Rankings and Definitions
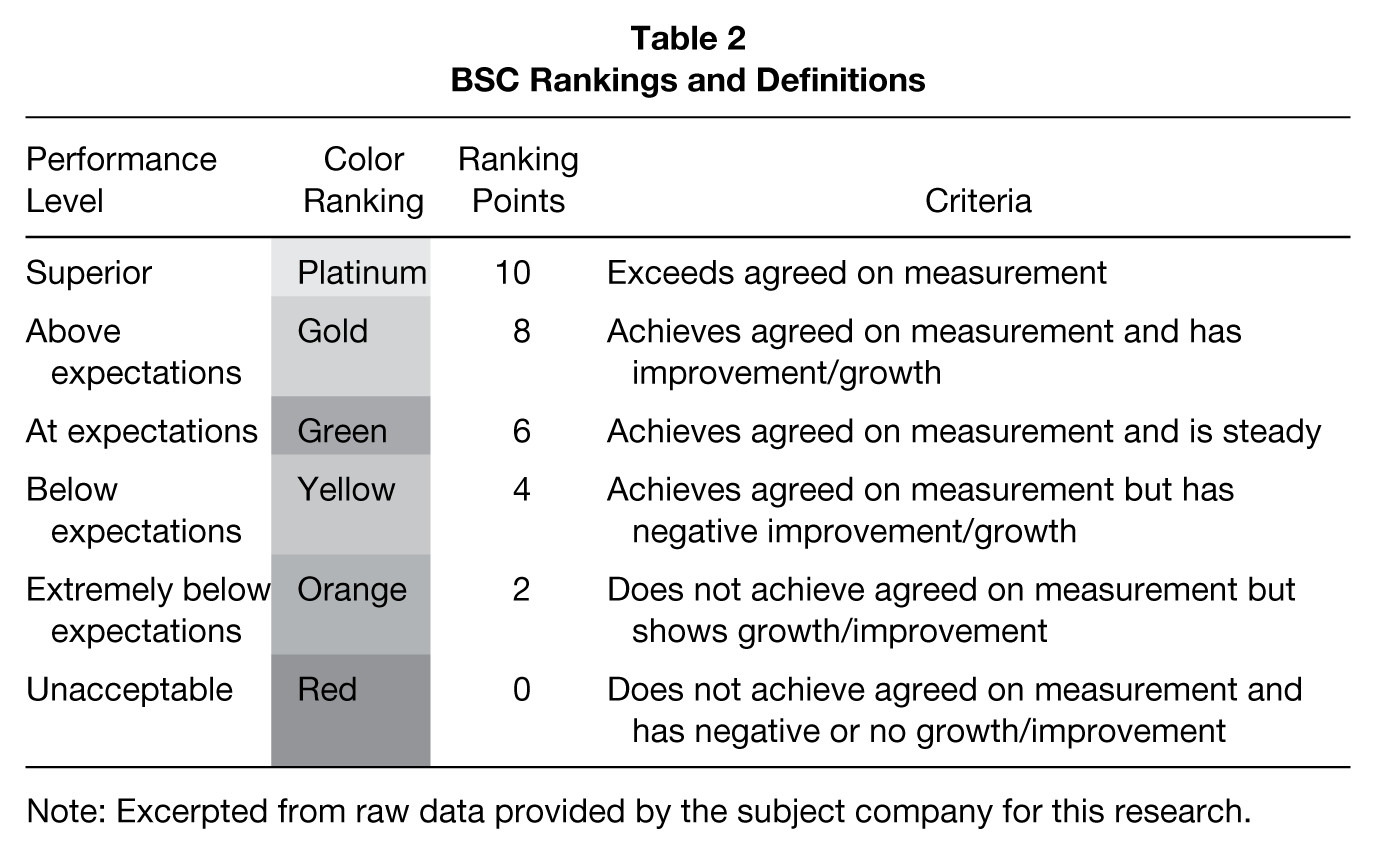
Note: Excerpted from raw data provided by the subject company for this research.
Data Analysis
DEA considers the group of DMUs under investigation to examine what inputs are being used to produce outputs for each of those DMUs and identifies the most and the least efficient (Sherman & Zhu, 2013). Using the DEA-BSC model, an output-oriented constant returns to scale (CRS) orientation was chosen because it measures relative efficiency and provides data in the form of slacks that allows nonefficient DMU’s to benchmark efficient ones. Using an output model allows outputs to reach the efficiency frontier at different proportions. Calculations of the data using the DEA-BSC model were produced using DEAFrontier software. This software package is an Excel add-on and can provide analysis for multiple DEA models.
Results/Action
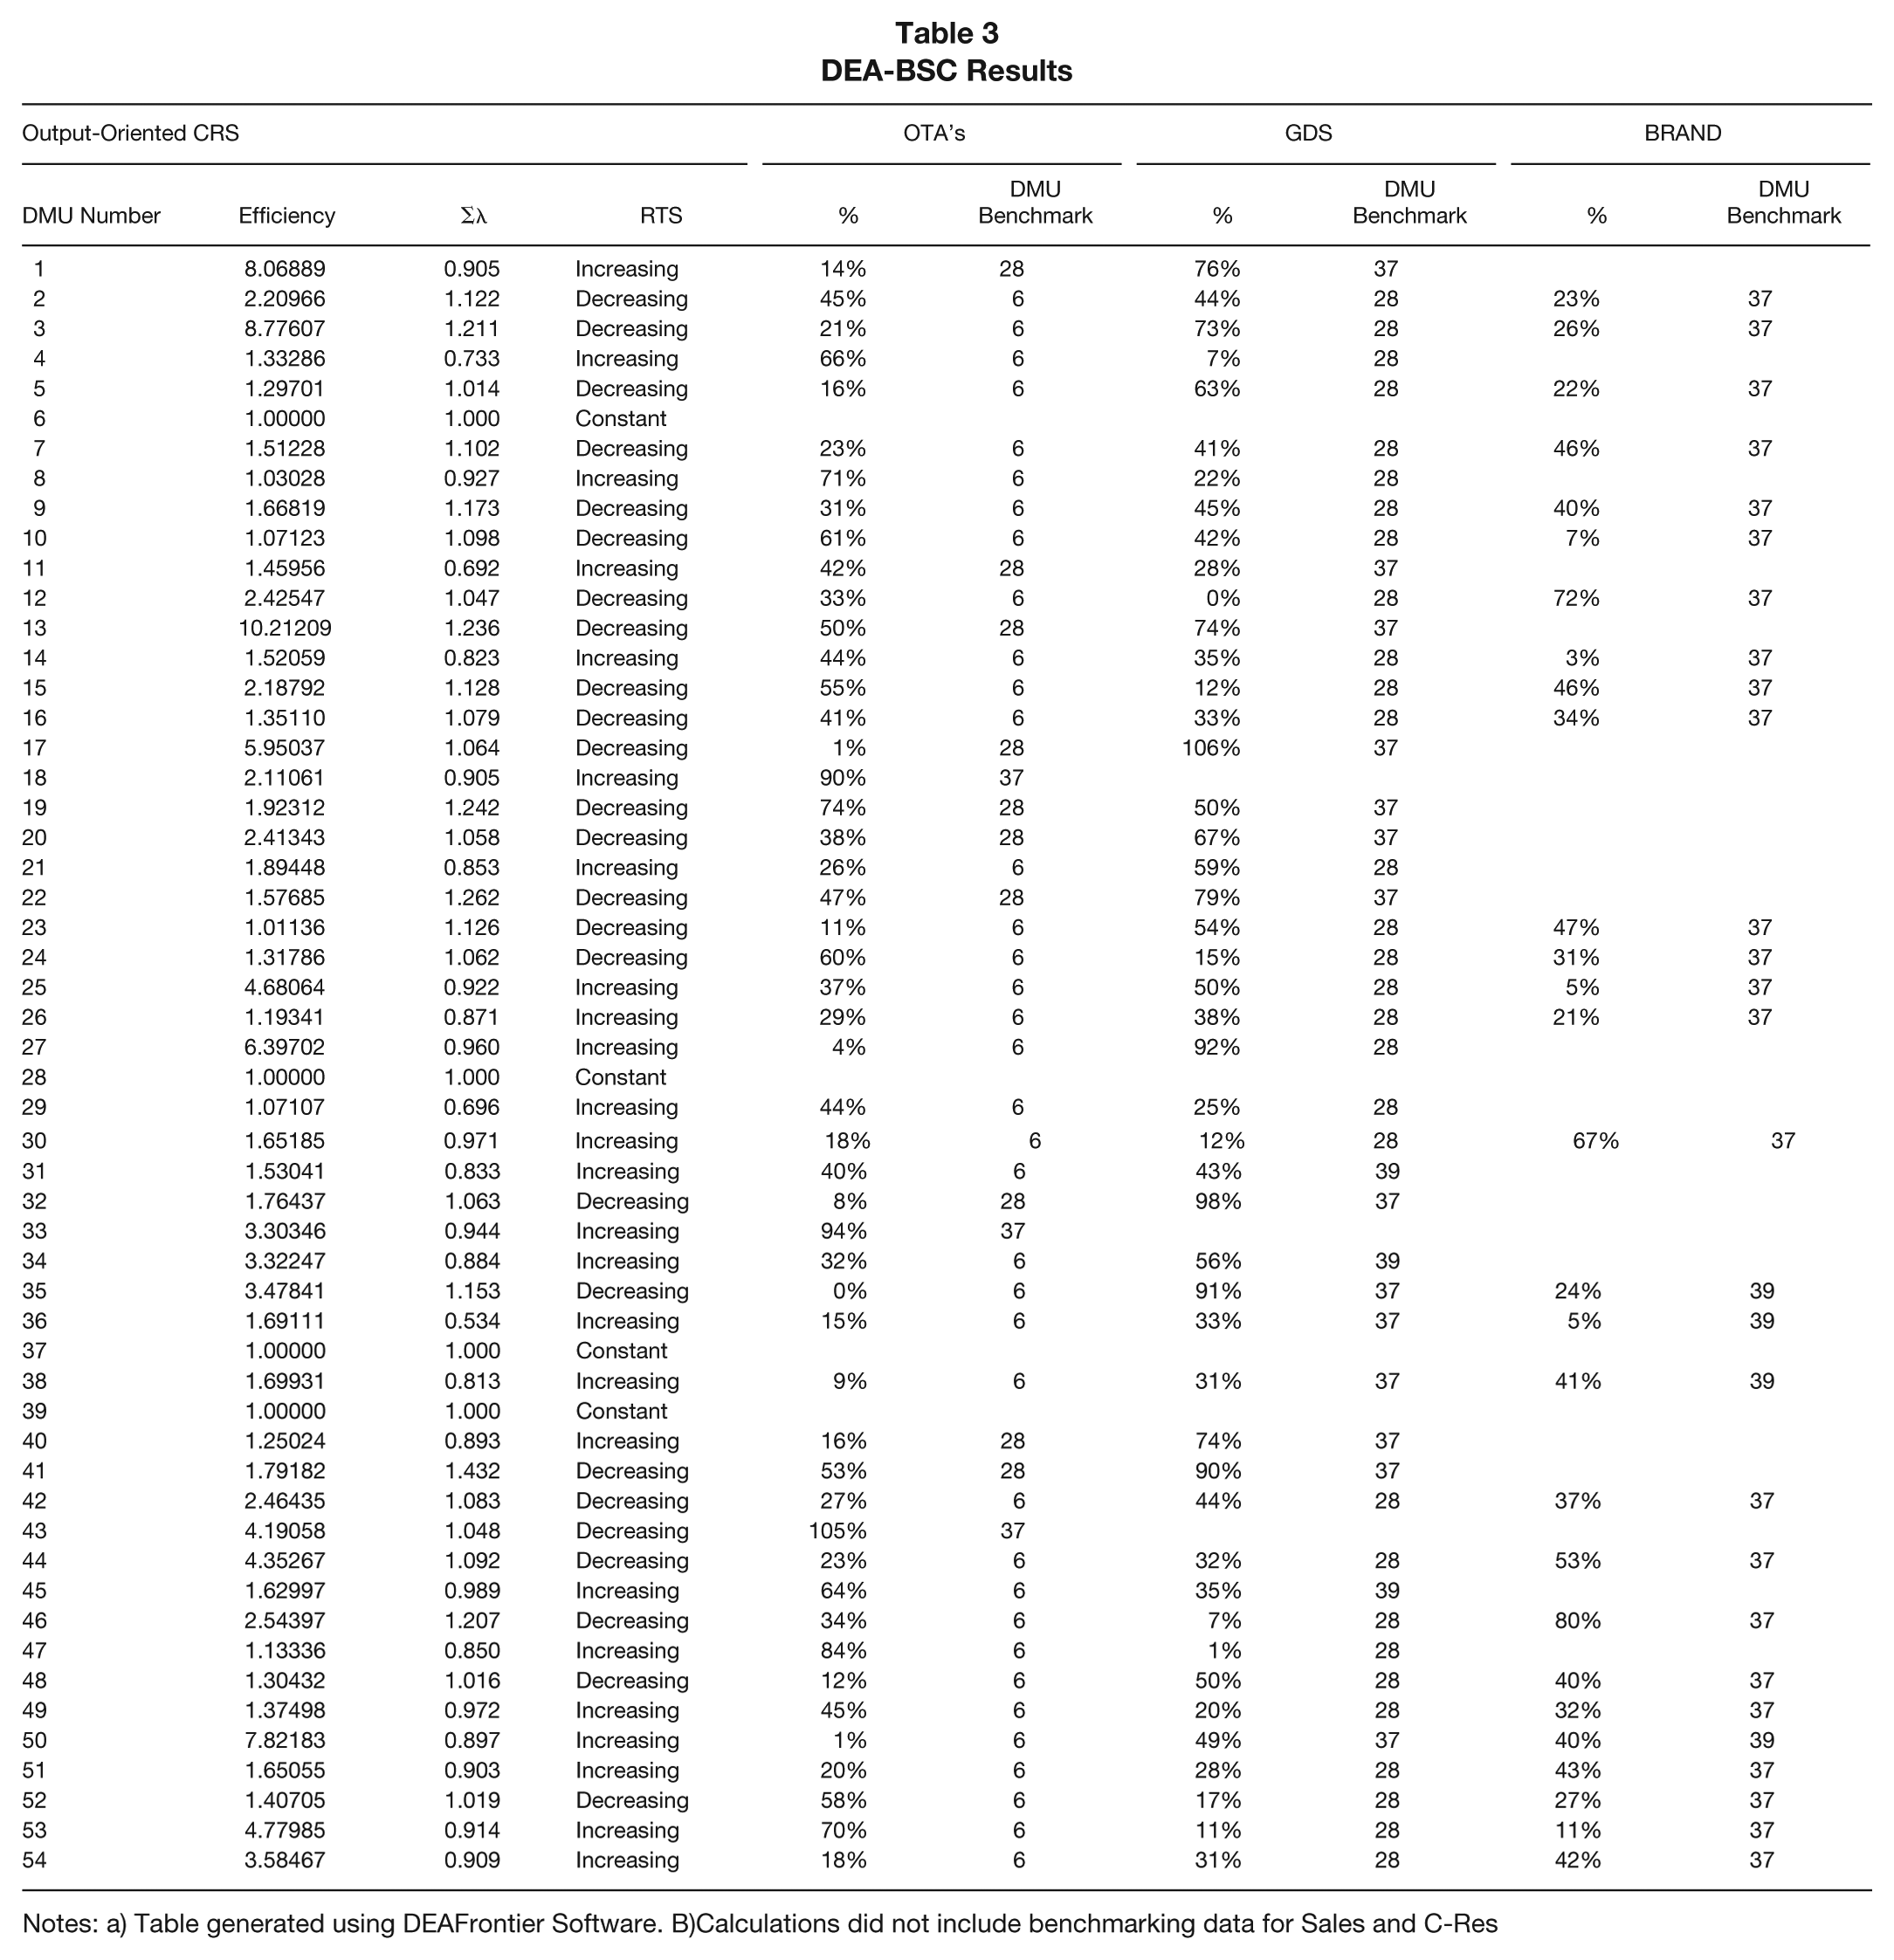
The DEA-BSC analysis provided several results. Beginning from the left in Table 3, the first two columns list the hotel (DMU) number and hotel (DMU) name for the study. The third column, labeled output-oriented CRS efficiency column, identifies the efficiency of each hotel (DMU). A score of 1 identifies an efficient hotel (DMU) any score above or below 1 being inefficient. The fourth column identifies the sum lambda (Σλ) which displays reference weights indicating the proportion of each efficient hotels’ (DMUs’) criteria values, summed together, to determine the point of efficiency for the inefficient DMUs being evaluated (Weber, 1996). It indicates the distance an inefficient hotel is from efficiency. The closer the number is to 1, the closer the hotel is to becoming efficient. The fifth column (labeled RTS) indicates returns to scale. Because an output model was used, returns to scale for all nonefficient DMUs can be increasing or decreasing. Returns to scale is determined based on the efficiency of the model inputs to the model outputs and provides the direction needed to achieve efficiency.
DEA-BSC Results
Notes: a) Table generated using DEAFrontier Software. B)Calculations did not include benchmarking data for Sales and C-Res
The remaining columns are benchmark columns. Each column represents the channel needed to improve. Under each channel is the benchmark hotel for the nonefficient hotel (DMU) to emulate and the percentage of that hotel’s channel that the hotel (DMU) under investigation needs to achieve to become efficient. In identifying optimum channel mix as defined by BSC, the findings of this study identified four hotels as efficient and 50 hotels that need improvement to achieve efficiency (as shown in Table 3). Therefore, the use of a DEA-BSC model answers the first part of the research question positively that hotels (DMUs) with the most efficient mix of channels as measured by a consolidated BSC average can be identified.
The second part of the research question can also be positively answered. The sum lambda output of the DEA-BSC model (Σλ; see Table 3) provided information on the distance an inefficient hotel (DMU) is from the efficiency score of unity or 1. The output of the DEA-BSC model also provided each inefficient hotel (DMU) with benchmark channel percentages from specific benchmark hotels to assist the inefficient hotel (DMU) in focusing efforts to become an efficient one.
Discussion
Current trends in the hospitality industry have significantly affected hotel revenue management practices. The “distribution evolution in the Internet era has consistently been highlighted as one of the most important issues across industries” (Law et al., 2015, p. 434). This distribution evolution along with changing customer behaviors and expectations have created a need for a better understanding of revenue and distribution channel mix. Maximizing revenue and minimizing costs while delivering against evolving customer expectations is the new challenge of revenue management. Rate preferences and the costs associated with some of the more popular channels have made the balance between revenue expectations and optimal channel mix more difficult (Law et al., 2015). Beyond traditional measures, hotels need new ways to measure performance. Optimizing channel mix is a key part in measuring performance.
DEA-BSC is a balanced benchmarking process that provides a new way to measure performance by providing companies with a benchmarking tool that identifies the individual performance of a given hotel and then provides a comparison of performance with others in the data set. DEA-BSC identifies individual performance but also provides a reference set of benchmarks for improvement based on the relationship between individual hotels (DMUs) and their referent efficient hotels (DMUs).
This study represents a new model to measure operational and revenue production efficiency of channel mix in the hotel industry. A DEA-BSC model was chosen for this study because unlike the traditional business models that typically focus on one performance measurement such as profit, the DEA-BSC model considered multiple metrics simultaneously (Zhu, 2014b). Using a DEA-BSC model to measure channel mix as defined by BSC results, this study was able to provide a list of four hotels with optimal channel mix as defined by BSC results. It further provided the 50 inefficient hotels with benchmark data to assist in moving that hotel to efficiency. It is important to note that the benchmarks are directional recommendations for improving channel mix, not static absolutes.
The purpose of this study was to explore the usefulness of the DEA-BSC model in identifying benchmark (efficient) hotels and inefficient hotels based on channel mix. While DEA-BSC has been used sporadically to measure hotel results in the hotel industry, no study has explored the relationship between the mix of the five major hotel revenue channels and their impact on the financial and nonfinancial results of a hotel as measured by a BSC. The ability to understand the difference between the traditional way of measuring business and the requirements of the current hotel marketplace can be profound. It is no longer just about price or profit, but includes a much broader scope of generating profitable revenue at the right time at the right price in the right channel, with a focus on customer satisfaction.
Limitations
As might be expected with this type of pioneering study, the awareness of limitations provides suggestions for other research projects, and this study offers no exception. The first limitation is that the data used for this study came from a single, multiunit company and was limited to the U.S. geographic areas in which the company operates. Therefore, some markets in the United States and all international markets were not included in the study. It is also unclear how corporate strategy might influence the results.
A second limitation is the type of hotel used for the study and the hotels all managed by the same company. The data for this study came from select service hotels. Other categories of hotels, as defined by STR (2016), were not included. Another limitation is that this research was the first of its kind in the exploration of channel mix and its impact on BSC performance using a DEA-BSC approach. Consequently, there are no studies that provide a benchmark for comparison purposes. Decisions including model orientation, whether to use CRS or variable returns to scale model, determining channel measurement criteria, and specific BSC measurements were all selected or based on related prior research. Using the same model but with different measurements or different variations of the DEA model could further improve the model and subsequent findings.
Finally, while the model is able to provide specific direction on what a hotel (DMU) needs to change to become efficient, this model is not able to determine what actions need to occur at the property level to successfully execute those changes. As might be expected, the awareness of limitations provides suggestions for other research projects.
Future Research
Revenue distribution channel mix to maximize revenue needs more investigation. While some scholars have conducted research on the importance of channels, more research is needed regarding channel mix and its impact on financial and nonfinancial performance results. Another area where more research is needed is on how to effectively measure the performance of channels (Noone et al., 2013).
Although many of the limitations of this study lead to the suggestion of future research in some areas, this study can be expanded in other ways. More investigation is needed regarding the inputs and outputs. For the output measurement, this study suggested a consolidated BSC average. Future studies may want to include multiple outputs by using each category of the BSC separately rather than using a consolidated average.
Research on segmentation based on customer channel selection is another area of exploration. Understanding segmentation by channel selection using pricing, booking horizon, type of hotel selected, customer demographics, and location are all valuable in understanding how to market to and ultimately drive customers to channels that yield the most successful hotel BSC performance. This study looked at revenue management through distribution channels for hotel rooms. Future revenue management research should include additional revenue segments such as group bookings and food and beverage-related revenue streams within the hotel. Meetings, events, restaurant bookings, and group bookings constitute an ever-expanding share of hotel revenue.
The time frame under investigation in this study was 1 year: 2016. Future studies should consider using multiple years to provide for a longer time frame, which could allow for changes that may occur in the markets and hotels.
Future research could apply the model to hotels in a more global environment to examine the effectiveness of the DEA-BSC model in predicting efficiency and inefficiency regarding both domestic and international hotels from a variety of companies. The same changes in technology that have fueled the evolution of hotel room revenue channels is now having a similar effect in these other revenue generating arenas. Research related to channel mix that includes hybrid channels (Thakran & Verma, 2013), metasearch engines (Xiang et al., 2014), and social media (Aluri, Slevitch, & Larzelere, 2015) will be needed in the near future.
Early leaders in this current era include Google, Facebook, and Apple. Web 2.0 has further transformed travel with tools such as fare aggregators, metasearch engines, and new virtual communities (Xiang et al., 2014). All of these metasearch engines are gaining traction in market acceptance, resulting in high levels of consumer adoption (Green & Lomanno, 2012). These channels will need to be considered in future research.
Social media engagement is driving consumer purchasing power and is becoming another vehicle for researching and purchasing hotel rooms. Some research has suggested that there has been an increasing number of customers who bypass the normal revenue channels and that they are more in favor of using social media sites (Jeong, Oh, & Greguire, 2003). Future researchers using channel data as an input may want to consider including social media sites as part of the research model.
Implications and Conclusion
From an academic perspective, while there has been research on various areas of revenue management, very few authors have conducted research on channel mix. The changing nature of the channels used for hotel bookings have made this topic challenging. The lack of data available to researchers due to their proprietary nature has also made research in this field difficult to undertake. The natural lead time between concluding research and seeing its timely distribution in publications, whether print or digital, also contributes to the lack of research on channel management and channel development.
When discussing research in performance management it is important to note that the field of research is broad with many differing views and has been an important topic of research for many years (Turuduoglu et al., 2014). Early research was focused on financial ratios (Neves & Lourenco, 2009). Research that is more recent contends that looking at both financial and nonfinancial performance measures are important (Gesage et al., 2015).
From a hotel industry practitioner perspective, the findings from this study can assist in several ways. The findings provide hotel industry practitioners with a better understanding of the relationship between channel mix and financial and nonfinancial performance results. Findings from this study can be used to provide hospitality professionals with evidence and information that might assist them in making more informed decisions regarding the efficient use of the various revenue distribution channels. Investigating channel mix and the impact on customer, revenue, and profitability through a consolidated BSC average can assist practitioners in making decisions that yield greater overall performance and success.