
Abstract
Hosting mega-events is often perceived as a way to stimulate economic growth through tourism. However, the cost of infrastructure investments and promotion may outweigh the benefits generated by the mega-events. Measuring the impact of such events on a hosting country’s economy is not easy, especially as mega-events generally involve many sectors of a destination’s economy. In this study, we adopt a panel data approach to evaluate the impact of the London Olympic Games, Brazil World Cup, and Rio Olympic Games on the economic growth of the respective destinations. Using cross-sectional correlations between countries, we construct scenarios in which the hosting countries did not hold the mega-events and then estimate the time-varying impact of the events on the economy. The developed and developing countries exhibit different results.
Tourism can make huge direct and indirect contributions to a destination’s GDP. According to the World Tourism Organization (UNWTO, 2017), tourism accounts for 10% of the world’s GDP, 1 in every 10 jobs, 7% of the world’s exports, and 30% of the world trade in services. As hosting mega-events can create synergies with tourism (Barney, Wenn, & Martyn, 2002; Horne & Manzenreiter, 2004), many governments have devoted considerable resources to attracting and supporting hallmark events such as world-class sports games as part of a wider strategy to increase tourism income. Leiper (1990) argues that hosting mega-events not only increases the demand for tourism at a destination but also promotes the image of the destination; Getz and Page (2016) reinforce this claim by demonstrating that mega-events can lead to many business opportunities in the accommodation, transportation, and related sectors.
Since the seminal work of Getz (1989), event tourism has attracted considerable attention from researchers. The research paradigms have ranged from studying residents’ perceptions or experiences of events (Ferdinand & Williams, 2013; Soutar & McLeod, 1993) to the social and cultural impacts of the events (Hall, 1989) at the destination level (Crompton & McKay, 1994; Crompton, 1999). Getz and Page (2016) provide a comprehensive chronological and thematic overview of the event tourism literature and call for a full cost–benefit evaluation that considers the opportunity costs and key externalities. They emphasize that mega-events tend to have long-term and synergistic effects on destinations and that future research should evaluate their impacts within a portfolio.
Nevertheless, the methods for assessing economic outcomes are subject to measurement problems. For example, Dwyer, Forsyth, and Spurr (2005, 2006) comment that input–output (IO) analysis can evaluate positive impacts but ignore negative impacts, leading to a serious upward bias. Mills and Rosentraub (2013) suggest that the degree of integration between the host and neighboring areas can lead to mismeasurement. A high degree of integration may create a displacement effect because the expenditure on goods and services by tourists and organizers can be imported from neighboring areas, and visitors may choose lodging outside the hosting city/region to avoid the high prices charged during the event. Including these items necessarily overstates the economic contributions to the local economy. For example, Sun, Rodriguez, Wu, and Chuang (2013) find that the high room rates charged by the hotels in Kaohsiung, the host of the 2009 World Games, led to a substantial drop in hotel occupancy; the hotels turned down business opportunities from other potential and regular hotel guests in favor of event-related tourism. Such a displacement effect also occurs at the country level, although it is unfortunately seldom measured.
Mills and Rosentraub (2013) also suggest that the difficulty in identifying alternative uses of the public funding for the event and the complexity of attributing a portion of investment to a mega-event leads to another kind of mismeasurement. For example, a government might implement an airport improvement project even if it does not host a mega-event. These hidden opportunity costs can be so enormous that they are enough to dissipate most of the revenues accrued from the event. Most important, policy makers may opt to host an event without fully accounting for the cost and thus miss the chance to capitalize on other investment options.
In this study, we apply a panel data approach with a factor structure to estimate the impact of an event. Using correlations across countries, the approach mitigates the mismeasurement problem by taking the opportunity cost, displacement effect, or alternative best use of public funding into account. The estimation method is straightforward because the factor model is transformed into a multiple linear regression model under certain assumptions. The predictions derived from the model can help to trace out what the economic situation would have been if the winning city had never hosted the event. This approach is applied to estimate the economic impact of three mega-sport events: the 2012 London Olympic Games, the 2014 Brazil World Cup, and the 2016 Rio Olympic Games. As London is a well-developed city, whereas most cities in Brazil are relatively underdeveloped, their required investment in sport facilities necessarily differs. As a result, the impacts of the events are substantially different for the United Kingdom and Brazil. The two countries are compared to verify the geographical differences argument of Mills and Rosentraub (2013).
Literature Review
Andersson, Armbrecht, and Lundberg (2008) and Fourie and Santana-Gallego (2011) suggest there are three main ways to measure the impact of a mega-event on a country or a region: IO analysis, the computable general equilibrium (CGE) model, and the econometric approach. Leontief (1936) proposes a simple IO model to analyze transactions in three major sectors: primary input, intermediate (processing), and final demand sectors. Della Bitta, Loudon, Booth, and Weeks (1977), Crompton (1999), and Lee and Taylor (2005), among others, apply the IO approach to survey data. For example, Lee and Taylor (2005) meticulously separate foreign tourists who are directly or indirectly related to the 2002 World Cup from other tourists using two sets of questionnaires in a survey conducted at the arrival and departure gates of the major international airports in South Korea. They then estimate the two groups’ expenditures on various products/services such as retail shops, restaurants, hotels, and cultural and recreational facilities under the IO framework. However, this approach assumes that the inputs for the mega-event are cost-free and that the neighboring regions or industries that produce alternative goods and services are not affected. This means it ignores negative effects such as displacement effects, and thus the estimated benefit is likely to be overestimated.
To tackle this problem, Dwyer et al. (2005) propose a CGE model. As the name suggests, the CGE model considers the impact on the economy as a whole by considering both the positive impact on the local area and the potential negative impact on other states within the nation. Therefore, the CGE model more reliably captures displacement effects and inter- or multistate effects. To demonstrate the merits of the CGE model over the IO approach, Dwyer et al. (2005) study the Qantas Australian Grand Prix and Benalla Motorcross. They find that the CGE approach tends to estimate much smaller impacts on real output, gross product, and employment than the IO approach. Given the importance of the actual costs involved, many scholars, including Burgan and Mules (2001), Mules and Dwyer (2006), and Whitson and Horne (2006), have called for a more comprehensive cost–benefit analysis of mega-events. However, due to the difficulty involved in obtaining measurements of scale and intangible benefits/costs, this approach has seldom been used.
The econometric models for measuring the impacts of mega-events can be classified into three groups based on the objectives of the study: time profiling, gravity, and hedonic pricing models.
The time-profiling model analyzes how a mega-event affects an economy before and after the event. It uses either a proxy for the time-varying effect or a set of time dummies to capture the changing pattern. For example, Kang and Perdue (1994) use an impact curve constructed from an index of the social awareness of the Olympics to approximate the before-and-after effect of the 1988 Seoul Olympics on regional market shares of international tourist arrivals. Alternatively, Brückner and Pappa (2015) use a set of time dummies around the event to measure the time-varying impact of a mega-sport event on a country’s GDP, investments, consumption, government expenditures, CPIs, and exchange rates. However, these assessment strategies do not consider how the hosting city interacts with its neighbors and assumes that the effect is the same across countries. Therefore, they cannot capture the potential displacement effects or distinguish the impact on developed and developing countries, and their results are likely to be overestimated.
The gravity model is able to study the bilateral flows of economic activities such as international trade (Armstrong, 2007; Rose & Spiegel, 2011), which helps address the issue of regional economic characteristics raised by Mills and Rosentraub (2013). Durbarry (2000), Gil, Llorca, and Martínex-Serrano (2006, 2007), and Santana-Gallego, Ledesma-Rodríguez, and Pérez Rodríguez (2010) further extend gravity models to international tourist flows to the host country during a mega-event. Estimating the gravity model with unobserved country-specific and time effects, Fourie and Santana-Gallego (2011) find that the Olympics and other mega-sport events help promote the inbound tourism demands of both the host and bidding countries, and their impacts vary across the types of sport events and over time but remain the same for every country. In fact, the hosting countries may be at different stages of development. Developed countries that are well equipped do not need to invest as much as developing countries, and thus tend to benefit more from the events. Moreover, gravity models still cannot address the displacement effect by capturing the opportunity cost of hosting an event.
The hedonic pricing model proposed by Rosen (1974) is often used to identify major attributes of prices. Espinet, Saez, Coenders, and Fluvia (2003), Thrane (2005), Abrate, Fraquelli, and Viglia (2012), Fleischer (2012), and Hermann and Herrmann (2014) use hedonic pricing models to study the impact of mega-events on hotel prices or hotel star ratings. Although the model controls for a set of covariates, it is still difficult to attribute an increase in price solely to a mega-event. Unless the mega-event is compared with a suitable control group, the model is likely to mismeasure its impact. A control group is often used in scientific experiments to gauge the effect of a treatment. In the social sciences, the behavior of a control group can be treated as a measurement of the opportunity cost. For example, a hosting city may perform even better if instead of using public funds to construct a sports complex, it uses them to improve the livelihood and welfare of its citizens. To address the displacement effect, some researchers adopt a control-group approach using semistructured interviews. Sun et al. (2013) study the effect of the 2009 World Games on the hotel occupancy rates in Kaohsiung, the hosting city in Taiwan. They meticulously control for the unobserved differential time effect by comparing the hotel occupancies in the hosting city with those in other regions before and after the event. By assessing what happened in other regions, the study captures part of the displacement effect. However, their method does not model the economic links and does not measure the time-varying impact. Therefore, it is not possible to test whether the event has a significant impact on the economy.
Accurate estimation is essential for policy makers to decide whether they should devote a large sum of public funding to mega-events. To assess their impact, we use a panel data approach to measure opportunity costs and model the interconnections between countries simultaneously. In this study, we focus on measuring the benefits of the mega-event accrued to the hosting country in terms of GDP growth rates, as this has direct implications for policy makers. We try to answer the “what if” question by constructing a counterfactual scenario using the correlation structure across countries. To be specific, a counterfactual path is an estimated GDP growth series of the hosting country as if it had never held the mega-event. It captures either the benefits that would have been derived from an alternative use of public funding or the opportunity costs. The time-varying impact, which is the difference between the observed GDP growth rates and the counterfactual path, can then be used to derive the average impact of the mega-event over the study period.
The common factor structure in the panel data model provides a more flexible way to measure the interconnection between countries than the gravity model in two dimensions. First, while the gravity model assumes that the countries are linked via a set of particular variables, the factor model can connect countries through multiple unobserved common factors. Second, just as countries at different stages of economic development have different responses to a pandemic or to technological advances, a constant response to the shocks assumed in the gravity model is not reasonable. A common factor model can address this issue, as it explicitly models the distinct responses of each country to each factor.
In this study, the panel data approach is applied to two countries: the United Kingdom and Brazil. The United Kingdom hosted the 2012 London Olympics and Brazil hosted both the 2014 Brazil World Cup and 2016 Rio Olympics. As the two mega-sport events in Brazil were hosted within a short period and some government investments were shared between the two events, it is difficult to distinguish the effects of one from the other. Therefore, we treat them as a joint event in our analysis.
As the United Kingdom is well equipped with a world-class infrastructure, the additional public funding it needs to host mega-sport events is limited. In contrast, Brazil, which lacks transportation and railroad facilities, is still at the developing stage. Its investment is therefore much higher than that of the United Kingdom. Although mega-sport events can increase tourism and hospitality demands, the benefits generated by these events may not outweigh the opportunity cost—the potential benefit if the Brazilian government uses the funding to improve social welfare. By comparing the outcomes of the United Kingdom with those of Brazil, this study highlights the differential benefits across different stages of economic development.
Theoretical Framework
Just as we need a control experiment for every scientific experiment to derive consistent results, we also need a counterfactual analysis to measure the effect of a policy—a measure of the result if the policy had never been enacted.
Counterfactual Framework and Event Impact
Let

As we can never observe the potential outcome

Standard time series models such as the autoregressive processes and hypothesis tests can then be applied to the treatment effect ∆1,t.
Econometric Counterfactual Measurements
There are several ways to estimate the counterfactual
Alternatively, the synthetic control method (Abadie & Gardeazabal, 2003; Abadie, Diamond, & Hainmueller, 2010) derives the weights
Factor Model, Model Transformation, and Impact Measurement
We follow Hsiao et al. (2011) and assume that the real GDP growth rate is driven by a common factor structure:

where
When the vector

where
Instead of directly estimating

A best fit for

When

We expect
Monte Carlo Study
To demonstrate the robustness of the approach, we must resort to a simulation study. We can observe only

where
Table 1 compares the performance of the panel data approach with the autoregressive moving average model with order
Simulation Study for In-Sample and Out-of-Sample Performance Assessment
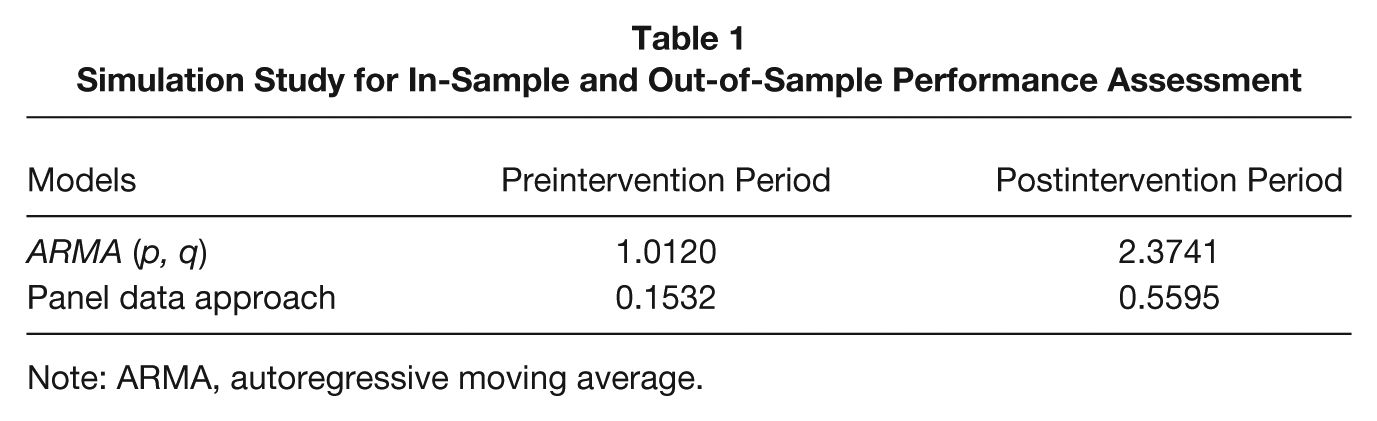
Note: ARMA, autoregressive moving average.
Measuring and Testing the Effect of the Mega-Event
Suppose ∆1,t over the period from

where

As the effect is nonlinear in the parameters, the Delta method 1 is needed to estimate its variance.
We can test the zero average treatment effect (

The mega-event has a significant impact on the real GDP growth rates if
The panel data approach makes at least four contributions to the tourism literature. First, although our study does not consider the benefits to each industry, it avoids the errors associated with surveying the inbound tourists to gauge their actual total expenditure. Second, the model accommodates two types of differential behavior across countries, namely, the country-specific characteristics represented by αi and the responses to common factors captured by

where

Model (12) is included in our empirical study to verify whether the linear conditional assumption is appropriate.
Data and Empirical Analysis
Data and Choice of Studied Period
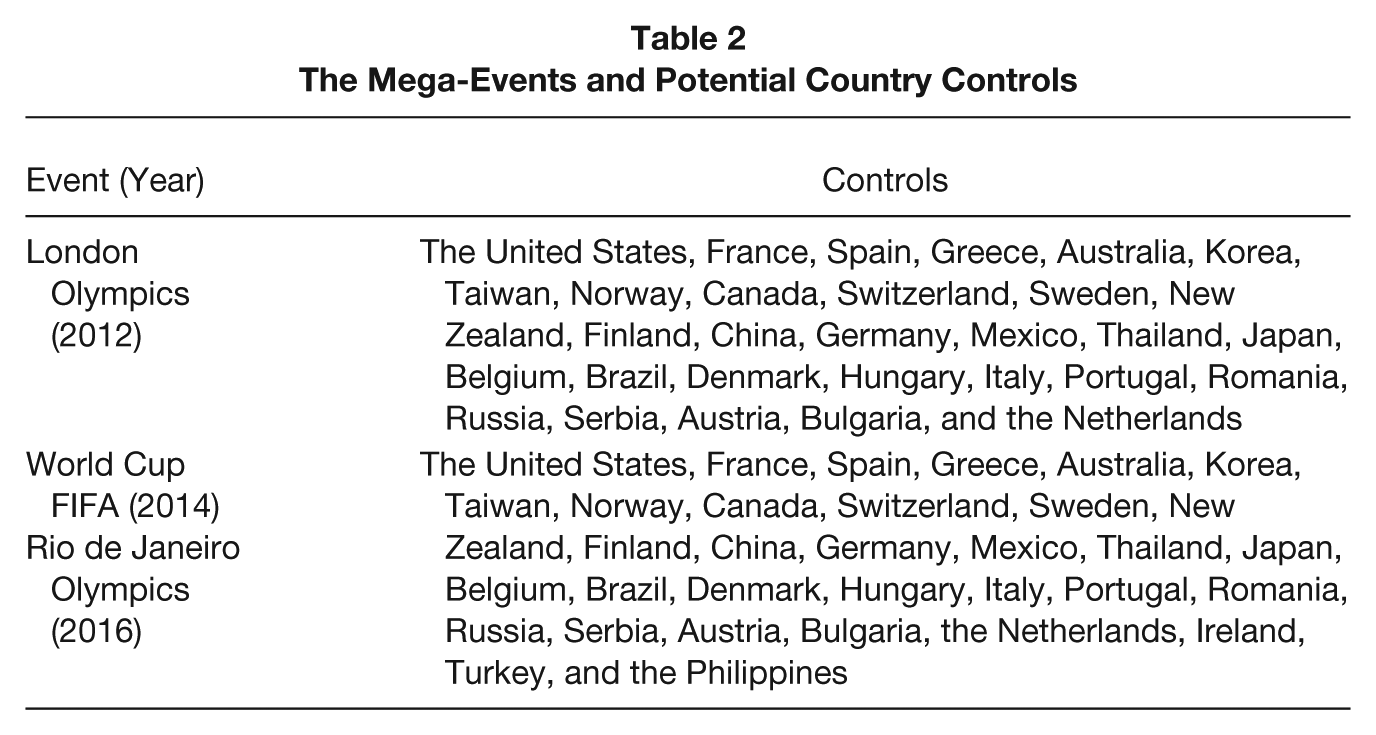
We obtain 35 seasonally adjusted real GDP growth rates at quarterly frequencies from Bloomberg. The dataset covers the two hosting countries—the United Kingdom and Brazil—and the set of control countries listed in Table 2. Hosting countries often start to build the necessary infrastructure and promote events immediately after winning the bid; thus, the impact of the mega-sport event is manifested a few years before the start of the Games (Brückner & Pappa, 2015; Fourie & Santana-Gallego, 2011). Therefore, we set the quarter in which the announcement of the winning city is made as
The Mega-Events and Potential Country Controls
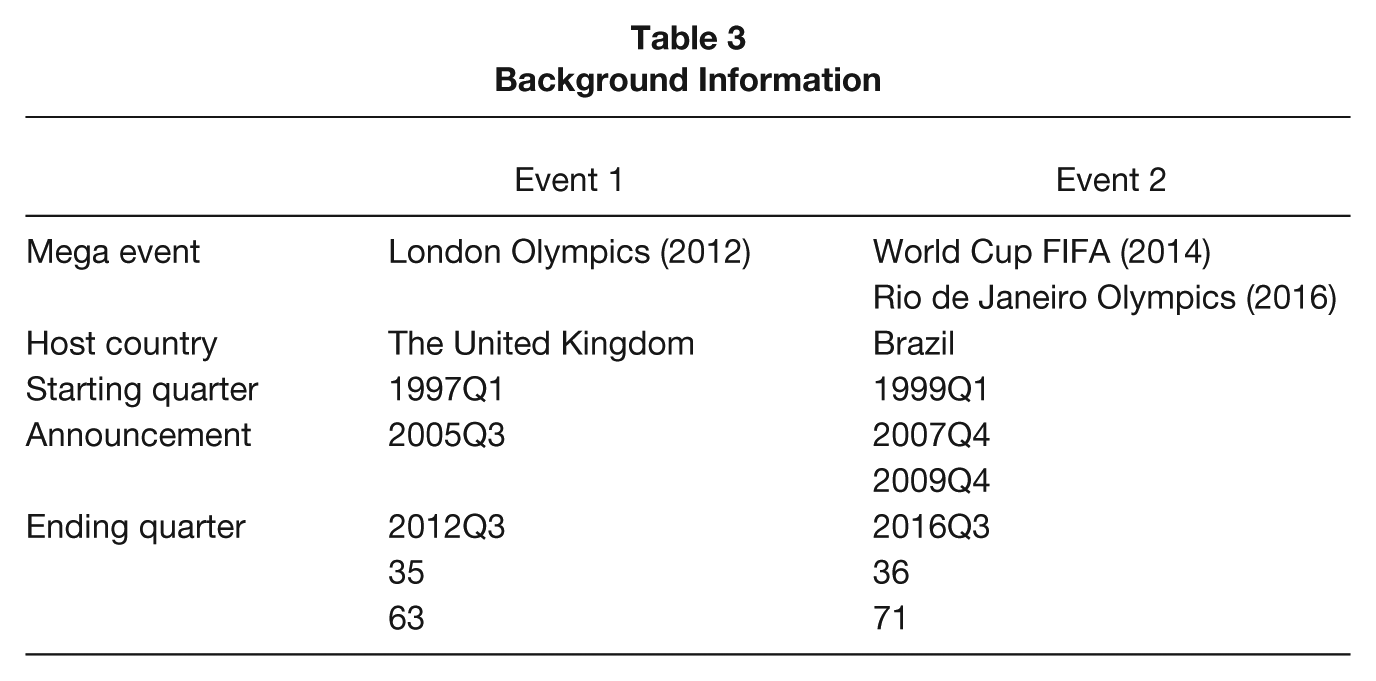
Background Information
Event 1: 2012 London Olympics
London hosted the Olympic Games in 2012. We apply the counterfactual analysis to the real GDP growth rates of the United Kingdom for the period from 1997Q1 to 2012Q3 (
Regression Results for the United Kingdom Before the Announcement
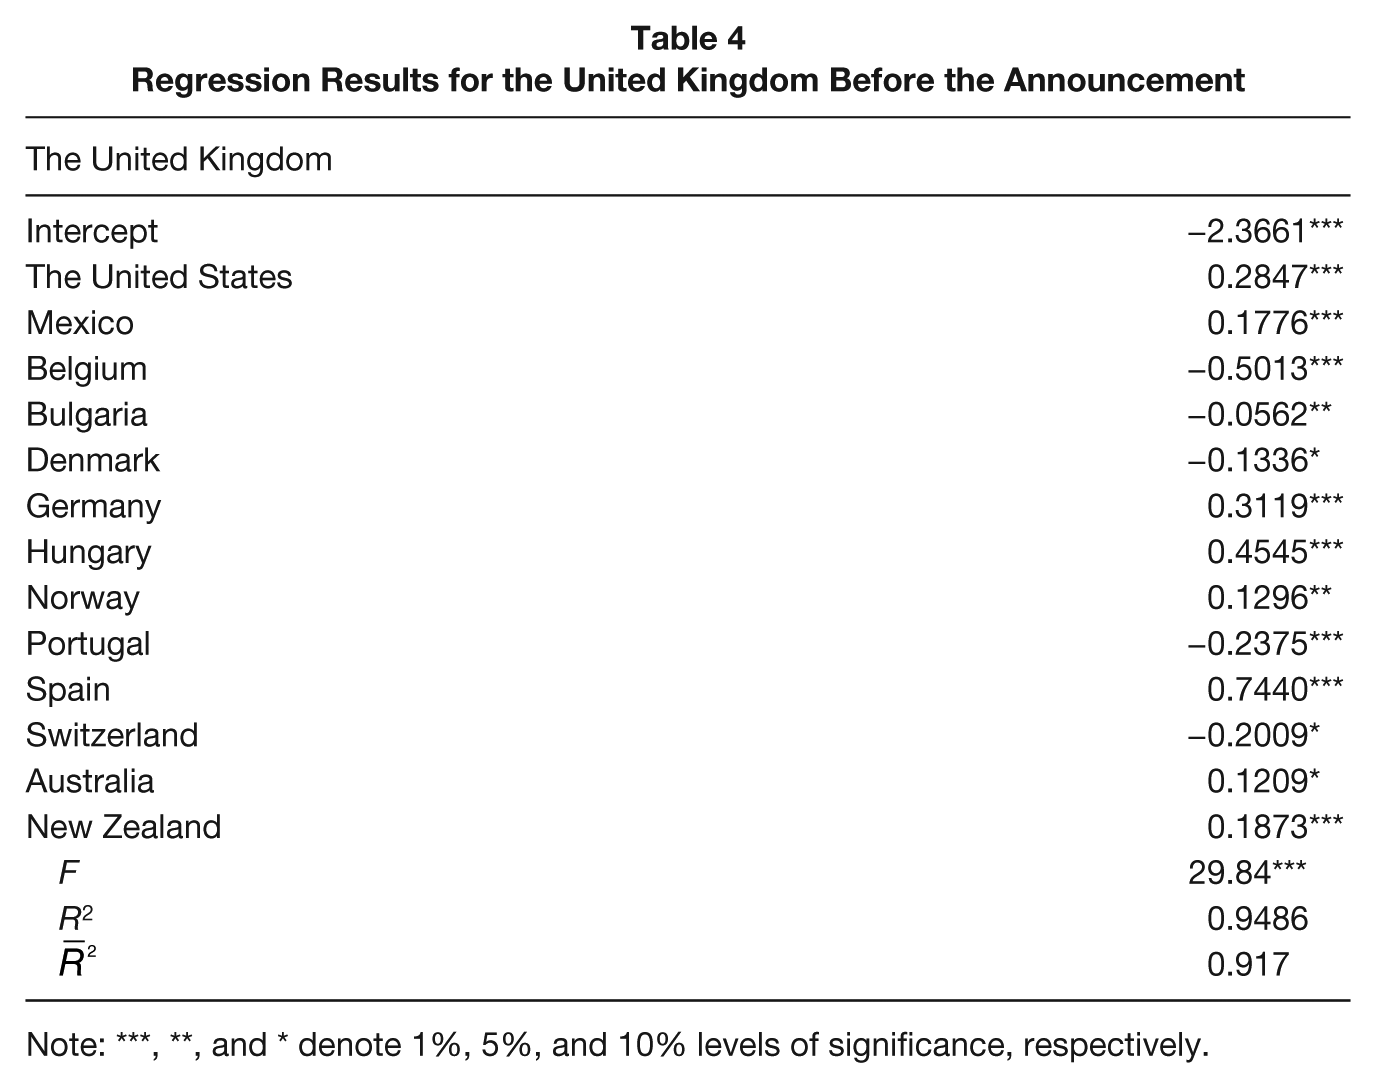
Note: ***, **, and * denote 1%, 5%, and 10% levels of significance, respectively.
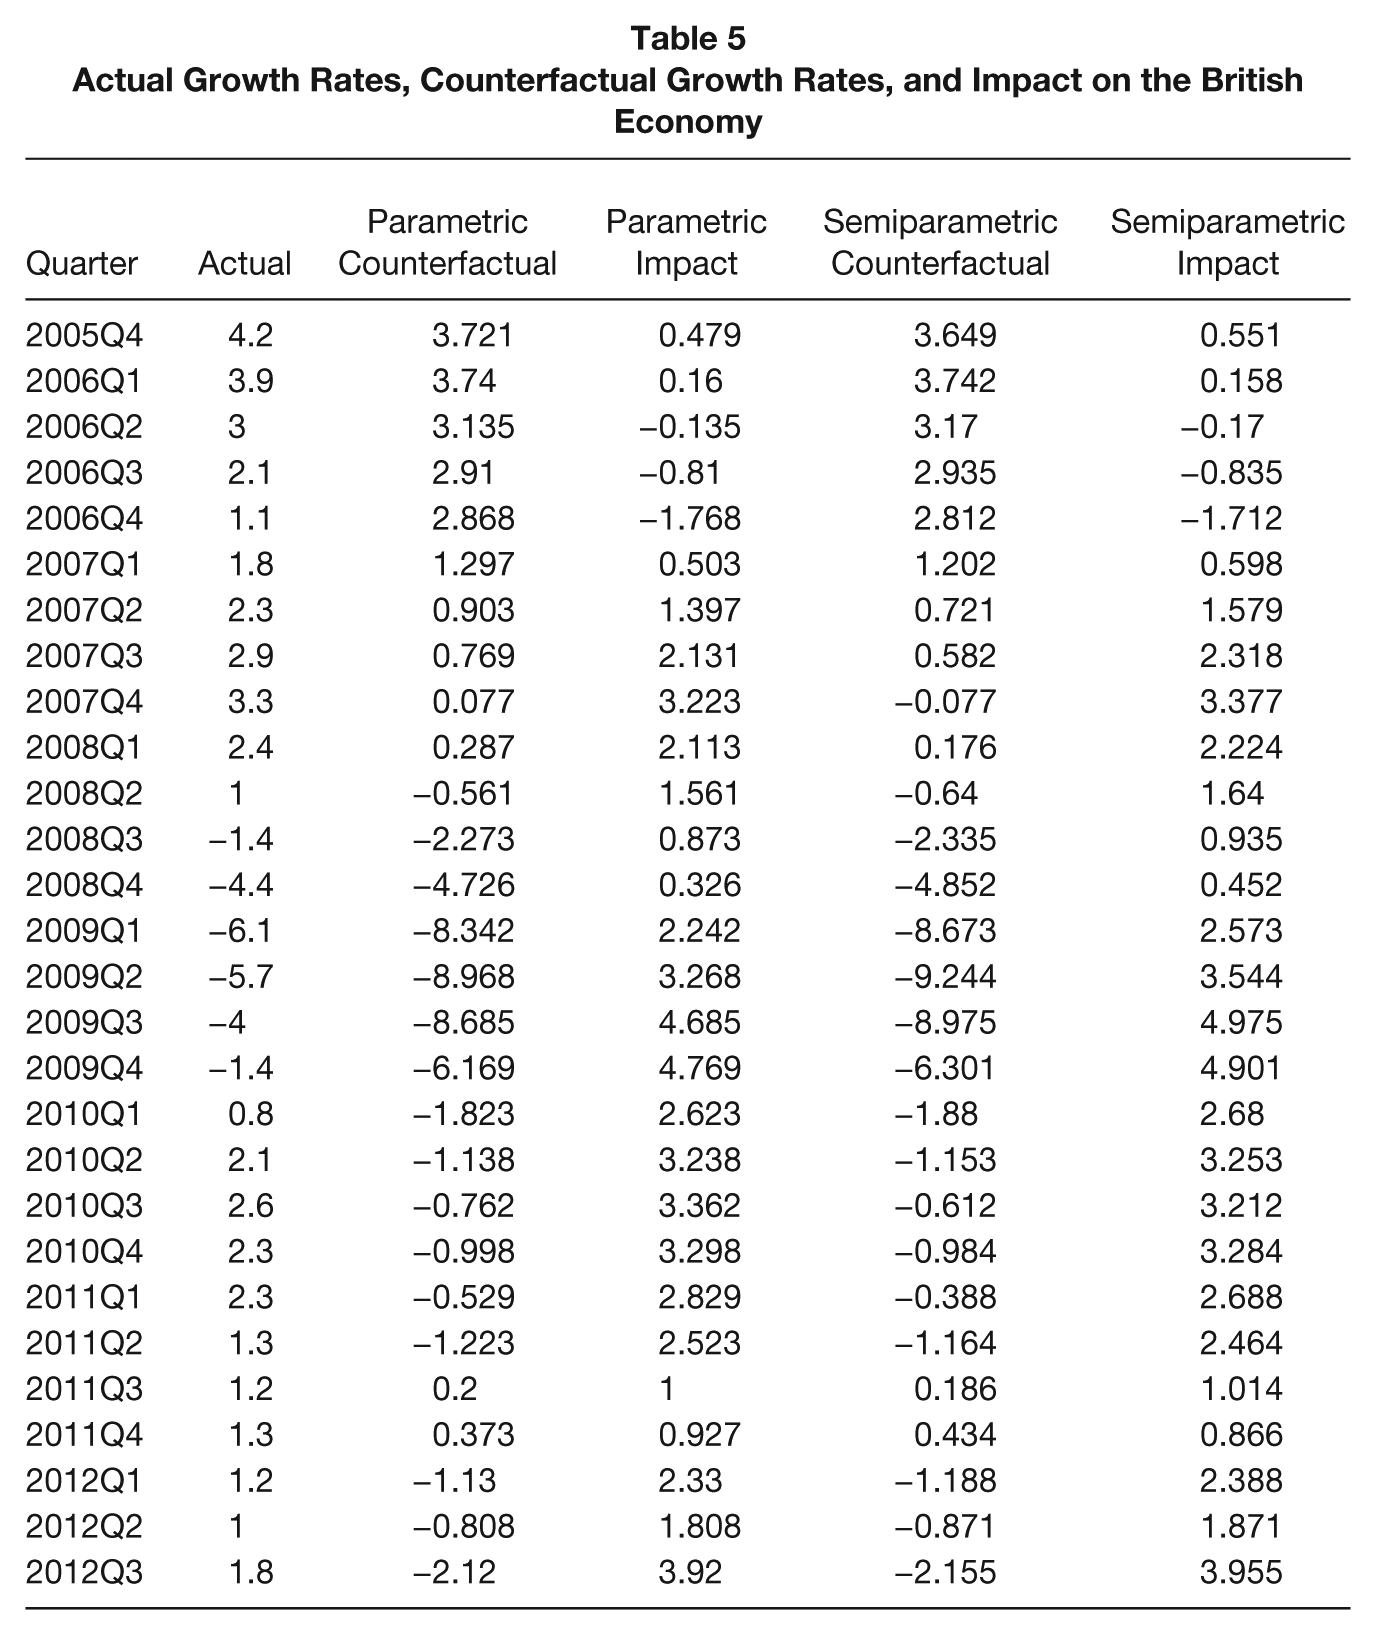
Table 5 shows the actual real GDP, the counterfactual and time-varying impact predicted by Model (7), and the semiparametric model. Figure 1 plots the actual real GDP growth rates of the United Kingdom in blue and the estimated counterfactuals (solid red line for the linear model and dashed red line for the semiparametric model) for the full sample period. The black vertical line denotes the announcement time
Actual Growth Rates, Counterfactual Growth Rates, and Impact on the British Economy
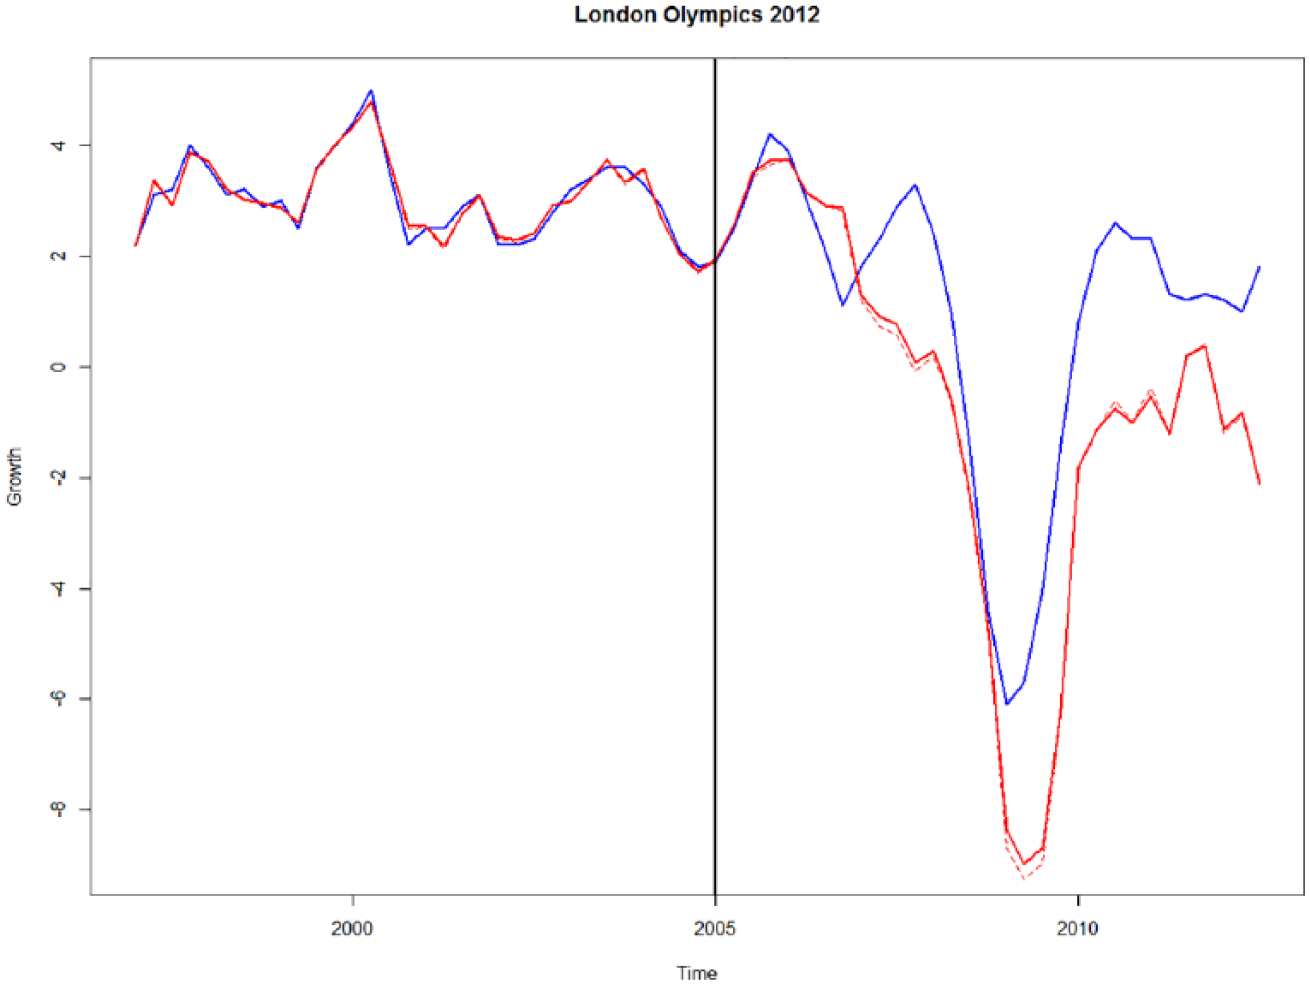
Real GDP Growth Rates of London from 1997Q1 to 2012Q3
The counterfactual
Figure 2 plots the autocorrelation of

The average treatment effect is equal to
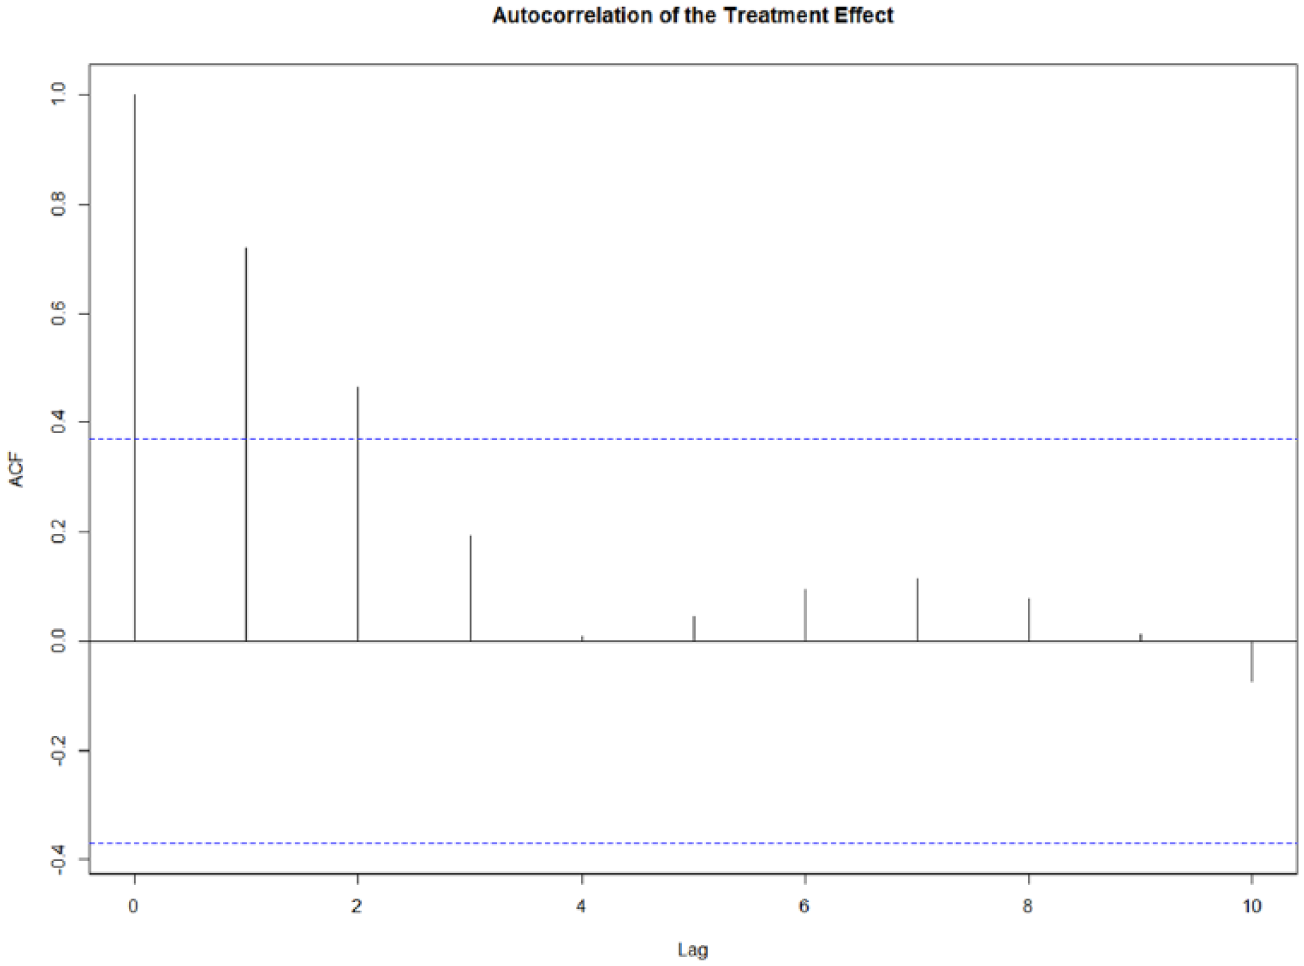
Autocorrelation of the Treatment Effect
In fact, the official measurements and comments are generally in line with our findings. For example, the U.K. Trade and Investment department (UKTI) reports that the Olympics resulted in £2.5 billion in additional inward investment, £5.9 billion in additional sales following Olympics-related promotions by the Foreign Office and UKTI, and £1.5 billion in high value overseas contracts. 2 Moreover, tourist spending for the 2012 London Olympics may have helped lift the British economy out of a recession. The official data show that the 590,000 people who visited for the Olympics or attended a ticketed event spent an average of £1,290 during their visits, compared with an average of £650 spent by other visitors. 3
Brazil World Cup 2014 and Olympic Games 2016
Brazil aggressively bids for mega-sport events, and it successfully won and hosted the World Cup in 2014 and Rio Olympics in 2016. As the two events occurred very close in time, it is difficult to disentangle their effects and impossible to attribute a certain portion of the infrastructure investment to a particular event. Therefore, we pool them together and assess their overall impact on the Brazilian economy. Table 3 provides the timeline. The announcement for the first mega-event, the 2014 World Cup, is chosen as the intervention point. Their joint impact is evaluated until the end of the second mega-event, the Rio Olympics. Our data set consists of
Table 6 shows the regression results. The controls include not only the North American, South American, and European countries, but also three Asian countries—Japan, Russia, and Thailand—reflecting Brazil’s strong economic links with Asia. The model is again significant at 1% (
Regression Results for Brazil Before the Announcement
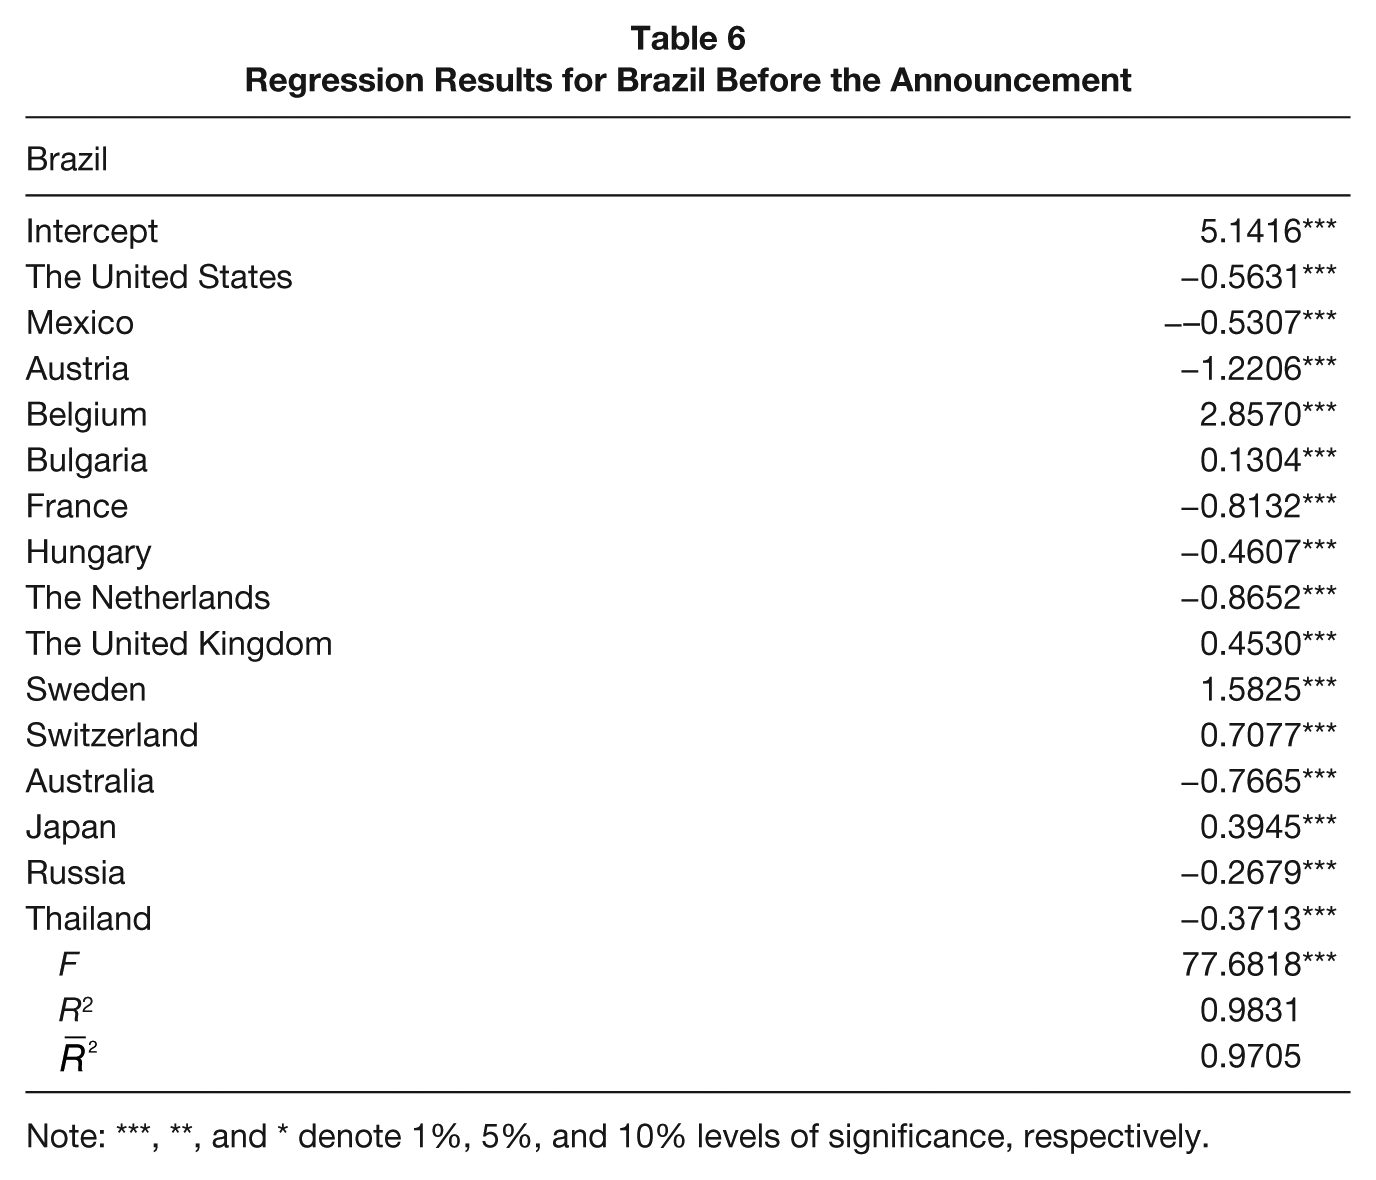
Note: ***, **, and * denote 1%, 5%, and 10% levels of significance, respectively.
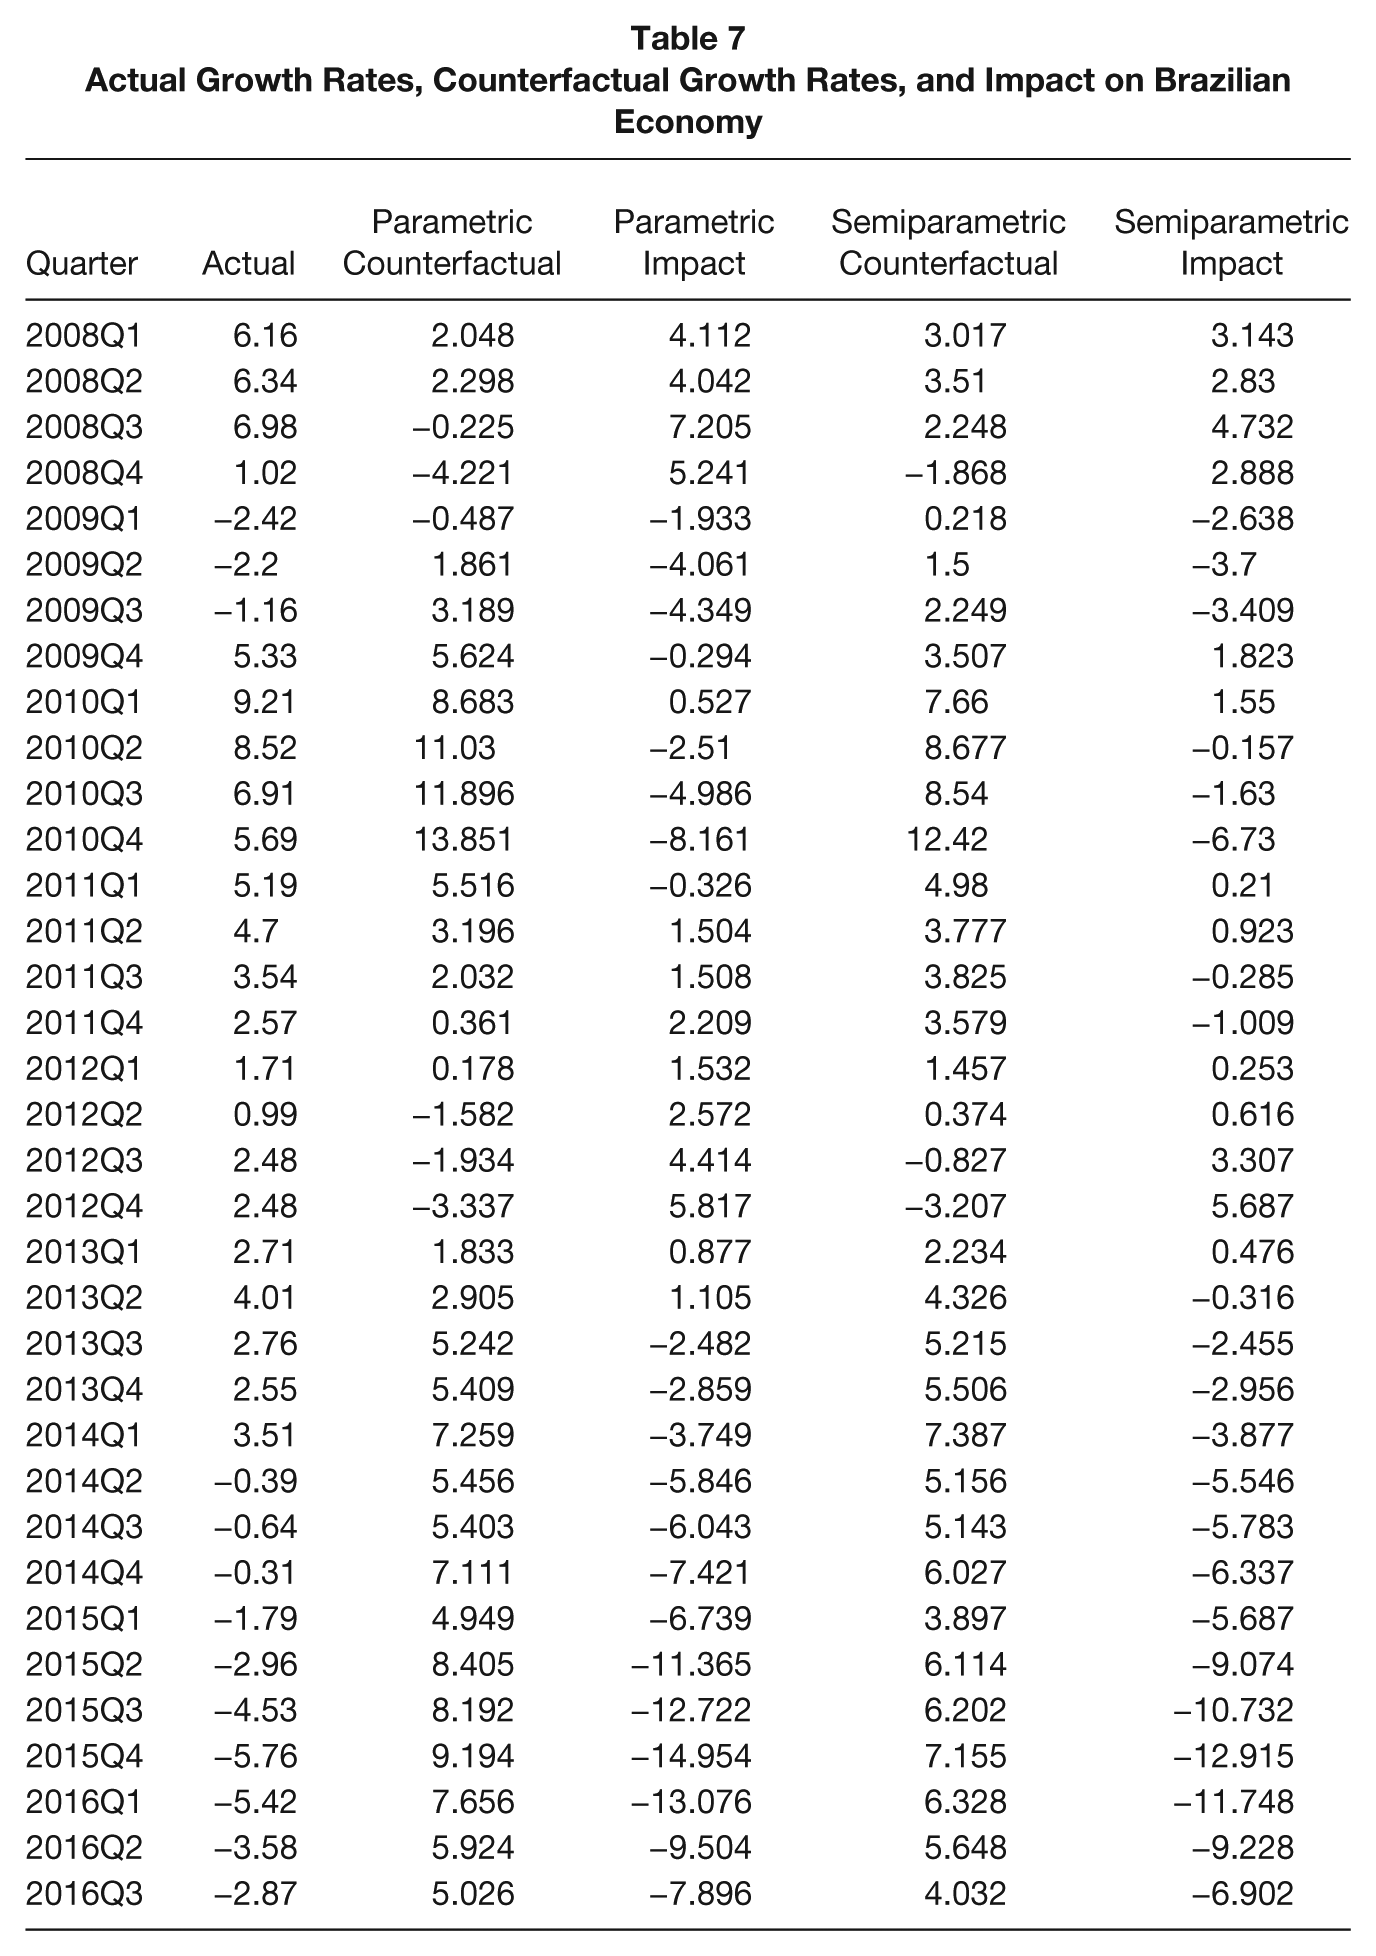
Table 7 shows the actual observations, counterfactual values, and event impact in the posttreatment period for both the linear and semiparametric models. Both models yield a similar average treatment effect, justifying the linear conditional assumption. Figure 3 plots the actual real GDP growth rates of Brazil (blue) and the estimated counterfactuals (solid red line for the linear model and dashed red line for the semiparametric model). It shows that the Brazilian economy was hit hard by the subprime crisis. The path of the actual growth rates exhibits a deep drop and even turns negative from 2008Q4, but shows a strong rebound following 2009Q4. The path predicted by the 15 control countries traces the U shape closely, and the two mega-events did bring nonignorable real GDP growth during the period. However, the negative news about the Brazilian government’s preparations for the events started to have an effect after 2013Q3. Although the counterfactual suggests a strong rebound, the Brazilian economy continued to slip into a trough. The results suggest that Brazil would have been better off if it had never hosted the mega-events, as the counterfactual growth path is higher than the actual growth path throughout most of the study period.
Actual Growth Rates, Counterfactual Growth Rates, and Impact on Brazilian Economy
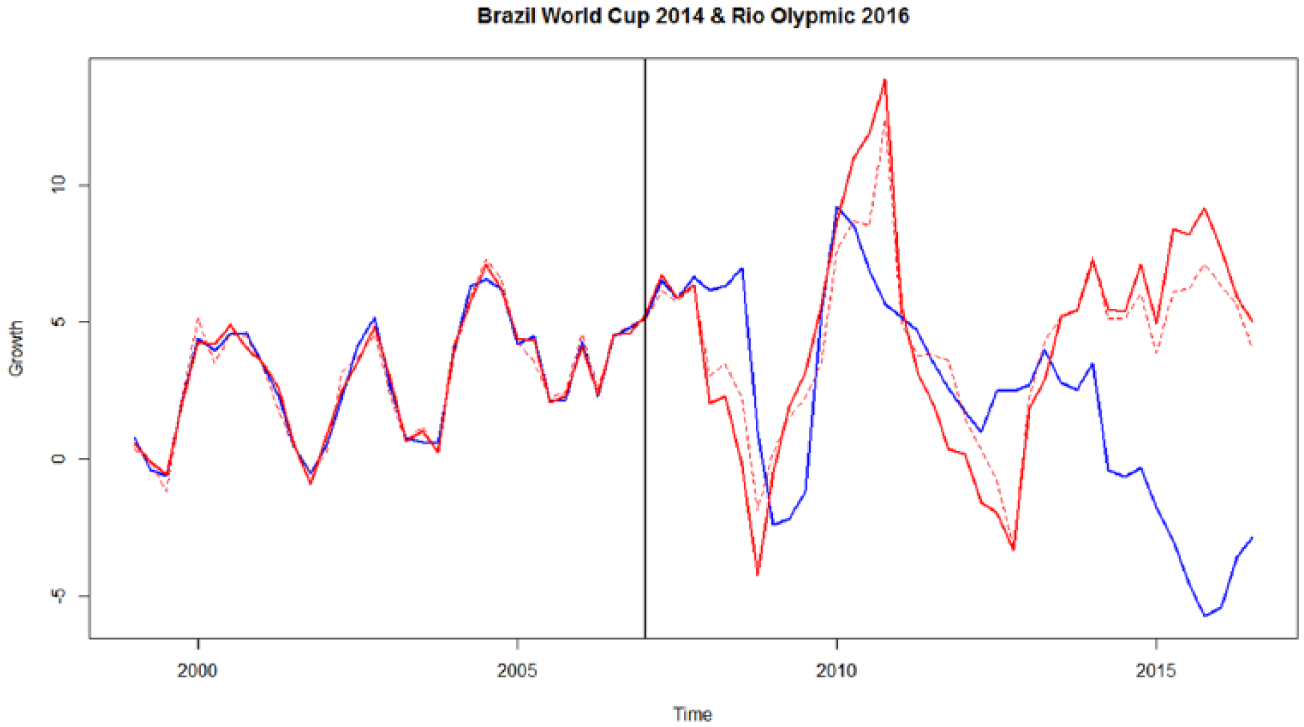
Real GDP Growth Rates of Brazil from 1999Q1 to 2016Q3
As Hsiao et al.’s (2007) model specification test gives a

Their average effect is thus equal to

Autocorrelation of the Treatment Effect
This is consistent with media reports that say the World Cup and Olympics were bad for the Brazilian economy. For example, The Guardian describes the two mega-sport events as tempestuous and says the mega-events caused more harm than good in spite of the above-target tourist arrivals and sales figures. Its interviews with local citizens reveal that the investments were geared toward the rich at the expense of the poor residents. 4 Barrios, Russell, and Andrews (2016) report that the new stadiums built in Cuiaba and Manaus for the 2014 World Cup cost 50% more than these cities’ educational budgets. Furthermore, the stadium in Cuiaba had to be shut down just 7 months after the World Cup for emergency repairs, and the stadium in Manaus hosted only 11 events in the 5 months after the tournament. If the government had invested public funding in improving the lives of its citizens, especially those in the favela communities, the economy might well have followed the counterfactual path.
Limitation and Delimitation
The panel data approach is somewhat limited in its choice of controls for predicting the “what if” scenario. As the measurement of the average treatment effect depends on the accuracy of the estimated counterfactual, too many controls relative to the number of pretreatment observations can harm the estimation. Moreover, when the controls outnumber the available time series observations, more complicated methods such as shrinkage estimations must be used.
Our study is also subject to delimitation, as we focus solely on GDP growth. This choice is mainly motivated by the needs of policy makers, who must decide whether they should financially support a mega-event. Further research could be carried out to measure the impact of mega-events on tourism industries and assess whether a crowding-out effect occurs within hosting countries.
Concluding Summary
This study provides an overall economic impact assessment of three mega-sport events held in developed and developing countries. As the effects of these events straddle the tourism sector, the cultural and recreation industries, the marketing field, infrastructure investment, and even citizen wellness, we choose to focus on their impact on real GDP growth rates.
Using the cross-correlations of real GDP growth rates, the model allows us to construct a counterfactual GDP growth rate for the hosting country that estimates the GDP growth if the mega-sport events had never been held. Our panel data approach not only considers the interconnections between countries but also measures the time-varying effect of the Games immediately after the announcement of the hosting country until the end of the Games. As the estimated counterfactual GDP growth rates represent what the economic situation would have been if the events had not been hosted, the analysis accounts for the opportunity costs and displacement effect.
The impact is modeled using the standard autoregressive process, and a simple t statistic is applied to the average treatment effect. The estimation results show that developed and developing countries behave differently. We find that the 2012 London Olympics helped boost the British economy in the aftermath of the global economic crisis. This finding is reasonable, as the United Kingdom was experiencing a historical global subprime crisis at the time. As a result, the government tried to reduce unnecessary spending. Furthermore, London is a well-developed city. To host a mega-event, the government must pay operation costs, but does not need to make very large investments in new infrastructure. Therefore, we find that the 2012 London Olympics were profitable. In contrast, the Brazilian government’s huge investment of public funding in two back-to-back mega-sport events occurred at the expense of local development, which is a higher priority at Brazil’s stage of development. Although such events help promote tourism and expenditure, their operational costs and the required infrastructure investment are too high.
Managerial Implications
Development paths often vary across countries, and the optimal investment strategy largely depends on the amount of endowed resources and the country’s current stage of business development. Policy makers must therefore weigh the costs and benefits of hosting a mega-event, as it involves a huge sum of public funding. Olympics and World Cups are often believed to bring in new revenue from the tourism industry and create new job opportunities. However, they also come with a cost that is not easily observed. Hosting countries not only incur investment expenditures on infrastructure and operation expenses but also must bear the opportunity cost. If the same amount of budget is used to improve the education or health care sector, residents may be better off. Therefore, it is important to estimate opportunity costs precisely so as not to hold an overly optimistic view of an event. Our approach not only provides a novel way to measure the associated opportunity cost, but also accounts for countries’ development stage and interlinkages when determining the time-varying impact on their economies. The differential impact between developed and developing countries suggests that policy makers should consider the development stage and endowment before voting to host a mega-event.