



Abstract
Understanding the differences and similarities in the activities of tourists from various cultures is important for tourism managers to develop appropriate plans and strategies that could support urban tourism marketing and managements. However, tourism managers still face challenges in obtaining such understanding because the traditional approach of data collection, which relies on survey and questionnaires, is incapable of capturing tourist activities at a large scale. In this article, we present a method for the study of tourist activities based on a new type of data, venue check-ins. The effectiveness of the presented approach is demonstrated through a case study of a major tourism country, France. Analysis based on a large-scale data set from 19 tourism cities in France reveals interesting differences and similarities in the activities of tourists from 14 markets (countries). Valuable insights are provided for various urban tourism applications.
Introduction
Urban tourism refers to various tourism activities in which a city is the main place of interest and visiting the city is the main purpose of the trip (Ashworth & Page, 2011). Urban cities provide a wide variety of products and services, including cultural, architectural, technological, social, and natural experiences (UNWTO, 2018). Urban tourism contributes substantial benefits to cities, such as generating employment, increasing incomes, and fostering cultural and social growth (Edwards, Griffin, & Hayllar, 2008). As such, urban tourism has experienced extraordinary growth worldwide (Bock, 2015). The growth of cities and the development of modern transportation systems (roads, railway, and aviation) has made travelling to cities easier, faster, and, in several cases, cheaper than ever before. People often visit multiple cities in one trip, which provides many different functions and attractions, thereby satisfying various motivations (Buhalis, 2000; Caldeira & Kastenholz, 2018). Understanding tourist activities is critical to city planners in developing sustainable strategies for implementing urban tourism successfully and providing positive experiences to tourists (Bauder & Freytag, 2015; Edwards & Griffin, 2013).
Studying tourist activities in an urban tourism context has been attempted, such as Girona in Spain (Espelt & Benito, 2006), Kobe in Japan (Asakura & Iryo, 2007), Huangshan in China (Shao, Zhang, & Li, 2017), and Lisbon in Portugal (Caldeira & Kastenholz, 2018). These studies focused on classifying tourists based on their behaviors such that suitable products and services can be developed for corresponding tourist groups. Tourist activities could be varied among cities within the same country, which presents challenges for tourism management organizations in developing countrywide management strategies (Heung & Quf, 2000; Swarbrooke & Page, 2012), especially for countries with multiple tourism cities, such as China, the United States, and France (Worldatlas, 2018). Many of these countries are also known as world tourism destinations that attract tourists from all over the world with various cultural backgrounds. An overall understanding of the differences or similarities among tourists from different cultures would be beneficial to tourism managers in providing tourism products and services that meet their expectations. Nevertheless, previous studies are often limited to a single city with few tourist activities and groups (H. J. Chen & Sasias, 2014; Fernández & Escampa, 2017; Luo, Vu, Li, & Law, 2020; Marques, Mohsin, & Lengler, 2018). Comprehensive views on the diverse tourist activities from various cultures in multiple tourism cities have not been obtained (Vu, 2019). The barriers are probably due to the limitations of traditional research/methods of data collection, which rely on surveys and questionnaires with small samples and/or pilot studies (Lew & McKercher, 2002; Shoval, McKercher, Birenboim, & Ng, 2015), which are limited and unreliable in capturing comprehensive information on tourist activities spanning multiple cities.
In this article, we introduce a new type of data, the venue check-ins, which have the potential for providing comprehensive insights into activities of tourists from different cultures to support urban destination marketing and management. We demonstrate the effectiveness of the introduced approach through a case study and selected France as the targeting country. France has multiple tourism cities and was named the most visited destination in the world, attracting close to 90 million visitors in 2017 (“89 Million Tourists,” 2019). The average spending of tourists in France reached US$13 billion in 2016 (Statista, 2018). France has a large number of tourist attractions, such as museums, monuments, and festivals. The capital city, Paris, is one of the most popular cities for European, Asian, and American tourists. Our case study, which was conducted using a large-scale venue check-in data set, provides a comprehensive view of tourist activities in 19 tourism cities in France. The findings reveal the similarities/differences in the activities (dining, shopping, entertainment, and sightseeing) of tourists from the 14 most popular countries (source markets). The methods and findings are particularly valuable for tourism managers and city planners, especially in France, toward promoting urban tourism and attracting tourists to city destinations.
The remainder of the article is presented as follows. The next section presents a review of existing works on tourist activities in urban destinations and compares tourists from different cultures, which is then followed by an introduction to venue check-in data. The third section discusses our method for the collection and analysis of venue check-in data. The fourth section provides a case study of inbound tourists in France, along with the empirical results. The final section concludes the article and offers future research directions.
Literature Review
Tourist Activity Studies in Urban Destinations
Tourist activity in urban destinations has been a topic of interest in numerous prior works in tourism literature. Several studies referred to tourist activities as the presence of tourists at tourism spots and attractions or their movement to and from different attractions within cities (G. Lau & McKercher, 2006; McKercher, Shoval, Ng, & Birenboim, 2008; Shoval, 2008; Shoval, McKercher, Ng, & Birenboim, 2011; Vu, Li, Law, & Ye, 2015; Zhao, Lu, Liu, Lin, & An, 2018). These studies used the presence of tourists to evaluate the popularity of locations and to infer potential activities, rather than capturing and analyzing the participated activities directly. In the context of urban tourism, the studied areas are often within cities that have diverse tourism attractions close to one another and have various potential activities. The studies focusing on tourist locations and movement might be insufficient to provide accurate information on tourist activities in such urban contexts (Scuderi & Nogare, 2018). Thus, the actual participated activities of tourists must be captured and analyzed to obtain detailed insights (Kádár, 2014; Fernández & Escampa, 2017). As such, the direct study of tourist activities has been attempted. Examples of such cases are tourist shopping activities at night markets in Taiwan (Hsieh & Chang, 2006), museum visits in Hong Kong (Vu, Luo, Ye, Li, & Law, 2018), casino visits in Macao (Luo et al., 2018), and dining activities in Melbourne and Sydney (Vu, Li, Law, & Zhang, 2019). However, these studies are often limited to a single city or focus only on a few tourist activities.
Tourist Activity Studies by Culture
Culture is defined as customs, values, beliefs, habits, traditions, expectations, and patterns of lifestyle shared by people or societies (Pizam & Jeong, 1996). Culture is also known to influence tourist behavior (Li, 2014). When combined with nationality, culture could be an important indicator of people’s attitudes, beliefs, and behaviors (J. S. Chen, 2000). Therefore, tourism service providers should have a clear understanding of the cultural patterns of tourist groups when designing their products and services to obtain a competitive edge (P. J. Chen & Pizam, 2006; Özdemir & Yolal, 2017).
National culture is a frequently researched topic in tourism (Reisinger, 2009). The numerous studies conducted during the past decade have enabled a thorough understanding on how national culture affected tourist behavior. These studies covered tourist consumption patterns (Özdemir & Yolal, 2017), information search (J. S. Chen, 2000; Ramkissoon, Uysal, & Brown; 2011), satisfaction and complaining behavior (Kozak, 2002), in-flight behavior (Kim & Prideaux, 2003), and bargaining behavior (Kozak, 2016). Multicultural studies have been conducted to identify the differences and similarities of people with different/similar cultural backgrounds. For instance, J. S. Chen (2000) showed that cultural differences can be observed among Japanese, Australian, and South Korean leisure and business tourists travelling to the United States in terms of their behavior when searching for travel information. Ramkissoon et al. (2011) found remarkable differences in behavioral intentions, perceived authenticity, information search behavior, and destination image among French, British, German, and Indian tourists. Kozak (2002) investigated the cultural differences between English and German tourists and learned that nationality has a considerable effect on the level of satisfaction from a destination. English tourists were motivated by fantasy, while German tourists were driven by cultural and physical motivations. Kim and Prideaux (2003) observed substantial behavioral differences among Japanese, Korean, Chinese, and American tourists in their expectations on the availability of in-flight materials, food and beverage requests, and their duty-free purchases. Özdemir and Yolal (2017) found that tourists from the West preferred clubbing and drinking, whereas tourists from Asia preferred shopping and visiting amusement parks. The study also found that compared with other tourist groups, Japanese were found to be the most distinct.
In the case of France, its geographical area contains many sceneries and attractions with strong and powerful images linked to its culture and heritage, making the country one of the most frequently visited destinations in the world (Horner, & Swarbrooke, 2016; Frochot, 2000). Paris, the capital of France, is considered the capital of tourism in Europe (Freytag, 2010). First-time visitors have shared that they do not have sufficient time to enjoy all activities in Paris, such as visiting the city and museums and shopping (Freytag, 2010). Many tourists shared their photos taken around Seine River from Notre Dame, Eiffel Tower, Champs Elysees, Montparnasse, and Montmartre (García-Palomares, Gutiérrez, & Mínguez, 2015). Horner and Swarbrooke (2016) argued that the insufficiency of comparative data regarding national and cultural differences in tourist behaviors as well as consumer behaviors in tourism cause studies to suffer from general weakness. This criticism is one of the motivations for this study attempting to identify behavioral differences among varied cultures in the context of urban tourism.
Data Sources for Tourist Activity Analysis
The limitations of traditional data collection approaches have urged researchers to find alternative data sources that can capture comprehensive information on tourist behavior. Examples of such data are tourist pass (Joo, Kang, & Moon, 2014), bank card transactions (Sobolevsky et al., 2015), Bluetooth (Versichele et al., 2014), and mobile tracking (Asakura & Iryo, 2007; Raun, Ahas, & Tiru, 2016). However, these data have not been adopted widely in tourism research because of their access restriction.
Recently, researchers shifted their attention to social media data, which are available at a large scale and publicly accessible, such as review comments (Ye, Luo, & Vu, 2018; Zhang & Cole, 2016), microblogging (Chua, Servillo, Marcheggiani, & Moere, 2016), and travel photos (Vu, Li, Law, & Zhang, 2018b). However, very few studies have used these data sources to study tourist activities because of the limited information they contain. In particular, review comments often contain tourist opinions and perception toward tourism products or services but are ineffective in capturing their activities for entire trips. Microblogging and travel photos are used to capture tourist movements and travel flows because of the availability of GPS coordinates (latitude and longitude) in their meta-data. Such GPS data are effective in pinpointing tourist locations but are unreliable in inferring their corresponding activities.
Venue check-in data have recently become available on mobile social media platforms, such as Foursquare, Yelp, and Dianping. The major advantage of this type of data is the contextual information in the venue meta-data in addition to the GPS location, which is convenient for determining tourist activities. Recent works using venue check-in data have utilized only raw GPS data (Kotiloglu, Lappas, Pelechrinis, & Repoussis, 2017; Salas-Olmedo, Moya-Gómez, García-Palomares, & Gutiérrez, 2018; Wörndl, Hefele, & Herzog, 2017), rather than venue information, to infer and study tourist activities (Luo et al., 2018; Vu, Li, Law, & Zhang, 2018a). These works have also focused on tourist behavior in a single city rather than in a destination country with multiple tourism cities, and tourists from only a few source countries were included. The potential of venue check-in data in providing comprehensive views on the cross-cultural activities of tourists in major tourism destinations has not been realized. As such, this article aims to demonstrate the practical capability of venue check-in-data in addressing the challenges of the multicultural study of tourist activities in urban tourism destinations.
Methodology
This section presents our approach to the exploration of tourist activities in urban destination. The data collection process, which involves the extraction of venue check-in data from social media platforms, is discussed. The focus of our study is on major tourism destination with multiple tourism cities. Therefore, we present a process for identifying popular tourism cities from the collected data set based on density clustering technique. Finally, we adopt discrete probably distribution into the analysis of tourist activities from multiple countries.
Venue Check-in Data Collection
We select Foursquare as our data source. Foursquare venue check-ins are deemed reliable in capturing tourist activities as closely as possible to real situations (Kotiloglu et al., 2017). One issue with Foursquare is that its platform does not provide a function for the direct identification and extraction of check-in data. Foursquare has integrated its system with other social media platforms, such as Twitter, which allows data extraction. Foursquare check-in data can be extracted using Twitter’s Application Programming Interface (API). The Twitter API provides a streaming function that allows the extraction of tweets at a specific location within a predefined bounding box, whose coordinates are
Tourism City Identification
When a country is a major tourism destination, the tourism cities, where tourists visit most often, must be identified. We adopted a clustering technique, P-DBSCAN (Kisilevich, Keim, & Rokach, 2010), to accommodate this task. P-DBSCAN was designed originally and used widely for clustering geotagged photo data in prior works (Vu et al., 2015). As venue check-ins have characteristics similar to geotagged photos in terms of geographical information and owner, P-DBSCAN can be used for clustering check-in data in the current work.
The clustering process of P-DBSCAN can be described as follows. Suppose C is a collection of venue check-in data and α and β denote the neighborhood radius and owner number thresholds, respectively. For each check-in
Analysis of Activities
In this article, we aim to evaluate tourist behavior with respect to three major tourism activity groups, including dining, shopping, and entertainment and sightseeing. Tourists are grouped according to their country of origin, which represents different cultural backgrounds. The venue categories in Foursquare are organized in a hierarchical structure, in which a venue category can be nested under a general category. For instance, Chinese and Japanese Restaurant categories are nested in the Asian Restaurant Category, which are nested in the super category Food. Ten super categories are defined by Foursquare. In the context of this work, we treated the check-ins at venue categories in the super category Food as indicators of dining activities, venues in the super category of Shopping & Service as indicators of shopping activities, and venues in the super categories of Arts & Entertainment, Nightlife Sport and Outdoors & Recreation, and Professional & Other Places as indicators of entertainment and sightseeing activities. Among the venues for entertainment and sightseeing, general venue types indicated large geographical areas, such as island, city, or other great outdoor attractions. However, these attractions are not useful in indicating specific tourist activities and were excluded. We did not consider venues in other super categories (college and university, event, residence, and travel and transport) in the analysis. We derived 104, 138, and 120 venue categories for dining, shopping, and entertainment and sightseeing, respectively. Spatial activities and temporal information of the check-in data will be utilized in several exploratory analyses to provide comprehensive views about tourists.
We adopted multinomial distribution to represent the activity profile of each tourist group (Everitt, 2006). For instance, let
Case Study
This section presents a case study to demonstrate the capability of venue check-in data in capturing the comprehensive activities of tourists from various cultures. The data collection process is described for a major tourism destination, France, which is then followed by result analysis and discussion on practical implications.
Data Collection
The data collection process was started based on the method outlined in Section 3.1. A bounding box was defined to cover the entire geographical area of France, and the coordinates were
As our focus is on inbound tourists, tourists must be distinguished from local residents. We used a web crawler to browse the Foursquare profile page of each identified user automatically to extract the location of their origin. The location information was then processed using Google Geocoding API to identify the corresponding country name. We excluded users who are local residents of France or who did not provide a location of origin. Thus, only tourists were accounted for in our study. Travel history of the identified tourists was retrieved using the getUserTimeline function. We retained only the check-ins that tourists made in France to represent their activities in this country. The final data set contained 51,079 check-ins, which were generated by 4,258 inbound tourists at 16,849 venues across France. Information on the check-ins (local date and time) and venue (name, category, and location) were included in the collected data set.
Preliminary analysis based on the location of origin showed the data set contained travel activities of tourists from 111 countries. Table 1 shows the 14 most popular countries with at least 100 tourists. The majority of the listed countries were identified as the most popular tourism sources for France based on an official survey (DGE, 2016). Turkey, Mexico, and Malaysia were included in our list but not in the official survey because Foursquare is popularly used by tourists from these countries; hence, many of them were included in the data collection. Among the tourists who recorded their gender, 2,614 tourists were male (61.39%) and 1,525 tourists were female (35.81%).
Tourist Distribution by Country of Origin
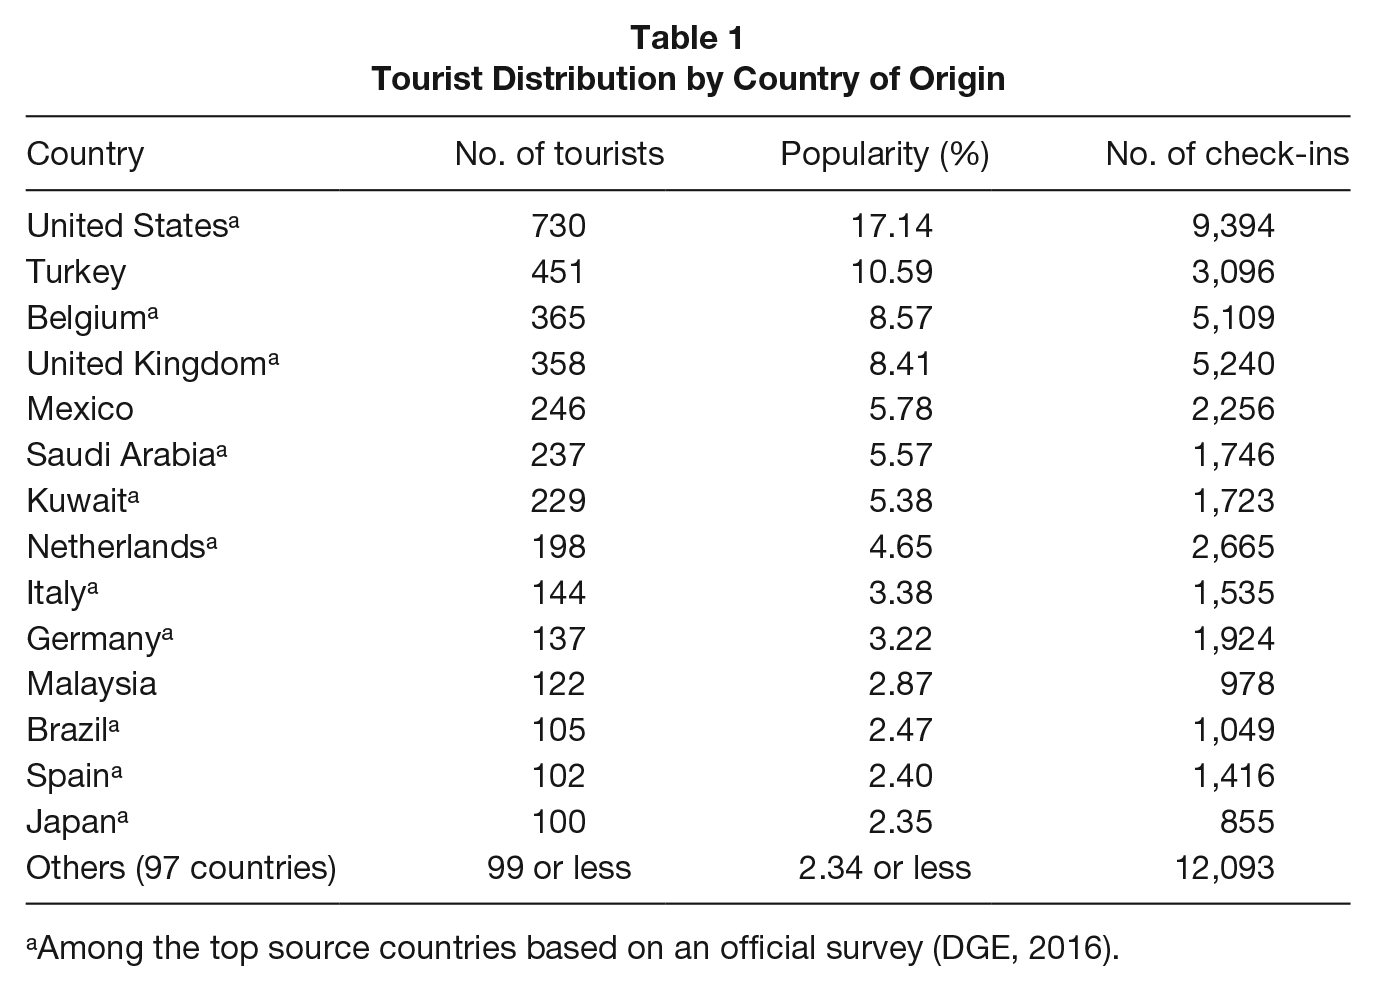
Among the top source countries based on an official survey (DGE, 2016).
We are aware that France is popular as a tourism destination and a business center, and thus visits to France could be for purposes other than tourism. However, “Check-in” was shown as a popular method for individuals to express their interests in a location, place, or venue (Kessler, 2010) to establish an image of themselves or to connect with friends (Lindqvist, Cranshaw, Wiese, Hong, & Zimmerman, 2011). Check-in data can be considered as capturing the leisure activities of visitors, who can be regarded as tourists (Vu et al., 2018a; Vu, Li, & Law, 2020). Note that, the collected data set does not include all possible tourist groups to France, such as Chinese, because Twitter and Foursquare are not popular or accessible in China. Nevertheless, the collected data set is sufficient to demonstrate the capability of our approach in capturing comprehensive tourist activities.
Activity Analysis Across Tourism Cities
We first identified popular tourism cities in France by applying the P-DBSCAN clustering algorithm to the GPS information of the check-in data. We set the radius threshold to a large value of δ = 0.1, which is equivalent to 7.5 km, because the tourism attractions are measured on a city level. The minimum owner number was set to β = 42, which is approximately 1% of the total number of tourists. Figure 1a shows the location of check-ins as colored dots on the map of France. The check-ins are spread over the entire geographical area. Several check-ins were made from Corse Island, Southeast of France. Figure 1b shows the location of check-ins after the clustering process, which consisted of 19 clusters corresponding to 19 cities. This result is consistent with the official report of popular tourism cities in France (About-France, n.d.).

Check-in Locations in France: (a) All Check-ins and (b) Clustered Check-ins
Subsequently, we examined the spatial distribution for each of the 14 tourist groups (Table 1) to explore their selection of tourism cities. The number of tourists in each city was counted and divided by the total number of tourists in the corresponding group. The values of each group across the cities were normalized to equate to 1, which represented the probability distribution of each tourist group with respect to each city. For the ease of interpretation, we visualized the probability using a heat map, as shown in Figure 2. A high value is indicated by a dark color cell, whereas a low value is indicated otherwise. The labels on the horizontal axis contained the city names and their overall popularity. For instance, Paris was the most popular city and at least 70% of the tourists visited during their trip to France. Nice and Lille are the second and third most popular cities, respectively, with considerably lesser tourists than Paris. The heat map shows the variations in the probability distribution of tourists between groups. For instance, tourists from Belgium were more likely to visit Lille. Tourists from the United Kingdom had a high chance of visiting Calais. This likelihood is due to the proximity of Belgium and the United Kingdom to France. These cities in France are closest to these countries. Among the three cities near the border of Germany, Strasbourg is the most visited city by German tourists. Nice has a high chance of being visited by most tourist groups, but not tourists from Mexico and Brazil, as shown by light colored cells. This result could be because Mexico and Brazil, which are located in South America, are far from France and convenient flights to Nice are limited.

Spatial Distribution of Tourists Across Cities
The advantages of venue check-ins are not only in identifying the location where tourists visited but also in indicating the activities they participated in. We further analyzed the distribution of activities with respect to each city for an overview of the differences in tourism activities between the cities. The number of tourists is counted with respect to each venue category belonging to dining, shopping, and entertainment and sightseeing. The values were then divided by the number of tourists in each city to represent venue popularity. Figure 3 shows the activity distribution by city for the top 30 venue categories. The horizontal axis label shows the category names and their overall popularity. The popularity of activities varied among cities. For instance, French restaurants appeared to be visited and checked-in in most tourism cities, except for Lille, Calais, and Saint-Louis. This phenomenon could be due to the low availability of such venues in those cities. Government buildings and museums are the key destinations in Paris that attracted tourists, as shown by the dark colored cells evident only in Paris. Plazas are the key attractions in Toulouse and Montpellier. Shopping malls were the most popular attractions in Lille. Historic sites are the key attractions in Saint-Michel and Avignon.
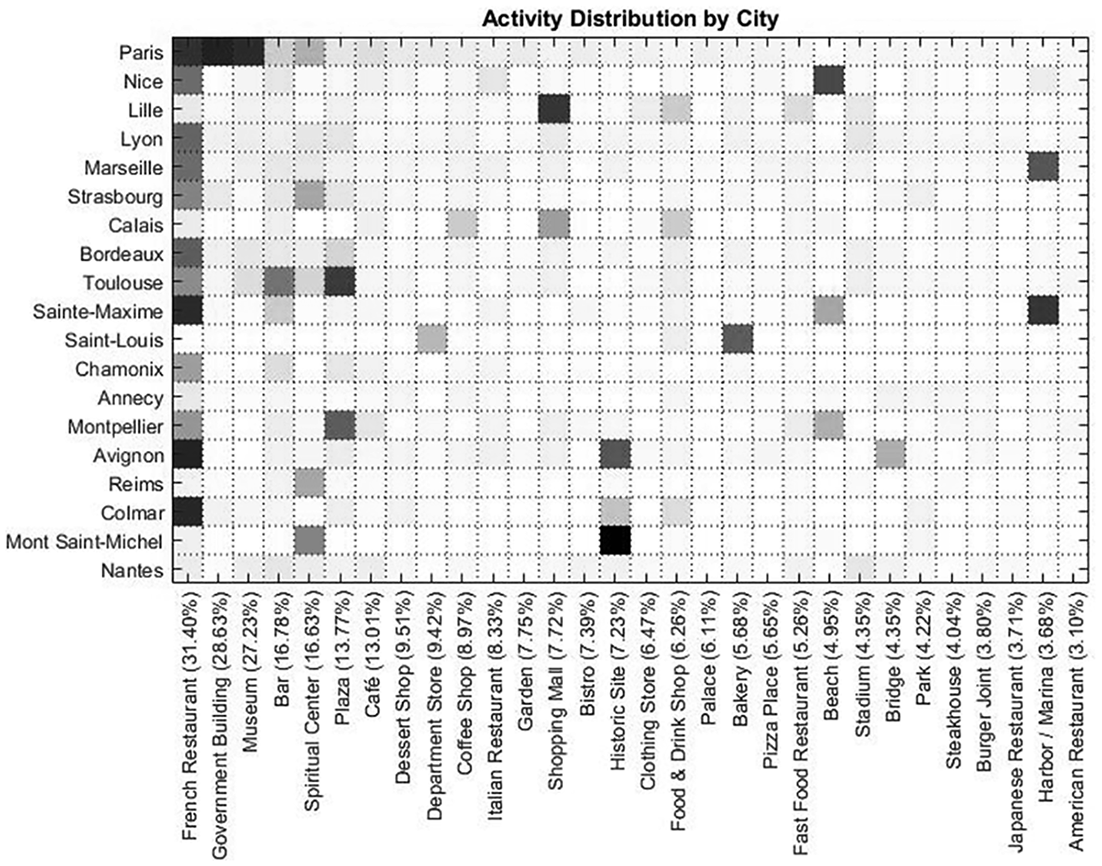
Popular Activities Across Cities
Analysis of Activities Across Cultures
This section evaluates the activities across cultures based on different activity aspects, including dining, shopping, and entertainment and sightseeing. The venue categories were grouped together with respect to their corresponding aspects. For instance, restaurants, cafés, and bakeries were under dining activity. Shops and department stores were categorized under shopping. Museums, bars, and parks were under entertainment and sightseeing activities. The popularity of the venues was computed and normalized, which represented the probability distribution of activity preference for each of the tourist groups. MDS technique was used to visualize the similarity between the tourist groups with respect to each activity aspect, as shown in Figure 4. The high values of Dispersion Accounted For indicate the visualization accounted for the majority of dispersion of the similarity metrics. We summarize our findings as follows:
Japanese tourists appeared to be different from the other groups in terms of dining behavior (Figure 4a), whereas their shopping (Figure 4b) and entertainment and sightseeing behaviors (Figure 4c) were not distinctively different.
Kuwaiti and Saudi Arabian tourists appeared to have almost the same preferences in dining (Figure 4a). They had similar shopping behavior with Malaysian tourists (Figure 4b), but not in terms of entertainment and sightseeing behaviors (Figure 4c).
Figure 4c shows countries with similar entertainment and sightseeing activities. For instance, Spain, Germany, and the United Kingdom could be regarded as one group because of their close proximity to one another. Tourists from Mexico, Brazil, and Japan appeared to have relatively similar behaviors in entertainment and sightseeing.
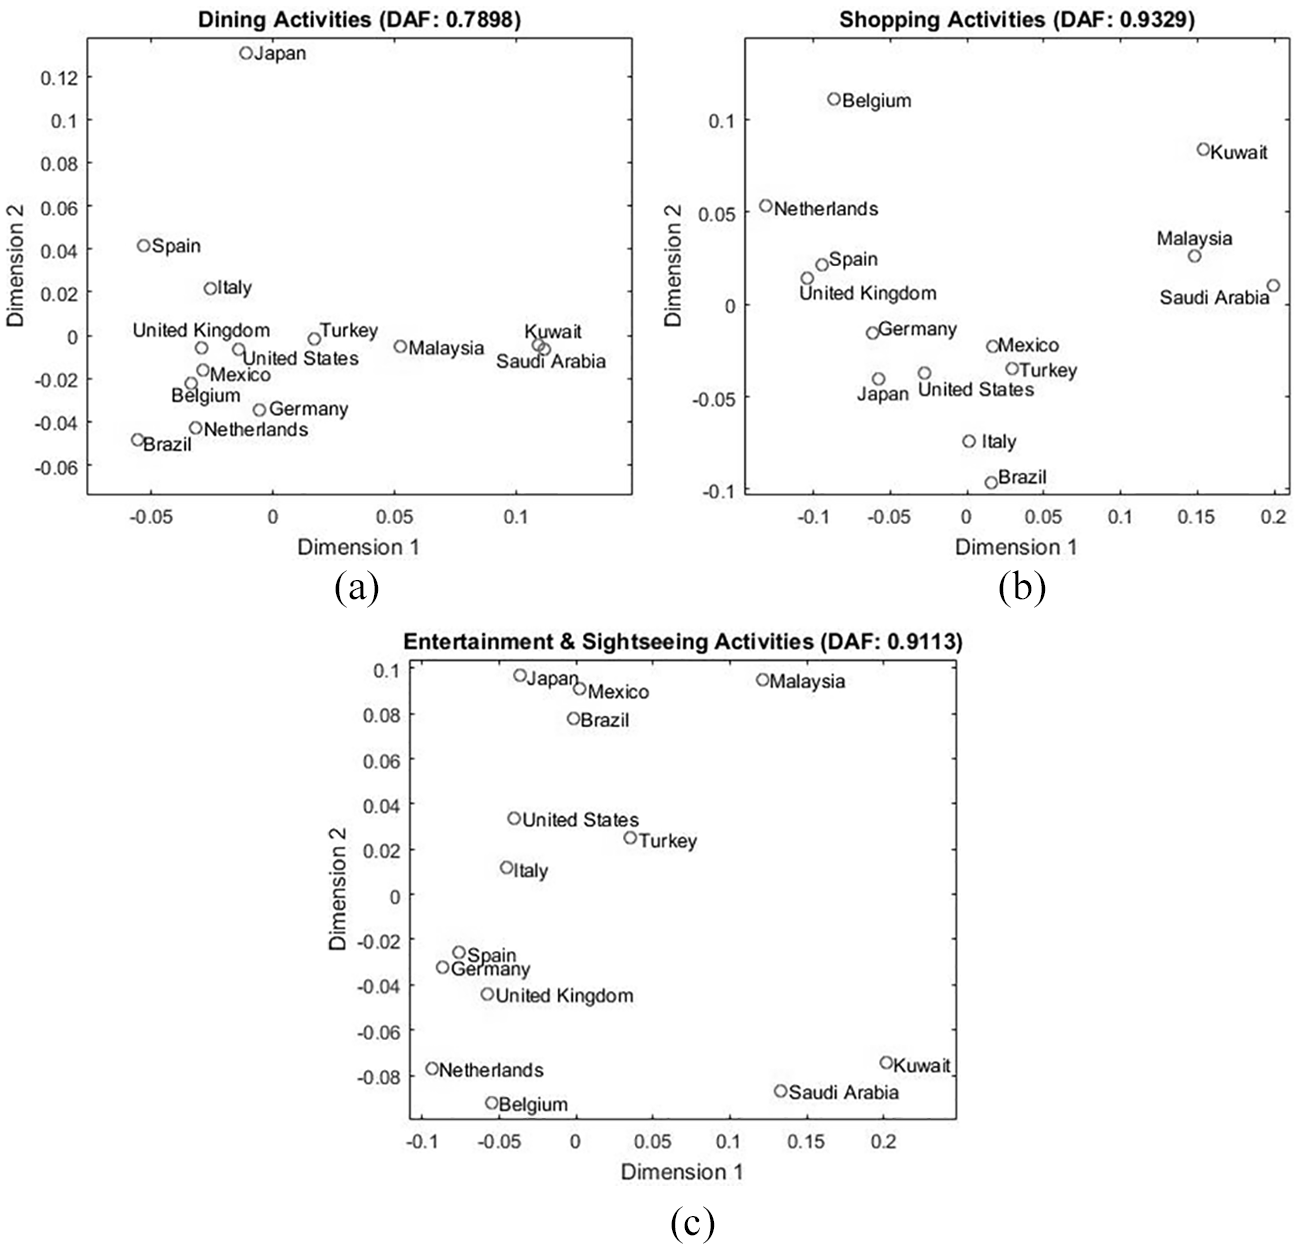
MDS Visualization of Activity Preferences Across Cultures: (a) Dining Activities, (b) Shopping Activities, and (c) Entertainment and Sightseeing Activities
In addition to identifying tourist groups with similar behavior, tourism managers and marketing professionals would be interested in identifying the most popular activities for each group such that appropriate travel products can be developed. We visualized the top 15 venue categories for each aspect of activities in Figure 5.
Figure 5a shows that French restaurants are most popular for tourists from all 14 countries. This popularity could be because of the limited international dining options in France. Tourists would not have numerous choices aside from French restaurants, which are widely available and accessible throughout the country. Cafés are popular for tourists from countries influenced by Western culture, such as the United States, Turkey, the United Kingdom, Mexico, and the Netherlands. Dessert shops are favored by tourists from Asia, such as, Saudi Arabia, Kuwait, Malaysia, and Japan. In addition, we found that bistros as well as fast food and Japanese restaurants are popularly visited by tourists from Brazil, Belgium, and Japan, respectively. Japanese tourists appear to prefer their own cuisine when dining out in France.
Figure 5b shows that tourists in France do their shopping activities in department stores, shopping malls, food and drink shops, and clothing stores. However, tourist preference for each shopping venue varied. For instance, tourists from most countries had strong preference for shopping malls, but the case is not the same for Belgians and Dutch tourists, as shown by light colored cells. Saudi Arabia, Kuwait, and Malaysia are the only three countries that exhibited high preference for outlet malls.
Government buildings and museums were popularly visited by most tourists, except for those from Belgium, the Netherlands, Germany, and Spain (Figure 5c). Bars were popularly visited by most tourists with Western culture, but not those with Asian culture such as Kuwait, Malaysia, and Japan. Saudi Arabia and Kuwait have very low interests in spiritual centers but indicated strong interests in theme parks. Furthermore, Malaysian tourists had high interest in visiting spiritual centers and theme parks.

Heatmap Visualization of Activity Preferences by Venue Category Across Cultures: (a) Dining Activities, (b) Shopping Activities, and (c) Entertainment and Sightseeing Activities
We performed a Chi-square test with respect to the nationalities and distributions across activity categories in Figure 5. The χ2 values are 479.37 for dining, 531.75 for shopping, and 957.73 for entertainment and sightseeing with p values of less than .05, which verified the statistical significance of the differences.
In addition to general activity preferences, tourism marketers are interested in specific venues likely visited by each tourist group such that specific offers can be provided. To demonstrate, we computed the probability distribution by restaurant names. Figure 6 shows a heat map for the top 20 venues likely to be visited by tourists. The horizontal axis displays restaurant names and their corresponding categories for clarity. The “*” symbol at the beginning of the restaurant name indicates dining venues belonging to a restaurant chain. For instance, Ladurée has multiple venues belonging to the same dessert shop chain. The heat map shows several tourist groups were likely to dine at popular French dining venue chains (Ladurée dessert shop and Paul Café) and American dining chains (Starbucks, McDonald’s, Five Guys, and Burger King). We also found that KFC is an American fast food chain widely available in France but was not likely visited and checked-in by tourists from most groups, except for Belgian tourists. Tourists from Saudi Arabia had high likelihood of visiting popular restaurant chains, except McDonald’s. Aside from restaurant chains, tourists visited popular and unique venues. For instance, Japanese tourists were likely to dine at Kottei Naritake, a restaurant that serves ramen in Paris. This likelihood could be because of the preference of Japanese tourists for their own cuisine or curiosity to try their own cuisine in a foreign country. Hard Rock Café was visited by tourists from several countries, especially Malaysian tourists.
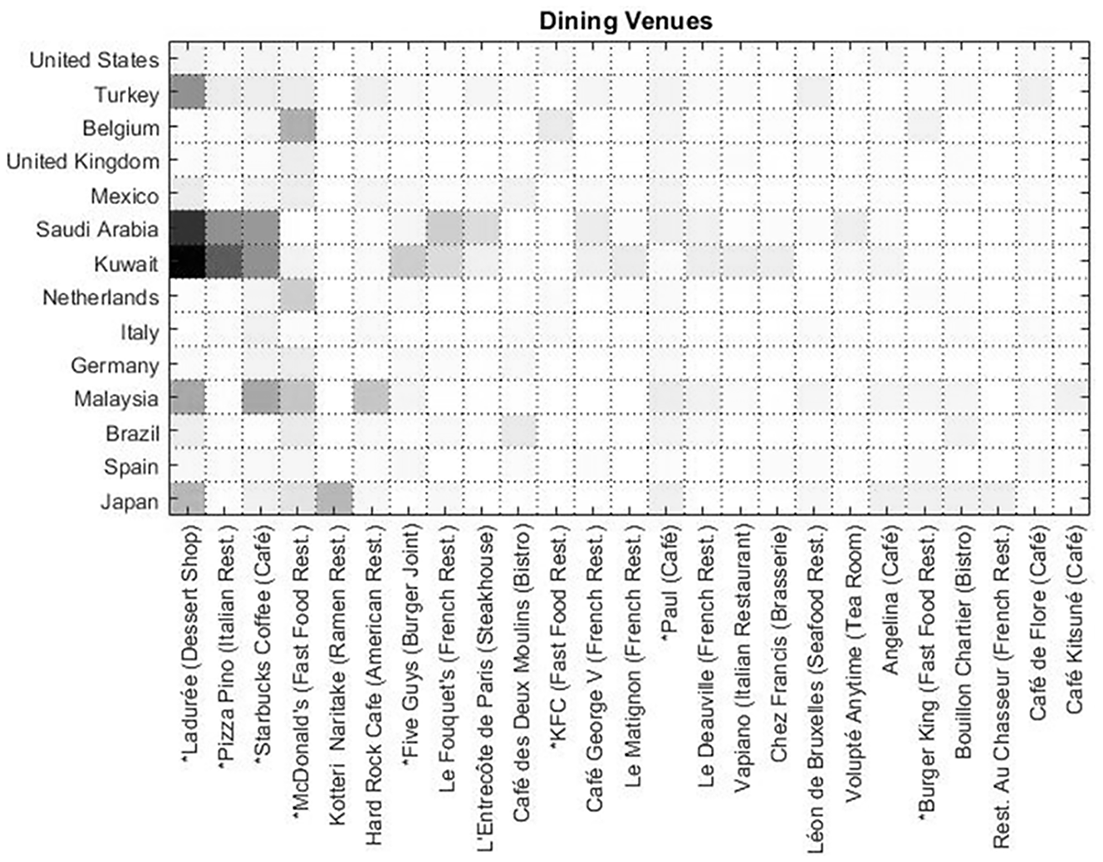
Popular Restaurants Visited by Tourists
Temporal Analysis of Activities
This section examines the temporal behavior of different tourist groups with respect to dining, shopping, and entertainment and sightseeing activities. The number of tourists who checked in at venues belonging to these activities was computed. The values were then normalized to represent probability distribution with respect to hours in a day. We visualized the probability distribution using the heat maps in Figure 7. We summarize the findings as follows:
The majority of dining activities occurred between 12:00 and 22:00 for most tourist groups (Figure 7a). However, tourists from Saudi Arabia and Kuwait tended to participate in dining activities later in the day (14:00 to 23:00). Moreover, Mexican and Italian tourists were likely to dine late at night (23:00). Several groups had a clear peak time for dining activities. For instance, Italian tourists were most likely to dine at 13:00 for lunch and 20:00 to 21:00 for dinner. The peak dinner time for Japanese tourists was 20:00 and they were less likely to dine after this hour.
Most shopping activities happened between 11:00 and 19:00, as shown in Figure 7b. Several tourist groups tended to start shopping earlier than others, such as 9:00 for Italian tourists and 10:00 for Belgian, British, and German tourists. Brazilian tourists tend to start their shopping later at 12:00. Several groups continued shopping until late in the evening, such as Kuwaiti (until 20:00) and Mexican (until 21:00) tourists.
Entertainment and sightseeing activities occurred mostly between 9:00 and 21:00 (Figure 7c) with the peak time between 11:00 and 16:00. Moreover, the peak time for Japanese tourists was from 10:00 to 12:00. Saudi Arabian and Kuwaiti tourists participated in entertainment and sightseeing activities until 22:00. However, their peak time varied, particularly 13:00 to 15:00 for Saudi Arabian tourists and 16:00 to 18:00 for Kuwait tourists.

Distribution of Tourist Activities by Hour (a) Dining Time, (b) Shopping Time, and (c) Entertainment and Sightseeing Time
In addition to the general temporal behavior, tourism managers would be interested in the tracking time of visits at individual venues, which would not be captured easily using traditional approaches. To demonstrate, we showed the visit time distribution of several entertainment and sightseeing venues (Figure 8). The activities in these categories can last for several hours, and thus, the results should be interpreted only as check-in time, rather than the present time at the venues. Tourists checked-in to several venues throughout the day, such as Eiffel Tower (11:00 to 22:00), Arc de Triomphe Monument (11:00 to 20:00), Sacré-Coeur Basilica (11:00 to 20:00), and The Centre Pompidou Museum (12:00 to 20:00). Several venues were most likely checked in at noon or in the afternoon, such as Disneyland Paris, Palace of Versailles (9:00 to 14:00), and Orsay Museum (10:00 to 16:00). Moulin Rouge Dinner Theatre and Place du Trocadéro were popular venues in the evening (16:00 to 21:00).
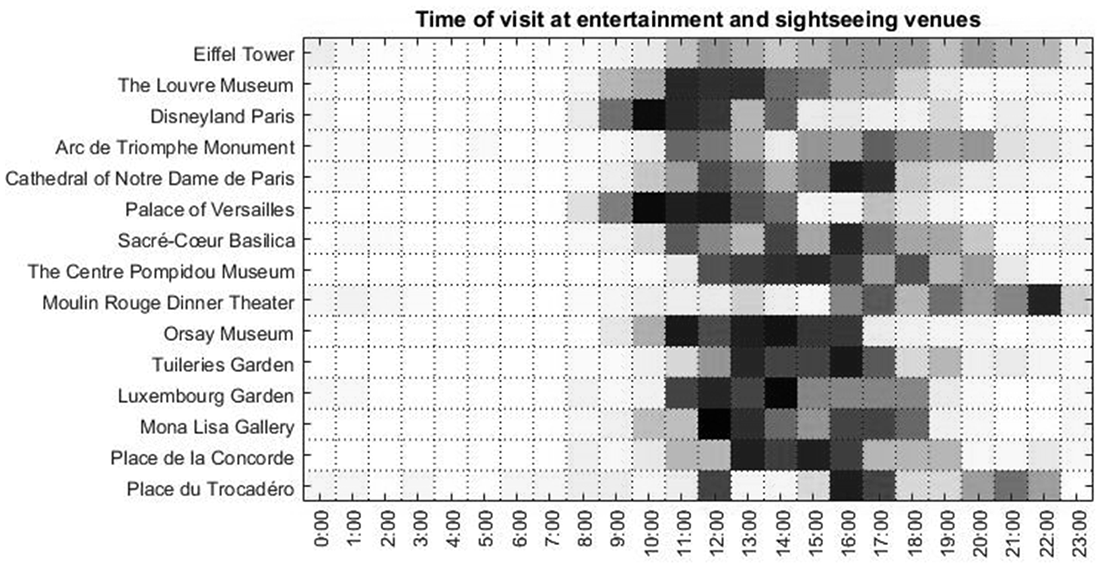
Time of Visit at Popular Entertainment and Sightseeing Venues
Discussion and Implications
The result demonstrated the capability of venue check-in data in capturing comprehensive information on the activities of tourists from different countries. The collected data spanned multiple cities in a destination country and covered more tourist groups than most prior studies (H. J. Chen & Sasias, 2014; Fernández & Escampa, 2017; Luo et al., 2018; Marques et al., 2018). The approach of data collection based on check-in is cost effective, as the data were obtained using automatic data collection software utilizing API. The data were also collected at a large scale without the need of direct contact with tourists, which is more efficient than traditional survey and questionnaire approaches (Lew & McKercher, 2002; Shoval et al., 2015). Thanks to the availability of venue category information in check-in meta data, a comprehensive list of activities was captured, which could not be accomplished easily using traditional data collection methods (Shoval et al., 2015), or using other large-scale data sources as in prior works (Asakura & Iryo, 2007; Joo et al., 2014; Sobolevsky et al., 2015).
Based on the findings, several implications can be derived as follows. Section 4.2 identified various tourism cities in France and revealed the special characteristics that could be attractive to tourists through the heat map of activity distributions (Figure 3). We found the spatial distribution of tourist visitation is concentrated (Figure 2). Tourists often focused on top cities, such as Paris, Nice, and Lille, which represented over 85% of tourist visitation in our sample. The tourism expenditure of France is lower than that of several countries, yet the country is ranked as the third most popular tourist destination in the world. This description is viewed as the “French tourism paradox” (Barros, Botti, Peypoch, Robinot, & Solonandrasana, 2011). From the risk management perspective, this case is not healthy. A destination with an overly concentrated tourist attraction center will experience a huge drop in tourists during and after negative events, such as terrorist attacks and natural disasters. The November 2015 Paris attacks is an example (Chow & Kostov, 2015). After the attack, the number of tourists that visited France dropped by 1.5 million in 2016. Therefore, the French government should consider how it can divert their visitors to other cities in the country, which could provide attractive activities to tourists, rather than advertising only the top cities. For example, harbors and marinas can be advertised as major attractions in Marseilles, bars and plazas can be advertised as attractions in Toulouse, and historic sites can be major selling points for Avignon and Mont Saint-Michel.
Figure 3 shows the top three attractions are French restaurants, government buildings, and museums. Museums are top attractions because France has an extensive cultural and historical heritage, with numerous attractions, such as museums, monuments, festivals, coastal areas, and scenic spots (Corne, 2015). However, French restaurants are the major attractions to tourists, as shown in the frequent visits and check-ins. The identification of this attraction provides the government with an inexpensive way of diverting visitors to other cities via food tourism. Building or transferring museums or governments to other cities could be expensive or impossible. However, providing incentives to restaurant owners to expand in other cities could encourage business development and divert visitors, especially those who enjoy French food, to visit these cities. In addition, government and heritage buildings are major tourist attractions. Hence, culture is an important attraction for tourists. Therefore, culture tourism is the key to promoting urban tourism. Each city should develop a unique identity to attract tourists.
The analysis in Section 4.3 demonstrated that tourists from different cultures (countries) could behave similarly or differently in various aspects. For instance, prior works have often assumed that Japanese tourists share a similar cultural background with other Asians who represent Eastern culture (Kim & Prideaux, 2003; Li, 2014). However, Japanese tourists do not always behave the same way as other Asian tourists. For example, Japanese tourists have different dining behaviors (Figure 4a). In addition, the entertainment and sightseeing behaviors of Japanese tourists appears closer to tourists who are presumed different from their culture, such as tourists from Brazil and Mexico (Figure 4c). We found that Muslim tourists from Kuwait and Saudi Arabia have different shopping and entertainment and sightseeing behaviors than other cultures (Figures 4b and 4c). Our analysis demonstrated that grouping tourists based on continent of origin (Vu et al., 2015; Ye et al., 2018) or the categorization of tourists into Western and Asian cultures (Li, 2014; Özdemir & Yolal, 2017; Reisinger & Turner, 2002; Vu et al., 2018a) may not provide a complete understanding of the differences and similarities among tourists from different cultures. The grouping of tourists based on nationality may be preferred when studying tourist activities. Urban tourism managers must further identify activities that would cause tourists from similar or different cultures to behave similarly or differently, such that marketing strategies can be applied effectively. For example, we found that Japanese tourists are the only group who showed high interest in Japanese restaurants (Figure 5a). Therefore, marketing materials on France that are targeted for Japanese tourists can incorporate information related to Japanese food to encourage their interest and participation in dining activities. Marketing materials targeting Muslim tourists should highlight outlet malls and theme parks because these tourists exhibited high interests in such shopping venues (Figure 5b) and entertainment activities (Figure 5c). In addition, the analysis by venue name for restaurant (Figure 6) suggests that Muslim tourists may also be interested in visiting Ladurée, Pizza Pino, and Starbucks for dining. Tourism managers may consider offering coupons, promotions, or special offers to this group to promote their dining activities in urban cities during their trip to France.
A key benefit of venue check-in data is the availability of temporal information, which pinpoints the exact local time of the activities for detailed insights into tourist behaviors. The heat maps in Figure 7 could be regarded as the temporal profile of tourists from each country with respect to different activity aspects. Tourism managers can design travel itineraries that fit the habits of different tourist groups, especially for dining activities, where clearly different patterns were determined for tourist groups (Figure 7a). For example, lunch can be organized at a later time in the day for tourists from Saudi Arabia and Kuwait, compared with the typical noon lunchtime of other tourist groups. Late dinner options can be offered to tourists from Mexico, Saudi Arabia, Kuwait, and Italy, because they tended to dine late at night. However, because the time for shopping activities are influenced considerably by the opening time of shops, shopping trips for tourists from Belgium, the United Kingdom, Italy, and Germany can be organized early because they tended to start their shopping activities earlier than other groups (Figure 7b).
Moreover, we noticed that tourists tended to start their day early, as shown in the entertainment and sightseeing activities (Figure 7c). However, few check-ins occurred at breakfast time, given the identification of popular French food in the previous analysis. This finding is probably because tourists often have breakfast at their hotels, rather than at a dining venue elsewhere. Hotel managers in France can focus on improving their breakfast menu and advertising their selling points to promote their hotels. The result in Figure 8 indicates that venue check-ins can be another means of tracking the peak periods at specific venues. As check-ins can be collected in real-time, tourism managers can consider developing mobile applications to recommend to tourists the best time to visit to avoid crowds, which create a negative experience for visitors (Vu et al., 2015).
Despite comprehensive analysis, our case study is not without limitations. Our data were collected using free access to Twitter API, which does not return all check-in tweets at a time because of quota limitation. The collected data set was only a subset of all available check-in tweets. Therefore, a long streaming period is required to collect a large-scale data set, as in our case study. If a large data set needs to be collected in a short time, commercial APIs, such as Decahose or Firehose (https://developer.twitter.com/en/enterprise), are recommended for full access. However, the full access comes with a fee. We have identified tourists from 111 countries in our data collection, but only the top 14 countries were included in our analysis because the number of tourists in other groups was insufficient at the current stage. Additional countries could be included in future studies when additional data become available and the streaming function can be kept running once deployed.
The analysis was conducted under the context of urban tourism in France. The findings may not be applicable directly to other major tourism countries, such as the United States and China, as tourists may behave differently at different countries. The aim of our analysis is to demonstrate the capability of the check-in feature in capturing the various activities of different tourist groups. Therefore, only the overall analysis on similarities and differences was carried out according to multiple venue categories using MDS and heat map visualization techniques. The comparison between specific tourist groups can been done for individual venue categories depending on the need for practical applications (K. N. Lau, Lee, & Ho, 2005). Traditional statistical tests can be used to validate their significance (Vu, Li, & Law, 2020).
This study identified different behaviors exhibited by tourists from different countries within cities. Previous studies usually examine tourist behaviors of different cultures within one particular destination. However, the contribution of this study is that it takes advantage of check-in data and examines behavior of tourist from different countries in varied cities. The results presented above showed that tourists from different countries behave differently and substantially. However, data and theories that could be used to explain the tourist behaviors are still insufficient and these features could be discovered in future studies when large-scale data are available.
The activities were grouped mainly into three aspects, comprising dining, shopping, and entertainment and sightseeing, to compare the tourist groups. Different grouping approaches can be considered depending on the needs of specific studies, such as grouping dining venues into fast and slow food categories (Mkono, 2012) for further insights into tourist dining behaviors. The result of this study can aid destination management organizations in allocating their resources to the most effective use and increase local consumption through strategic management. Restaurant owners could be benefited from designing their operating hours to accommodate the visiting hours of target customers. Destination managers could advertise restaurants and local attractions directly to customers, which could enhance tourist experiences and help tourists develop significant memories.
Similar to other research using Big Data, this case study could have potential bias. For example, because of its availability and access in China, Twitter and Foursquare are not popular among mainland Chinese tourists. Thus, not all popular tourist groups visited France could be included in the study. Check-in data have certain pitfalls because data do not fully represent all movements within the city and are influenced considerably by the tourist’s choice of checking in. Hence, future works can consider utilizing venue check-ins from alternative platforms, such as Dianping, to capture and study the behaviors of mainland Chinese tourists. Check-in data from multiple platforms can be integrated into future studies to ensure that comprehensive insights can be obtained. Although our case study focused on tourist activities, future works can use venue check-ins to study tourist movements similarly to other data sources, such as geotagged photos (Vu et al., 2015) and tweets (Chua et al., 2016) because of the availability of the GPS information in metadata. Although check-in data can capture comprehensive information about tourist activities, they do not provide detailed information about tourist opinions and perceptions. Data collection based on venue check-in does not completely replace, but could be treated as a complementary data collection approach to, the traditional survey and questionnaire approaches.
Conclusion
Understanding the activities of tourists from various countries in urban destinations is important for tourism managers in developing appropriate plans and strategies to support tourism marketing and managements. However, prior works are often limited to a few activities and tourist groups in a single city, thereby failing to provide comprehensive insights. Furthermore, traditional approaches have relied primarily on surveys and questionnaires, which are incapable of capturing large-scale tourist activities. With the aim of addressing these challenges, we presented a method for a multicultural study of tourist activities based on a relatively new type of data, the venue check-ins. We introduced a method for identifying popular tourism cities from check-in data according to density clustering and a method for analyzing multicultural activities using multinomial distribution. We utilized visualization techniques, MDS, and heat maps to support our analysis of the results. The effectiveness of the presented approach was demonstrated through a case study of a major tourism country, France. Results revealed interesting insights into the behavior of tourists from multiple source markets in tourism cities in France, through which practical implications to urban tourism management are offered. A direct extension of this work is to utilize venue check-ins and the presented methods for further multicultural studies of tourist activities at various major tourism destinations. Venue check-in data from multiple platforms can be incorporated into studies to obtain comprehensive insights into the behavior of tourists from more source markets. The introduced tool and techniques could be used as a complementary approach to survey and questionnaire for tourism managers to obtain an insight into the behavior and activities preferences of various tourist groups in urban destinations. Effective destination management and marketing strategy can thus be developed, as demonstrated in the case of France in this article. Note that, the data collection tool can be deployed to collect venue check-in continuously. Tourism managers can also study any change in activity behavior of tourist overtime to identify emerging trends in tourism behavior, which opens new opportunities for tourism business development.
Footnotes
Authors’ Note:
The work described in this article was supported by a research grant funded by the Hong Kong Polytechnic University, the research fund for Xinjiang Uygur Autonomous Region, Deakin University ASL 2019 fund, and partially supported by grants from the National Natural Science Foundation of China under Grant No: 71974010. The work was completed when G. Li was on ASL in Chinese Academy of Sciences.
