
Abstract
A hybrid tourism demand interval forecasting system is proposed consisting of two parts: the construction of forecasting interval based on lower and upper bound estimates, and the forecasting interval adjustment based on an optimized reduction coefficient. Coronavirus factors are added as input variables to improve forecasting performance. A new multi-objective optimization algorithm is proposed to construct a feature selection method, optimize the forecasting model, and estimate the optimal reduction coefficient. The results of the experiments show that the proposed system has a powerful interval forecasting ability, which provides crucial guidance for balancing the recovery of the tourism industry and the control of the epidemic spread during the COVID-19 pandemic, and contributes to contingency planning for tourism practitioners and managers.
Keywords
Highlights
Tourism interval forecasting provides guidance for tourism recovery during the COVID-19 pandemic.
Feature selection was employed to adaptively select input variables.
A modified multi-objective algorithm is proposed to optimize parameters.
An optimized reduction coefficient is proposed to adjust interval forecasting width.
Introduction
The tourism industry accounts for a significant share of the global economy (Hu, Qiu et al., 2021). The World Tourism Organization expects the continuous growth of tourism over time. From 2009 to 2019, real growth in international tourism receipts exceeded the growth of the world’s gross domestic product. In 2019, the total international tourism receipts reached US$1481 billion, accounting for 7% of global exports and 28% of the world’s service exports, underscoring the sector’s strength and resilience. To maintain the sustainability and stable development of tourism, tourism demand forecasting has attracted increased attention from experts and practitioners (Wu, Ji et al., 2021).
Compared with forecasting at time scales of months and years, daily tourism demand forecasting can provide more specific and targeted guidance for related organizations (Li, Ge et al., 2020 ). For tourism industry practitioners and managers, accurate daily tourism demand forecasting can set reasonable prices, enhance the utilization rate of tourism-related services, and promote the efficient allocation of resources (Bi, Li, Xu & Li, 2021). For local governments and relevant departments of destinations, accurate tourism demand forecasting helps in risk management, strategic planning, and reasonable dispatching (Bi, Li et al. 2021; Athanasopoulos et al. 2018). Thus, accurate and effective tourism demand forecasting has great practical application value (Hu et al., 2021; Álvarez-Díaz & Rosselló-Nadal, 2010). However, tourism demand time series has distinct nonstationary, stochastic, and nonlinear characteristics that are attributed to the impact of various external factors, such as irregular events and seasonal variations (Duan et al., 2022; Zhang et al., 2022). For example, COVID-19 caused structural breaks in global tourism markets, creating significant challenges for tourism demand forecasting performance.
Experts and scholars have taken steps to deal with the disadvantages of using only single tourism demand time series data in tourism demand forecasting. Specifically, with the development of the Internet and other information sources, tourists tend to collect information about a destination in advance, such as hotels, weather, and transportation. This behavior has triggered the rise and development of search engine data (Liu, Liu et al., 2021). Owing to their real-time and high-frequency characteristics, search engine data are used in tourism demand forecasting to supplement traditional data sources and obtain a better grasp of the future trends in tourism (Li & Law, 2020). However, owing to the huge volume of search engine data, it is important to identify useful key information. For example, COVID-19 has had a tremendous impact on the global tourism industry (Gunter et al., 2022; Shin et al., 2021) but was not considered in previous studies.
Most search query data are determined by intuition and prior domain knowledge. Too few variables may lead to the loss of crucial information, while excess amounts of data may contribute to multicollinearity or overfitting issues (Li et al., 2021). Feature selection can automatically determine the appropriate input variables relative to tourism demand from search engines. It is a key step in filtering invalid information and enhancing algorithm accuracy (Chandrashekar & Sahin, 2014). Given the large amount of search engine data, a data subset can be obtained based on feature selection for improved forecasting results (Domingos, 2012). The main advantages of feature selection are its ability to deal with overfitting and improve forecasting performance (Guyon & De, 2003). Thus, it is a useful tool for selecting proper feature variables from massive amounts of search engine data to improve tourism demand forecasting ability.
Another attempt to improve tourism demand forecasting accuracy is the development of more effective methods, such as artificial intelligence (AI) methods. AI models have been widely used in time series forecasting (Nie et al., 2020; Wang, Wang, Lu et al. 2021; Jiang et al., 2021; Niu & Wang, 2019; Wang et al., 2021). AI models, including artificial neural networks (ANNs; Zhang Wang & Niu 2021) and other technologies (Wei et al., 2021), possess excellent nonlinear fitting ability to better capture the nonlinearity and randomness of the tourism demand time series. The echo state network (ESN) is a traditional ANN that is widely used in forecasting fields (Qin et al., 2019). ESN is an advanced version of recurrent neural network (RNN). Compared with RNN, ESN has higher computational efficiency and accuracy (Wang et al., 2020). The unique characteristic of ESN is introducing reservoirs (a series of recurrent neurons) to replace the hidden layers in traditional ANNs. In the process of modeling, the recurrent neurons are randomly initialized and remain unchanged. Different from other ANNs that need to train all layers in each iterative, the ESN does not need to train the input and reservoir layers, which accelerates its learning and extrapolation process (Gao et al., 2021). Furthermore, the ESN has performed satisfactorily in addressing various forecasting problems, such as stock price return volatility prediction (Trierweiler Ribeiro et al., 2021), traffic forecasting (Zhang et al., 2020), and wind power forecasting (Wang et al., 2019). Because of its powerful fitting ability, ESN has been taken as the predictor for tourism demand forecasting in this paper. The ESN has three main parameters: reservoir scale, reservoir connection rate, and reservoir spectral radius. The design of these parameters significantly affects the forecasting performance of the ESN. To promote forecasting accuracy and stability, this paper proposes a modified multi-objective gorilla troops optimizer (MMOGTO) algorithm to optimize the hyperparameters of the ESN. The modified multi-objective optimization strategy considers both accuracy and stability, which is instrumental to achieving high-quality tourism demand forecasting results.
Although many advanced technologies and algorithms have been developed to enhance tourism demand forecasting performance, volatile market conditions and other external factors (e.g., COVID-19) pose serious challenges to accurate and robust tourism demand forecasting. The combination of these factors leads to the uncertain, nonlinear, and unstable characteristics of tourism demand time series. In this context, point forecasting is unable to provide valid and sufficient information for decision-makers. Thus, interval forecasting is considered by academics and practitioners to forecast future outcomes to further depict the uncertain information associated with traditional point forecasting (Wu et al., 2021). Compared with point forecasting, interval forecasting simultaneously exhibits the central tendency of the prediction and the variation range for a given confidence level. Moreover, given different confidence levels, different forecasting intervals are built, which is conducive to the formulation of various policies and strategies (Li, Wu et al., 2019 ). However, there are problems in interval forecasting that require attention, such as the tradeoff between the interval coverage rate and width, and low interval forecasting accuracy. To solve these problems, an interval reduction coefficient tuned by the modified multi-objective optimization was introduced, which is used to balance the coverage rate and width, and further improve interval forecasting accuracy and stability.
In summary, the main issues addressed by this paper are as follows:
(1)
(2)
(3)
(4)
This paper proposes the novel hybrid interval forecasting system, namely MMOGTO-ESN with feature selection to perform the lower and upper bound estimation (LUBE) of daily tourism demand interval forecasting. Considering that single input information limits the performance of daily tourism demand interval forecasting, many potential exogenous explanatory variables—such as search engine data and COVID-19 information—are considered as candidate feature variables in our study. The addition of COVID-19 information provides a better interpretation of the volatility and uncertainty of tourism demand time series and improves the effectiveness of interval forecasting. Subsequently, feature selection based on MMOGTO-ESN is performed to adaptively select the appropriate input variables from all candidate feature variables (e.g., historical tourism volumes, search engine data, and COVID-19 information). These variables are then input into the trained ESN whose hyperparameters are optimized by MMOGTO to obtain the initial lower and upper bounds of forecasting interval. It should be noted that feature selection and ESN forecasting are conducted simultaneously to reduce running costs and enhance computational efficiency. To further improve the interval forecasting performance, a reduction coefficient tuned by MMOGTO is proposed to coordinate the coverage rate and width. By combining the initial lower and upper bounds of forecasting interval and the optimized reduction coefficient, the final interval forecasting results can be obtained. Two datasets on two well-known tourist attractions in China and the United States were employed to verify the interval forecasting performance of the proposed forecasting system. The simulation results demonstrate the effectiveness of the proposed system, which can provide valuable references for managers’ decision-making.
The remainder of this paper is organized as follows. Section 2 reviews the related work on tourism demand forecasting. Section 3 presents the methods and framework of the proposed forecasting system. The data selection and experimental analysis are described in Section 4, while Section 5 concludes the paper.
Related Work
Traditional Tourism Demand Forecasting Models
Researchers have explored many tourism demand forecasting methods, which can be classified into three types: time series methods, econometric methods, and AI methods. Time series methods are used to forecast tourism demand by analyzing the patterns in historical tourism demand data. Common time series methods include exponential smoothing, autoregressive (AR), moving average (MA), and autoregressive integrated moving average (ARIMA; Akin 2015; Lim & McAleer 2002). Econometric methods attempt to build rational bridges between exogenous variables and the dependent variable to explain and forecast the dependent variable. Econometric models can be classified as static models (e.g., gravity models [Morley et al., 2014], autoregressive distributed lag models), and dynamic models (e.g., vector autoregressive [VAR] models [Dergiades et al., 2018], time-varying parameter models [Song et al., 2011], and error correction models).
Although these methods have been proven to improve tourism demand forecasting performance, there are some disadvantages. For example, time series methods cannot deal with nonlinear time series patterns, while econometric methods always require some preliminary hypotheses that are often difficult to satisfy in practice (Jiang, Yang, et al., 2020). Recently, AI methods, such as ANNs and support vector regression (SVR) have been employed to predict tourism demand. Compared with time series and econometric models, AI models possess excellent nonlinear fitting ability and require no preliminary assumptions; hence, they are promising tools for improving tourism demand forecasting performance.
Tourism Demand Forecasting Based on Search Engine Data
Google is the world’s most popular search engine with a market share of over 90%. Thus, it is a reliable platform that collects and reflects tourists’ interests, and has been used by many researchers (Huang & Hao, 2021). Baidu is another useful search engine widely used in China. Data from Google Trends and Baidu Index can be used to effectively predict tourism demand (Bi et al., 2020). With the development of various forecasting methods, an increasing number of studies have employed search engine data along with time series methods, econometric methods, and AI methods to conduct tourism demand forecasting.
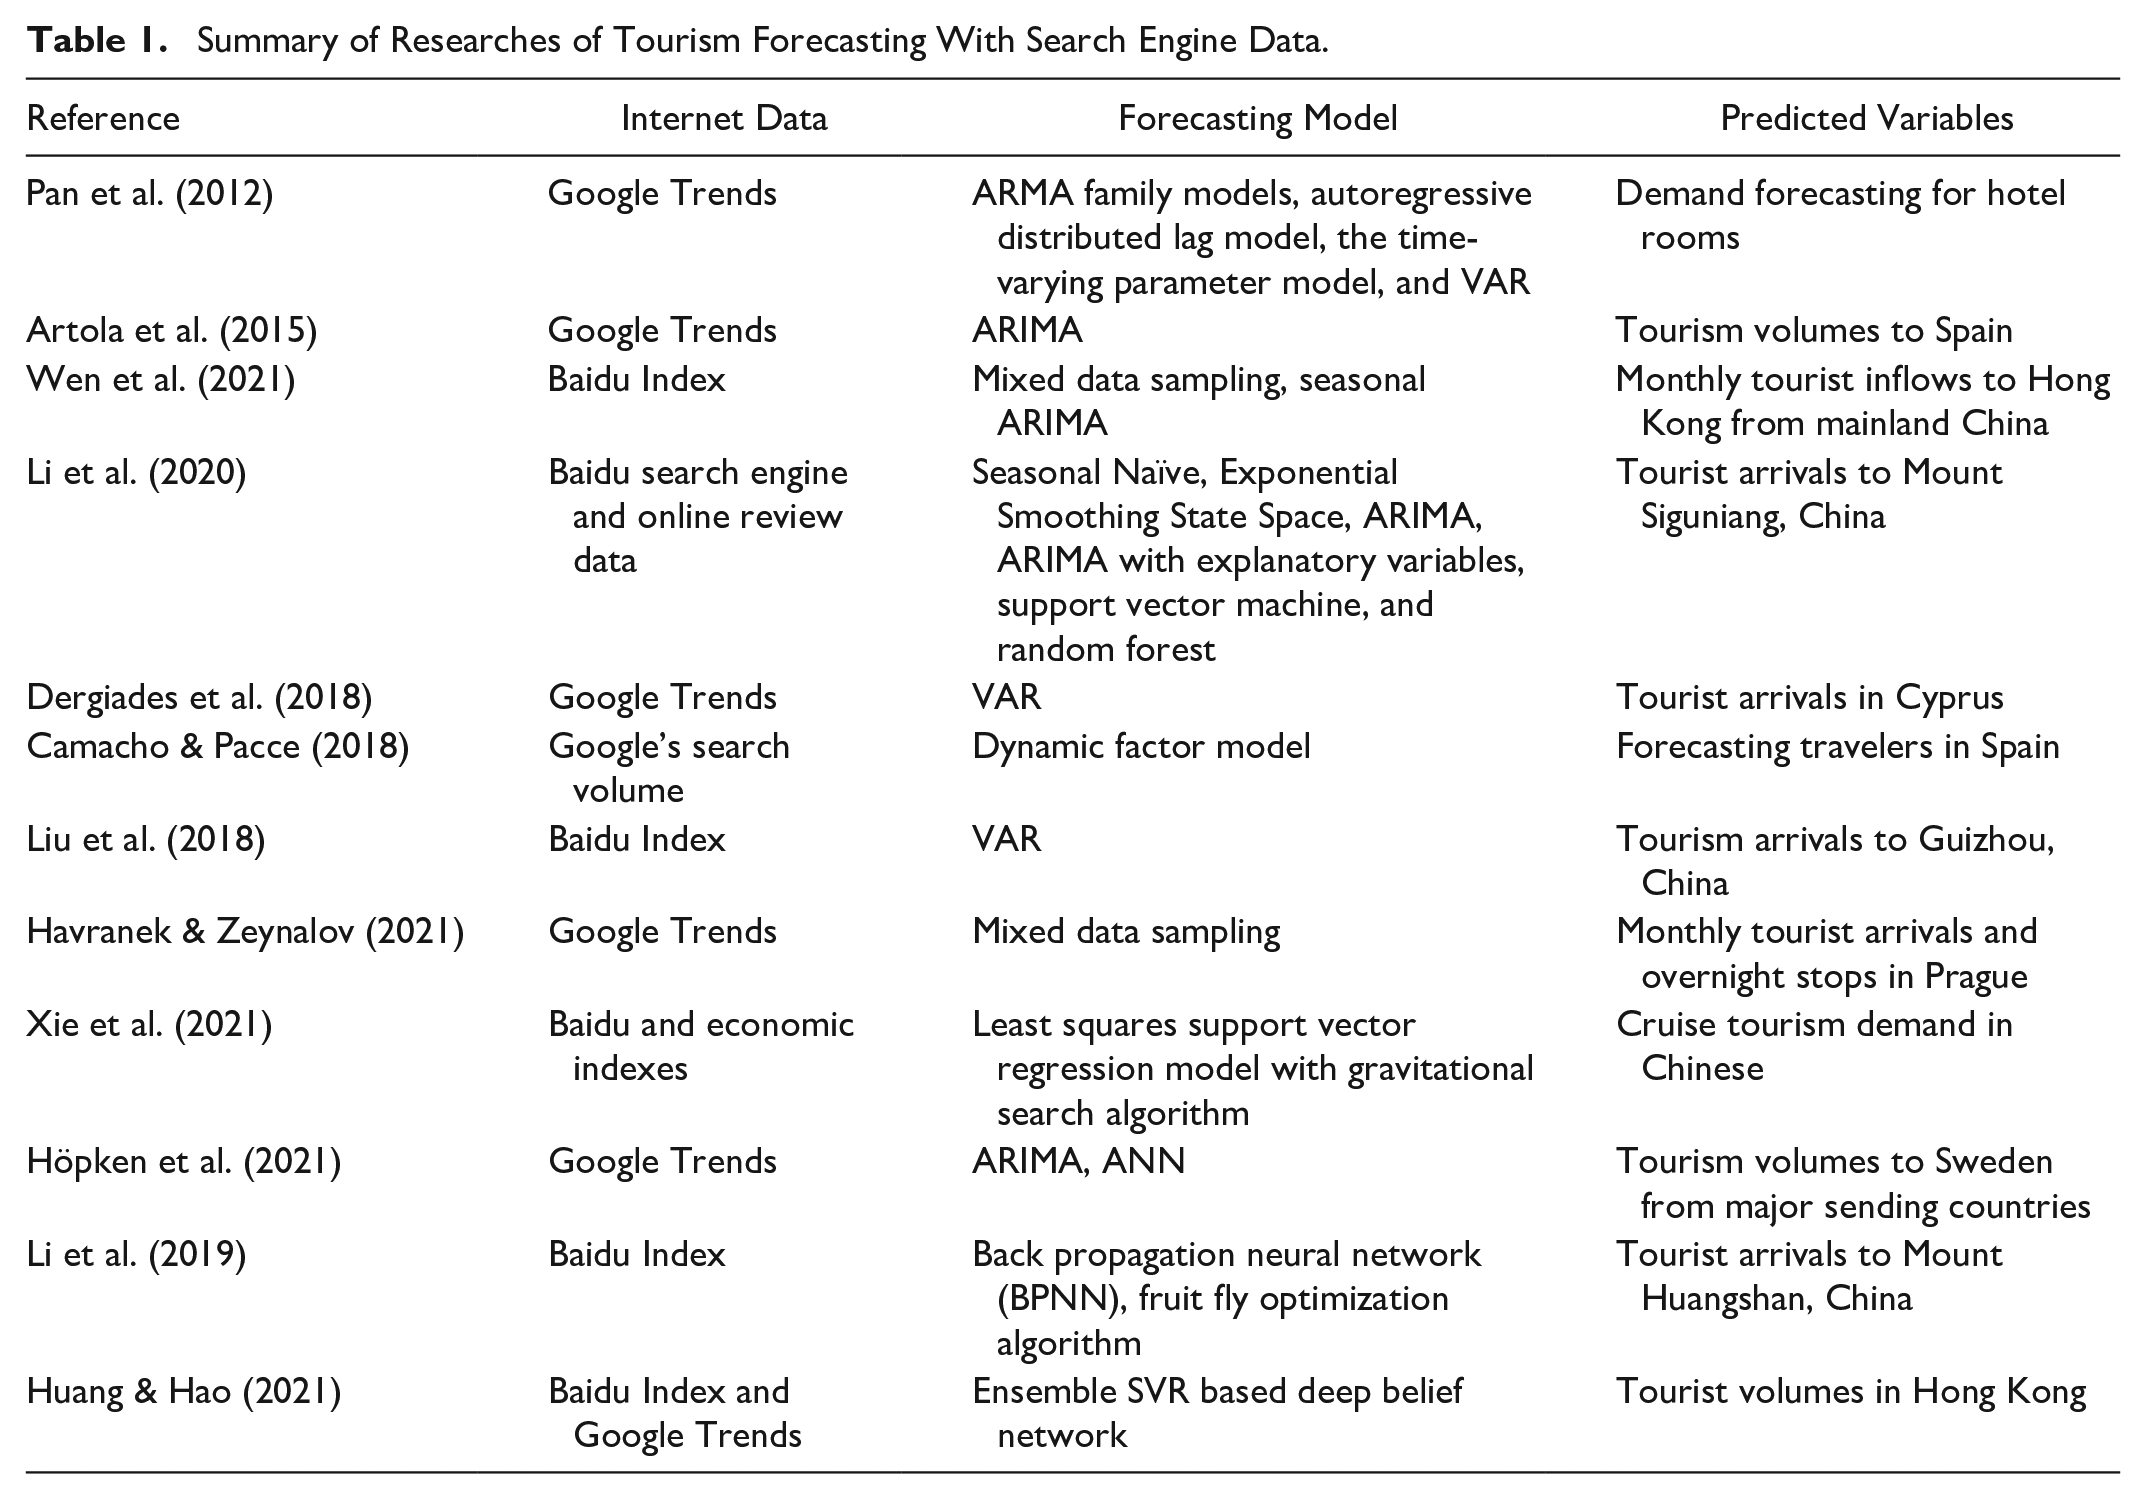
Pan and colleagues (2012) first applied Google search data and autoregressive moving average (ARMA) family models to forecast the demand for hotel rooms. Artola and colleagues (2015) employed Google Trends as an additional explanatory variable to predict the monthly tourist volumes of three regions in Germany. Econometric methods with search engine data have also attracted significant attention. For example, Yang and colleagues (2015) built two time series models based on Google Trends and Baidu Index, and found that both provide valid support for tourist arrivals forecasting. Moreover, the Baidu Index is superior to Google Trends in improving the performance of Chinese tourist arrival forecasting. Li and colleagues (2017) proposed a novel tourism demand forecasting framework by combining search engine query data with an econometric method (generalized dynamic factor model). Recently, AI models and search query data have been combined for tourism demand forecasting. Sun and colleagues (2019) considered Google, Baidu indexes, and a kernel-based extreme learning machine to conduct tourist volume forecasting. Hu and Song (2020) used an ANN model to integrate causal variables and search engine data for tourism demand forecasting, and achieved high forecasting accuracy. Some classical tourism demand forecasting methods based on search engine data are listed in Table 1.
Summary of Researches of Tourism Forecasting With Search Engine Data.
Tourism Demand Interval Forecasting
Previous researchers have focused on point forecasting, which only outputs a single value at each predicted time point. Point forecasting is popular because of its straightforward use for decision-makers. However, it poorly depicts structural instability and assumes that the samples are sufficiently large for model estimation. When structural instability occurs, or only a small number of samples are available, the forecasting results may be inaccurate (Song & Lin, 2010). Thus, interval forecasting is necessary to provide more comprehensive information for tourism planning and formulation.
Kim and colleagues (2011) built forecasting intervals based on several forecasting methods for tourism volume in Hong Kong and Australia. Athanasopoulos and colleagues (2011) tested three automated forecasting algorithms based on monthly, quarterly, and yearly data in terms of interval coverage. Song and Lin (2010) estimated interval demand elasticities to forecast the intervals of inbound and outbound tourism in Asia, which decreased the risk of forecasting failure caused by external shocks. Huang and Lin (2011) used the gray envelope prediction method to forecast international tourist arrivals in Taiwan. By constructing upper, lower, and central envelope lines, the interval forecasting results can serve as a valid reference for decision-makers. Song and colleagues (2019) used multiple time series methods to conduct density forecasts based on scoring rules. Li and colleagues (2019) applied a combination strategy to tourism interval forecasting and found that combination can significantly enhance interval forecasting performance. Xie and colleagues (2020) proposed a decomposition-ensemble approach to conduct tourism point and interval prediction. Overall, the number of existing studies on tourism demand interval forecasting is relatively small and should receive more attentions.
Tourism Demand Forecasting Amid COVID-19
The tourism industry is highly sensitive and vulnerable to a viral outbreak such as COVID-19 (Page et al., 2012). Since the outbreak of COVID-19, a number of studies have been devoted to exploring the impact of the pandemic on tourism demand. However, few studies were aimed at scrutinizing the tourism demand forecasting amid COVID-19. Polyzos and colleagues (2021) employed long short-term memory (LSTM) to predict the impact of COVID-19 on tourist arrivals from China to the United States and Australia. According to the simulation results, it will take 6 months to a year for tourist arrivals to return to normal levels for Australia and the United States, respectively. Yang and colleagues (2022) used the lasso model to predict daily tourism demand and evaluated the role of online search queries on the improvement of forecasting performance. Jaipuria and colleagues (2021) tended to forecast foreign tourists’ arrival in India and the foreign exchange earnings based on ANN. The simulation results generated valuable theoretical and managerial implications for policymakers. Fotiadis and colleagues (2021) adopted LSTM and the generalized additive method to forecast 12-month international tourism arrivals under different scenarios. They asserted that the pandemic could cause huge economic losses and regress tourism growth by 15 years.
An organized tourism forecasting competition was performed to explore advanced forecasting technologies and to provide more information for managers and marketing organizers about the impact of the pandemic on the tourism industry. There were two stages, including ex post forecasting of tourism demand before COVID-19 and ex ante forecasting of tourism demand during and after COVID-19. The main research results are as follows. Qiu and colleagues (2021) assembled ex-post tourism demand forecasting using stacking models and set three scenarios to conduct ex-ante forecasting. Results suggested a recovery of tourism arrivals of 10% to 70% compared to 2019 under different scenarios. Liu and colleagues (2021) developed a scenario-based judgmental forecast technology based on a novel index and found that the extent of recovery depended on the destination’s dependence on long-haul markets. Kourentzes and colleagues (2021) combined multiple forecasting methods to accomplish the tourism forecasting task in the first stage and conducted judgmental adjustment of model-based forecasting in the second stage. Experiments indicated that the average recovery relative to 2019 tourist arrivals is 58%, 34%, and 80% under medium, severe, and optimistic scenario, respectively. To date, however, no studies have considered tourism demand interval forecasting amid COVID-19, which inspires our study.
Methodology
ESN
The ESN is a popular tool for time series forecasting (Hu et al., 2021), which introduces reservoirs (a series of recurrent neurons) to replace the hidden layers in traditional RNN. The basic structure of an ESN has three parts, K input nodes in the input layer, M internal nodes in the reservoir layer, and L output nodes in the output layer.
The detailed steps include the following stages: First, the input and output sequences (
The expressions of the input, reservoir state, and output vectors are as follows:

where t is the time step. For the (t + 1)-th time step, the reservoir state


where

where
Subsequently,
MMOGTO
Gorilla Troops Optimization (GTO)
The GTO technique, recently proposed by Abdollahzadeh and colleagues (2021), was inspired by the collective behavior of gorillas. Gorillas are highly social animals that often live and migrate in groups. Within the group, the silverback gorilla holds the leadership position, while the other males, females, and offspring are subordinates. The positions of the gorillas are considered as the candidate solutions of the search space. The three types of candidate solutions are the position of the existing individual
We first initialize N random individuals
Exploration phase
In this phase, the migration behavior of gorillas is simulated. First, a parameter

where

where
At the end of the exploration phase, the costs of the
Exploitation phase
Two mechanisms are used in the exploitation phase: following the silverback and competing for adult females. The mechanism is selected by comparing the C value with a preset parameter

where
When

The values of parameters A and B in Equation 8 can be calculated by Equation 9.

where A denotes the impact force,
At the end of the exploitation phase, the costs of the
Modified Strategy: Population Initialization Based on a Sobol Sequence
It must be noted that the initial positions of gorillas largely affect the convergence rate and accuracy of the GTO. A uniform solution distribution can improve the optimization performance. To this end, a Sobol sequence is introduced to the initial positions of the gorillas (Sobol 1967). The Sobol sequence is a random sequence that uses a radical inversion with a base of two in each dimension of the population. The radical inversion in each dimension has different matrices to produce nonredundant and uniform points. The Sobol sequence makes the distribution of initial solutions more uniform and covers a wider search space to enhance the performance of the GTO.
Multi-Objective Optimization Scheme
The principle of the multi-objective optimization strategy is as follows. The Pareto optimal solution is introduced into the multi-objective optimization scenario to replace the exact solution involved in the single-objective optimization issue. The Pareto optimal solution
The Framework of the Interval Prediction System
Two datasets on the daily tourist volumes at two well-known tourist attractions in China and the United States were collected. Each dataset had 470 data points

The Framework of the Proposed Forecasting System.
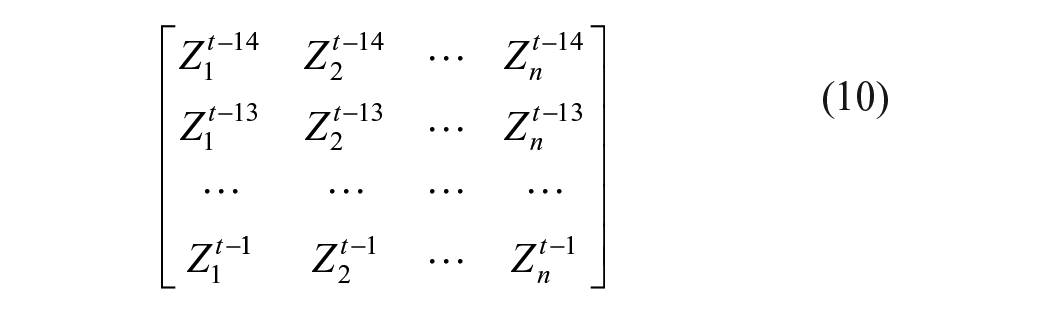
Step 1: The main objective of this stage is to use the proposed MMOGTO-ESN model to select appropriate input features and construct initial prediction intervals by using training and validation set data. The initial input matrix of MMOGTO is given in Equation 10, which is then converted into the input matrix in Equation 11. The output of MMOGTO is the selected input variables and the hyperparameters for ESN. Based on this, the ESN is then trained based on the training set with the input and output sets of Equations14 and 15. The trained ESN is then employed to calculate the interval forecasting results in the validation set
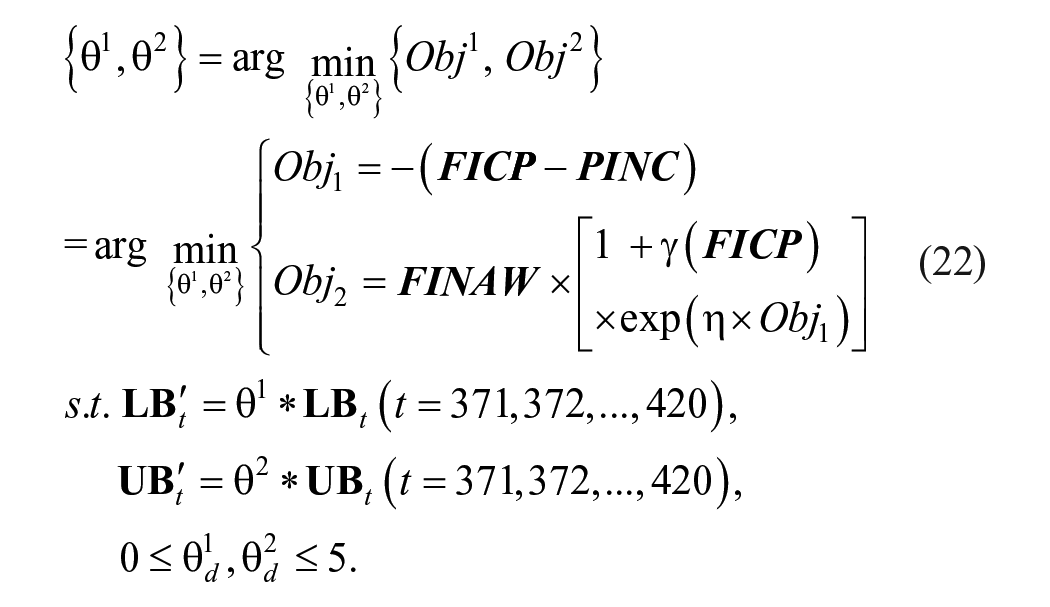
Step 2: The main objective of this stage is to adjust the forecasting interval based on the reduction coefficient optimized by the MMOGTO. The fitness function of the MMOGTO is designed as shown in Equation 21, which is calculated based on the interval forecasting results and the real tourism volumes in the validation set. After obtaining the optimal reduction coefficient, we can further calculate the final forecasting interval and the performance evaluation indicators.
Stage I: LUBE interval forecasting based on MMOGTO-ESN with feature selection
In previous studies, feature selection and forecasting were often conducted separately. In this study, a hybrid prediction model is proposed to reduce the computation time. The training set
The training set and validation set were first input into the MMOGTO. In the iteration process, the current optimal solution of MMOGTO is taken as the basis of feature selection and the optimized hyperparameters of the ESN. The variable dimension of the optimal solution in the iteration process is designed as the sum of the number of input features (p) and the number of hyperparameters of the ESN. The first p input feature values are regarded as the continuous variables,
The initial input matrix of all feature variables in the t-th period is given as
where
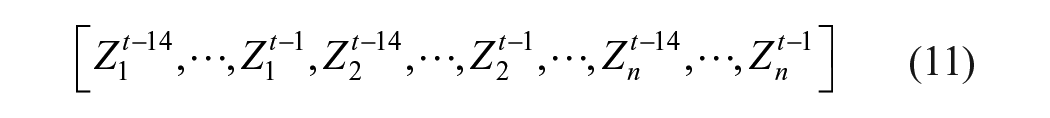
It must be noted that a rolling prediction scheme was adopted, and the detailed data structure and input characteristic are presented in Figure S1 of the supplementary file (see the online supplementary material). In each loop, the first 14 periods in each feature are taken as input, that is, all input features in the first 14 days are taken as input to predict the tourism volume on the next day, and this is determined based on the results of trial and error. For example, when we predict the tourism volumes in the 15-th period, the input is set to

If

where h represents the number of the selected feature variables. The last three values of the current optimal solution are assigned to the three hyperparameters of the ESN. The ESN is trained based on the training set

The corresponding output set of the ESN is:

where
The trained ESN is then used to predict the validation data, whose input set is:

The interval forecasting results of validation set are
Based on
where
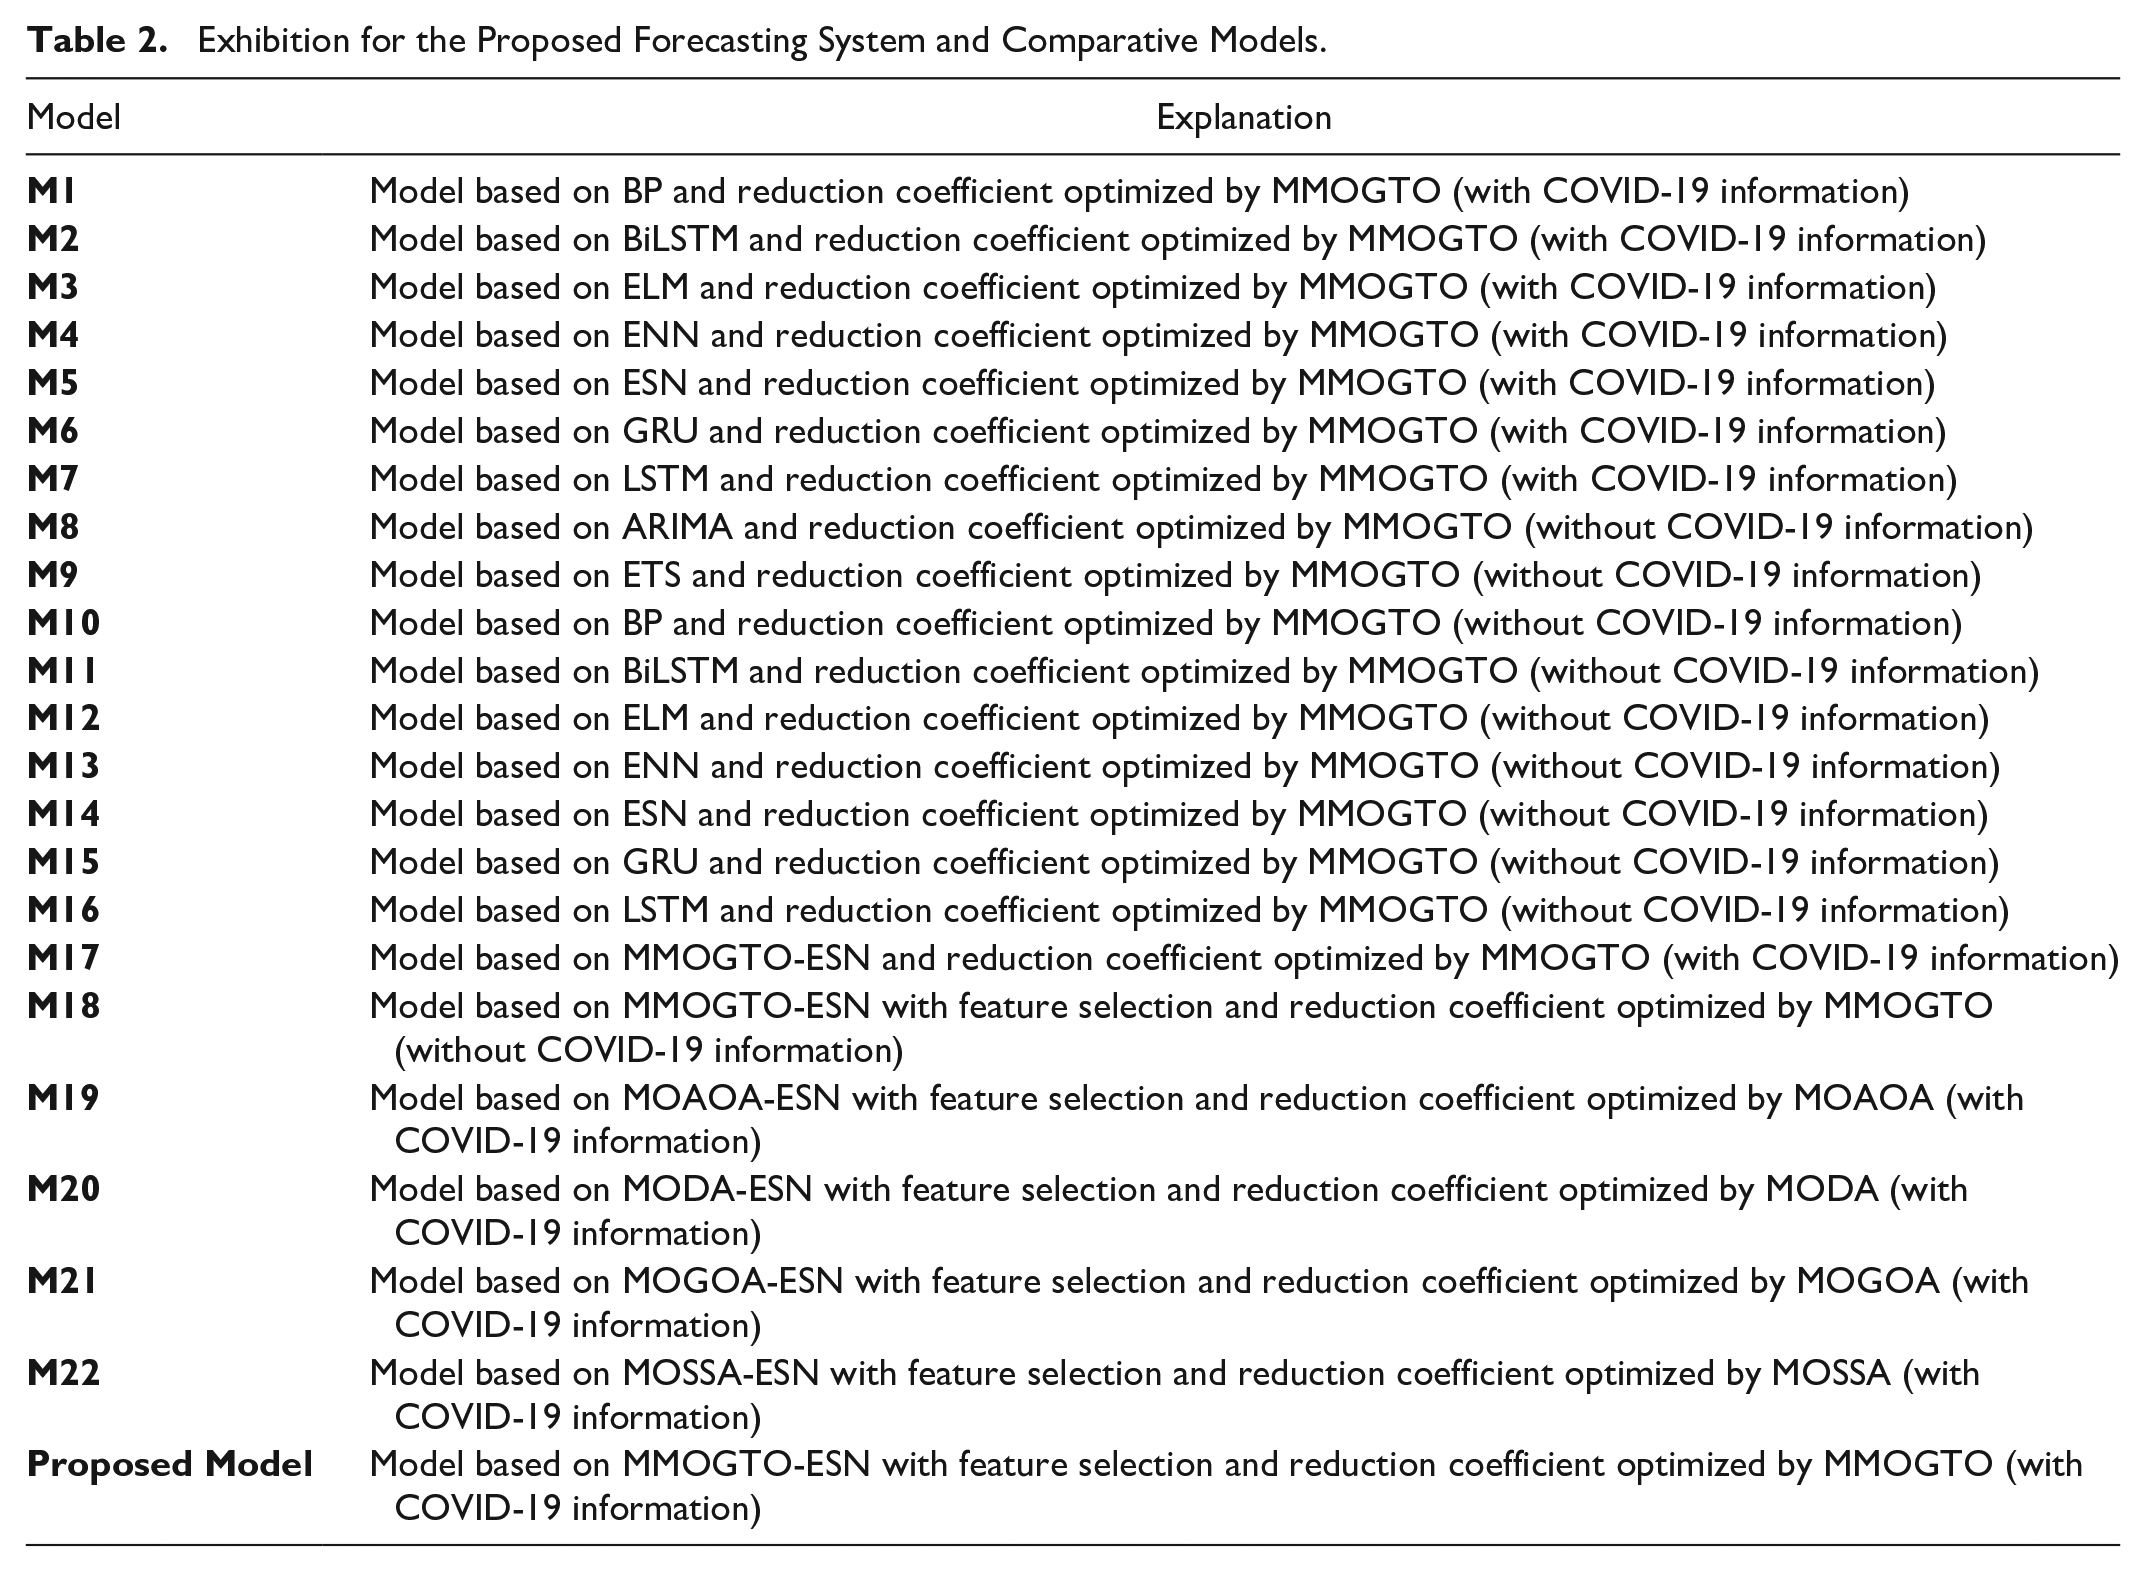
Exhibition for the Proposed Forecasting System and Comparative Models.

With the continuous iterative optimization of the MMOGTO, the optimal solutions are obtained, that is, the optimal input matrix of the feature variables and the optimal hyperparameters of the ESN. Then, the ESN is retrained based on the training set
Stage II: Forecasting interval adjustment based on MMOGTO
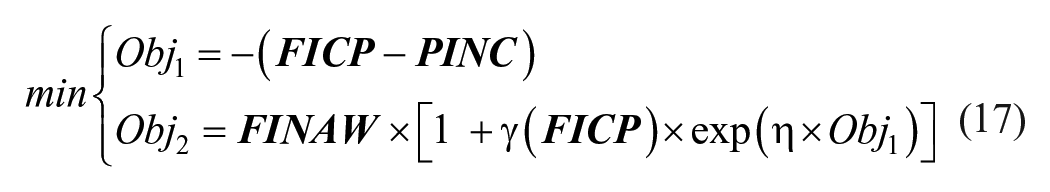
The interval width and coverage rate are two crucial factors in evaluating the interval forecasting performance. A narrow interval width implies a higher interval forecasting accuracy. A high coverage rate indicates improved interval forecasting stability. However, the interval width and coverage rate are contradictory that should be balanced in practical applications. To this end, a reduction coefficient optimized by the MMOGTO is proposed to balance the forecasting accuracy and stability.
The lower and upper bounds of the forecasting interval in the validation and test sets can be calculated by


where
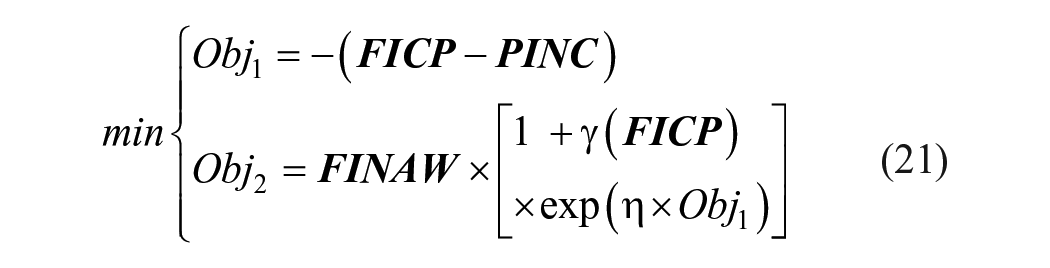
The
It must be noted that the calculation of the fitness function is based on the interval forecasting results
Based on the optimized reduction coefficient, we can obtain the final interval forecasting results
Empirical Study
Data Selection and Experiment Setup
Daily tourism volume data and search engine data on Jiuzhaigou, China, and Hawaii, the United States, were used to test the effectiveness of the proposed system. The daily tourism volume data covered the period from April 1, 2020 to July 14, 2021, with 470 observations. All observations were divided into a training set, validation set, and test set containing 370, 50, and 50 observations, respectively. The long holidays in China were from May 1 to 5 and October 1 to 7 in 2020 and 2021. During the long holidays, tourist arrivals in Jiuzhaigou, China reached its upper limit. Considering that the outliers caused by a surge in tourists during the long holidays would disrupt the trend and continuity of the time series, a five-period moving average was used to replace the original tourism volume data of Jiuzhaigou, China (Li & Cao, 2018). According to the actual condition of China, tourist arrivals on long holidays is always up to the limit; thus, practitioners and managers in tourist destinations should be fully prepared to deal with the overflow of tourists during the long holidays. In contrast, the obvious changes in tourism volume data during holidays were not considered for Hawaii because of cultural and customary differences. Thus, the original tourism volume data of Hawaii were retained. For the missing data of Jiuzhaigou and Hawaii, we adopted a five-period moving average to fill in the gap.
Data from two search engines, that is, Google Trends and Baidu indexes, were also used as input features to improve tourism demand forecasting ability. Considering the applicability of search engines in different markets, Google Trends data was used for tourism demand forecasting in Hawaii, while Baidu Index data was used for that in Jiuzhaigou. Following the keyword classification strategy of Li and colleagues (2020) and keyword inclusion in Google Trends and the Baidu indexes, we divided the candidate search keywords into seven major categories: day type, weather, transportation, lodging, dining, tours, and coronavirus information. The search keywords are listed in Table S1 (see the online supplementary file). The daily Google Trends were downloaded from the website https://trends.google.com/, while the Baidu indexes were collected from the website http://index.baidu.com/ by using python crawler tools. It must be noted that day type is a qualitative factor. Weekends were defined as 1 and weekdays as 0. All experiments were performed in MATLAB 2021a on Windows 10 with Intel(R) Core (TM) i5-8250U CPU @ 1.60GHz 1.80 GHz.
Performance Evaluation Criteria
Four widely used interval forecasting evaluation criteria: FICP, FINAW (Jiang, Liu, et al., 2020), ACE (Nie et al., 2021), and CWC were adopted to evaluate the interval prediction ability. The mathematical expressions for these criteria are listed in Table S2 (see the online supplementary material).
Exhibition for Benchmark Models
To evaluate the forecasting performance of the proposed approach, 22 comparative methods were constructed and compared with the proposed system in subsequent experiments. The models are described in Table 2. M1 to M9 are classical individual benchmark models such as ANNs (BPNN, extreme learning machine [ELM], Elman neural network [ENN], and ESN), deep learning models (i.e., bi-directional long short-term memory [BiLSTM], gated recurrent unit [GRU], and LSTM), ARIMA, and exponential smoothing (ETS). M10 to M16 represent individual ANNs and deep learning models (BPNN, ELM, ENN, ESN, BiLSTM, GRU, and LSTM) without COVID-19 information. It must be noted that ARIMA and ETS are univariate prediction models; thus, no COVID-19 information is involved in these two models. By comparing the results with the single benchmark models in Experiment I, we can illustrate the effectiveness of the ESN. M17 is a hybrid MMOGTO-ESN that does not consider a feature selection strategy. M18 is a hybrid model that does not consider COVID-19 information. By comparing M17 and M18 with the proposed forecasting system, we can emphasize the importance of adding feature selection and coronavirus information. M19 to M22 are hybrid forecasting models based on diverse multi-objective optimization algorithms, including the multi-objective Archimedes optimization algorithm (MOAOA; Zhang, Wang, Niu, et al., 2021), multi-objective dragonfly algorithm (MODA; Mirjalili, 2016), multi-objective grasshopper optimization algorithm (MOGOA; Mirjalili et al., 2018), and multi-objective salp swarm algorithm (MOSSA; Mirjalili et al., 2017). The comparison between M19 to M22 and the proposed forecasting system verified the optimization performance of different optimization technologies.
Experiment I: Comparison Between Individual Forecasting Models
To select the most effective predictor for daily tourism demand forecasting, nine commonly used forecasting technologies: ELM, ESN, BP, ENN, BiLSTM, GRU, LSTM, ARIMA, and ETS were employed and compared. To verify the effectiveness of adding COVID-19 information, both ANNs and deep learning models with and without COVID-19 information were used to estimate the forecasting interval. The parameter settings of the predictors used in this experiment are listed in Table S3 (see the online supplementary material) which are designed for default values or based on previous studies (Wang & Gao, 2022; Zhang, Wang, Niu, et al., 2021). To minimize the influence of parameter variations on the prediction performance, the common parameters of different predictors were set to be the same. Four classical evaluation indexes (FICP, FINAW, ACE, and CWC) were adopted to verify the interval prediction capacity of the forecasting models. A lower FINAW indicates a higher interval forecasting accuracy, while a larger FICP indicates improved interval forecasting stability. ACE estimates whether the constructed forecasting interval can cover the preset PINC. When
Interval Forecasting Results of Benchmark Models in Two Datasets.

The interval forecasting results for the two datasets are given in Table 3. The explanations for each forecasting model are presented in Table 2. From Table 3, we can find that the ACE values of all the predictors are positive. For example, in Dataset A, when
First, adding COVID-19 information is conducive to improving forecasting performance. By comparing individual ANNs and deep learning models with and without COVID-19 information, we can find that the forecasting ability of the M1 to M7 is significantly superior to the M10 to M16, indicating the effectiveness of involving COVID-19 information. For example, when
Compared with other predictors, the FINAW and CWC values of M5 (ESN) were always the best except for
Conclusion
Based on the FICP, FINAW, ACE, and CWC indicators, we compared the interval forecasting performance of nine commonly used models. The simulation results verify the high-quality forecasting ability of the ESN and the effectiveness of the reduction coefficients optimized by the MMOGTO.
Experiment II: Comparison Between the Proposed System and Other Hybrid Forecasting Models
To further investigate the forecasting performance of the proposed forecasting system, six hybrid forecasting models (M17 to M22) were built; their descriptions are provided in Table 2. M17 is a hybrid MMOGTO-ESN model without a feature selection scheme. M18 is a hybrid model that does not consider COVID-19 information. M19 to M22 are four hybrid methods based on various multi-objective optimization technologies (MOAOA, MODA, MOGOA, and MOSSA). The number of iterations (
(1) Why is feature selection necessary?
(2) Will adding COVID-19 information impact forecasting results?
(3) Is the MMOGTO necessary to optimize hyperpara-meters and reduction coefficients?
The comparison results are shown in Table 4. From this table, we can see that the ACE values of all forecasting technologies satisfied
Interval Forecasting Results of the Proposed Forecasting System and Other Comparative Hybrid Models in Two Datasets.
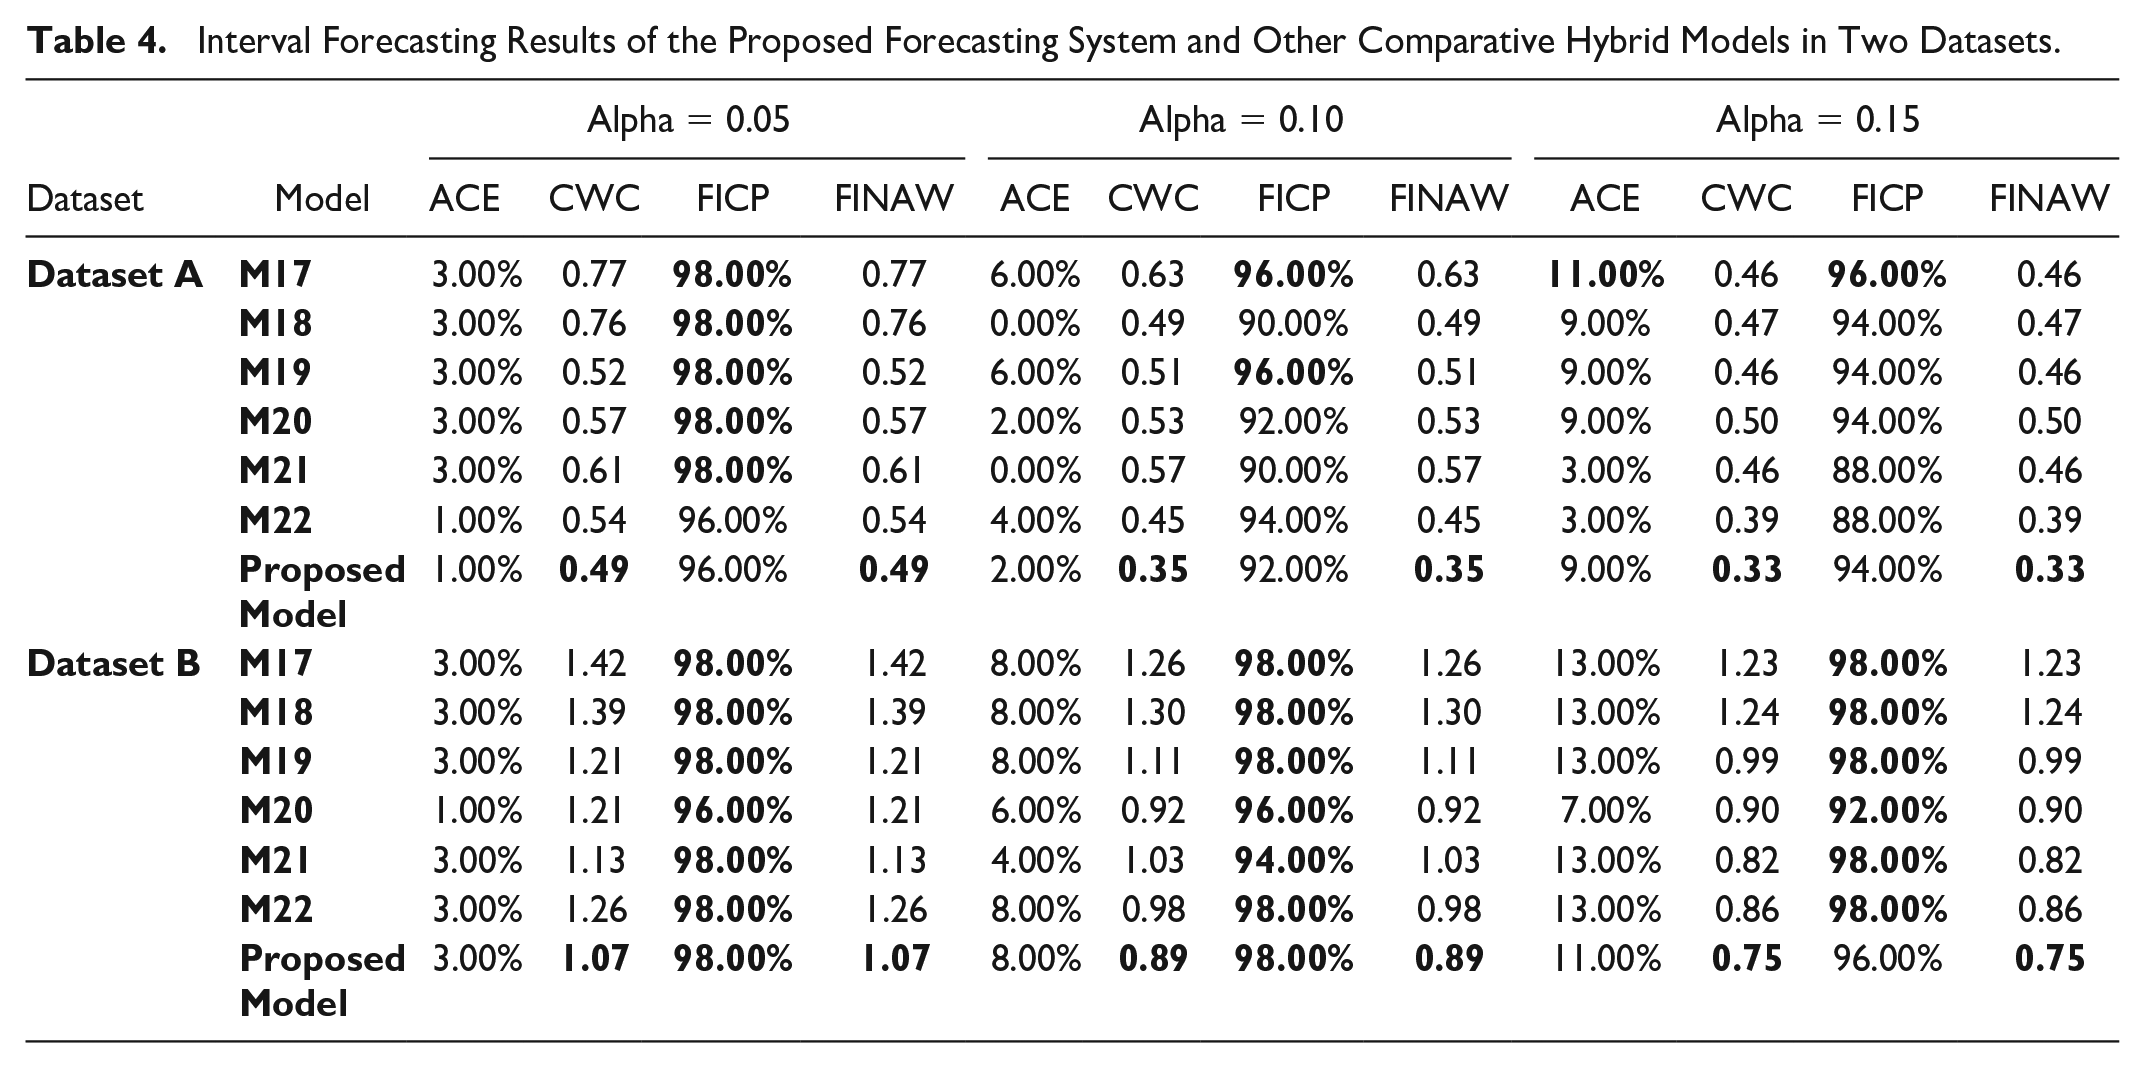
We also conducted a comparison between M19 to M22 and the proposed forecasting system. The forecasting results of the proposed forecasting system showed significant improvement over those of the hybrid models M19 to M22 with different multi-objective optimization algorithms. The proposed forecasting system yielded the lowest FINAW and CWC values among all the comparative models. For instance, in Dataset B, the proposed model yields the best FINAW and CWC value with
Conclusion
By comparing six hybrid models with the proposed forecasting system, we proved that the feature selection, the addition of COVID-19 information, and the proposed MMOGTO algorithm can significantly improve the interval forecasting performance.
Conclusion and Discussion
Conclusion
Accurate and stable tourism demand prediction is crucial for multiple parties in the tourism industry. However, because of the impact of exogenous factors, such as COVID-19, tourism demand data is nonlinear and uncertain. To effectively improve tourism demand forecasting accuracy and stability, a hybrid interval forecasting system based on MMOGTO, ESN, and feature selection technology was proposed for daily tourism demand forecasting. Two empirical studies were conducted based on datasets obtained from China and the United States. The main conclusion can be summarized as follows.
(1) Adding COVID-19 information and feature selection improved interval forecasting performance, since forecasting models with COVID-19 information and feature selection achieved higher CWC and FINAW values. (2) A reduction coefficient successfully managed the contradiction between the interval width and coverage. After the adjustment, the ACE values of all the forecasting models were greater than 0, indicating that these can effectively capture future changes in the tourism demand series and build reasonable forecasting intervals. (3) Compared with other optimization algorithms, including MOAOA (Zhang, Wang, Niu, et al., 2021), MODA (Mirjalili, 2016), MOGOA (Mirjalili et al., 2018), and MOSSA (Mirjalili et al., 2017), the proposed forecasting system with MMOGTO provided a higher interval forecasting accuracy, verifying the effectiveness of the proposed MMOGTO. (4) The results showed that the proposed forecasting system provided accurate and stable forecasting intervals. At all significance levels, the ACE values of the proposed model were greater than 0, and the CWC and FINAW values were significantly lower than all comparative models. Thus, the proposed hybrid interval forecasting system contributed to the management efforts of practitioners in the tourism industry.
Theoretical Implications
This study provided a new perspective for tourism demand interval forecasting and extended the related literatures. The proposed model provided a new method for tourism interval prediction against the background of the COVID-19 pandemic. COVID-19 information along with other related search engine data were taken as candidate input variables and adaptively selected by feature selection to assist in depicting tourism volume trends , which provided more useful reference information for decision-makers to conduct tourism demand interval forecasting and improve forecasting reliability. The optimized interval reduction coefficient was proposed to predict the upper and lower bounds of the forecasting intervals, which was not used in previous studies. Empirical results demonstrated that the constructed forecasting interval by all predictors can cover the preset PINC; thus, the constructed forecasting interval was effective, verifying the superiority of the optimized interval reduction coefficient. This prompted practitioners and managers to pay more attention to the coordination between the coverage rate and the width in tourism demand interval forecasting, so as to construct a more effective forecasting interval and improve the accuracy and stability of tourism demand interval forecasting.
Practical Implications
During the COVID-19 pandemic, the volatile market environment has aggravated the difficulty of tourism demand point forecasting, since it always provides an expected average outcome. Interval forecasting can provide an expected range of future outcomes, therefore contributing to contingency planning (Wu et al., 2021). Reliable interval forecasting results during the COVID-19 pandemic provide crucial guidance for balancing the recovery of the tourism industry and the control of the epidemic spread (Li et al., 2022). Specifically, when the predicted tourism volume is low, stakeholders can optimize pricing strategies dynamically or enact attractive travel packages to draw more tourists. When the predicted tourism volume is high, practitioners can make plans in advance and take relevant measures, such as arranging for temporary employees, and ensuring a supply of tourism products and anti-epidemic related articles. Managers can formulate crisis plans to prevent the spread of the epidemic due to the detention or gathering of tourists. Moreover, traffic authorities can issue announcements to make reasonable travel arrangements to avoid congestion.
The current challenges facing the tourism industry urge managers to provide more comfortable travel experiences, more personalized services, more reasonable prices, and better sanitation initiatives (Abbas et al., 2021). For example, practitioners can provide airport shuttle services for tourists, improve the service quality of hotels and restaurants, and provide discount coupons for tourists (Liu et al., 2022). To control the risk of COVID-19 spreading, restaurant operators should provide staggered dining during expected peaks in travel demand, and beaches can be divided into separate areas to reduce crowding. In addition, providing free protective masks, gloves, and disinfectant can further increase tourist satisfaction during the pandemic.
Limitations and Future Research
Despite the superior performance of the proposed forecasting system, there are still some limitations. Considering data integrity and stability, the tourism demand time series data beyond the pandemic has not been used, which can be further investigated in future work. Multiple-step ahead forecasting and longer forecasting horizons should be considered. Apart from search engine data, other types of data sources, including web-based text and social media data, should also be considered. More policy factors regarding COVID-19 in tourist destinations need to be considered. Furthermore, the applicability of the proposed model to the highly uncommon circumstances and fluctuating COVID-19 situation needs to be further explored in future work.
Supplemental Material
sj-docx-1-jht-10.1177_10963480221142873 – Supplemental material for Tourism Demand Interval Forecasting Amid COVID-19: A Hybrid Model With a Modified Multi-Objective Optimization Algorithm
Supplemental material, sj-docx-1-jht-10.1177_10963480221142873 for Tourism Demand Interval Forecasting Amid COVID-19: A Hybrid Model With a Modified Multi-Objective Optimization Algorithm by Jianzhou Wang, Lifang Zhang, Zhenkun Liu and Xiaojia Huang in Journal of Hospitality & Tourism Research
Footnotes
Declaration of Conflicting Interests
The authors declared no potential conflicts of interest with respect to the research, authorship, and/or publication of this article.
Funding
The authors disclosed receipt of the following financial support for the research, authorship, and/or publication of this article: This work was supported by the Major Program of National Social Science Foundation of China under Grant [number 17ZDA093].
Supplemental Material
Supplemental material for this article is available online.
Author Biographies
References
Supplementary Material
Please find the following supplemental material available below.
For Open Access articles published under a Creative Commons License, all supplemental material carries the same license as the article it is associated with.
For non-Open Access articles published, all supplemental material carries a non-exclusive license, and permission requests for re-use of supplemental material or any part of supplemental material shall be sent directly to the copyright owner as specified in the copyright notice associated with the article.