
Abstract
Although food trucks have attracted significant attention among the dining public, little is known in the academic literature about what drives consumer satisfaction with them. Employing a grounded theory methodology, we analyzed a large set of Yelp reviews to determine whether the antecedents of satisfaction with food trucks differ from those associated with quick-service restaurants. We found that for most attributes, positive experiences at food trucks have smaller upward effects on satisfaction than they do for quick service restaurants, whereas negative experiences have larger downward effects. We further found that comments about anticipation appear far more frequently in food truck reviews, suggesting that the downward effect of negative experiences may be attributable to expectations. This has implications for theory in that it suggests some modifications to conventional instruments for measuring satisfaction. It also has implications for management practice, in that it suggests best practices with regard to managing expectations of food trucks.
Highlights
Food trucks are a fast-growing segment of the foodservice industry, but their satisfaction dynamics have remained underexplored.
We conducted a qualitative content analysis of online food truck reviews to understand how restaurant attributes contribute to customer satisfaction, using quick-service restaurants as a contrast.
We found that negative experiences of Service Quality, Price & Value, and Product Quality are the strongest impactors of food truck satisfaction. In contrast, positive experiences of Service Quality, Atmosphere, and Product Quality are the strongest impactors of quick-service restaurant satisfaction.
We discovered a novel attribute, Anticipation, that appeared significantly more often in food truck reviews.
Introduction
Food trucks have become one of the best-performing segments of the foodservice industry (Alfiero et al., 2017; Yoon & Chung, 2018). The remarkable annual revenue growth of 6.8% between 2014 and 2019 (IBISWorld, 2021) has been attributed to several factors: the increasing popularity of outdoor events (Kowalczyk & Kubal-Czerwińska, 2020), the low cost of entry (McLaughlin, 2017), the usage of social media (Alfiero et al., 2017; McNeil & Young, 2019), and changing customer tastes, led by the millennial interest in varied, exotic experiences (Yoon & Chung, 2018). Food trucks have contributed significantly to the economic welfare of communities (Anenberg & Kung, 2015) and have created an entirely new entrepreneurial class (Matzembacher et al., 2019).
Despite food trucks’ growing popularity, there has been little research into the attributes and antecedents of customer satisfaction toward them (Shin et al., 2020). While there has been much inquiry into the antecedents of customer satisfaction in general (Gerson, 1993; Parasuraman et al., 1985; Rust & Zahorik, 1993), and restaurants in particular (Andaleeb & Conway, 2006; Jain & Gupta, 2004; Ryu & Han, 2010; Stevens et al., 1995), the question of customer satisfaction with food trucks has remained largely unexplored. Specifically, little is known about how food trucks’ distinctive experiential attributes interact with the traditional drivers of satisfaction among diners. Existing research on food trucks has been primarily directed at economic issues (Anenberg & Kung, 2015; Matzembacher et al., 2019) and regulation (Hanser, 2021), rather than satisfaction.
This study aims to close this gap by examining the precise relationship between food service attributes and customer satisfaction with food trucks. We examine whether attributes commonly used to assess restaurant performance—Product Quality, Service Quality, Price & Value, Menu Diversity, and Atmosphere—contribute similarly to satisfaction for food trucks. Establishing the precise nature of customer satisfaction with food trucks is important for several reasons. First, food trucks are a new phenomenon and their exact niche within the range of food options is not yet well understood. Small businesses have a high failure rate, and knowing whether best practices for restaurants also apply to food trucks will help managers. Second, food trucks are starting to adopt some of the business models of fast food restaurants, such as franchising and national branding. The success of these models will depend on the extent of food trucks’ similarity to Quick-Service Restaurants (QSRs), specifically in terms of how experience-attributes drive satisfaction, which is so far unknown. Third, researchers have been developing frameworks for evaluating food service establishments, but these frameworks may not be applicable to food trucks, and new instruments may need to be devised.
We examined the nature of customer satisfaction with food trucks by leveraging a new instrument for obtaining open-ended customer feedback at scale: online reviews. We started with a set of 8,880 reviews from Yelp of 104 food trucks and 104 randomly-chosen QSRs. Adopting a Grounded Theory Methodology (GTM), and a Qualitative Content Analysis (QCA) approach, we coded the reviews iteratively in three successive coding sessions, refining our protocol with each iteration. Because of the volume of data, we also made use of automated classifiers.
Although our objective was to learn specifically about food truck satisfaction, we also examined QSR reviews for two reasons. First, examining the QSR reviews allowed us to test the validity of our novel text analytic approach. The satisfaction drivers with QSRs have been studied previously using conventional survey methods. If we observed similar results to those in the literature, we could establish that analysis of online reviews can, to some degree, substitute for surveys. Second, the distributions of attributes in the QSR reviews provide a baseline from which we could observe contrasts in the food trucks reviews. Using star rating as a measure of satisfaction, we examined how strongly the various attributes contribute to star rating, and tested whether the two dining modalities differ.
Our findings indicate that satisfaction does indeed differ significantly in food trucks versus QSRs. Customers approach food trucks in a generous frame of mind, and a default star rating is quite high. Whereas positive experiences do little to change overall opinion, negative experiences have a strong deleterious effect. These results have some practical implications. Customers approach food trucks as an anticipated event, and come with expectations that are highly vulnerable to disappointment. While advertising and promotion that stress the uniqueness of the truck will attract new customers, this has no effect on their satisfaction. Only by avoiding disappointment in food, service, or price, can food trucks achieve customer loyalty.
This study also contributes to hospitality research by demonstrating a novel way to incorporate big text data into studies on satisfaction models. Since social media will likely play a growing role in understanding customers, it is important for hospitality researchers to know how to integrate satisfaction frameworks with the voluminous data available on sites like Yelp. We introduce a framework for analyzing online reviews that maps comments into either a traditional restaurant service attribute or one of the experience-related, social media-specific categories of expression we identified through our analysis. This framework should simplify future work and enable further satisfaction studies on a large scale.
Literature Review
Food truck demand has been growing in tandem with the increased popularity of outdoor events (Kowalczyk & Kubal-Czerwińska, 2020), the millennial interest in exotic new experiences (Yoon & Chung, 2018), and the availability of enabling IT (Alfiero et al., 2017). The explosion in social media use has facilitated key operations for food trucks, because it has allowed them to easily advertise their locations to the right audience (Anenberg & Kung, 2015). This allows food trucks to capitalize on their mobility and increase the product variety offered within a city, since they provide what existing restaurants may not.
Food truck research has often focused on regulation (Hanser, 2021) and how truck managers use social media/IT (Alfiero et al., 2017; Anenberg & Kung, 2015). Other research has concentrated on customer intention to visit food trucks (Shin et al., 2020; Suvachart, 2019). For example, customer intention to visit food trucks has been found to be influenced more by hedonic reasons (fun, excitement, emotional worth), which have a direct positive effect on attitude and a direct effect on intention (Shin et al., 2019). Given the propensity for food trucks to face hygiene challenges, such as access to clean water or garbage disposal, customers approach food trucks with a certain wariness of the risks involved. In one study, Yoon and Chung (2018) tested the relative strength of perceived risks (hygienic, environmental) versus benefits (hedonic and convenience) on customer intention to patronize a food truck. Even though risk awareness is present, in accordance with Shin and colleagues (2019), they discovered that the motivation of hedonic benefits was strong while the motivation of convenience was insignificant.
Ideris and colleagues (2017) confirmed that food quality, service quality, time constraints, and price influence a customer’s intention to eat at a food truck. Of all these factors, service quality and price had the strongest influences on intention. Mokhtar and colleagues (2017) discovered that brand awareness, brand image, and perceived quality can also influence intention. Other factors that influence customers’ intentions are convenience and hedonic benefits, which favorably impact a customer’s attitudes (Yoon & Chung, 2018).
Although these studies have revealed much about the intention to visit (pre-consumption), less is known about post-consumption satisfaction. Research on customer satisfaction with food trucks is sparse and sometimes contradictory. McNeil and Young (2019) determined that the largest contributors to satisfaction with food trucks were price, service quality, and brand personality, while, surprisingly, food quality and convenience contributed nothing. However, the data for their study was collected using surveys. Alfiero and colleagues (2017) examined Gourmet Food Trucks (GFTs) versus. Traditional Food Trucks (TFTs; Ideris et al., 2017), and found that GFTs placed increased emphasis on quality rather than convenience.
Research into customer satisfaction has provided a variety of instruments that may be adapted for use with FT. The consensus among satisfaction researchers is that satisfaction can be measured using a set of service attributes, although there is not always agreement about the precise attributes or their relative importance (Krombholz et al., 2012). Several scales for customer satisfaction have been developed over the years, often using questionnaires or open-ended interviews (Keller & Kostromitina, 2020). Parasuraman and colleagues (1985) introduced SERVQUAL, which focused on reliability, tangibles, responsiveness, assurance, and empathy. While some research has shown that SERVQUAL can be used with restaurants (Bojanic & Drew Rosen, 1994; Lee & Hing, 1995), some researchers have questioned the applicability of its five-dimension structure (Jain & Gupta, 2004).
To construct a scale more relevant to restaurants, Cronin and Taylor (1992) proposed SERVPERF, which was similar to SERVQUAL except that it dropped expectations and measured only performance. A scale even more specific to restaurants appeared in DINESERV (Stevens et al., 1995), which contained items about reliability (service), responsiveness (quick response, helpfulness), assurance (makes you feel comfortable), and empathy (anticipates your needs, understands your situation). Following a Service-Dominant Logic approach to identify the drivers of restaurant satisfaction, Walter and colleagues (2010) created an eight-dimensional breakdown: social interaction, core product (food quality), physical environment, restaurant “facts” such as location, price, atmosphere, guest (memory), and the occasion. In the Methods section below, we discuss how we synthesized and borrowed from these scales to form the basis of our initial coding.
Methods
Because Yelp reviews are direct expressions of consumer opinions of dining, they provide an opportunity to study how consumers think about their experiences. By contrast, surveys may constrain feedback into particular categories and encourage respondents to distort their recollections and prioritize what may not have been genuinely salient. The unprecedented quantity of available text presents an opportunity to engage with raw data and develop theory from the ground up. We therefore adopted a Grounded Theory Methodology (GTM; Charmaz & Thornberg, 2020; Glaser & Strauss, 1967; Sato, 2019), using Qualitative Content Analysis (QCA; Drisko & Maschi, 2016; Hsieh & Shannon, 2005; Lai & To, 2015) as our core approach. Our aim was to discover whether consumers think substantially differently about food trucks than other comparable restaurant formats. Hence, we first had to determine how customers conceptualize their dining experiences (Strauss & Corbin, 1998). We then had to test whether those conceptualizations are unique toward food trucks. Grounded Theory allowed us to delve into how customers think about their experiences, and build theory up from textual data sources. Ordinarily, such an approach is useful when little is known about the phenomenon under investigation. This study allows us to enrich the current understanding of customer experience in restaurants by applying GTM and QCA to a new data set in both a well-understood restaurant format and a new one.
Methodology and Starting Theory
A grounded theory (GT) approach begins with the analysis of raw text sources—interview transcripts or documents—to see how people understand their experience through language. Researchers “ground” insights in the textual data and maintain an openness to what emerges, unencumbered by preconceived theories (Glaser & Strauss, 1967). GTM places preeminence on learning from the data, accepting the possibility that the data may not accord with existing theory, and leaving open the possibility that new concepts will emerge. Through flexibility and iteration, researchers allow concepts to materialize inductively from the text that can be validated via deductive methods in future work (Glaser et al., 2013).
We followed these principles in our examination of the Yelp reviews, as subsequent sections show:
Understanding unfamiliar phenomena requires an inductive approach (Glaser & Strauss, 1968). We conducted a pilot study employing QCA to determine the attributes that showed up in the reviews, using existing attributes as a rough guide.
The researcher should approach the data iteratively, developing codes and refining them (Chun Tie et al., 2019). After the pilot study, we had two additional rounds of coding: one that employed a revised coding protocol, and one that pursued new codes that were uncategorizable in the revised protocol.
The researcher should use quantitative resources that will help maintain precision and consistency (Nelson, 2020). We employed automated machine learning classifiers to classify sentences in the reviews as belonging to an attribute-sentiment combination. Precise measures reduce bias.
Maintain an openness to serendipity (Bryant, 2021). Through three rounds of coding, we revised our protocol so that we were gradually able to categorize over 95% of sentences into some attribute category.
The goal is to produce an explanatory theory, although a conceptual model could suffice (Timonen et al., 2018). Comparing how the attribute prevalence affected star rating differently for FTs than for QSRs yielded theoretical insights about negative experiences and anticipation.
Our study began with an investigation of the constructs currently understood as restaurant attributes. Table S1 in the Supplemental File (see the online supplementary material) summarizes key service attributes discussed in the literature review. While DINESERV has the advantage of having been designed expressly for restaurants, it is highly granular, and some distinctions are not useful for our purposes. McNeil and Young (2019) introduced a promising framework geared toward food trucks, but it included “brand personality,” which was specifically associated with gourmet food trucks (GFTs). Since our data set included all food trucks, brand personality would not have been an attribute for the majority of the trucks in our data set. Some attributes suggested in previous literature were not included, either for theoretical or practical purposes. For example, convenience was dropped because it has been shown repeatedly to be unrelated to satisfaction (Ideris et al., 2017; McNeil & Young, 2019). Additionally, the availability of a non-smoking area is no longer relevant.
A Yelp-specific framework used by Zhang and colleagues (2018) proposed that each Yelp review could be broken down into statements about one of eight different restaurant service factors: Product Quality, Service Quality, Menu Diversity, Price &Value, Atmosphere, Healthy, Location, and Visibility. This appeared to be a reasonable set of attributes for our preliminary coding. Through our coding iterations, we included a category “None” to leave open the possibility of new unforeseen categories.
Dataset
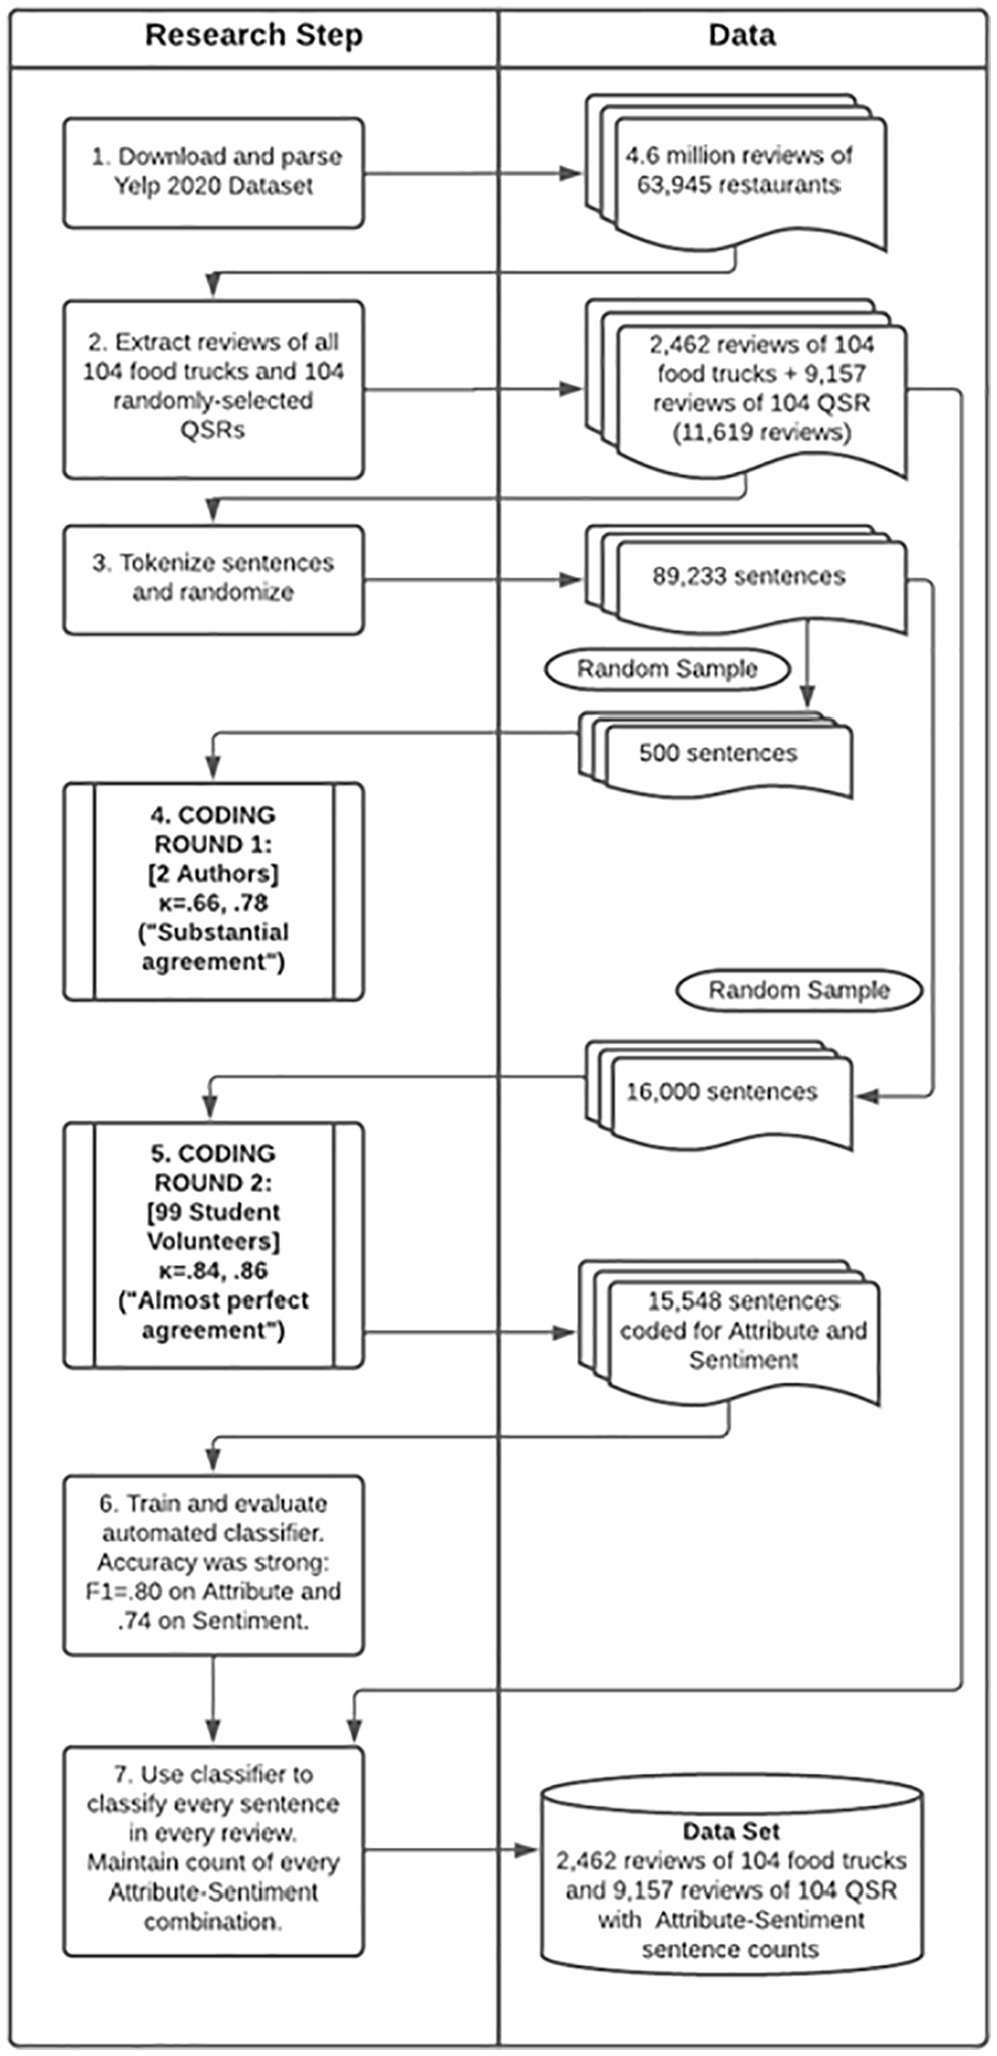
Figure 1 shows the process we used to obtain the Yelp dataset for our analysis.
Data Collection and Coding Procedure
Yelp (www.yelp.com) is an online platform that allows users to post reviews of businesses and rate them on a scale of one to five. As of 2020, Yelp has hosted approximately 90 million restaurant reviews and has had 178 million unique visitors per month (Marinova, 2020). While some scholars have expressed doubts about whether online reviews truly reflect customer opinion (Hu et al., 2006), there are two reasons why Yelp is rapidly becoming a valid and reliable measure of customer perception. First, more people are now writing reviews, suggesting that reviewer sampling bias is not as much of a concern. Second, Yelp has implemented a number of restrictions to prevent fake or unhelpful reviews from appearing to the public (Yelp, 2010). Restaurant reviews from Yelp have served as the basis for a variety of empirical research projects (Hlee et al., 2016; Keller & Kostromitina, 2020; Luo et al., 2020; Wang et al., 2019; Yu et al., 2018). Yelp reviews have been shown to be a reliable predictor of a restaurant’s success (Lu et al., 2018; Thazhackal & Devi, 2018) and a good source of practical managerial advice (Keller & Kostromitina, 2020). We therefore view the Yelp dataset as a valid and reliable reflection of customer opinions about restaurants.
Because of the volume of the Yelp data, we used human coders to create training data for our automatic machine learning classifiers. We downloaded the “academic dataset” from Yelp (https://www.kaggle.com/yelp-dataset/yelp-dataset) on March 18, 2021, and filtered out all businesses that did not have “Restaurants” in the “categories” field. There were 63,945 restaurants with a total of 4.6 million reviews (Step 1). There were 2,462 reviews of 104 food trucks in 58 cities across 11 states. The reviews for 104 randomly-chosen QSRs were selected for contrast (6,418 reviews), for a total of 8,880 reviews with 65,652 individual sentences with at least three words (Step 2).
Initial Coding
Reviews from the original set were automatically split into sentences using Python NLTK (Step 3) and 500 were randomly selected for preliminary coding. The two lead researchers coded each sentence for attribute and sentiment (Step 4), following the protocol in Listing S.1 (see the online supplemental material). In all rounds of coding, the researchers employed the custom-built PamTag text coding tool pictured in Figure S.1.
In the first round of coding, each researcher coded a random 200 of the random 500 sentences, with an overlap of 69 sentences. For attribute, the researchers agreed 45/69 times (66%, Cohen’s kappa = .602), representing “substantial” interrater agreement (Landis & Koch, 1977) between coders. On sentiment, they agreed 59/69 times (86%, Cohen’s kappa = .783), again “substantial” agreement (Landis & Koch, 1977). The researchers reviewed the coding to discover the source of any disagreements and revised the protocol accordingly. We clarified that Menu Diversity differed from Product Quality in that any mentions of food without evaluation belonged to Menu Diversity (for example, “They serve the tacos with either fish or beef”). We also decided that references to food greasiness belonged in Healthy rather than Product Quality.
For the second round of coding, we trained a class of 97 undergraduate students and drew a random sample of 16,000 sentences from the original dataset. The two lead authors each completed 350 tags of this dataset to use as a gold standard to identify any inattentive or careless coders. We collected a total of 33,990 judgments on 15,548 sentences from 99 coders—counting the two researchers—averaging 343 codes each (Step 5). We discarded all data from the coders whose agreement with the gold standard on either attribute or sentiment fell below 50%. There were seven coders whose tags were dropped, which left 92 coders and 31,880 tags. There were 10,060 sentences coded by at least two coders (mean = 2.6, mode = 2, max = 8). For attribute, interrater reliability was strong, achieving a Cohen’s kappa of .84 representing “almost perfect” agreement (Landis & Koch, 1977. Interrater agreement was also strong for sentiment, with a kappa of .86, again representing “almost perfect” agreement (Landis & Koch, 1977). To build the training set, attribute and sentiment were assigned to sentences on the basis of majority rule. In the event of a tie, the researchers adjudicated. The distribution of attribute and sentiment in the final training set is summarized in Table S.2 (see the online Supplemental File), and examples of sentences from each category appear in Table S.3.
Automated Classification: Attribute
Once we had a reliably coded training set, our next task was to build a supervised machine learning classifier to automatically classify the sentences from the full data set (62,651 sentences from 8,880 reviews; Step 6). We built separate classifiers for attribute and sentiment. Our classifiers were built using the Python Natural Language Toolkit (www.nltk.org). We pre-processed the text by removing stop words and lemmatizing verbs. We experimented with a variety of features and classifier algorithms to see which combination achieved the best classification performance on unseen holdout data. For features, we tried counts and TF-IDFs of n-grams of length 1, 2, and 3. Because each classification problem presents its own unique challenges, it is difficult to know ex-ante which classification method will work best for a particular problem domain. A standard practice, therefore, is to try several off-the-shelf classifiers and adopt whichever one performs best on held-out evaluation data. For example, the Python Scikit Learn module (https://scikit-learn.org/) provides a collection of classifiers that can be used with minimal customization. In our experiments, we compared the performance of Multinomial Logistic Regression, Stochastic Gradient Descent, Naïve Bayes, and Decision Tree.
Three attributes proved to be difficult to automatically differentiate because of their overlap with similar categories. Upon inspection, statements about Location tended to deal with the same concerns as those about Atmosphere: crowds, noise, lines, music, and seating arrangements. Likewise, the few statements about Visibility were similar to those in Atmosphere. We therefore merged Location and Visibility into Atmosphere, resulting in a dramatic improvement in both the precision and recall of Atmosphere. This was confirmation that we were correct in thinking that the sentences were semantically similar. There were few sentences in the Healthy category, which tended to include some kind of positive or negative evaluation of the food itself. We merged those sentences into Product Quality, and once again saw an improvement in our classification accuracy. We therefore proceeded with a six-attribute classification. We evaluated each classifier feature set/algorithm combination by using 100 different random 80–20 train-test splits, generating 95% confidence intervals for precision, recall, and F1 for each attribute. The best overall performance proved to be on the TF-IDF features for one and two word phrases and the support vector machine (SVM) algorithm. The performance of our attribute classifier is reported in Table S.4 (see the online supplemental material). The classifier correctly identified the attribute 80% of the time on average, compared to a baseline of 17% under random guessing, and we regard this to be sufficient for our purposes. We emphasize that our contribution is not the introduction of novel features or ML models: we simply used the classifier to categorize text data that was too voluminous to process manually, in the tradition of Computer-Aided Textual Analysis (CATA; Kabanoff, 1997; Mayring, 2004; Neuendorf, 2016; Pollach, 2012; Short et al., 2010). For comparison purposes, the ROC curves (Bradley, 1997; Hanley & McNeil, 1982) for each attribute classifier appear in Figure S.2 (see the online supplemental material).
Automated Classification: Sentiment
To build our sentiment classifier, we followed the same procedures as above, generating training-holdout test sets, preprocessing text, and experimenting with features and algorithms. The general-purpose sentiment classifier proved to have a poor performance in the context of restaurant reviews, because many of the words and phrases indicative of sentiment in restaurant reviews did not appear in generic lexicons, such as “crispy,” “ice cold,” “delicious,” or “fatty.” As with attribute, we compared the performance of classifiers available in Scikit Learn. The best classifier achieved an F1 of .73 for positive and neutral, and an F1 of .77 for negative. See Table S.5 and Figure S.3 (in the online supplemental material) for a detailed comparison of classifier performance.
Scoring of Reviews
Once we had sufficient trained classifiers, we created a data set consisting of 2,462 reviews from the 104 food trucks in the data set and 6,418 reviews from 104 randomly-selected QSRs. The QSRs were identified by filtering on “Fast Food” in the Yelp Categories field and randomly selecting 104 QSR establishments. For each of the 8,880 reviews, we used the automatic classifier to determine the attribute and sentiment of each sentence, and incremented a count for that attribute-sentiment combination (Step 7). To clarify the structure of our dataset, two sample rows appear in Table S.6. For complete summary statistics of all variables, see Tables S.10 through S.12 in the online supplemental material.
Because the number of sentences in the reviews varied substantially, ranging from 1 to 88 (mean 7, median 6; see Figure S.4), we converted the raw counts into percentages and performed the regressions on those. The percentages of each category broken down by FT versus QSR appears in Figure S.5. The most remarkable contrast was in the number Product Quality mentions: 19% of all sentences for FTs, and only 11% for QSRs. Another stark difference was in negative mentions of Service Quality, which accounted for nearly 12% of all sentences about QSRs, but only 3% about food trucks. There is an interesting pattern in the None category where the prevalence of positive mentions is higher for food trucks, but the prevalence of negative mentions is higher for QSRs. In another round of coding, described below, we attempted to discover what concepts were in the None category.
While the extent to which customers comment on these attributes is some indication of their salience in the customers’ minds, our focal question was how these attributes contribute to overall customer satisfaction, embodied in the overall star rating. We therefore conducted a series of regression analyses where the dependent variable (outcome variable) was star rating and the independent variables were these attribute mentions.
Results
Variable Correlations
To determine whether attributes contribute differently to overall customer satisfaction with QSRs versus FTs, we regressed the Yelp star rating on the percentages of positive and negative sentences for each attribute, using both OLS and Quantile regression. We left out neutral sentences, as it was too difficult to provide an interpretation.
While there is a theoretical potential for positive and negative percentages to be inversely correlated, in fact these pairs of variables have very low correlations (see Tables S.7 and S.8 in the online supplemental material). This is due to the fact that the presence of a positive sentence does not strongly predict the absence of a negative one, because a review may contain any combination of positive, negative, and neutral sentences. Models all converged and all Variance Inflations Factors (VIFs) were less than 2, indicating no problems with linear dependence. We therefore included positive and negative percentages in the same model. For results of regressions using separate models for positive and negative sentences, please see Table S.13 in the online Supplemental File. Findings are similar to those discussed below.
Spearman rank-order correlation coefficient matrices for our independent and dependent variables appear in Table S.7 (FTs) and Table S.8 (QSRs). The first column shows the correlation between star rating and the percentage of attribute–sentiment combination. As we would expect, positive sentences have a positive relationship with star rating and negative sentences have a negative relationship. The faintly-shaded cells along the diagonal show the correlation between pairs of positive and negative sentences for each attribute. Significant correlations are indicated with an asterisk.
Regression Estimates
We estimated models using IBM SPSS (Version 27). Because customer satisfaction could be influenced by unobserved characteristics of the establishment itself, including cuisine type, size, and age, we added a business ID fixed effect to control for unobserved heterogeneity between businesses. Table 1 reports the OLS estimates with robust standard errors.
OLS Regression Results, Predicting Star Rating From Positive and Negative Percentages of Sentences in Yelp Reviews in Food Trucks and Quick-Service Restaurants
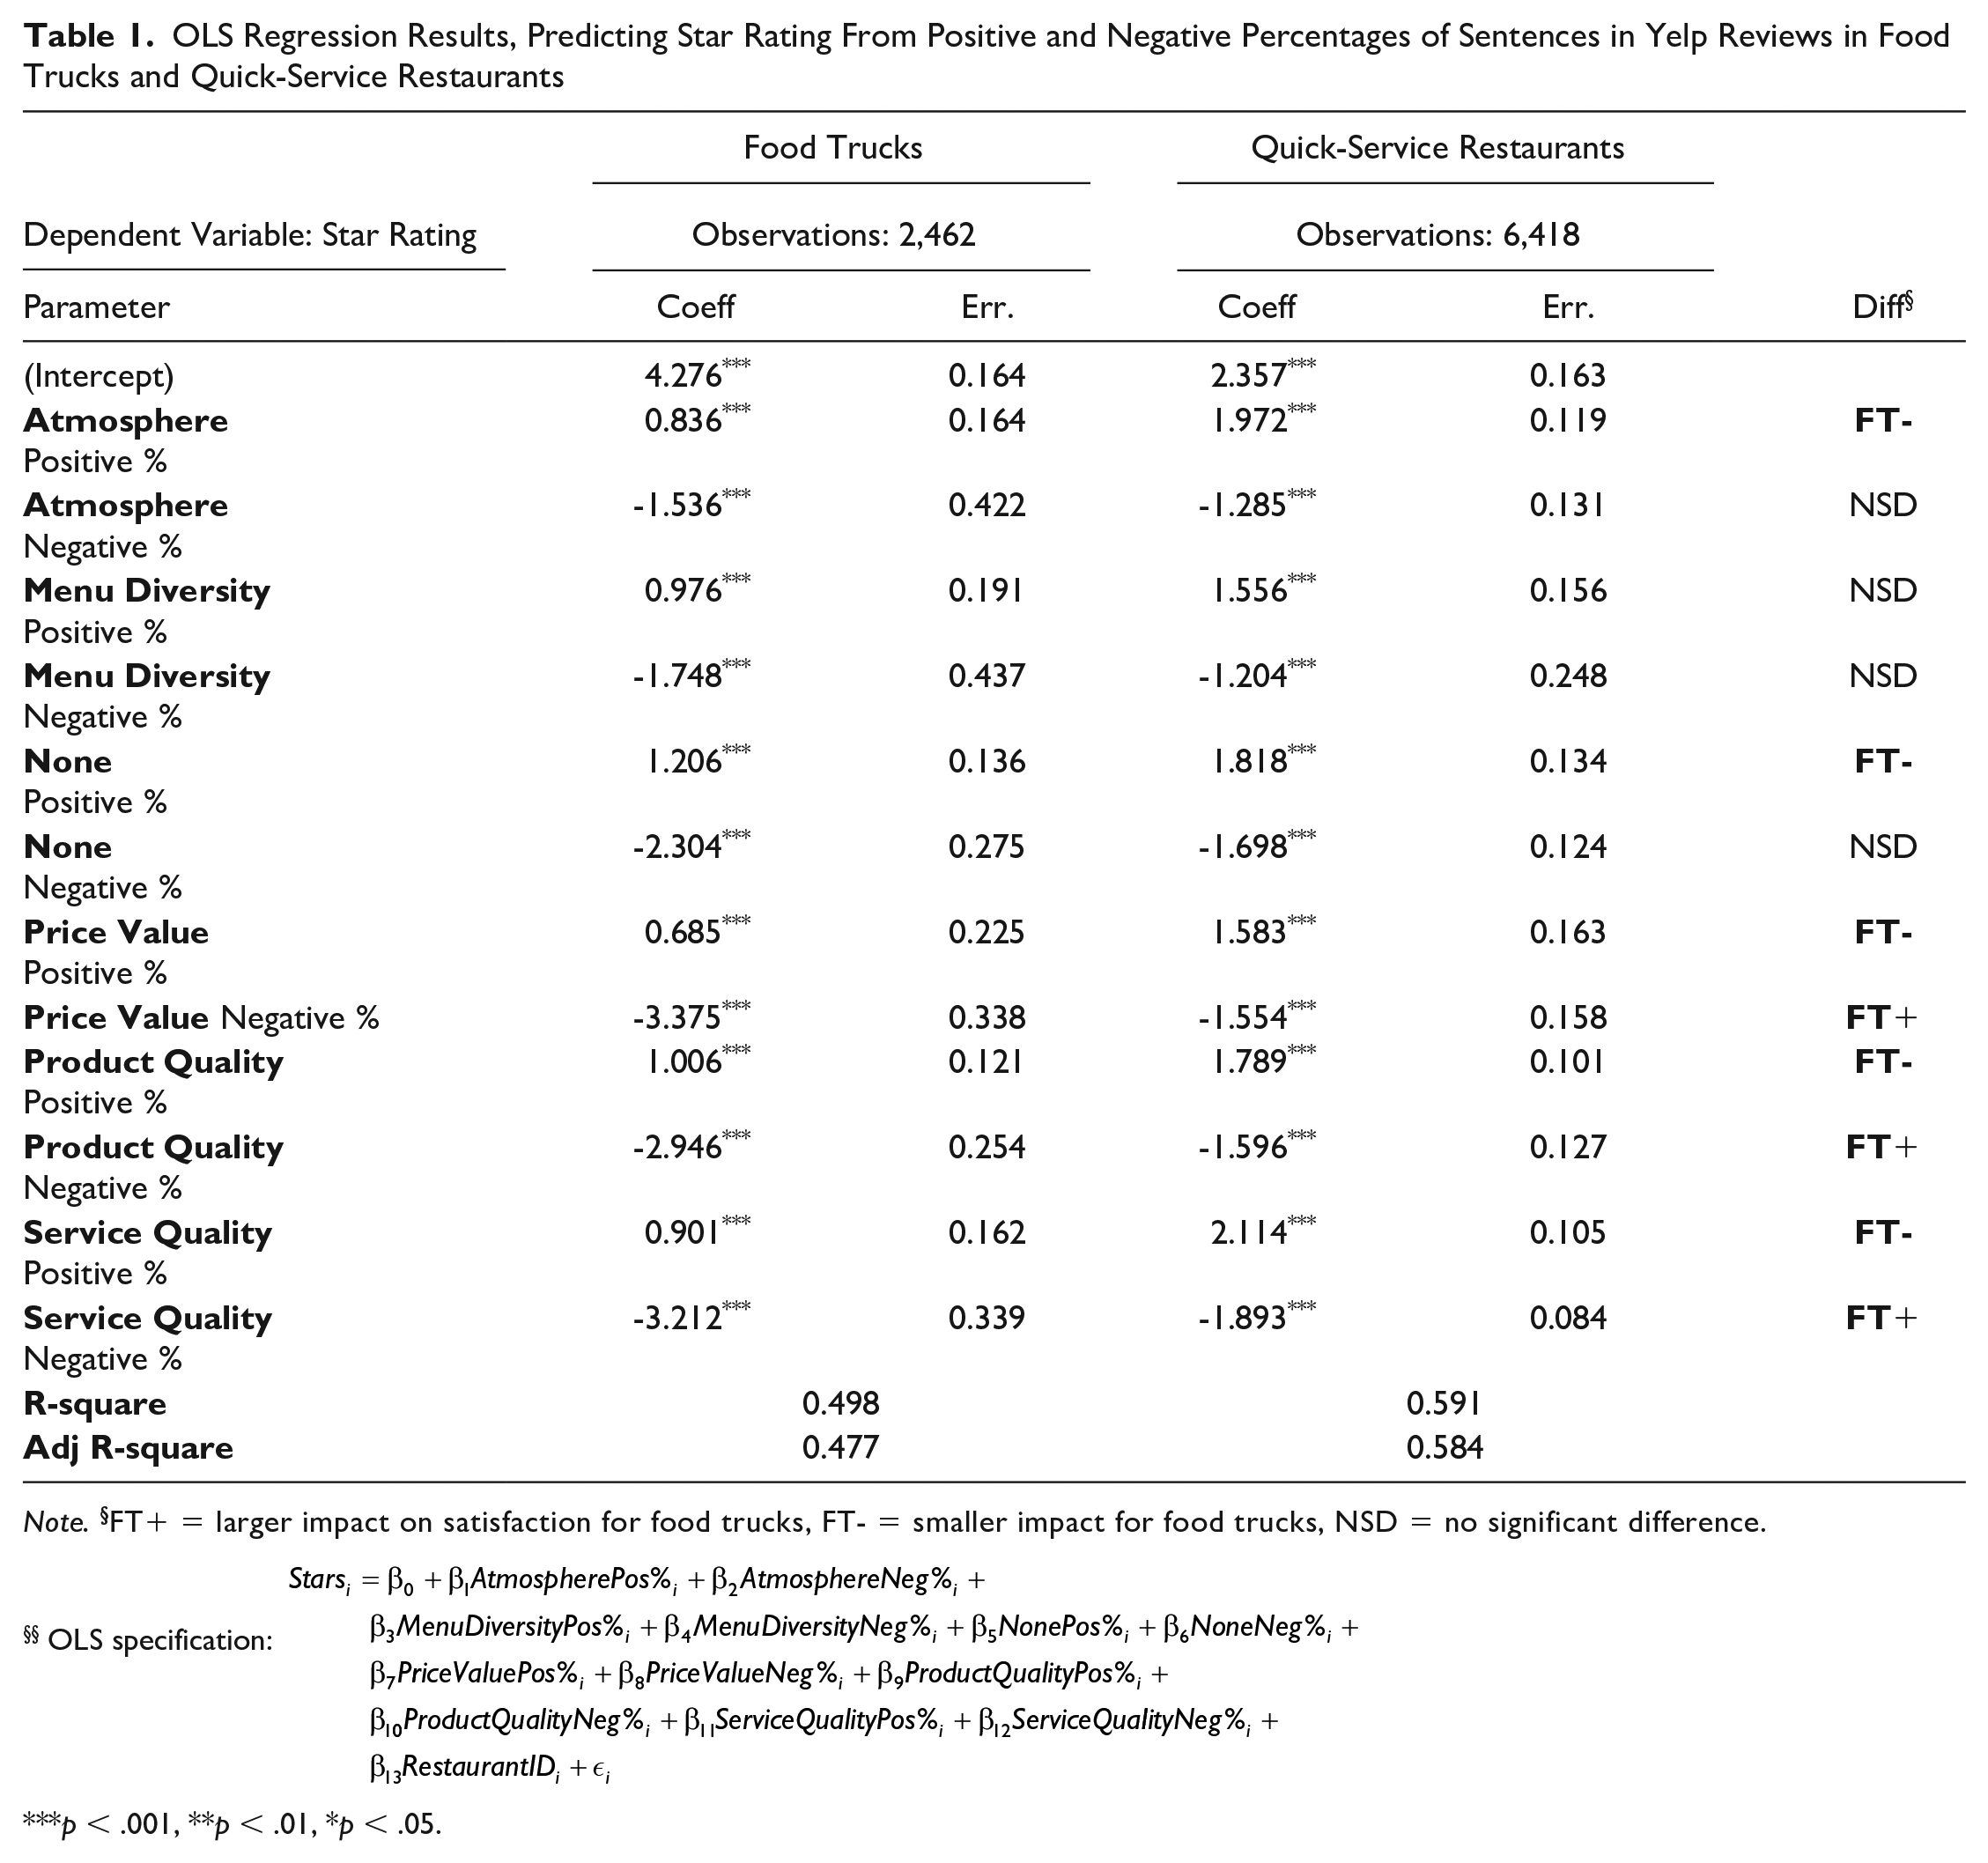
Note. §FT+ = larger impact on satisfaction for food trucks, FT- = smaller impact for food trucks, NSD = no significant difference.
§§ OLS specification:
p < .001, **p < .01, *p < .05.
Star distributions are typically bowed down in the middle (2 and 3 stars) and higher on the extremes due to experience biases (Hu et al., 2006). We therefore also conducted quantile regression at two different quantiles of the dependent variable, the 25th percentile and the 50th percentile. Quantile regression allows us to measure the effect of independent variables at different levels of the dependent variables (Koenker & Bassett, 1978). The median estimates are reported in Table 2.
Quantile Regression Results, Predicting Star Rating at the 25 Percentile (Q = .25) and the Median (Q =.5) §
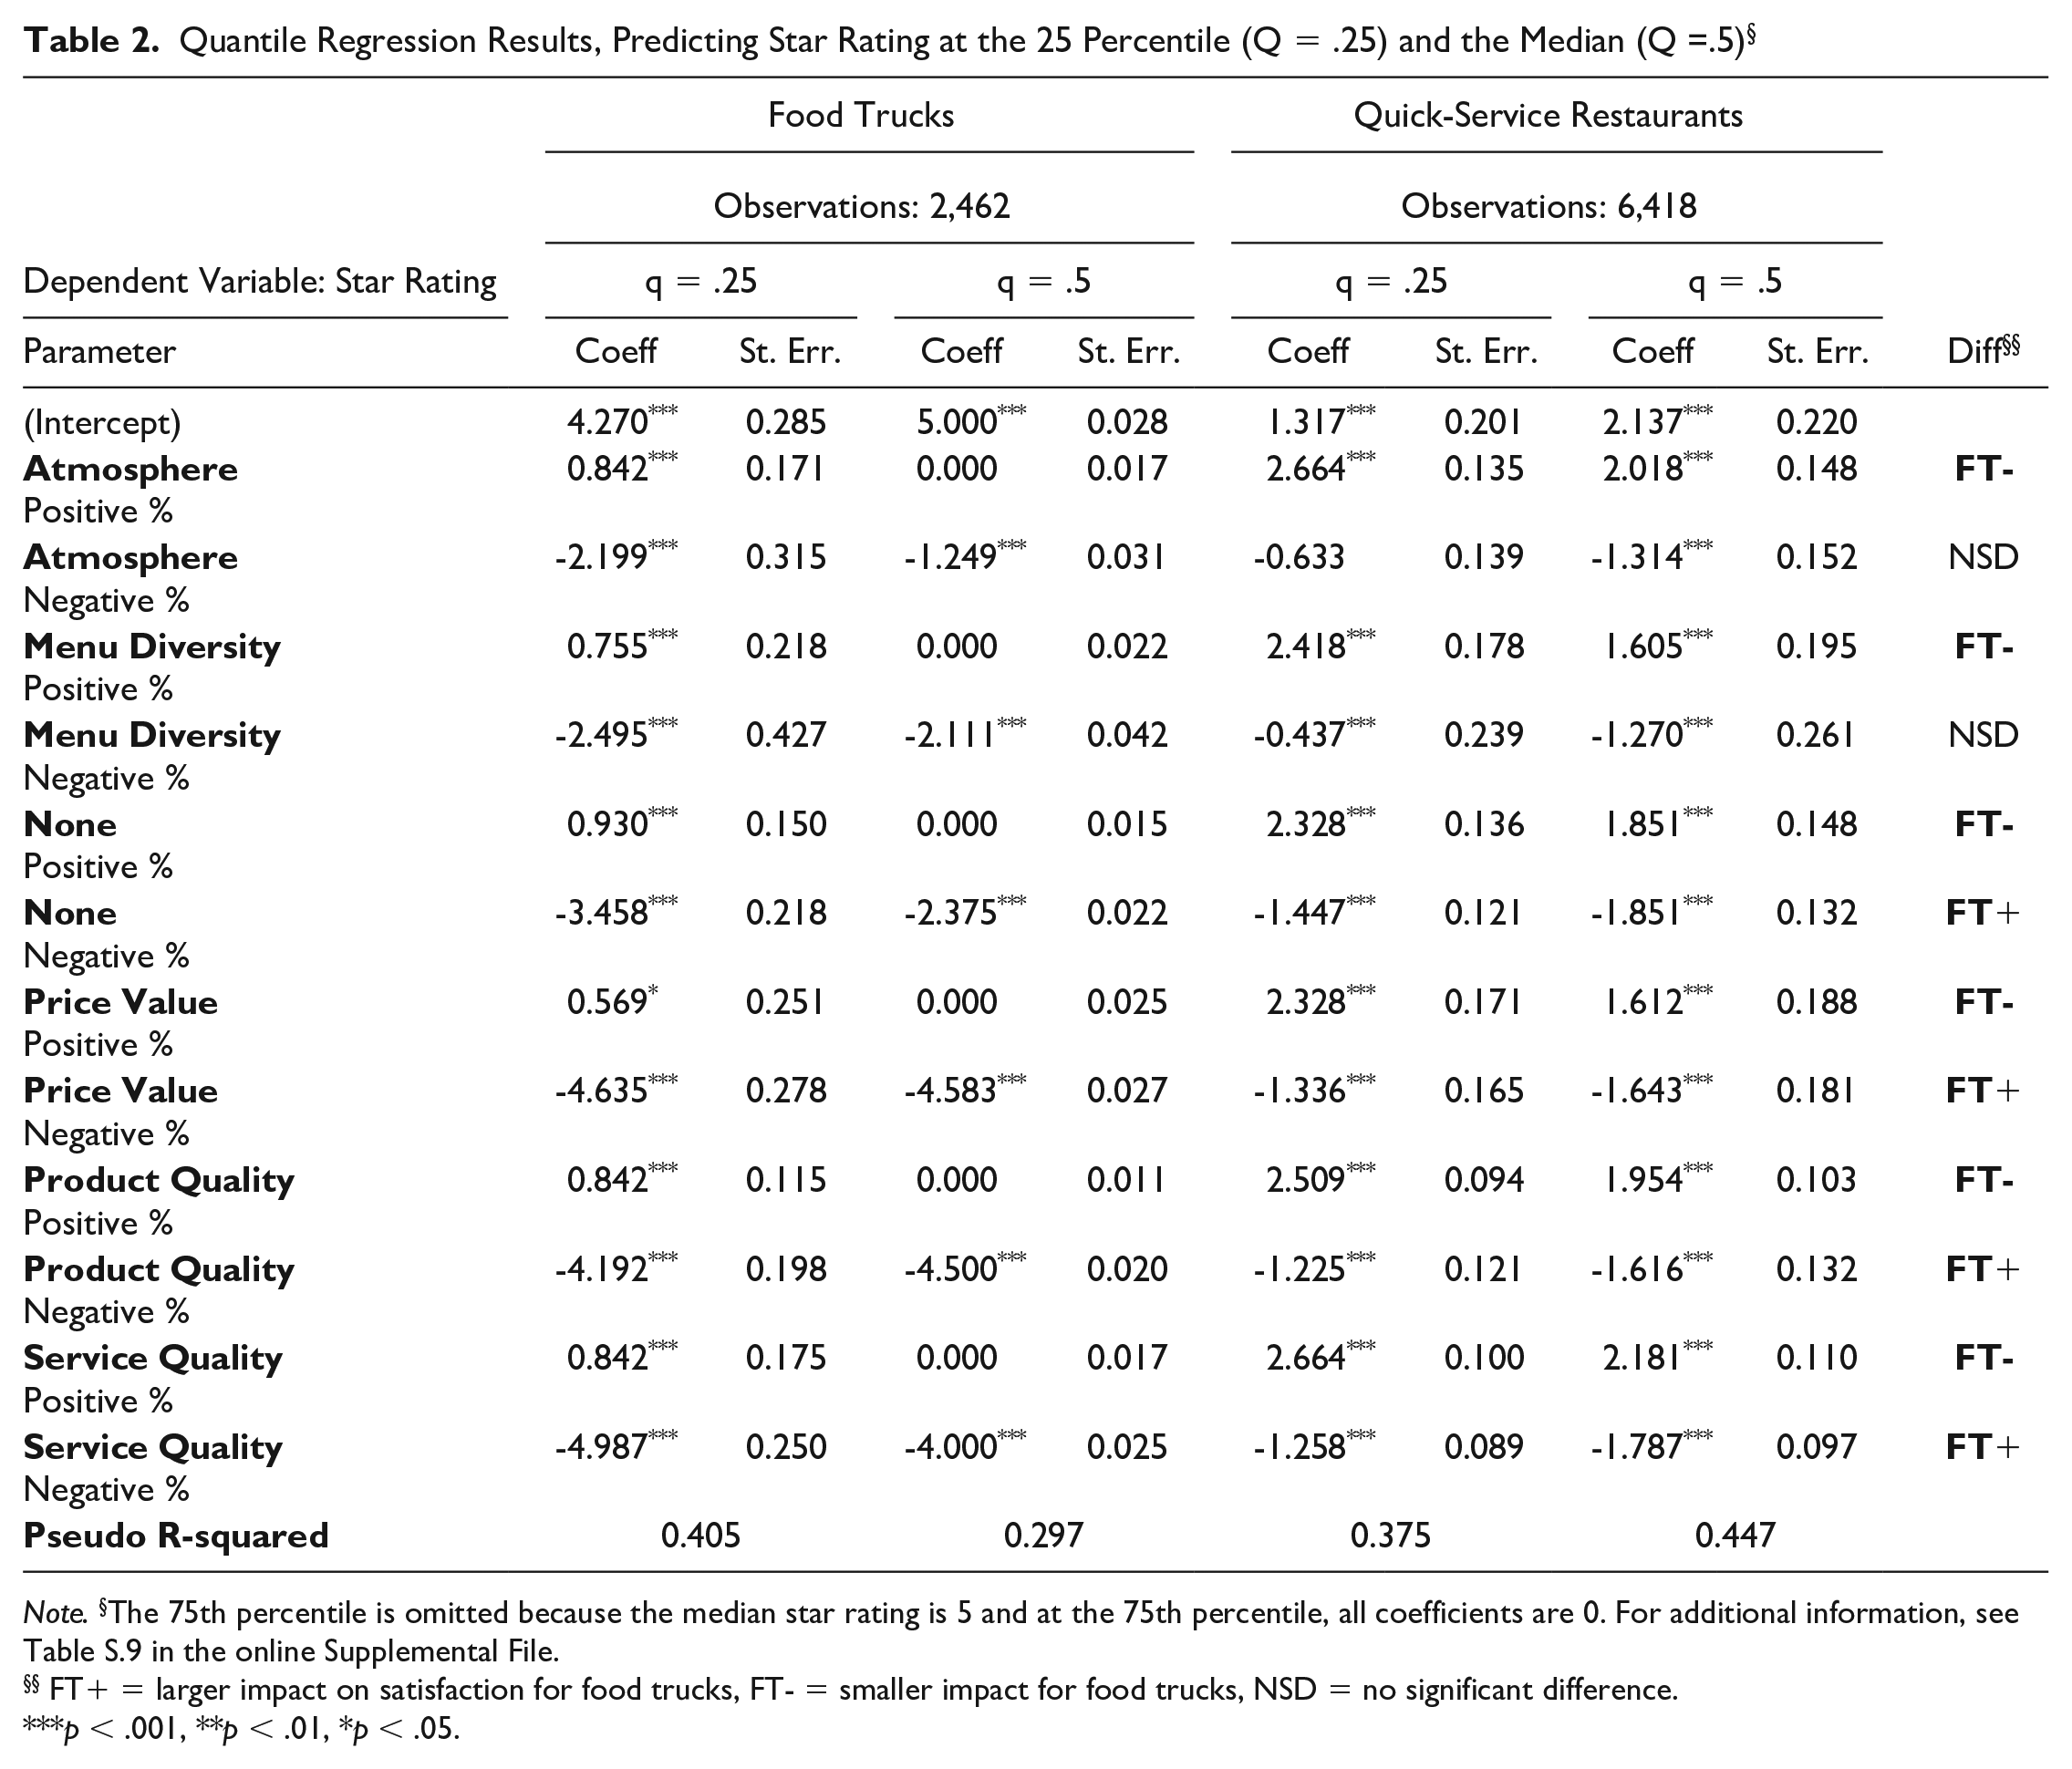
Note. §The 75th percentile is omitted because the median star rating is 5 and at the 75th percentile, all coefficients are 0. For additional information, see Table S.9 in the online Supplemental File.
FT+ = larger impact on satisfaction for food trucks, FT- = smaller impact for food trucks, NSD = no significant difference.
p < .001, **p < .01, *p < .05.
For QSRs, the median estimates are not markedly different from the OLS estimates. For FTs, however, quantile regression at the median zeroed out the effects of the positive comments, because the median rating for food trucks was 5. We therefore view the 25th percentile estimates to be a more realistic picture of how attributes effect star rating. For food trucks, more variance in star rating is explained at the 25th percentile (41% vs. 30%), and for QSRs, more variance is explained at the median (45% vs. 38%). To aid comparison, we printed the side-by-side effect comparisons in Table S.12 in the online Supplemental File. The “Diff” column of Tables 1 and 2 describes whether the coefficients significantly differ in magnitude, such that “FT+” means that the attribute has a stronger impact on satisfaction for FT, whereas “FT-” means that the attribute has a weaker impact.
We provide an intuitive effect size interpretation in Table 3, which we are calling the “star impact.” The interpretation is as follows: each additional sentence with an attribute-sentiment mention of this type results in a change in star rating equal to the value in the star impact column. We calculated these star impacts using the fact that the median review is six sentences long, indicating that an additional sentence amounts to an increase in an attribute-sentiment of 17%. Thus, the star impact is calculated as .17*median estimate.
Star Impact: The Change in Star Rating as a Result of Positive or Negative Restaurant Attributes §

Note. §For example, one additional positive sentence about Atmosphere results in an increase of .343 stars for QSR, but only .143 for trucks. Negative experiences consistently have a larger impact for food trucks.
For all attributes, positive experiences affect satisfaction more strongly for QSRs, and negative experiences affect satisfaction more strongly for FTs. Whereas positive experiences provide a boost in star rating for QSRs, positive experiences at food trucks do not have much effect. The intercept for food trucks is consistently higher across all regression models, meaning that there is a default satisfaction bonus for trucks that is pulled downward by bad experiences, but not markedly increased by good ones.
The attributes that affect satisfaction the most for QSRs, in order, are Service Quality Positive, Atmosphere Positive, and Product Quality Positive. For FTs, the largest impacts are from Service Quality Negative, Price Value Negative, and Product Quality Negative. Service and product are important for both, but they affect satisfaction differently, such that, with FTs, positive experiences do not increase satisfaction, but negative ones decrease it. Price & Value are important for the FT customer, but only a negative experience affects satisfaction. Especially good prices do not appear to be capable of delighting an FT patron, but bad ones have a strong negative impact.
The regression models account for less variance in star rating for FT than for QSR. This suggests that this collection of restaurant attributes, originally created for full service restaurants, is not easily portable to this new dining modality. To determine what factors were not accounted for, we delved into the None category. We iterated to the data again to see what concepts emerged.
Of our 62,651 sentences, 18,821 (30%) were classified as None. The size of this category prompted us to better understand what restaurant attributes our framework was overlooking, so we conducted an additional formal Qualitative Content Analysis (Neuendorf, 2016) on the None category. The lead author selected a random sample of 300 sentences and observed what themes emerged, creating and refining a new set of codes. He then selected a new stratified random sample of 300 sentences (150 FT, 150 QSR) and asked the other researchers to code them according to the new coding system. The protocol for this third round of coding is detailed in Listing S.2 (see online supplemental material) and included the following categories: Resolution, Review, Overall, Anticipation, Indeterminate, and Misclassified. All specific place names and references to truck, food truck, or restaurant were replaced with <PLACE>.
Interrater agreement was strong. Fleiss’ kappa was .738, which is “almost perfect” agreement (Landis & Koch, 1977). All three raters were unanimous 67% of the time, and at least two agreed 97% of the time. Our final label for each sentence was determined using majority rule. The nine cases in which there was no majority were dropped. The final distribution of categories appears in Figure S.6.
The most dramatic difference is in the Anticipation category, which was nearly 30% of food truck reviews and less than 10% of QSR reviews. This was a significant difference (χ2 = 24.10, df = 1, p < .0001). A few examples of sentences in the Anticipation category appear below. For more examples, see the online Supplemental File.
Someone at work told me I NEEDED to try these sandwiches and I am glad I did.
I’ve been waiting to try <NAME> after hearing so many good things and seeing it everywhere!
After years of knowing about this <PLACE> and months of waiting since, I finally got the chance to try these guys out.
My friend who is from Rochester wanted me to try one of the garbage plates for the first time so bad and I was so excited about it.
We discuss the implications of the over-abundance of these types of sentences among the FT reviews below.
Fourteen percent of the sentences were misclassified by the automatic classifier. This was often due to idiosyncratic language or specific foods that were not mentioned in the training data. We also noted that 6.5% of the sentences remained impossible to categorize (Indeterminate), even after refining the protocol and doing manual classification. This is because the sentences were either fragments or had some references to subjects in the previous sentence. In future work, more accuracy could be obtained by including neighboring sentences and conducting coreference resolution.
Discussion and Implications
Our analysis has yielded two key findings. First, customers visit food trucks with a positive and generous attitude. Before any experience, customers award food trucks a satisfaction bonus, which is our interpretation of the higher average star rating (4.11 vs. 3.04) and the consistently higher regression intercept. Any dramatic changes in satisfaction with food trucks are mainly affected by negative experiences. Positive experiences increase satisfaction less than negative experiences decrease it. This effect is stronger for FTs than for QSRs. Moreover, for QSRs, positive and negative experiences account for about the same variance in satisfaction (~40%), while for food trucks, positive experiences account for only 18% of the variance in satisfaction, but negative experiences explain 30%. Our second finding is that Anticipation comments appear far more frequently in FT reviews than in QSR reviews. This suggests a mechanism for the effect of negative experiences on satisfaction: customers have high expectations when they visit FTs.
We were able to establish the distinct distribution of comments in FT reviews by contrasting them with those in QSR reviews. Our QSR findings confirm a number of key results from earlier studies about restaurant satisfaction. The largest driver of satisfaction in our QSR data is Service Quality, which increases satisfaction by an average of more than two stars per sentence. Service has often been found to be an important predictor of satisfaction (Andaleeb & Conway, 2006; Yüksel & Yüksel, 2003), even in QSRs (Namin, 2017). Only slightly less influential in our data is Atmosphere. This finding agrees with Heung and Gu (2012), who determined that atmosphere is a critical antecedent of satisfaction. Han and Zhong (2009) found that elements of the physical environment that help to build atmosphere, such as décor, spatial layout, and ambient conditions, contribute significantly to satisfaction. Other elements of atmosphere, such as lighting and music, have also been linked to satisfaction (Wansink & Van Ittersum, 2012). We found that Product Quality is also a strong predictor of satisfaction, which agrees with the previous literature (Megahed & Abbas, 2021; Namin, 2017; Namkung & Jang, 2007; Yüksel & Yüksel, 2003; Zhong & Moon, 2020). Likewise, we found that Menu Diversity and Price & Value were significant predictors of satisfaction, confirming findings from previous work (Anu & Manorselvi, 2021; Kim et al., 2009; Liu & Tse, 2018; Namin, 2017; Yüksel & Yüksel, 2003). Altogether, Atmosphere, Menu Diversity, Price & Value, Product Quality, and Service Quality explained approximately half the variance of star rating in QSRs. This suggests that while there are other factors to explore, these attributes constituted a good basis for understanding QSR satisfaction and how FT satisfaction might differ.
Research on satisfaction with food trucks has been less extensive, but our findings provide some intriguing comparisons to the extant work. McNeil and Young (2019) found that service quality, brand personality, price, and convenience contribute to satisfaction, but that food quality and atmosphere do not. Our coding never found any mention of brand personality or convenience, so an important qualification for these attributes may be that they are latent and may function as moderators of other attributes. McNeil and Young’s (2019) finding that food quality was not significant is surprising, and contrasts with our results.
The disproportionate number of Anticipation statements in the food truck reviews could be a manifestation of patterns observed in previous research. Hedonic values have been shown to be the most important driver of food truck visit intention (Shin et al., 2019). Based on our findings, customers appear to spend some time anticipating the food truck experience. Yelp reviewers frequently mention hearing word-of-mouth testimonials convincing them to try the truck. Specific words within the Anticipation statements also appear among Shin and colleagues’ (2019) hedonic items, such as “fun,” “pleasant,” and “excitement.” These hedonic statements could be after-the-fact expressions of before-the-fact intentions. The prevalence of Anticipation statements could also suggest a difference in the explore-exploit tradeoff among FT versus QSR customers. Restaurants in tourist destinations deal predominantly with customers in an “explore” frame of mind, seeking new experiences, while local restaurants develop a set of loyal customers more interested in “exploiting” their favorites. Food trucks appear to function more as destinations. The proposition that Anticipation changes the satisfaction dynamics for different restaurant modalities should be conceptualized further and empirically tested in future work.
One theoretical contribution of the present work is that we bifurcate the customer’s positive and negative experiences, whereas previous work treated the experience of each attribute as a continuum. By doing so, we exposed the asymmetry between positive and negative experiences in their impact on satisfaction. By treating these valences separately, we were able to observe that, with QSRs, satisfaction is highly elastic with regard to positive experiences. The magnitude of the negative experiences’ impact on satisfaction was smaller. By contrast, food truck satisfaction is elastic mostly to negative experiences. Future models of customer satisfaction should consider measuring not just an average, but an average weighted according to the direction and importance of the attribute.
An additional contribution of this work is that we provide a methodological innovation that can aid future research. Putting textual analysis of Yelp on the table as a legitimate research tool for understanding customer psychology opens the door to some interesting triangulations of recent findings. For example, recent research found a relationship between scientific skepticism and intent to dine during the COVID pandemic (Byrd, 2022). Yelp reviews from this era could be analyzed for comments about observed health protocols in restaurants, possibly even adapting sentiment classifiers to detect indicators of fear, to further enrich this insight. Classification along attributes could be adapted to other classification schemas. The importance-performance analysis conducted by Mejia (2022) could be done using a similar analysis to the one in this research. Sentences could be classified according to their comments about social sustainability. Sentiment could serve as a measure of performance, while frequency could serve as a measure of importance. Another example is Liu and colleagues (2021), who tested a model in which hedonic, utilitarian, and cultural values influenced appreciation, which, in turn, influenced behavioral intention. To triangulate these results, future studies could classify sentences as demonstrative of each of these values and see how strongly they predict star rating (our indicator of appreciation).
Our work also has implications for practice. Recognizing that avoiding disappointment is the main driver of satisfaction, food truck practitioners should be careful of setting incorrect expectations. Food trucks tend to relocate frequently, and thus they lack the opportunity to build a following of regular customers. Because they have to advertise their offerings and location on social media, they have to walk a fine line between generating excitement and creating unrealistic expectations. Food truck managers have to be in the business of disappointment management, similar to how destination managers have to pay special care to avoid the causes of disappointment among tourists (Michalkó et al., 2015). Managers should be ready to identify disappointed customers and prepared to make recompense, perhaps in the form of money back guarantees or coupons. Managers should also let customers know that they are listening to feedback on social media, so that dissatisfied customers will see that their concerns are heard.
Another practical implication stems from our observation that Atmosphere matters for food trucks. Nearly 10% of sentences in food truck reviews were about atmosphere, whereas 4% and 5% were about Price & Value or Menu Diversity, respectively. Furthermore, a bad experience of Atmosphere can lower a rating by two stars. Food truck operators should be cognizant of the appearance of their location, since any unpleasant experiences with traffic, crowds, litter, dilapidated buildings, rusty fences, and so forth, could be misattributed to the truck itself, leading to lower customer satisfaction and lower ratings.
An additional practical implication of this research is that the automatic classifiers could be used to build an information system that could assist food truck managers in monitoring customer opinion (see Figure 2). Other general-purpose tools designed for monitoring a competitive environment on social media do not specifically address the attributes that research has identified as essential components of restaurant satisfaction. Since we have demonstrated that review sentences can be automatically classified along with the attributes, a manager can obtain a quick summary of performance along those attributes, and compare their performance with regional competitors using a radar chart. Additionally, key sentiment-bearing terms can be highlighted. See Figure 2 for an example. Because negative experiences related to Product Quality, Price & Value, and Service Quality are the key drivers of disappointment, special care could be given to those cells
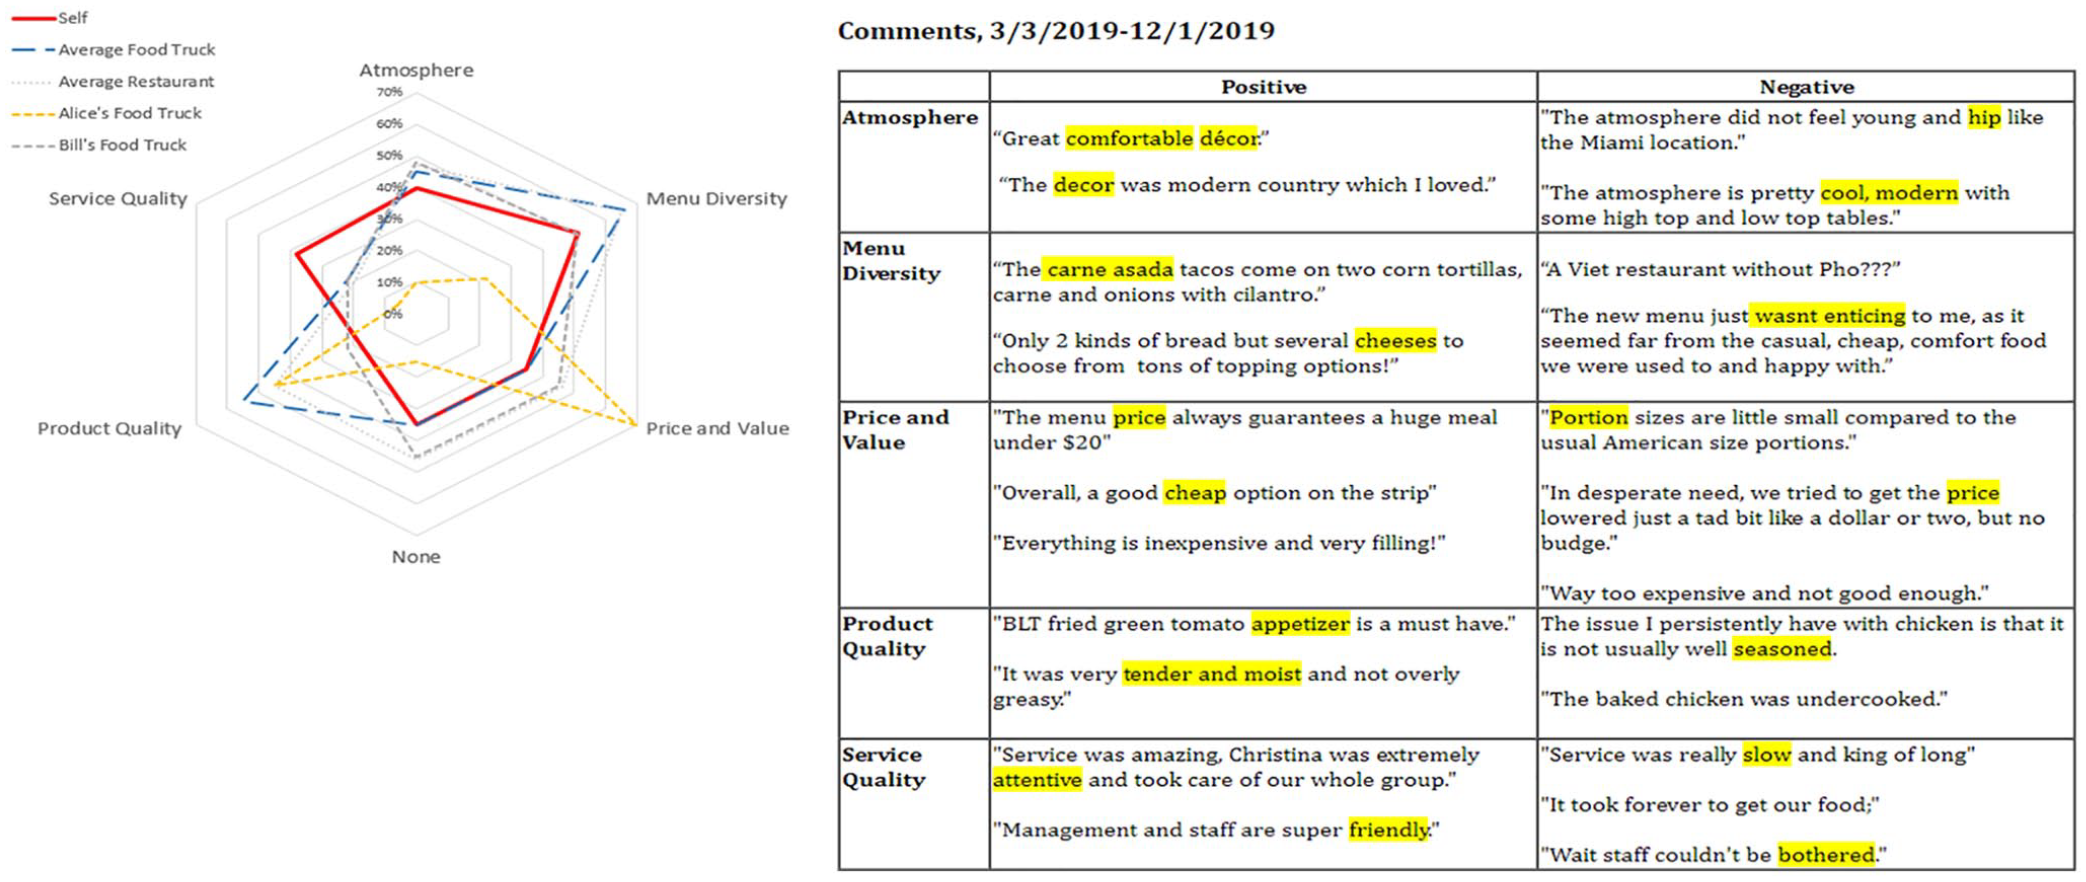
An Example of a Web Interface That Applies Our Research to Real-World Competitive Analysis.
Limitations and Future Work
Our work has some limitations which open up possibilities for future research. First, we assume that Yelp reflects true customer satisfaction. Although online reviews have exhibited certain biases in the past (Hu et al., 2006), we contend that the growing population of reviewers, along with Yelp’s crackdown on fake reviews, has resulted in a volume of reviews that reflect, to a reasonable degree, true customer opinion. While some populations may be overrepresented on Yelp, because millennials are both more likely to use Yelp (Mangold & Faulds, 2009; Nakayama & Wan, 2018) and visit food trucks (Yoon & Chung, 2018), they are a key demographic for this kind of study. Future work could employ non-corpus methodologies (questionnaires, a survey, and interviews) to verify whether non-Yelp-using populations exhibit the same customer satisfaction patterns.
Another limitation is that our data is a cross-section of a single year (2019). Although the data includes reviews of a diverse range of QSRs and FTs all across the United States, it represents a single point in time. Future work could include multiple years to track possible changes in consumer preferences or TF trends over time.
A further limitation of this study is that we treat all food trucks as a general category. One useful distinction that has emerged from the literature is between gourmet food trucks (GFTs) and traditional food trucks (TFTs; Alfiero et al., 2017; Ideris et al., 2017). This distinction could have implications for customer expectations. For example, the relative importance of location would likely be higher in TFTs, while the importance of menu diversity would be higher in GFTs, but this remains to be demonstrated empirically.
An additional extension of this work would be a more granular qualitative investigation of how customer expectation differs within each of the dimensions. For example, customers may have different expectations about certain features of food—texture, temperature, spiciness—bought from trucks versus restaurants, and further studies could explore those. Likewise, the dimensions of “atmosphere” differ substantially, and future studies could delve more deeply into how customers understand food truck atmosphere.
Our study began with a core set of existing attributes and iterated on the data so that unexpected concepts could emerge. In our third round of coding, we found a nascent relationship between pre-consumption attitudes (Anticipation) and post-consumption decisions (Resolution).
Future work on food truck satisfaction could investigate how the effect of anticipation on resolution is mediated or moderated through the perceived performance of the individual attributes. It is possible that this can only be accomplished through questionnaires, but as the volume of Yelp data grows, such a nuanced analysis will become increasingly feasible.
Concluding Summary
This research was an attempt to better understand the nature of customer satisfaction with food trucks. Since they are the newest and fastest-growing segment of the food service industry, it is important to establish exactly what niche food trucks occupy within the foodservice ecosystem, and whether the causes of customer satisfaction differ markedly from similar establishments. We accomplished this through content analysis of Yelp reviews of food trucks, comparing the satisfaction dynamics with those of Quick Service Restaurants along attributes customarily associated with satisfaction toward restaurants: Atmosphere, Menu Diversity, Product Quality, Price & Value, and Service Quality. Using review star rating as a proxy for satisfaction, we examined the relative impact of these attributes on satisfaction toward food trucks versus Quick Service Restaurants and found that all positive experiences affect satisfaction more strongly for Quick Service Restaurants, but negative experiences more strongly diminish satisfaction toward food trucks. On a practical level, this indicates that food truck managers should focus on managing expectations and mitigating disappointment. For theory, this suggests that satisfaction measures may not be optimally measured as points on a continuum, but, rather, positive and negative experiences of attributes have qualitatively different impacts on satisfaction. Finally, we introduce a new concept that emerged from our Grounded Theory approach: Anticipation. Further understanding of how Anticipation operates on satisfaction should be considered in future work.
Supplemental Material
sj-docx-1-jht-10.1177_10963480221143042 – Supplemental material for How Customer Satisfaction Drivers in Online Reviews of Food Trucks and Quick Service Restaurants Differ: Proposing the Concept of Anticipation
Supplemental material, sj-docx-1-jht-10.1177_10963480221143042 for How Customer Satisfaction Drivers in Online Reviews of Food Trucks and Quick Service Restaurants Differ: Proposing the Concept of Anticipation by Richard Gruss, Jessie Quesenberry, Eojina Kim, Alan Abrahams and Peter Ractham in Journal of Hospitality & Tourism Research
Footnotes
Acknowledgements
Special thanks to Bob Canter for his help in revising the language in this manuscript.
Declaration of Conflicting Interests
The authors declared no potential conflicts of interest with respect to the research, authorship, and/or publication of this article.
Funding
The authors received no financial support for the research, authorship, and/or publication of this article.
Supplemental Material
Supplemental material for this article is available online.
Author Biographies
References
Supplementary Material
Please find the following supplemental material available below.
For Open Access articles published under a Creative Commons License, all supplemental material carries the same license as the article it is associated with.
For non-Open Access articles published, all supplemental material carries a non-exclusive license, and permission requests for re-use of supplemental material or any part of supplemental material shall be sent directly to the copyright owner as specified in the copyright notice associated with the article.