



Abstract
Performance-based accountability along with budget tightening has increased pressure on publicly funded organizations to develop and deliver programs that produce meaningful social benefits. As a result, there is increasing need to undertake formative evaluations that estimate preliminary program outcomes and identify promising program components based on their effectiveness during implementation. By combining longitudinal administrative data, multiple comparison group designs, and a progressive series of analyses that test rival explanations, evaluators can strengthen causal arguments and provide actionable program information for key stakeholders to improve program outcomes. In this article, we illustrate the application of rigorous methods to estimate preliminary program effects and rule out alternative explanations for preliminary effects, including site selection bias, individual selection bias, and resentful demoralization through the evaluation of the Collaborative Project, a North Carolina educational improvement project that incorporated multiple components aimed at boosting student achievement.
Introduction
Performance-based accountability along with budget tightening has increased pressure on publicly funded organizations to develop and deliver programs that produce meaningful social benefits. Unfortunately, impact or outcome evaluation is often left to the summative evaluation phase, undertaken at the end of a project and neglected during formative evaluations. Typically, formative evaluations are undertaken from the outset through the initial implementation of a program with the goal of providing information that can be used for program improvement. Formative evaluation activities can and sometimes do link program components to outcomes (Chen, 1996; Scriven, 1996; Tessmer, 1993). However, formative evaluations often focus on measuring the quality of implementation or program processes, assessing stakeholder attitudes (including satisfaction with services), or pilot testing measurement instruments (Braden, 1992).
Recent efforts to develop large administrative databases that routinely collect outcome and service participation data on program clients and to improve quantitative methods for obtaining plausibly causal estimates of effects have made it possible for evaluators to assess preliminary outcomes and provide this information formatively. These developments increase the possibility for evaluators to estimate preliminary effects of programs as well as major program components, identify promising components as well as those that need to be strengthened, and provide this information to stakeholders.
In this study, we draw upon administrative data and rigorous methods to conduct a series of analyses to estimate preliminary program effects and rule out rival explanations that might explain observed differences in the outcomes both for the overall program and for the key program components. The goal is to isolate the preliminary effects of the program and give stakeholders evidence about which parts of the program seem to be contributing to better outcomes while they have time to use the information to scale up successful program components and remedy implementation flaws that may have constrained positive outcomes. Using the evaluation of the Collaborative Project (CP), a school-based reform effort in North Carolina as an illustration, we estimate preliminary program impacts, generate rival explanations for the estimates, and test those potential explanations using rigorous quantitative methods in an effort to provide detailed, timely feedback to stakeholders on the effects of specific program components.
Outcome Focus, Data Availability, and Methodological Developments
In recent years, the role of evaluation as a whole and formative evaluation in particular has been evolving to address the outcome-oriented information needs of programs that are expected to show evidence of meaningful societal benefits. One prominent reaction in the evaluation community has been the emergence of new forms of evaluation such as developmental evaluation (Patton, 2011) and proformative evaluation (Coryn, 2007). Patton’s (2011) developmental evaluation calls for evaluators to be integrated into the team designing and implementing innovative programs in order to raise evaluative questions and provide data, logic, and evidence throughout decision-making discussions about the development and adaptation of an innovation. As one example, Patton suggests ongoing developmental evaluation of messages in political campaigns undertaken by multiple, rapid random assignment studies using recipients’ reactions as outcomes that provide evidence to shape future messages (p. 333). Taking a stance originally suggested by Scriven, Coryn (2007) calls for evaluators to become proactive in providing evidence about programs that are developing. By way of example of proformative evaluation, Coryn conducted and evaluated a pilot intervention that had been designed to change negative perceptions of the poor by testing the reactions of a convenience sample of 206 Midwestern college students across four time periods.
Taking a different tact, Stetler and colleagues (2006, p. S1) somewhat repositioned formative evaluation offering a definition that includes more emphasis on outcomes and use of preliminary outcome information to improve interventions: “a rigorous assessment process designed to identify potential and actual influences of implementation efforts as a means to optimizing the potential for success.” Reporting on the Department of Veterans Affairs Quality Enhancement Research Initiative, Stetler et al. and others described formative evaluations in the health field that have been used to make rapid, evidence-based improvements in program or intervention implementation to achieve better health outcomes. Formative evaluation in this framework includes (1) undertaking activities to detect “Type III error” described as erroneous inferences about program outcomes due to implementation flaws (2) and the early assessment of outcomes while time exists to take corrective action and improve implementation (Krumholtz & Herrin, 2000). These evaluators highlight the preliminary nature of the outcome findings from formative evaluations by using the findings to generate empirical hypothesis that can be formally tested by summative evaluations.
Fortuitously, the implementation of performance-based accountability systems that measure program participation as well as important program outcomes, often at the individual participant level, and their associated data systems have bolstered evaluators’ ability to conduct formative outcome evaluation, quickly and at reasonable cost. Established and refined for accountability and performance monitoring purposes, extensive databases are becoming more common and more easily accessible in many program areas including education, economic development, social services, and employment training. Evidence of this movement can be seen in the proliferation of “report cards” which rate and rank the quality of services across a variety of programs (see, e.g., Gormley & Weimer’s 1999 book, Organization Report Cards). Many states, such as Florida, Georgia, and North Carolina, have developed extensive data systems that connect higher, K–12, and early education as well as employment and social service data. In the field of education, the federal government has provided grants for the development and implementation of state longitudinal data systems and promulgated policies, such as Race to the Top, which require data on outcomes and service providers to be available and used as a condition of eligibility. These developments have created a data-rich environment, which can be drawn on for relatively quick and inexpensive formative evaluations that assess preliminary outcomes.
The availability of administrative databases makes rigorous quasi-experimental designs a viable option for formative evaluation. A broad consensus exists that the most credible evaluations of programs’ impacts are produced through random assignment or regression discontinuity (RD) studies as these approaches yield the strongest causal estimates of program effects (Henry, 2010; Rubin, 2005). Random assignment studies, often referred to as randomized field trials, eliminate selection bias from effect estimates by balancing the distribution of all influences other than the program on the outcome of interest between the treatment and control groups though randomly assigning individuals to the two groups. RD designs eliminate selection bias from effect estimates when a quantitative assignment variable is used to assign individuals to treatment, a cut score on the quantitative assignment variable determines eligibility for a program, and the proper functional form of the assignment variable is included in the analytical model for obtaining the program effect estimates. However, many programs are implemented in situations where expediency, ethical concerns, or other circumstances prevent using either of these designs.
When programs are implemented without treatment being assigned either at random or based on a quantitative assignment variable, other comparison group techniques can be applied to generate credible impact assessments (Henry, 2010). Rather than relying upon a single design approach (e.g., randomization) to “trump” all other explanations for differences between participant and nonparticipant outcomes, in most cases using comparison group designs requires evaluators to implement a strategy in which credible, alternative explanations for differences in outcomes between groups are rigorously tested until the most plausible explanation survives. Recently, researchers have provided evidence showing negligible differences in effect estimates between experimental and well-crafted quasi-experimental studies, along with specific procedures that have been found to reduce bias (Bifulco, 2012; Diaz & Handa, 2005; Glazerman, Levy, & Myer, 2003; Heckman, Ichimura, & Todd, 1997; Shadish, Clark, & Steiner, 2008; Cook, Shadish & Wong, 2008). The types of design and modeling techniques supported in these studies, while not as potent in eliminating bias from unobserved confounding variables as randomized field trials or RD studies, have been widely applied in summative evaluations, but apparently not as frequently in formative evaluations.
In the formative outcome evaluation example we present, we conducted analyses to progressively rule out plausible alternative explanations, such as selection bias, for overall and individual program component effects. Our approach combined longitudinal administrative data of a type that is currently (or will soon be) available in most states (for a description, see Data Quality Campaign, 2011), with a progressive series of analyses based on comparison group designs that attempt to remove rival explanations for any effects that were found in an effort to provide actionable program information. This approach was well suited to our evaluation context, which lacked random assignment or assignment based on a quantitative assignment variable, but where stakeholders viewed preliminary estimates of program impact as essential to guide program improvement. Alternative hypotheses were generated from two main sources. First, a qualitative study of the program that included interviews and focus groups featuring program participants and leaders led to the formation of several testable hypotheses (Thompson, Cunningham, Smith, Phillips, & Zulli, 2009). Second, an understanding of various quasi-experimental approaches led to a careful design of a series of analyses strategically chosen to take advantage of the strengths and shore up the limitations of each approach. The purpose of this article is to illustrate the use of quasi-experimental designs, complemented by a carefully sequenced series of analyses in order to provide formative information to stakeholders.
Our formative outcome evaluation was implemented during the second year of the CP, a project undertaken in five rural school districts in North Carolina with the aim of improving student achievement. In the next section, we describe the CP and several key decisions that led to a focus on outcomes in the formative evaluation.
The Development and Initial Implementation of the CP
Led jointly by the Public School Forum of North Carolina and the North Carolina Science, Mathematics, and Technology Education Center, The CP was initially funded as a 3-year pilot program serving all schools in five small, rural school systems: Caswell, Greene, Mitchell, Warren, and Washington County Schools. Participation of the districts was voluntary but required full participation in CP including attendance at annual executive development institutes. These districts were selected because they are small, rural, have challenging demographics, and represent two of the state’s most rural regions, the eastern Piedmont region and the mountainous western region. The multimillion dollar CP pilot was funded by the General Assembly of North Carolina for 3 years and began operation in the fall of 2007.
The CP’s objectives included directly and indirectly improving student achievement through the (1) development of teachers through extensive professional development (PD) opportunities; (2) recruitment and retention of high-quality teachers (through incentive payments and provision of PD); and (3) the provision of afterschool programs. One reason for the focus on teacher development was that the participating districts paid some of the lowest teachers’ salary supplements, averaging US$901 compared to the statewide average of US$3,327 prior to CP (author’s analysis), which made competing for high-quality teachers more challenging. CP leaders’ main theory of action for the program involved improving teacher quality. They aimed to affect teaching quality by providing financial incentives for teachers to remain in the classroom and improve their instructional skills by participating in high-quality PD. Extensive PD opportunities and a detailed incentive plan were offered through CP. In addition, CP leaders increased opportunities for students to learn outside the regular school day by providing afterschool enrichment programs.
The evaluation activities were planned to span all 3 years of the pilot project. During the planning process, the leadership of the pilot and the organizations that housed the project made clear that the CP pilot was proposed, developed, and funded to produce meaningful increases in student outcomes, especially, but not exclusively in mathematics achievement. Therefore, the evaluation focused on student test scores as one of the main outcome measures. In addition, following the theory of action related to teacher quality, the evaluation was focused on teacher retention and improvements in overall teacher quality, including the percentage of teachers with National Board Certification, an explicit focus of the PD. Working closely with CP stakeholders, the plan for the evaluation moved from a process focus in the beginning to more emphasis on outcomes. The initial year consisted of an assessment of program implementation, program context, and quality of implementation along with working with program staff to ensure collection of accurate, detailed program participation data. Data collection included qualitative interviews and focus groups, surveys of participants, and acquiring administrative data on program participation. During the second year of the pilot phase, we continued monitoring program implementation but shifted focus to a rigorous, empirical, formative evaluation of the overall program impact and the impact of program subcomponents. In the next section, we describe the formative outcome evaluation that we conducted at the close of the second year of program operations, which focused on the PD activities.
Assessing Outcomes by Ruling Out Plausible, Rival Hypotheses for Differences in Effects
As mentioned earlier, key CP stakeholders explicitly asked for preliminary evidence concerning the effects of the program and the program components in terms of raising student test scores. They sought outcome information in order to help guide key program improvement decisions concerning increasing access to program components that were producing better outcomes and strengthening or curtailing activities that did not appear to be working effectively. To provide credible evidence concerning preliminary program effects, we developed a set of analytical steps to minimize bias as well as rule out alternate explanations (e.g., demoralization or self-selection) for any outcomes that were found to be consistent with these explanations as well as positive program effects:
identified outcome measures and data;
matched CP schools to a set of schools that did not participate in CP to reduce site selection bias;
tested matching and model specification through a falsification test to establish the absence of preexisting differences between test score gains of students in the CP and matched sample schools prior to the initiation of the program;
estimated overall, preliminary effect (intent to treat [ITT]) on student achievement;
tested resentful demoralization as an alternative explanation for the results of the overall effect analysis;
assessed individual program components by comparing value-added student achievement score differences between students in CP and comparison schools (treatment on treated); and
implemented a series of fixed effects analyses to rule out rival hypotheses, including self-selection of effective teachers into certain PD programs (teacher fixed effects) and preferential assignment of students to teachers who participated in certain PD programs (student fixed effects) in an effort to strengthen the claim for a causal explanation.
We describe each step of our strategy below.
Identified Measures and Data
An initial step with most evaluations is to identify the most important outcome measures and to assess the extent to which available data include these measures. Because the ultimate goal of the program was to increase student achievement, particularly in mathematics, student test scores were the primary outcome measure. 1 In this case, we relied on administrative data being collected for performance accountability purposes on students in all public schools in North Carolina as well as data being collected by CP pilot administrators in the five districts. The administrative data consist of a multilevel longitudinal database containing not only test scores for periods before and after the CP pilot began but also teacher quality variables that prior studies had examined and, to varying extents, found to be correlated with student test score gains. These teacher quality variables include teacher experience (Boyd, Grossman, Lankford, Loeb, & Wyckoff, 2006; Clotfelter, Ladd, & Vigdor, 2007, 2010; Hanushek, 1997; Harris & Sass, 2011; Henry, Bastian, & Fortner, 2011; Henry, Fortner, & Bastian, 2012), National Board of Profession Teaching Standards certification (Clotfelter et al., 2007, 2010; Goldhaber & Anthony, 2007; Henry, Thompson, Fortner, Zulli, & Kershaw, 2010), teaching infield (Henry et al., 2010), Praxis and teachers’ Scholastic Assessment Test scores (Buddin & Zamarro, 2009; Clotfelter et al., 2007, 2010; Goldhaber & Anthony, 2007), type of certification/preparation (Boyd et al., 2006; Clotfelter et al., 2007, 2010; Goldhaber & Brewer 2000; Henry et al., 2013), and advanced degrees (Boyd et al., 2006; Clotfelter et al., 2007, 2010; Harris & Sass, 2011; Henry et al., 2010).
Since schools were not randomly assigned to CP participation nor assigned based on a quantitative variable, rigorous evidence depends on minimizing selection bias and other confounding influences on the estimated effects. Since the available data included schools where the program was not implemented, these data can be used for selecting a matched comparison group (Henry, 2010). The comparison group provides a “counterfactual,” that is, a group to represent what would have happened in the absence of the program. The logic of the comparison group design is if you match a set of schools that were exposed to the treatment to similar schools that were not, site selection bias can be minimized by reducing differences in students and schools between the treated and untreated groups that could explain differences in the outcomes. The longitudinal database included important outcome measures at the students, teacher, and school levels.
As a final note before explaining how the comparison group for the evaluation was chosen, we describe the two types of effect estimates that could be implemented in this evaluation. The first type of effect estimate is referred to in the literature as “ITT” (Berk & Sherman, 1988), or the overall impact in the group that had access to treatment, whether they actually received the specified treatment or not. This is the type of estimate that is often considered the most relevant to policy or program initiatives in which those who have access to the initiative may choose to participate or not. The ITT estimates provide decision makers with an estimate of the likely impact that will be achieved if the program were to be implemented in a way that allows for eligible individuals to choose whether to participate. Thus, the ITT overall impact estimate does not represent the actual impact of the program on those who took up the treatment, but the average effect that can be expected given eligible participants’ actual levels of participation.
Another type of program effect estimate is the “average effect of treatment on the treated (TOT).” The TOT provides impact information for those who were eligible and participated in the program or in specific program components. The TOT is valued highly by program implementers who want to know how effective the program is for those who actually participated in the program. These effect estimates provide an initial indication of the program or components effects on participants, thus helping identify the specific components (and by extrapolation, types of components) that have the greatest promise of improving outcomes.
Matched CP Schools to a Sample of Schools for Comparison
A main objective of this formative evaluation was to address the question: Are the gains in student test scores in CP schools larger than would have been expected in the absence of CP after 2 years of a 3-year pilot? The counterfactual to provide an estimate of what would have happened in the absence of CP for this study was students’ test scores in schools similar to CP schools that did not have access to the CP program. Since CP focused on increasing student achievement in elementary and middle schools, we tested whether student gains on North Carolina EOG mathematics and reading/language arts exams for Grades 3 through 8 were larger in the CP schools than in comparison schools.
To accomplish this goal, we could have employed either a pretest posttest nonequivalent comparison group design (sometimes referred to as a difference-in-differences design by evaluators trained in econometrics), a matched sample design, or a design combining both (matched sample difference-in-differences) to estimate the overall effect of the CP on student achievement. The matched sample difference-in-differences model assesses the extent to which gains in students’ test scores who attended CP schools after the pilot began are greater than gains in students’ test scores in a matched sample of similar schools during the same period. The matched sample of schools was chosen from schools in the state that did not receive the treatment and were similar in terms of preintervention test scores and other covariates. If differences in students’ test score gains before and after the pilot began in project sites are greater than those in the matched sample, this design virtually eliminates explanations such as secular increases in test scores or other education reforms, changes in state education funding, or initiatives or other changes that were implemented across the state or in similar types of schools.
Propensity score matching, which we used in this evaluation, is a statistical technique that makes the differences between the treated and matched sample on the outcome independent of the covariates that are used to predict the probability of being in the treatment group (Rosenbaum & Rubin, 1983). Specifically, we implemented intact group (school level) propensity score matching, which, in some very particular circumstances, has shown to produce negligible differences in effect estimates when compared to estimates from random assignment studies (Cook, Shadish, & Wong 2008; Diaz & Handa, 2005). Matching was conducted at the school level because the treatment was implemented school-wide and intended to have a school-wide impact.
To implement propensity score matching, the first step is to estimate the probability of being in the treated group using a set of variables referred to as covariates for each school in the treated group and the entire pool of available untreated schools. We used a variety of student, teacher, and schools variables collected prior to program implementation (academic year 2006–2007) and student variables aggregated to the school level in order to identify the comparison sample of elementary and middle-grade schools. The school-level covariates include average end-of-grade (EOG) mathematics score prior to CP implementation, school size (average daily membership), the percentage of students who were eligible for free or reduced price lunch, the percentage of teachers with 5 or more years of experience, school expenditures per pupil in regular classroom instruction, PD, instructional support, school leadership, and transportation, rural location, and grade configuration. These covariates were selected based on their expected relationship to site selection and student performance outcomes in order to maximize the predictive accuracy of a logistic regression with CP status (the logged odds of being in the CP pilot) as the dependent variable.
The analysis used logistic regression to estimate the conditional probability of being a CP school for both project schools and other elementary or middle-grade schools in North Carolina. After finding that the propensity scores substantially overlapped in project and other schools (region of common support), we matched the CP schools without replacement (two untreated schools were eligible to be matched with each CP school).
In Project districts, there were 22 schools with elementary and middle-school grades that had students in EOG-tested grades (Grades 3–8). For purposes of comparison, we chose 44 schools that did not participate in the pilot which were the closest in terms of their propensity score (estimated logged odds of being a project school) to the CP schools. This is referred to as 2:1 matching, which means two untreated schools are chosen for each of the treated schools based on the untreated schools having a propensity score that is closest to a CP school’s propensity score. Choosing two comparison schools for each Project school provides substantially more statistical power to detect effects when effects occur than is available with 1:1 matching. We stratified the matching pool by type of rural location and grade configuration to ensure that matched schools had the same type of rural location and grade configuration as the CP school with which they were matched. The sampling procedures provided us with 77,364 student-by-year observations to estimate CP effects on mathematics achievement (and a similar figure for reading).
An initial check was conducted to see if the matched sample were more similar to the CP schools than was the full pool of non-project schools on the nine covariates used for the matching. Table 1 shows that the matched sample of schools to be used for the comparison group were more similar (nine of the nine comparisons) to the CP schools than the full pool of non-project schools. In order to check on the balance achieved by the matching, we conducted a specification test that assessed the difference in student test score gains between the CP schools and matched sample schools in the years prior to CP implementation, which is described in the next section.
Comparing Project, Matched Sample, and All Non-project Schools on Matching Covariates.
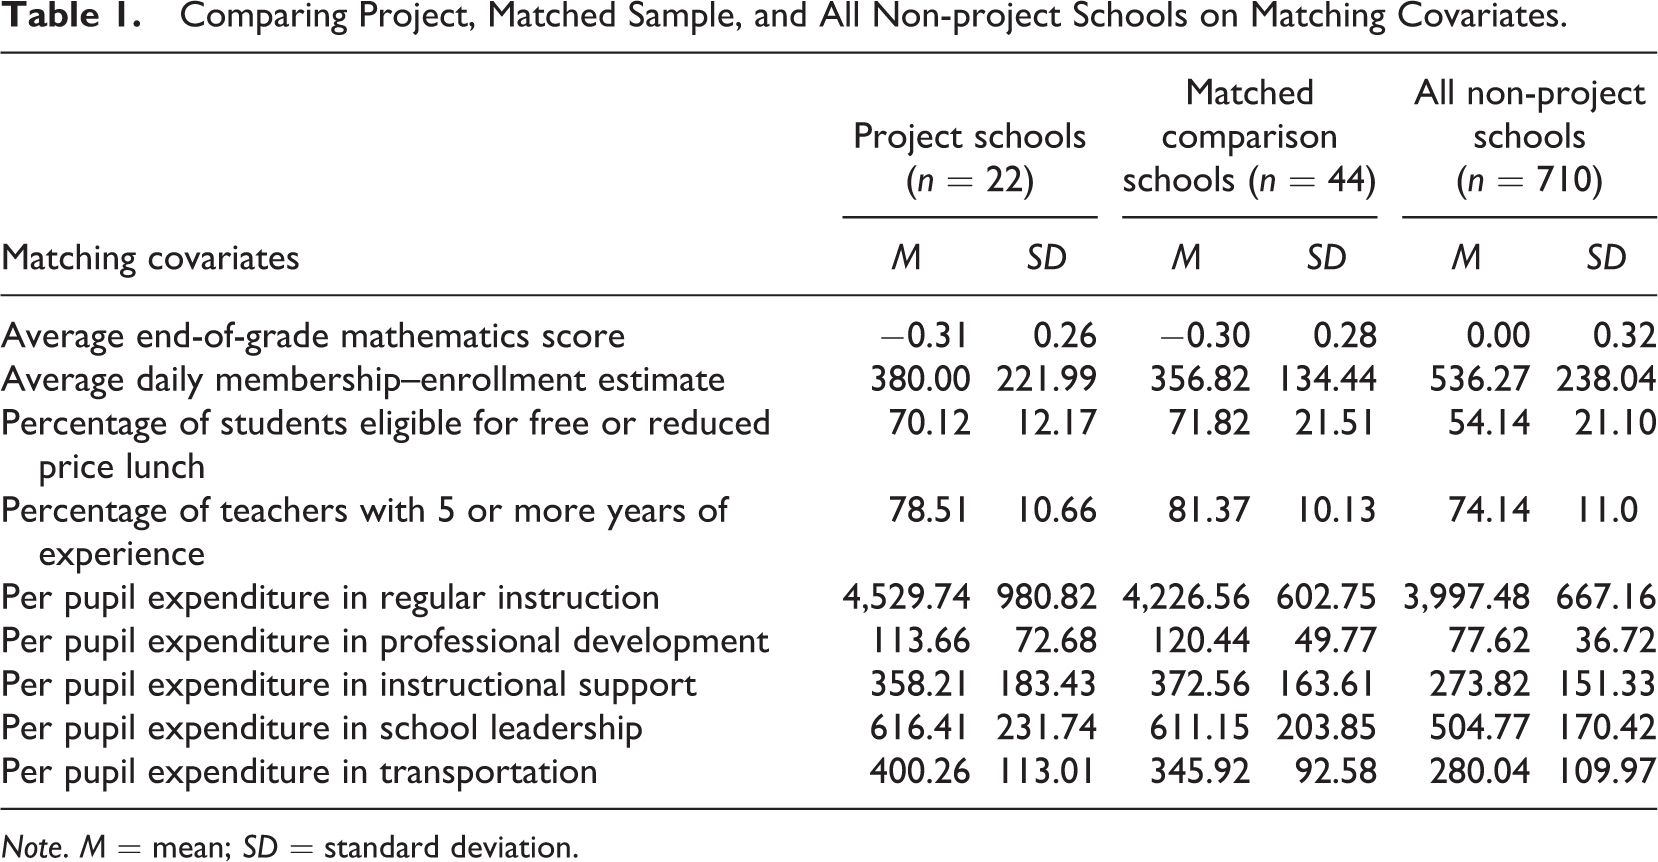
Note. M = mean; SD = standard deviation.
Tested Matching and Model Specification Through a Falsification Test
To examine whether the matched sample was not different in terms of student test score gains, conditional on available covariates, we performed a falsification test that has been shown to reduce bias (Glazerman et al., 2003). The falsification test must be performed using the same model that will be used to estimate the preliminary program effect.
Our analytical model, implemented for the falsification test and estimating effects, used a large number of covariates which prior research had shown to be beneficial for significantly reducing bias in matched sample studies (Bifulco, 2012; Cook et al., 2008; Glazerman et al., 2003; Shadish et al., 2008). To fully capitalize on the available student-level data and the extensive covariates that could reduce bias in the impact estimates and to correctly estimate standard errors to account for nested data (students within classrooms within schools), we decided to implement a multilevel model to estimate the effects of CP. Specifically, we estimated the effects using year-to-year value-added models with three levels (student, classroom, and school) and extensive covariates for all analyses. 2 By combining propensity score matching and student, classroom, and school covariates in the estimation equation, we implemented a procedure known as doubly robust estimation (Jonsson Funk & Westreich, 2008). By using a multilevel model and doubly robust estimation, we were able to adjust the CP effect estimate for any important differences captured in the available covariates (which may not have been fully adjusted by matching), gain substantial statistical power by using individual students’ test scores as the outcome of interest, and correctly adjust the standard errors for intraclass correlation.
The most important covariate included in the model for the falsification test and the actual effect estimation was each student’s prior test score, specifically the average of the students’ mathematics and reading test scores in their prior grade. By including the students’ average prior test scores, this study could test to see whether the CP as a whole, or in part, was able to foster student test score gains above and beyond what would be expected given the student’s prior achievement, which is commonly referred to as value-added modeling. All test scores were standardized by subject, year, and grade in order to remove statewide secular trends. 3
Covariates included in the estimation and falsification models were (a) student level: prior test scores, gender, free or reduced price lunch status, limited English proficiency status, number of days absent, and mobility, (b) classroom level: the number of students in tested class, the average prior year’s test scores for students in the class (peer ability), and the dispersion (standard deviation) of prior scores for all students in the class, and (c) school level: variables including the percentage of students eligible for free or reduced price lunch, the percentage of students in each ethnic group, annual daily membership, two indicators of the degree of orderliness in the school (short-term suspension rate and violent acts rate), the average local district supplement paid to teachers, total per pupil expenditures, and the school’s propensity score.
The estimation model also included a main effect of CP at the school level and interaction terms of CP with year indicators for each of the first 2 years, allowing for the identification of differential effects of the program by year. See Appendix for the model equations. 4 We conducted the test by implementing year-to-year value-added multilevel models with reading and mathematics test scores and limited the data to the 2 years prior to the start of the CP (academic years 2005–2006 and 2006–2007). We used the same equation that appears in Appendix with the postintervention 2007–2008 and 2008–2009 year indicator variables and their interactions with CP variables omitted.
Findings from the falsification test showed that students’ math and reading test score gains in CP schools in either of the 2 years before the program began were not significantly different from students test score gains in matched sample schools (Table 2). Thus, propensity score matching along with the multilevel model with extensive covariates appears to have resulted in student test score gains in CP schools being statistically indistinguishable from those of students in the matched sample schools prior to implementation of the CP, suggesting that, conditional on covariates, the treated and comparison group had no statistically significant initial differences.
Falsification Test: Estimates of Differences Between Project and Matched Sample Schools Prior to Project Implementation.
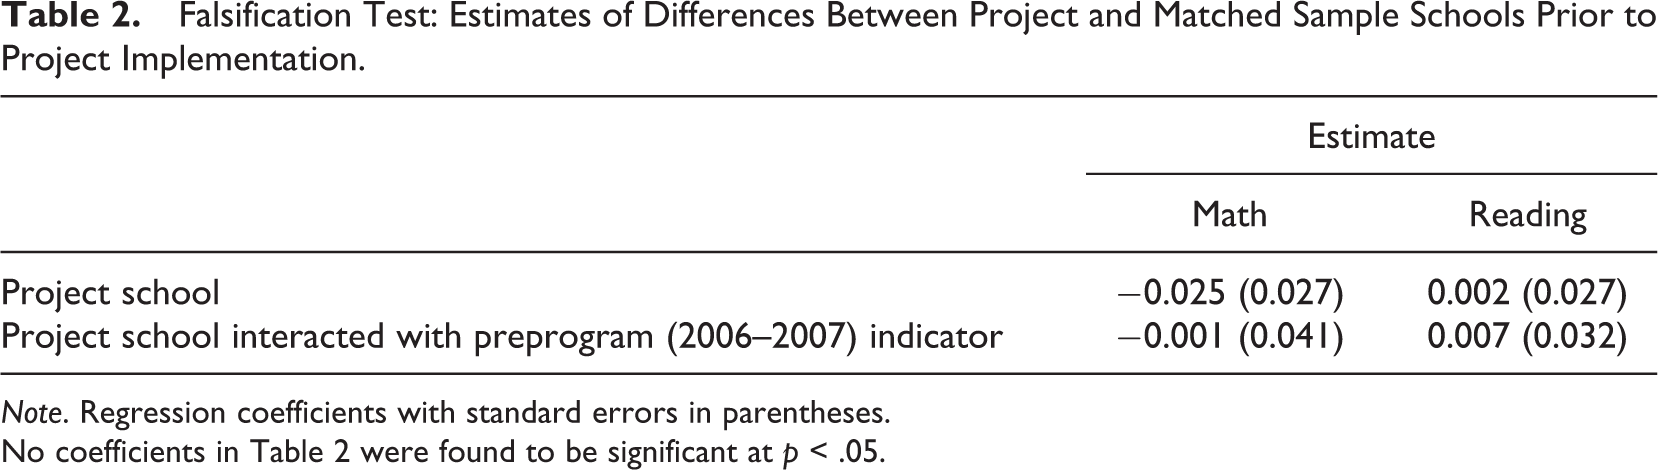
Note. Regression coefficients with standard errors in parentheses.
No coefficients in Table 2 were found to be significant at p < .05.
Estimated Preliminary Overall Impacts (ITT)
Next, we estimated the difference in value-added to student test scores between CP and matched comparison sample of schools after the first 2 years of project implementation. Overall, the CP did not lead to significantly larger test score gains either in 2007–2008 or in 2008–2009 (see Table 3), the first 2 years of the pilot. While CP students made some gains in 2007–2008 over the preintervention baseline years relative to the gains made by students in the matched sample schools, the gains were not significantly different. In contrast, the results suggest CP students lost ground in the second year of the program but again not significantly so.
Estimates for Overall Project Impact.
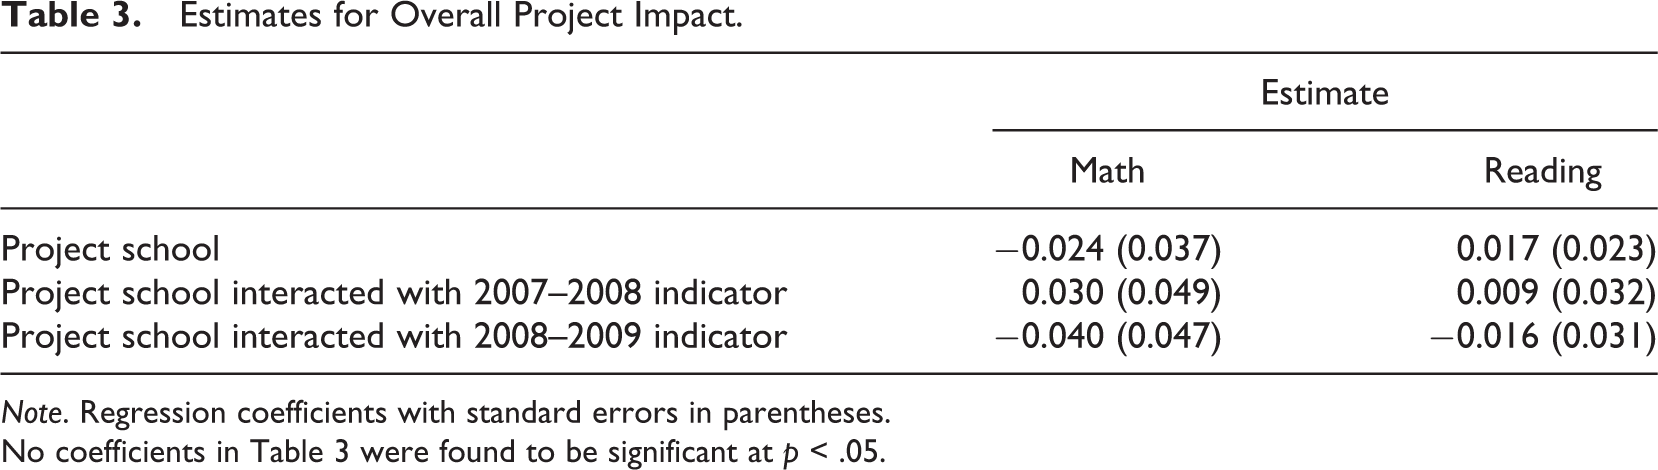
Note. Regression coefficients with standard errors in parentheses.
No coefficients in Table 3 were found to be significant at p < .05.
The overall model tests the impact of CP on student achievement by assessing the average effect across all the students in targeted schools, which is an ITT estimate. It is possible that the lack of positive, significant effects result from the CP not having sufficient time to realize its full impact. After all, interventions must first change instructional practice on a broad basis, and instructional practice must begin to influence students’ behavior and improve learning on average across all CP schools for there to have been a significant effect. At this point, the average effect of the CP, including those who participated fully and those who did not, was simply too small to be detectible. Limited time and limited breadth of participation could have attenuated the effect. CP teachers were able to select the type and quantity of PD sessions to attend, some selecting out of participation altogether. Students of teachers who attended PD may have been impacted by the CP to a greater extent than students of teachers who opted out of PD participation and some PD may have been more effective than other PD.
In addition, our qualitative interviews surfaced that some teachers may have resented the requirement to commit time outside of regular school hours to earn additional money when teachers in other districts received larger supplements for working regular hours. In the next sections, we conduct more focused tests of these explanations.
Tested an Alternative Explanation: Resentful Demoralization
One potential explanation for the non-findings in the overall impact model is resentful demoralization. While most CP teachers participated in at least one PD session and/or did extra work to earn incentive pay, a sizable percentage did not participate (e.g., approximately 25% of teachers each year did not participate in any CP sponsored PD). It is possible that teachers who did not participate may have resented the requirement to put in extra hours to earn supplemental pay and bonuses and reduced their effort as a consequence. If some teachers became less effective teachers due to demoralization while others respond in ways that improved their teaching effectiveness, the overall effect may have been attenuated. In short, the project may have some unanticipated negative consequences that need to be addressed for the program to achieve its objectives.
To test the demoralization hypothesis, we used “teacher fixed effects” to compare how much each nonparticipating teacher’s students learned, on average, in the years before CP with how much, on average, the students learned after the teacher opted out of CP-sponsored PD. If the students learned less, on average, after their teachers opted out than did similar students taught before the CP, then it may be possible that resentful demoralization offset the positive effect of program participation. The “teacher fixed effects” approach uses each teacher “as his or her own control” by comparing the student test score gains of teachers from CP districts who did not participate in the intervention before and after the implementation of CP.
To test for demoralization, we ran three separate teacher fixed effect models with extensive controls. One model tested whether the students of nonparticipating teachers in academic year 2007–2008 did, on average, better or worse on the state reading and mathematics tests than the same teachers’ students in academic years 2005–2006 and 2006–2007. A second analysis was performed for nonparticipating teachers in academic year 2008–2009. The final analysis explored whether the students of teachers who did not participate in any Project sponsored PD in either year posted lower gains on the state tests than students taught by the teacher prior to the implementation of CP. If demoralization occurred, the student test score gains for nonparticipating teachers could have been expected to be lower than their average in the year the teachers chose not to participate. The results are presented in Table 4.
Teacher Demoralization Related to Nonparticipation.
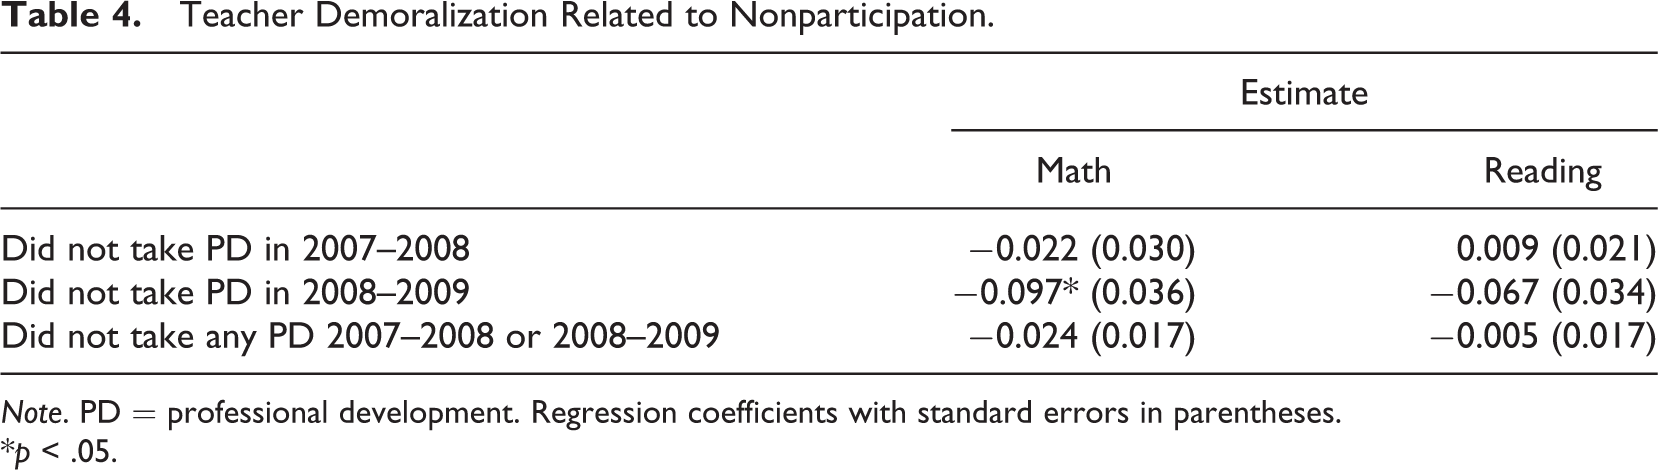
Note. PD = professional development. Regression coefficients with standard errors in parentheses.
*p < .05.
The findings in Table 4 show that student test score gains of nonparticipating teachers in the years following the implementation of CP were mostly statistically indistinguishable from the gains made by those teachers’ students in prior years. The students of the teachers who did not participate in PD in the second year of CP scored nearly 10% of a standard deviation unit lower in mathematics after CP than before, which could indicate resentful demoralization. However, given the relatively small fraction of these teachers in the sample, the results suggest that the overall effects may have been slightly attenuated by these teachers, but it is unlikely that the lack of overall effect was due to the demoralization of the nonparticipating teachers.
Tentatively, ruling out resentful demoralization of some teachers as the complete explanation for the overall lack of effect, we turned to the analysis of particular program components. Teachers were allowed to opt into different PD components and, therefore, exposed to different parts of the intervention leading to the question: Were certain PD experiences more beneficial than others?
Assessed Specific Program Components
In complex interventions with multiple components, participants can often choose to participate in some parts of the intervention but not others, leaving the exposure to the program components uneven across the target population. In our formative evaluation, the CP leaders wanted to know, “Which program components, if any, improved the target outcomes?” The components that positively affect outcomes may be offered more frequently or participants can be provided with encouragement or incentives to participate. In addition, their format and approach could be used as models of good practices for other PD workshops to emulate. In the case of the CP PD components, CP leaders indicated it was important to test to see which specific components were effective, if any, as well as to see if there were common characteristics of the effective PD components. It is also important to know which components were not associated with improved outcomes. Identification of ineffective components would have allowed evaluators and stakeholders to assess whether implementation flaws may have attenuated potential effects. The CP leaders told the evaluators that if they could be armed with information about more or less effective PD components, they could take ameliorative actions in the third year of the pilot, including increasing opportunities to participate in more effective PD experiences, offering other experiences with similar characteristics, and/or reducing, eliminating or improving less effective components.
The type of treatment effect being evaluated in this instance is often referred to as the TOT and even in the case of randomized experiments, where some participants assigned to treatment actually do not receive or accept the treatment and some member of the control group do get the treatment though other means, TOT effects can be difficult to accurately estimate and to interpret (Angrist, Imbens, & Rubin, 1996; Frangakis & Rubin, 2002).
In the formative outcome evaluation of the CP, we estimated the TOT effects of each of the program’s components (the afterschool programs, the various incentive payments, and the PD). To illustrate our approach, we will focus on PD. In this section, we tested whether teachers who participated in specific PD experiences sponsored by the CP raised student performance on the mathematics and reading EOG test scores. CP administrators contracted with multiple PD organizations in order to offer teachers a menu of PD opportunities that they vetted for quality. The PD offerings targeted elementary and middle schoolteachers of mathematics, beginning teachers, and candidates for certification by the National Board for Professional Teaching Standards. Many of the sessions were carried out over multiple consecutive days and/or included follow-up sessions and conformed to the best evidence about high-quality PD (Desimone, 2009; Desimone, Porter, Garet, Yoon, & Birman, 2002).
We looked at patterns of enrollment in PD sessions in order to create meaningful PD participation categories out of the complex set of offerings. Indicator variables were created based on the number of these sessions attended for each teacher: one single day session, two single day sessions, and three or four single day sessions. Each multiple day (intensive) PD experience was treated as distinct, and participation was measured with a separate indicator variable for each of the sessions.
For intensive PD offerings that included a follow-up session after the teachers had returned to the classroom and had the opportunity to apply what they learned in the session, each teacher was coded as taking the session or the session and the follow-up. For example, for a summer math workshop that offered follow-up opportunities, we coded separate indicator variables for participants who attend only the summer institute and for participants who attended both the summer institute and the follow-up. This allowed us to estimate teacher effectiveness in terms of changes student achievement gains of those who took the full “dose” of a PD experience as it had been designed and separately estimate teacher effectiveness changes for those who participated in a part of the experience.
In addition, since several of the multiple day sessions were explicitly geared toward improving instruction for specific populations (e.g., poor and/or students with special needs), we interacted an indicator variable for the targeted population (e.g., students with disabilities) with the appropriate PD participation indicator. Each of the groupings or subsets of PD sessions as defined in the descriptions above were placed into separate value-added models that included the PD indicator variables, students’ test scores from the prior year, and the covariates presented in the multilevel model of overall effects (see above). Very few PD sessions were offered prior to the 2007–2008 administration of achievement tests in the spring of 2008, so most of the estimates of effects were for 2008–2009, the second year of CP implementation but the analytical models included two preintervention years of data to which the 2008–2009 gains were compared.
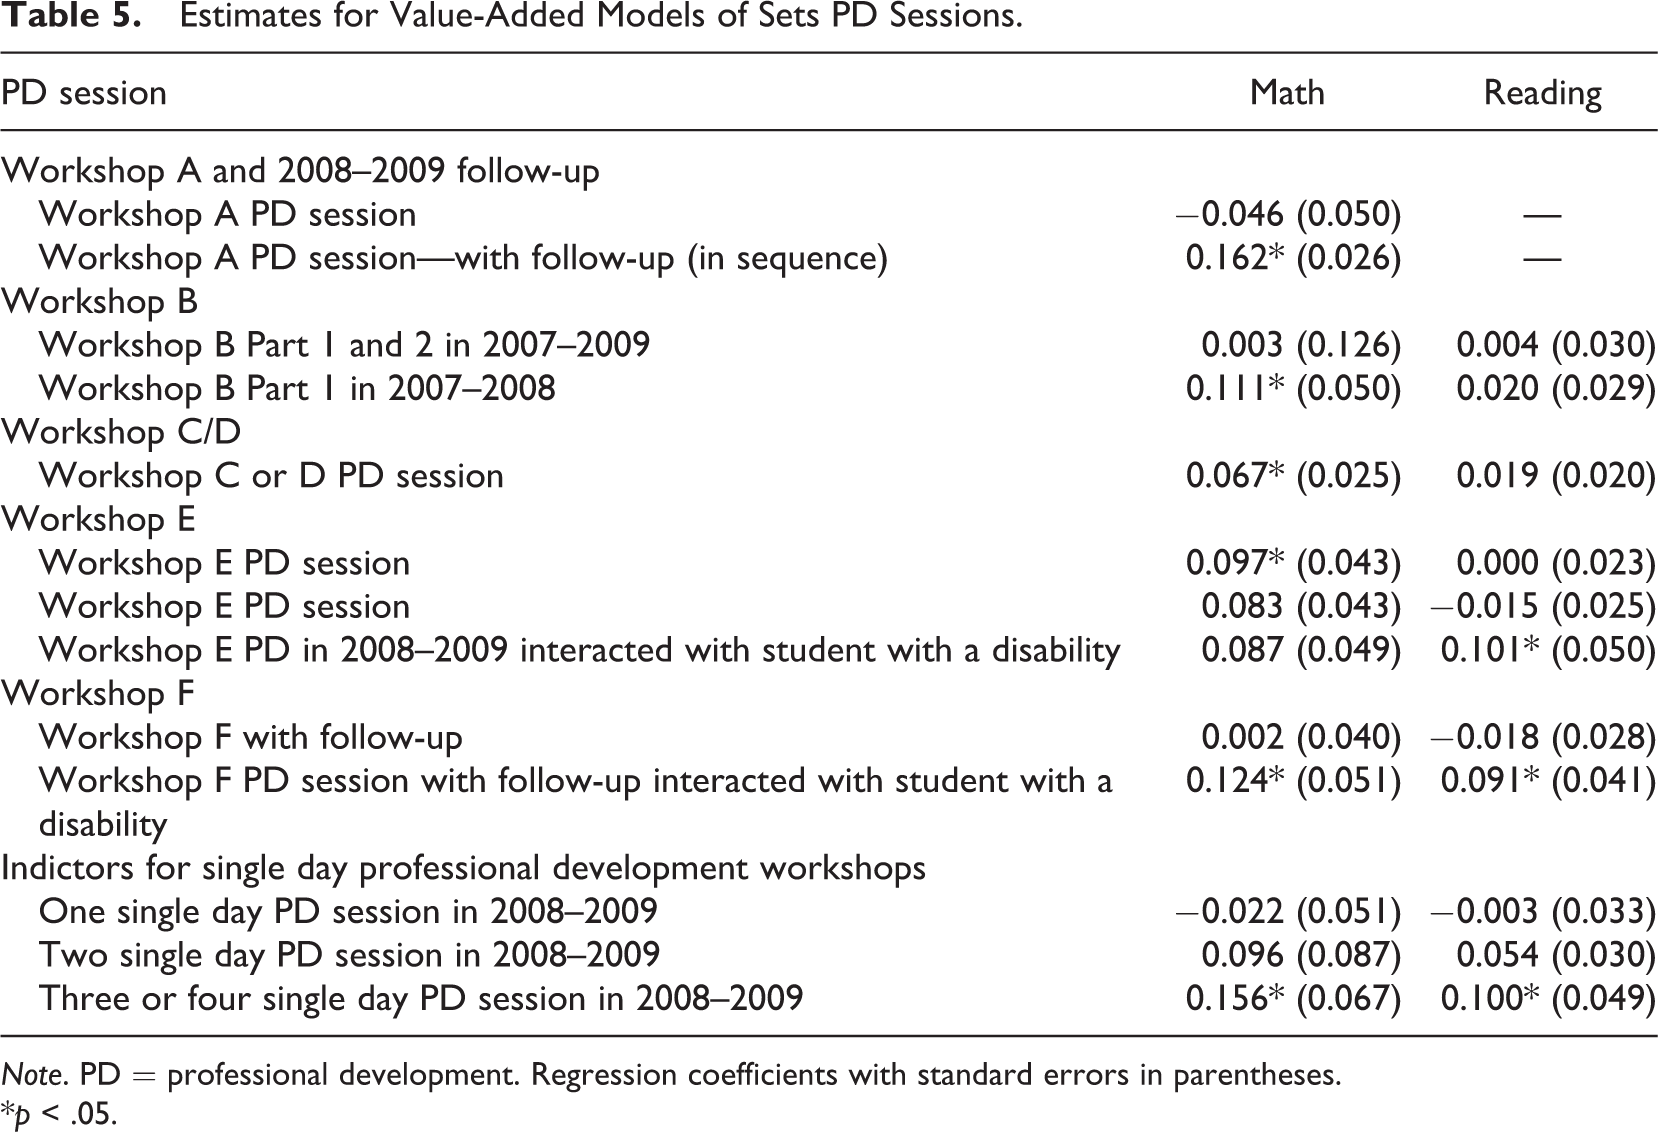
Despite no overall effect, the value-added models of the particular PD sessions indicated that some of the sessions may have led to gains in student achievement. 5 Table 5 presents the estimated effects for all of the sets of PD sessions that were associated with student achievement gains (sets of PD sessions that did not have statistically significant coefficients have been omitted from this presentation of findings). Gains in test scores for students who were taught by teachers who participated in six sets of PD activities offered through CP before the 2008–2009 assessment period were greater than the increases in scores of other, similar students in CP schools (see Table 5). Five of these sets of PD activities were associated with higher overall student gains on EOG tests. The effects sizes were on the whole modest but meaningful, ranging from 7% to 16% of a standard deviation unit.
Estimates for Value-Added Models of Sets PD Sessions.
Note. PD = professional development. Regression coefficients with standard errors in parentheses.
*p < .05.
Ruling Out an Alternative Explanation: Teacher Self-Selection
While the initial analyses presented above indicated that the teachers who participated in the six sets of PD sessions discussed above produced higher than expected student test scores, selection bias could explain these results if more effective teachers self-selected into these programs. It is possible that the most highly motivated teachers, or those who were otherwise more effective to begin with, were more prone to participate in specific sets of PD. If this happened, then the students’ test score gains could simply reflect the participation of better teachers in those sessions. Unfortunately, the value-added models assessing the differences between the teachers who participated in the sets of PD from teachers who did not participate did not rule out this type of selection bias.
Since a goal of the formative evaluation was to provide program administrators and staff with information that could lead to improving the program’s performance in the future, an additional analysis was formulated to rule out self-selection into specific sets of PD as an explanation of the apparent effects. An analysis that rules out self-selection as an explanation would provide a stronger causal warrant for the effects of specific types of PD and make it more likely that if similar types of PD (in terms of format and content goals) were taken by more teachers, the program could yield larger overall effects. Without this additional analysis, the formative evaluation may have conveyed the flawed notion that expanding participation in any of the workshops listed in Table 5 would likely boost student achievement, when in fact the PD may have simply attracted more effective teachers and not actually improved instruction or increased student test score gains.
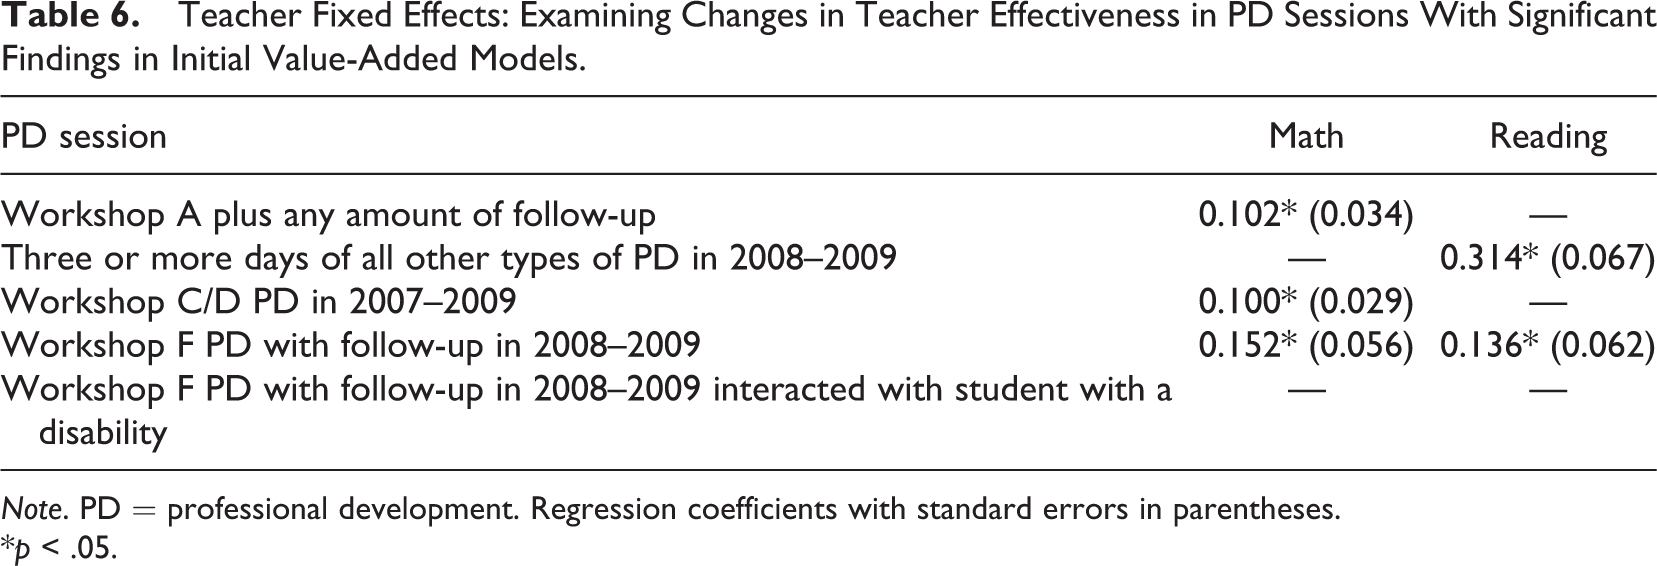
In order to address the potential self-selection bias, teacher fixed effects were brought to bear as we did for the assessment of resentful demoralization. In this case, we assessed whether an individual teacher was more effective with students after participating in a set of PD than he or she had been with students in the years before attending the PD. By using the teacher as his or her own control, the teacher fixed effects models take away teacher self-selection into the workshop as a cause of the positive effect estimates. Technically speaking, teacher fixed effects only control for all non-time varying teacher characteristics, such as innate ability, knowledge of the subject, or instructional methods. This leaves only things that changed between the previous years and the year after the PD had been experienced as potential explanations for any differences in teachers’ effectiveness.
For example, a teacher fixed effects analysis would not account for changes in the motivation of teachers. Had some previously ineffective teachers become more motivated in the year for which the effects were estimated and decided to improve their teaching by taking a specific PD offering among other things, the attribution of any improvement in these teachers’ students would be confounded. Using teacher fixed effects, we would be unable to disentangle any increase due attributed to PD participation from increased motivation. While it seems less plausible that a large number of relatively ineffective teachers would commit to and successfully improve their instruction, these analyses cannot eliminate the possibility. Of course, other things such as the other components of CP could have affected these teachers, but this explanation is less plausible since the previous analysis showed that participants in this set of PD were more effective than the teachers in the matched sample schools when overall the teachers in the CP schools had not been. Another potential rival explanation, regression artifact or regression to the mean, is rendered implausible by the use of multiple years of prior data. If only one prior year was used in the analysis, better test score gains in 2008–2009 year could be simply a return to average effectiveness after an anomalous poor prior year. Using 2 years of data prior to teachers participating in a PD workshop significantly reduces the plausibility of the regression to the mean explanation. A significant effect of a PD workshop using teacher fixed effects indicates that teachers’ effectiveness in the period after the intervention (2008–2009) is higher than their average effectiveness in years prior to the program (2005–2006 and 2006–2007).
If the result of the teacher fixed effects models suggested teachers’ students learned more, on average, after PD participation than did similar students the teachers taught before attending the PD, then it would seem increasingly reasonable to move closer to attributing the improvement to the educative effects of the PD activity rather than to other factors.
Using the teacher fixed effects approach for the sets of PD that were significant in the initial analysis presented in Table 5, we found that participation in four of the PD components continued to be associated with improved gains in students’ EOG test scores (see Table 6) and for these teacher self-selection could be ruled out as a plausible explanation of the previously observed effects. These effects were again modest to moderate, but meaningful in size and ranged from 10% to 31% of a standard deviation. Participation in two workshops were not found to be associated with higher test score gains after using the teacher fixed effects approach and therefore, we cannot definitely rule out teacher self-selection as a complete or partial explanation.
Teacher Fixed Effects: Examining Changes in Teacher Effectiveness in PD Sessions With Significant Findings in Initial Value-Added Models.
Note. PD = professional development. Regression coefficients with standard errors in parentheses.
*p < .05.
These analyses provided stakeholders with more nuanced, although not entirely airtight, information about the likely future effects of PD components. Teacher fixed effect models suffer from a type of sample bias (Henry, 2010). Specifically, teacher fixed effects models can only estimate the PD effects for teachers who taught students in a tested subject prior to taking the PD and after the PD. This effectively eliminates teachers who are just beginning or just began teaching in a tested grade or subject from the analysis. In all likelihood, this may increase the confidence that other factors such as on-the-job development was responsible for the effects and may have slightly attenuated the effects if PD has the larger effects on beginning teachers (Henry et al., 2011, 2012).
In addition, this analysis is still tentative, despite the steps to strengthen it from a causal perspective, because the teachers who took these particular sets of PD may have experienced other differences, such as being assigned students more likely to experience gains in test scores than they had been assigned before participating in the PD. We now present our investigation of the student assignment hypothesis.
Ruling Out an Alternative Explanation: Student Assignment
The teacher fixed effects results lent additional support for the causal explanation that participation in some workshops may have helped improve the instruction of teachers who participated. However, we still could not be certain that another type of change did not occur as a result of the CP and these teachers’ participation in it. Attendance in CP-sponsored PD may have led to preferential treatment by school administrators who assign class rolls. Specifically, these teachers may have been assigned students more likely to make gains, making it easier for the participating teachers to post gains in test scores after attending these sessions.
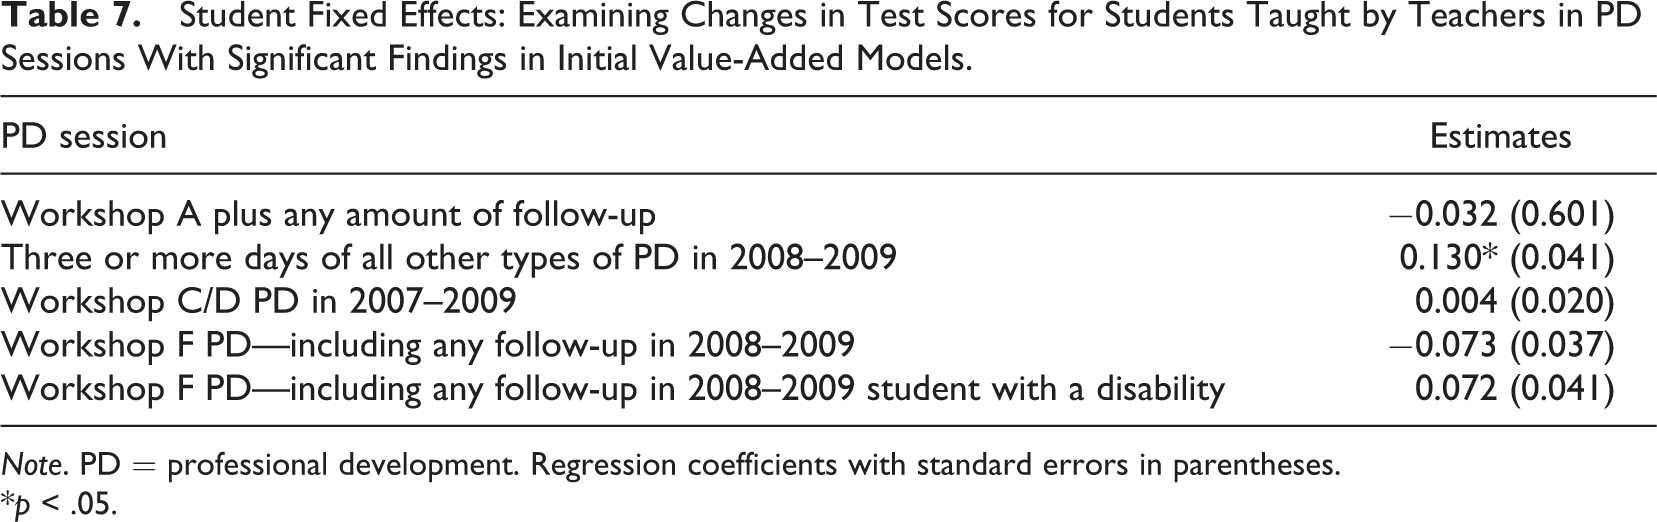
In order to assess whether an individual student performed better when taught by a teacher who participated in a set of PD that was shown to be associated with higher test score gains than they had with other teachers, we employed a student fixed effects model. The student fixed effects model compares how much each student learned, on average, in classes with a teacher who had participated in CP-sponsored PD to how much each student learned in classes with teachers who had not taken the PD. Student fixed effects are analogous to teacher fixed effects, comparing the within student variance in test scores and eliminating all non-time varying characteristics of the students as influences on the test scores. If a specific set of PD was successful in improving student learning gains, each student could be expected to learn more in a class with a PD participant teacher than they learned with their other teachers. But the lack of difference does not rule out actual effects, but without the additional test we cannot completely rule out student assignment differences as a source of some of the effect.
Overall, as we show in Table 7, it appears we could rule out student assignment as at least a partial cause for the significant findings for the participation in three or more days of PD. With respect to the four other PD workshops, we cannot say that students learned more in the year that they had a teacher who had participated in those workshops than they had learned in previous years. This finding does not tell us that the components did not actually improve teachers’ instructional effectiveness but that we cannot rule out changes in student assignment as at least a partial explanation for the previously observed effects.
Student Fixed Effects: Examining Changes in Test Scores for Students Taught by Teachers in PD Sessions With Significant Findings in Initial Value-Added Models.
Note. PD = professional development. Regression coefficients with standard errors in parentheses.
*p < .05.
Like the teacher fixed effects models, student fixed effects analyses also suffer from sample bias. Specifically, student fixed effects models only estimate the PD effects for students who took classes in tested grades prior to their teachers participating in the PD. This effectively eliminates from the estimate, among others, third-grade students in 2008–2009 (who have only one teacher of record) and 2008–2009 transfer students. After addressing most of the germane and plausible explanations for the apparent effects of specific sets of PD on teachers’ instruction and student achievement, the strongest case could be made that the effects of participation in 3 or more days of workshops were plausibly causal and a reasonably strong case could be made for Workshop A with follow-up, Workshop C or D, and Workshop F.
While, as we have mentioned above, no comparison group design provides an airtight causal estimate of program effects, in this case the CP leaders asked for the evaluation team’s best estimate of the effects of the program’s components. These steps have outlined our strategy for providing the information they requested and a strategy that others can follow or adapt to their own evaluation context for teasing out plausible causal effects. Identifying promising components by conducting a rigorous examination of the effects of specific aspects of a program can afford stakeholders the opportunity to make decisions and/or reallocate resources before summative decisions are made about a program’s merit and future.
Conclusion
The CP started as a 3-year pilot project to improve student learning gains in rural school districts as well as to attract and retain higher quality teachers through high-quality PD, incentives for teachers to improve students’ learning gains, participate in PD and encourage parental participation, and providing afterschool programs. The components of the CP addressed many of the common problems that are expressed by rural school administrators and the qualitative information collected indicated that the program did address the problems (Thompson et al., 2009). We present in this article the initial formative outcome evaluation findings after the first 2 years of the pilot and for only one of the program activities, PD. Thus, these findings are preliminary and partial, although thorough in attempting to find plausibly causal effects of specific program components.
At the end of the first 2 years of the pilot, we found no overall effect using an ITT estimate. For only one PD component—3 or 4 days of workshops—were we able to establish the strongest causal warrant using the treatment effect on the treated (TOT) estimate. Perhaps, the teachers who participated in 3 or 4 days of workshops selected them according to specific needs that they felt and effectively applied what they learned in terms of increasing student learning gains as measured by test scores. For three other PD components, the average treatment effect on the treated was meaningful in terms of size and the students of teachers who participated in these components all had higher test score gains than the students of these teachers prior to their participation in the PD. When this formative evaluation was completed, it was definitely too early to tell if the pilot program will produce the desired effects in terms of raising students’ test scores after 3 years. We did find in other parts of the formative evaluation that teacher retention may be increasing, which could be a positive sign if these teachers are making effective use of their training and more effective than the teachers who would have been hired to replace them.
Armed with this information, the CP program administrators began to consider if the provision of high-quality PD, using well-regarded providers and participant satisfaction as measures of quality, was entirely adequate. The CP administrators were especially eager to see if there was evidence supporting sustained PD with follow-up sessions, as they had prior experience, anecdotal evidence, and some indications from the research literature that these forms of PD were likely to be highly beneficial. With the results of this formative evaluation providing evidence that some of the workshops with follow-up were related to greater student learning, they began to consider refining the criteria for the type and format of the provision of profession development to include more extensive formats (lengthier sessions) and required follow-up; content aligned with school improvement goals or data-based deficiencies in students’ learning; and required collective participation of colleagues from the same school, based in part on other questions that the evaluation team had answered about the PD that was found to be effective. To be sure, improving student test score gains is not easily done and those who are willing to attempt reforms with those goals need information about the overall effectiveness of complex reform strategies as well as information that shows which components should be enhanced or increased and which efforts could be redirected toward interventions that could produce greater goals. And, importantly, they need this information while there is still time to bring about program improvement.
The formative outcome evaluation presented here is an illustration of an evaluation strategy that we believe should become more commonplace: combining existing, longitudinal, administrative data sets and a progression of analytical models to estimate effects and rule out alternative explanations for effects, or the lack of effects, formatively. The strategy is a useful and relatively low-cost approach for providing plausible information about the program’s preliminary effects while the program is being piloted and developed, especially when program developers have not implemented the program to take advantage of stronger causal design. As state agencies and other organizations move to collect this type of administrative data and make it available to evaluators, the evaluation community should develop tactics using the strategy outlined in this article to make the best possible use of the data for providing stakeholders with information during the development of the program. In addition, the data can be similarly marshaled for summative purposes and used to inform policy makers and the public after the program has had sufficient time to produce effects. We believe that value-added estimates of student test score gains, matched sampling using propensity scores, difference-in-difference identification approaches, and fixed effects techniques are all valuable procedures for evaluators to produce estimates that can be negligibly different than estimates from other rigorous evaluation designs when carefully implemented. These techniques and others are being developed, refined, and applied by those interested in reducing bias in and increase the plausibility of the causal estimates of program effects and should be used more frequently in formative as well as summative evaluation. While we cannot fully eliminate Type I errors—or finding a program effect when none exists, the progressive use of analyses tailored to account for forms of selection bias and alternative explanations could lead to better, more valid recommendations for program improvement while opportunities exist to make improvements.
Based upon this evaluation, we recommend that evaluators consider using quantitative design and analysis techniques that seem to more commonly have been reserved for summative impact studies to investigate preliminary program effects. Essential to using these resources is a strategy for testing and ruling out plausible alternative explanations. In addition to implementing this strategy, the data allow evaluators to address other issues by disaggregating the effects or describing the characteristics of participants and nonparticipants that can be useful to stakeholders. One potential danger of the approach is that formative outcome evaluation findings can be used to prematurely judge overall effects or the value of specific components, which simply have not had enough time for effects to be made evident or which have suffered from implementation flaws that may be correctible. Therefore, when adopting this strategy, it is important to avoid premature summative judgments about the overall effects or the effects of specific program components and clearly communicate the preliminary nature of the evidence as well as its value for program improvement purposes.
Footnotes
Appendix
The combined equation of the model used to estimate the overall effect of the Collaborative Project (CP) is:
The coefficient (β2) on the CP indicator variable estimates the average difference on student achievement (EOG test score growth) of being a student in the CP during all 4 years of data compared to students in the matched sample. The coefficients on the two postintervention year variables (coefficients β3 and β4) estimate any differences in the student test score growth in each of the two postintervention years that occurred in both the CP schools and the matched sample schools. The impact of the CP is estimated by coefficients on the year interactions with the CP indicator variable (coefficients β5 and β6).
Acknowledgments
We wish to recognize Jean Murphy, Alfred Mays, John Dornan, Sam Houston, and JoAnn Norris of the North Carolina Public School Forum for their contributions throughout the research and dissemination processes. In addition, we wish to acknowledge Charles L. Thompson, Laura Peck, and three anonymous reviewers for thoughtful comments on the article.
Authors’ Note
The authors assume responsibility for any errors in the report.
Declaration of Conflicting Interests
The author(s) declared no potential conflicts of interest with respect to the research, authorship, and/or publication of this article.
Funding
This research was partially funded by the Public School Forum of North Carolina.