
Abstract
Educational interventions are complex: Often they combine a diagnostic component (identifying student need) with a service component (ensuring appropriate educational resources are provided). This complexity raises challenges for program evaluation. These interventions, which we refer to as service mediation interventions, affect additional resources students receive that mediate the impact measured. Evaluations of these types of programs that solely report effects are potentially misleading. Cost-effectiveness analysis clarifies the importance of assessing service-mediated receipt for evaluation purposes. We illustrate our argument empirically from City Connects, a comprehensive student support intervention. We find that the direct costs of the program represent only one-third of the total change in resource use by program participants required to produce impacts. Evaluative statements of service mediation interventions should be accompanied by information on the full costs to achieve effects. Many interventions might be structured in this way and require evaluation that includes an economic perspective.
Keywords
Many policy interventions in education focus on program delivery, that is, providing educational instruction for students (e.g., Kindergarten Peer Assisted Learning Strategies, see McMaster, Fuchs, Fuchs, & Compton, 2005; or Building Blocks, see Clements & Sarama, 2007). In the language of causal evaluation, these are referred to as treatments and, accordingly, evaluations are designed to identify “treatment effects” (e.g., gains in reading comprehension at Grade 3). This identification is the main goal in the vast majority of evaluation research in education (Mark & Henry, 2006). Certainly, questions of efficiency and cost-effectiveness are recognized as important for policy makers and stakeholders (Rice, 1997; Ross, Barkaoui, & Scott, 2007). But the primary research question in evaluation is: Does the intervention improve educational outcomes? If the answer is affirmative, then an evaluation might proceed to determine whether the program passes an economic test (i.e., whether it is worth the cost). For ineffective interventions, an economic test is presumed to be unnecessary.
However, a large class of educational interventions includes components that are not strictly or simply program delivery treatments. Rather than providing a treatment that targets an outcome directly, these interventions are better described as service mediation interventions that have an effect through inducing behavior change and future service receipt among participants (see Baron & Kenny, 1986). We use the term service mediation intervention because the process of generating an outcome through induced services is similar to the concept of mediator variables in experimental and quasi-experimental research. Such interventions affect students directly; they do so by providing information, diagnosing a problem or assessing skill levels, referring or matching students to services, and arranging for service assignment and delivery. The full impact of the intervention is produced both by the direct effect and the induced change in service receipt. For these interventions, a straightforward impact evaluation based on the classic idea of a treatment may yield results with limited evidentiary value. Fundamentally, the intervention cannot be evaluated without an understanding of its complete consequences in terms of resource use.
In this article, we argue for more evaluations to explicitly address the issue of induced service participation among service mediation interventions. We begin by describing service mediation interventions. We emphasize that this terminology fits many classes of educational intervention and that it has critical implications for evaluation of such interventions. These implications are most clearly explained using an economic perspective. Next, we illustrate this argument using evidence for City Connects, a comprehensive student support service program for elementary and middle school students. Absent information on the induced service receipt due to City Connects, it is difficult to perform a complete evaluation. Finally, we conclude with lessons for education research on service mediation interventions.
Service Mediation Interventions
Increasingly, the language of empirical evaluation in education has moved toward that of the health sciences: Educational interventions have treatment effects that can be identified using experimental methods. For a large class of educational interventions, this may be an appropriate evaluative approach such that induced services can be ignored.
However, many policy interventions in education begin with a diagnosis of educational need. Students’ needs are first determined, and then students receive prescribed services. Thus, the intervention is a composite of two elements: needs determination, such as diagnosis, initial assessment, or placement rule, and service receipt. We refer to service receipt rather than “treatment”; in this context, the latter term is confusing because it elides the initial intervention with subsequent services. When an outcome is impacted by both the needs determination and services received, an evaluation that only considers the cost of diagnosis is therefore incomplete. Following an analogy with medical interventions, one treatment can often cause or lead to other treatments with the overall goal of improving health.
Service mediation interventions in education can be in the form of diagnosis or assessment, information, referral or assignment to services, tracking, service management, or some combination thereof. Interventions to change remedial education in college fall into the assessment and assignment categories: Students are placed into college-level courses or remedial classes according to a placement test or after completing a sequence of preenrollment success courses (see Scott-Clayton, Crosta, & Belfield, 2014). Grade retention interventions also fall into this class. Students are assessed and assigned a service without choice as to their receipt of service in order to progress.
There are many educational interventions that induce changes to the track a student will follow voluntarily. One prominent example is an intervention to simplify the Free Application for Federal Student Aid (FAFSA) college aid application process (Bettinger, Long, Oreopoulos, & Sanbonmatsu, 2012), and this intervention helps students to apply for college, which then induces attendance and progression in college. Another example is providing students with information and access to counseling that intends to increase college attainment (Castleman, Page, & Schooley, 2014). These two interventions influenced whether students went to college and what college they attended.
Changing a student’s educational trajectory may also be mediated through changes in family resources: For children enrolled in Head Start, one effect was that their parents spent more time helping their children learn both during and after Head Start (Gelber & Isen, 2013). Similarly, the positive impacts of the Chicago Parent Center early learning program may be attributable to enhanced parental school support (Reynolds, Ou, & Topitzes, 2004). Potentially, there are many educational interventions that involve tracking in this general sense: An effective intervention, even one that has ostensibly no long run consequences, may change the educational resources a student receives in subsequent grades.
Some service mediation interventions are more complex, involving assessment, referral, information, some service provision, and management of service receipt. In an example from our case study below, City Connects explicitly diagnoses student need, refers students to the most appropriate student support service, manages student support services, and provides some information and services to students directly.
There are several key implications for evaluation research when interventions include a significant diagnostic or service mediator component. The primary implication is that the impact of the intervention is the sum of the diagnosis and service receipt. The impact of a new placement test depends not only on the test, but the type of remedial services received based on the test result. The impact of a grade retention policy depends on both whether the student is retained in grade and what services are received by retained versus nonretained students. Simplifying FAFSA application and identifying available aid will change service receipt, that is, the college at which the student enrolls.
Hence, it is not possible to disentangle the impact attributable to the intervention from the impact attributable to service receipt. It is critical that this service change is measured. For example, a preschool program may be found to increase earnings in adulthood (Chetty et al., 2011). If this effect is mediated through increased resources (e.g., if the preschooler is then tracked into a higher quality school or if the parents devote more time to their child), then the earnings outcome reflects two so-called treatments: preschool and the change in K–12 or family resources.
Potentially, service mediator programs might actually save on service receipt in the long run. The additional cost of the intervention might be more than offset by reduced service receipt posttreatment, leading to lower resource use overall. Interventions to improve assignment to remediation have in fact served to reduce the number of students in remediation (Scott-Clayton et al., 2014). Similarly, interventions provided in early childhood reduced later placement in special education (Muschkin, Ladd, & Dodge, 2015). In this case, a program with no direct effect on learning outcomes might be justified purely in resource terms.
Potentially, the need to consider service receipt should be evident if an evaluation has a clear theory of change. However, we believe this argument is most clearly illustrated using an economic framework. In cost-effectiveness analysis, an intervention is evaluated according to the change in effectiveness per extra dollar spent (Levin & McEwan, 2001):

So, for a treatment costing US$1,000 over business as usual with an incremental effect size gain in achievement of 0.5 standard deviations, the cost-effectiveness ratio equals US$2,000 per standard deviation increase. However, if that treatment also induced a change in services received of +US$3,000 prior to the measurement of the outcome to be effective, the cost-effectiveness ratio would equal US$8,000 per standard deviation increase (=4,000/0.5). The change in service receipt has altered the findings by a sizeable magnitude. Essentially, the extent to which the findings are altered depends on the costs of the change in service receipt. 1
The above logic also applies intuitively for impact evaluations. Generally, an intervention with an achievement gain of 0.5 standard deviations is described as having a “moderate-to-large” effect (Durlak, 2009). However, this “moderate-to-large” effect is misleading if the intervention is underestimated in magnitude by a factor of 3 (diagnosis plus service receipt). Without information on the change in service receipt, evidence on impact has limited evidentiary value. Equally importantly, it may be that the services received by the student generate the achievement gain; in this case, although the service mediation intervention is important for receiving services, it is the services themselves that are effective. Increasingly, evaluators are emphasizing the need to understand how interventions work as much as if they work; Ludwig, Kling, and Mullainathan (2011) make a powerful argument for focusing on policy mechanisms. However, these arguments are purely about effectiveness and do not rely on an economic framework. Consequently, they do not provide information as to how misleading the initial evaluation is.
These issues closely relate to the economic concept of additionality, commonly employed in environmental economics, and referring to the “extra” that is produced as a result of an intervention with regard to costs and effects (Gillenwater, 2012). This concept is closely linked to the economic evaluation of service mediation interventions such as City Connects in two important respects: One is the need to understand the counterfactual condition to capture what is incremental, and the other is to capture not just direct effects of an intervention but also indirect effects caused by induced services, behavioral responses, and other causal effects due to an intervention placing participants on a different pathway than nonparticipants. 2
In summary, there are potentially many educational service mediation interventions with a substantial diagnostic component or that induce a change in educational services. Impact evaluations of these interventions are incomplete unless they fully describe and measure this change in services. Thus, estimating the size in the change in services postintervention through an economic framework provides a bound on the potential error that could arise in omitting these services from an evaluation. We illustrate this issue with an economic evaluation of City Connects.
The Example of City Connects
Research has long established that out-of-school factors, such as physical and mental health, family support, and social and emotional development, significantly affect student learning (Berliner, 2009). Students in high-poverty neighborhoods often face out-of-school factors that impede learning for a variety of reasons including limited school and family resources, higher stress, and less predictable support systems (Dearing, 2008; Rothstein, 2010). Increasingly, schools are drawing on student support services provided by external agencies or community organizations. In many schools, these support services are provided in fragmented ways that lack comprehensiveness and do not address the needs of all students or engage teachers in a way that is deeply embedded in the academic mission of the school (Walsh & DePaul, 2008). Instead, students access support services in an uncoordinated way with little initial guidance as to which services are optimal.
The City Connects program addresses this issue. This program, developed at Boston College, aims to help students by designing an individualized set of services to address their academic, social/emotional, family, and health needs. The program intends to assist schools by partnering with community agencies and service providers and streamlining student support referral and management to make the process of providing comprehensive approaches to supporting student learning more strategic and efficient.
The program enlists on-site school site coordinators (SSCs) who begin the school year by working with the school to evaluate every student in four major life areas: academics, social and emotional skills, health, and family. When necessary, children are referred for more intensive follow-up or evaluation. SSCs then work with the school, families, and organizations in the community to refer children to services that target individual needs comprehensively and cohesively, to monitor student progress, and to reassess students as needed throughout the year. SSCs, who tend to be social workers, are integrated into the wider effort of student support and youth development work at the schools they serve. They participate in student support team meetings and provide counseling and crisis intervention support services to students in collaboration with the school administration.
While it is conventional for schools to identify and seek specific services for children with obvious or dire needs, schools rarely screen all children for the full range of academic, health, emotional, and family strengths and needs. In contrast, the City Connects program does this systematically, engaging in greater efficiency of process and with less likelihood of overlooking a student need. The types of services students receive include: prevention and enrichment such as tutoring or physical education; early intervention, for example, mentoring programs, dental care, community-provided clothes and supplies; and more intensive services that may include psychological services or medical assistance.
The majority of students served by the program are referred to early-intervention services (47% of services) or prevention and enrichment services (44%), with relatively few students (8%) receiving intensive services. Students can receive more than one service, with students receiving an average of 5.7 services each. The most common services were athletic programs, arts and academic enrichment programs, and after-school or summer programs (City Connects Progress Report, 2014). Prior research provides evidence that City Connects—through more appropriate assignment to student support services—has positive effects on academic achievement (Walsh, Madaus, et al., 2014), and the program was also found to reduce high school dropout rates and potentially improve social and emotional outcomes, health knowledge, and behaviors (City Connects Progress Report, 2014).
Critically, City Connects focuses mainly on assessing students, matching students to services, and managing student progress. Hence, it is most appropriate to classify the program primarily as diagnostic. In practice, the program does provide some services directly, but all services flow from the diagnostic component. Here, the intervention, the schools, and the treatment organizations in the community work together to achieve improved student outcomes in achievement and attainment (City Connects Progress Report, 2014; Walsh, Lee-St. John, Raczek, Foley, & Madaus, 2014; Walsh, Madaus, et al., 2014). The role of City Connects is to diagnose and then assign students to the appropriate support services. Understanding the complexity of this intervention is critical for evaluation. City Connects should diagnose students as requiring a different array of services than those typically offered in school programs. Clearly, if it overlaps by diagnosing the same services, it will obviously have no effect unless it does so more effectively.
From an economic perspective, at issue is whether these different services are more or less expensive than business-as-usual. Because many schools are attempting to refer students for support services without sufficient resources to properly assess students and to match them with appropriate services, the intervention has the potential to lower the cost of providing school-based comprehensive support services. Students might have been receiving services they did not need or ones that were not as effective; also service coordination may be improved or transaction costs for the school and the service organization may be lower. Alternatively, City Connects could lead to increased service costs (and possibly greater effectiveness) if more accurate diagnosis leads to greater discovery of symptoms or conditions that require support; and community partner interviewees stated that their links to schools were now more efficient (Weintraub, 2014). Regardless of the direction of effect, it is critical that any gains in effectiveness are interpreted in light of the change in services. If City Connects reduces service costs, it may pay for itself independently of any measured effectiveness. If City Connects increases service costs, any gains in effectiveness must be adjusted to reflect the impact of these services.
Estimating the Costs of City Connects
Here, we illustrate the importance of evaluating City Connects as a service mediation intervention. First, we estimate the costs of delivering City Connects—the core costs of the program itself. Next, we estimate the costs of services that City Connects may influence. Finally, we demonstrate how costs and effects together provide useful information to evaluate City Connects as a service mediation intervention.
City Connects illuminates some of the complexities of service mediation interventions described above, especially regarding resources received via induced services and the issue of precisely identifying resources that were incremental to the counterfactual in a retrospective evaluation. Note that, given data limitations, performing an economic evaluation in practice requires simplifying assumptions. We note these assumptions and their potential implications for the analysis below. We close with guidance for evaluators on how data collection and analysis can be improved in future studies to more fully capture the complexity of service mediation interventions.
Method
Cost estimates were calculated for two school sites in Boston. These sites were selected based on the following criteria: Sites were long-term implementers of City Connects, from different geographic areas within the city, and available for site visits by the study team. Both sites are large elementary schools, with more than 700 students, serving mostly minority students, who are from low-income families, many who have limited English proficiency. Table 1 provides demographic characteristics of the two sites in comparison with all City Connects schools and all elementary schools in Boston. 3 The sample schools have relatively high proportions of English language learners, but otherwise have similar demographics relative to the other two groups.
Demographic Characteristics of Elementary Schools in Boston, City Connects, and the Pilot Sample.
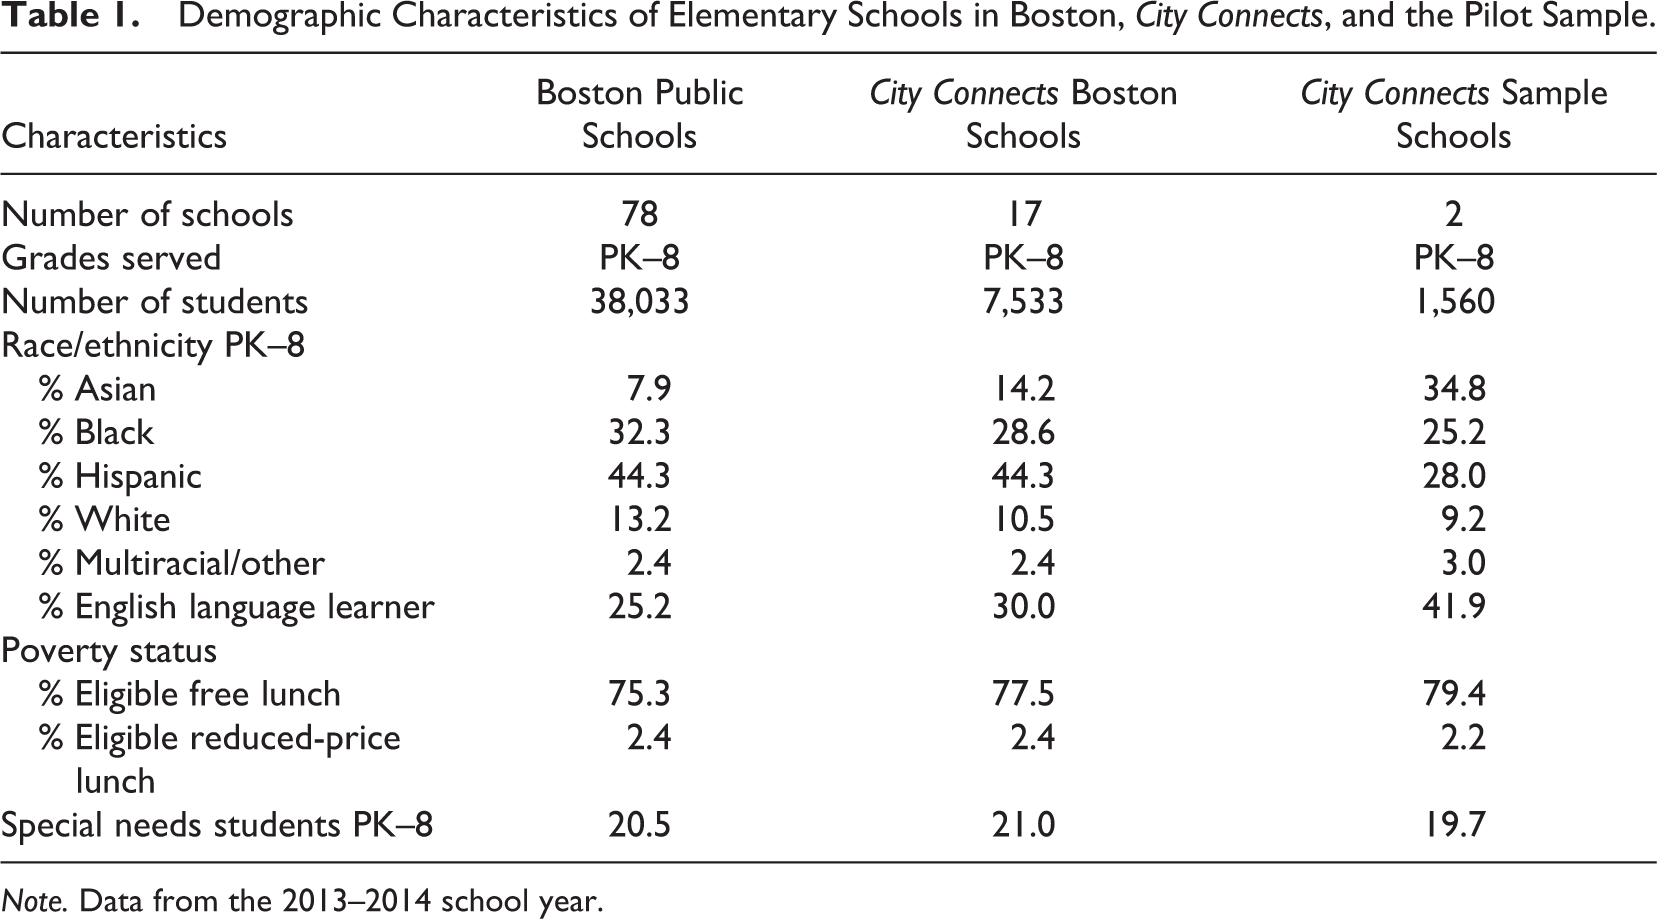
Note. Data from the 2013–2014 school year.
Costs were calculated for both the core City Connects program and the related service costs. At these schools, there is a pool of approximately 70 service providers. Within each school site, five external service providers from the community (“community partners”) were selected from this pool. The selection was based on the category of services provided, the intensity of the service, the number of students served, and the anticipated change in costs if student numbers change. The sample of community partners provided a range of services such as tutoring; mentoring; behavioral support; health interventions; or the provision of needed materials such as books, coats, and backpacks. The costs for the sampled community partners at each school site were then generalized to all community partners at that school using the distribution of the number of service referrals across the community partners. Details on the sample sites, the interview templates, resource use, and prices of ingredients are available in the report available at www.cbcse.org. Cost data are available from the authors.
Data collection and cost estimation follow the ingredients method (Levin, 1975). This approach is widely recognized for its accuracy and authenticity because it encompasses all resources or ingredients utilized in implementing a program based on the economic principle of opportunity cost (Levin & McEwan, 2001). After reviewing the details of the program in documents and with the developers, we collected data on the ingredients needed to implement the program (core and services) via interviews with program personnel. These interviews relied on a template interview with semi-structured questions. We measured ingredients utilized during the 2013–2014 school year to implement City Connects as well as the ingredients used by the sample of community partners. All ingredients were matched with average prices in the Boston metropolitan area in 2013 U.S. dollars. These were average prices and not the specific prices each school faced. Either general or specific prices can be used, as appropriate, although in our case, there is little difference between the two approaches. In theory, although there may be geographical differences in ingredient prices within Boston, such variations do not affect the ingredients that constitute the bulk of costs (predominantly personnel) and thus should not appreciably alter the results of the analysis. For instance, the time devoted by a classroom teacher would have the same price, regardless of the specific location within Boston, and the cost of public transportation is uniform across the city. One ingredient that may have substantially different prices across Boston is the office space for the community partners, as commercial rentals can vary substantially for different locations. However, only a small portion of community partners’ office space is considered incremental to the program, and space is not a large component of program cost relative to personnel causing minimum impact on overall cost estimates.
We calculate three models of the costs of core and service costs. In all three models, we assume that any services provided by schools themselves are consistent across treatment and comparison schools, before and after City Connects, and therefore are not included.
Cost Model 1
The cost estimate in Model 1 assumes that students in comparison schools receive equal amounts of services from community partners as students in City Connects schools, that is, there is zero contrast in service receipt. Thus, the only costs required to correspond to the effects would be the core costs of City Connects. Implicitly, any program effects would be due solely to the City Connects program, likely through specialized training for personnel, better identification of service need, better matching of services to students, collaboration with service providers and school staff, case management, and other school-based support. Based on interviews, there was some empirical support for this model: Several community partners indicated that they served similar numbers of students at City Connects sites and other schools in Boston, or that the program served similar numbers of students at the school sites before City Connects was affiliated with the school. Further, several partner services claimed to have very low variable costs relative to their fixed costs, implying excess program capacity, so that the marginal cost of serving one additional student would be low. Thus, the implication of this model is that any measured effects of City Connects are due to more efficient allocation of services through improved diagnosis and placement.
Cost Model 2
The second cost model attributes the full cost of community partner services for children in the two schools to City Connects. In this estimate, both the core costs of City Connects and the costs of community partner services are considered incremental to the comparison group or “business as usual.” This is an extreme estimate and assumes that the only way schools receive community partner services is through the relationship with City Connects. In this strict sense, this model is an upper bound: Students in comparison schools do receive community partner services and so have some positive service costs. However, this estimate is useful for sensitivity testing. It is also useful for considering replication or scale-up in new locations: If the program were to be replicated in a setting where schools do not commonly engage in partnerships with community organizations or the capacity of community partners to serve students is limited, the total cost of City Connects may need to include the costs of community partner services to reflect the true cost needed to replicate the impact of the program.
Cost Model 3
The third cost model includes the core City Connects costs and an estimate of the expected increase in community partner services. This model appears to be the most reasonable, given the diagnostic function of City Connects; at issue is the magnitude of the change in service (also known as the treatment contrast). We interviewed program directors at the community partner organizations to determine whether any of the costs of community partner services should be attributed to the impacts of City Connects. A contrast in service caused by City Connects might occur if there are shifted resources from comparison schools to City Connects due to the program, an exclusive relationship with City Connects, or an expansion of services due to the program. However, detailed data on service usage were not available from the comparison schools. Representatives from sampled community partners were asked if they served only City Connects schools or if they served all Boston public schools. They were also asked to describe the services and relationship with the two types of schools. These interviews indicated that some partners served City Connects schools exclusively and some partners served City Connects schools and other schools differentially usually in terms of service intensity and resource utilization. This information was converted to a percentage of incremental cost for each sampled partner. The sum of sampled partners’ cost, weighted by the incremental share, is then extrapolated to total costs imposed by the City Connects schools for all partners by dividing it by the share of services for the sample partners together.
The average share of service costs that are incremental from City Connects varied significantly across sites. Weighted by the amount and cost of services, incremental service costs are estimated at 70% at Site 1 and 32% at Site 2. Thus, at Site 1, City Connects is a (core) diagnostic program plus entailing an additional 233% (70/30) more resources from community partners; at Site 2, City Connects is a (core) diagnostic program plus 47% (32/68) more community partner services. Critically, an evaluation of City Connects cannot be performed without considering these changes in service use.
Costs of City Connects
Table 2 shows the core cost of City Connects expressed as present value (PV) in the base year of kindergarten and accounting for 6 years of participation during kindergarten through Grade 5. The average core cost is US$1,540 per student. The core costs do not vary substantially across the two sites in our sample. Both sites had two SSCs, equivalent support from the central program office, and similar numbers of teachers participating in the whole class review process. The difference shown in the site-level per student costs is due to similar fixed costs that are divided over different numbers of students enrolled in each school.
Present Value (PV) Core Costs of City Connects by Site.

Note. Core costs based on 6 years of participation (Walsh, Lee-St. John, et al., 2014; Walsh, Madaus, et al., 2014), discounted back to kindergarten using 3.5% discount rate, expressed in constant 2013 dollars using Boston average prices. Pooled cost per student weighted by total number of students served in 2013–2014.
The ingredients of the core City Connects program are categorized into personnel, materials, and facilities. As shown in Table 3, the category of personnel is the main source of costs for the program. Items such as computers, desks, Internet, and printers were included as materials. Facilities included City Connects office space, classrooms and other school space for whole class reviews, and space for other activities.
Distribution of Core Costs of City Connects in Boston.
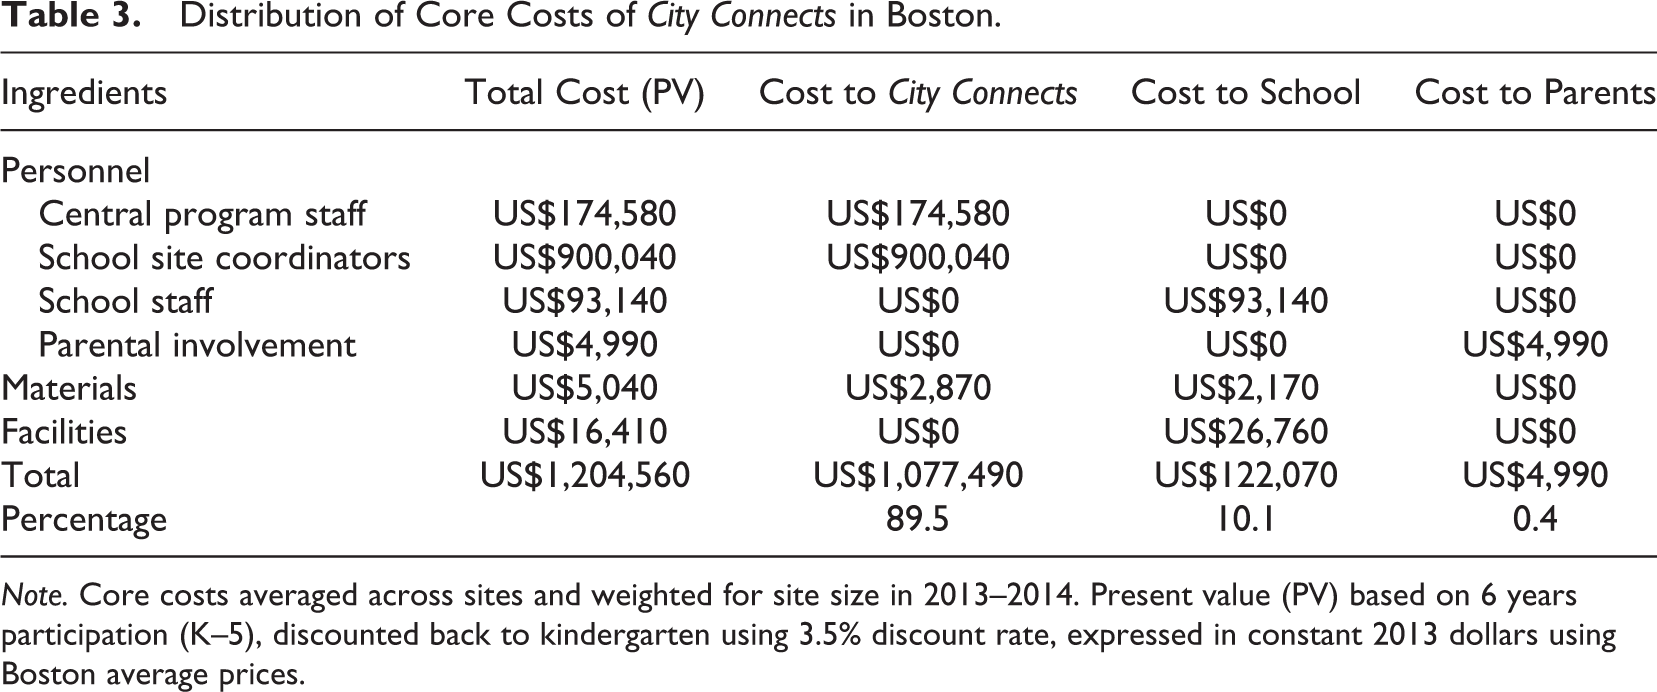
Note. Core costs averaged across sites and weighted for site size in 2013–2014. Present value (PV) based on 6 years participation (K–5), discounted back to kindergarten using 3.5% discount rate, expressed in constant 2013 dollars using Boston average prices.
City Connects relies on ingredients or resources from three main sources: the City Connects central program, the schools and school district, and students’ parents. As shown in Table 3, most of the core costs of City Connects (89.5%) were borne by the City Connects central program for the SSCs, time contributed by central program staff, and some computers and database materials. The schools financed 10% of the core costs of the program. The costs to the school included teacher time for the whole class review, principal time, office space for the SSCs and other space to serve students, and some office materials such as desks. A small 0.4% of the core costs of City Connects were provided by parents.
Table 4 presents the discounted total and per student costs at kindergarten for community partners, extrapolated from the sampled partner costs, at two school sites. On average, the services cost US$7,530 per student for 6 years of program participation. However, large variations existed among sites in terms of per student cost, largely due to differences in the types of services provided (per student costs for sampled services ranged from US$460 to over US$18,000). Ingredients costs also varied: One-on-one tutoring or mentoring services have high variable costs based upon additional student participants because personnel and facilities comprise the majority of costs and other services have higher costs in the category of materials (e.g., donated backpacks, books, and clothes). Given the large variations in community partner costs, we expect total cost estimates for City Connects to have more site-level variability in Models 2 and 3, where service costs are added to core costs, compared to Model 1. Also, sites may utilize different, rather than more, services—causing further variation in costs. Note that the high level of variability in induced service costs by site may be in part an artifact of the small sample of partners selected at each site; the pooled estimate, with a proportionally larger sample of community partners across the entire program, may be more representative.
Service Costs by Community Partners.

Note. Extrapolated from sampled services to full service costs based on sample share of total services. Present value based on 6 years participation (K–5), discounted back to kindergarten using 3.5% discount rate, expressed in constant 2013 dollars using Boston average prices. Geographic differences in prices within Boston would minimally affect community partners’ costs. Pooled estimate assumes sites are independent and weights for differences in site size.
Table 5 presents results for the three cost models. Under Model 1, the lower-bound estimate of the total program costs, the PV cost of City Connects at kindergarten is US$1,540 per student for 6 years of participation. In this scenario, the cost to replicate the impact of City Connects is represented by the core costs of the program and greater efficiency in screening and program matching of City Connects than in comparison schools. Under Model 2, the PV cost per student is the sum of core and service costs, that is, US$9,070. In this scenario, core costs are one sixth of the total cost of the intervention. Finally, under Model 3, the estimated total cost is US$4,570 per student for 6 years of participation. This is the expected cost based on information about the services received at City Connects schools. In this model, core costs are one third of the total cost of the intervention.
Total Cost of City Connects.

Note. Present value based on 6 years participation (K–5), discounted to kindergarten using 3.5% discount rate, expressed in constant 2013 dollars using Boston average prices. Model 1 (lower bound estimates) assumes community partners served City Connects and other schools equally. Model 2 (upper bound estimates) assumes community partners served City Connects schools exclusively. Model 3 (preferred estimates) incorporates a percentage of community partners’ costs based on partners’ self-reported service difference between City Connects and other schools. Cost estimate A includes school staff support team costs. Cost estimate B uses higher price for volunteer time ingredients (based on experience).
Model 3 is the preferred specification, but the costs estimates need refinement. Specifically, data are needed on service usage at comparison schools that do not receive City Connects; also, a larger sample of schools and community partners is needed. Nevertheless, City Connects appears to significantly increase service use by at least a factor of three over the core costs of the program. Also, whereas the core costs of the program appear to have low variance, this is not true for service costs. Our findings indicate that the core costs of City Connects are unlikely to vary considerably across sites, mitigating concerns about the small sample of sites and potential lack of representativeness. However, community partner costs may vary across neighborhoods and the population of students served. A wider sample is therefore needed to more precisely identify service costs. These factors—control group costs and variance in costs—are important to consider in an overall evaluation of the program.
Consideration of Induced Costs in Evaluating City Connects
A primary approach in evaluation is to identify a measure of effectiveness to see if the program yields improved outcomes. As noted above, Walsh, Madaus, et al. (2014) identified a significant gain in academic achievement from City Connects. Based on their estimates, City Connects yields an average gain in achievement of 0.39 standard deviations in English language arts and mathematics (Walsh, Madaus, et al., 2014, table 7). This gain is in eighth grade after delivery of City Connects in Grades K–5; therefore, this achievement gain is after participation in a service mediation intervention and receipt of services. According to Durlak (2009), this gain would be considered close to a “moderate to large” effect. For our purposes, we assume these gains are measured precisely and are not heterogeneous across student groups. Certainly, both variability and heterogeneity of treatment effects will change the results and potentially the analytical approach with respect to the distribution of the cost-effectiveness ratio (see Briggs et al., 2012). At issue here is how to interpret this result in light of the evidence on costs as reported in Table 5.
Cost-effectiveness analysis provides a method for this type of economic evaluation. While City Connects and similar programs that provide student support services have myriad effects, cost-effectiveness analysis is limited to calculating costs per unit of outcome along a single dimension. In this case example, we utilize test scores measured at one point in time. Future evaluations should causally measure the values of effects on all outcomes that should be incorporated in an economic framework, such as benefit–cost analysis. This is important so that the costs and effects from the same implementation correspond to one another (Harris, 2009; Levin & Belfield, 2015).
The cost-effectiveness results that combine each potential service mediation cost model with the impacts on achievement are given in the top panel of Table 6. Here, the effects were measured previously, and the costs are shown to vary due to the necessity of relying on assumptions regarding the incremental nature of the services induced by the program. Future evaluations of service mediation interventions should carefully consider the theory of change in measuring costs and effects from both treatment and control groups to avoid this uncertainty.
Economic Evaluation of City Connects.

Note. Present value at kindergarten using 3.5% discount rate in 2013 dollars and rounded to the nearest 10.
aEffectiveness measure average of effect sizes on eighth grade English language arts and mathematics from Walsh, Madaus, et al. (2014, table 7).
When only City Connects core services are considered as per Cost Model 1, City Connects yields gains in achievement at a rate of US$3,950 per standard deviation gain. However, the cost-effectiveness ratio may be US$23,260 if all core and service costs are considered as per Cost Model 2. Using the preferred specification with estimated induced costs, the cost-effectiveness ratio of City Connects is US$11,720 per standard deviation gain in student achievement.
Without alternative programs or policies against which to compare these ratios or an assessment of the social willingness to pay for test score gains, adjudicating on cost-effectiveness is difficult. Overall, evaluating City Connects is very imprecise absent information about the level of both core and service costs utilized to produce impacts. Possibly, one might expect that as the costs increase, so would effectiveness: More expensive programs should be more effective. But this cannot be guaranteed, and indeed one motive for evaluation is to find the effective ways of delivering programs. Nevertheless, even without a clear benchmark by which to evaluate whether the positive incremental costs of City Connects are worthwhile, this analysis provides insight into potential mechanisms by which the program can operationalize its theory of change as well as bounds on estimates of the program’s economic efficiency. This information is useful in the continued development, expansion, and evaluation of the program.
Conclusions
Many educational interventions involve sequential changes for students: A service mediation intervention begins with a diagnosis of educational need and proceeds to overtly assign, refer, or implicitly track students into receipt of new services. As such, evaluation of these interventions requires knowledge not only of the service mediation intervention but also of the implications for service use required to achieve the measured impact. This knowledge is essential for economic analysis, but it is also, we argue, critical for evaluations that rely on effectiveness measures. In fact, absent an economic analysis of service receipt, it is difficult to disentangle the effectiveness of an intervention from its further educational consequences.
In our illustration for City Connects, the impact of the intervention is especially difficult to disentangle direct effects and service-mediated effects: Changes in service receipt are substantially larger than the core costs of the intervention itself. The effect of City Connects cannot be examined without looking at how the program changes the education that participants subsequently receive. As a service mediation intervention, City Connects illustrates this argument most clearly. However, the distortion may be equally salient for other less explicit diagnostic interventions. Any interventions that have either durable effects or involve expensive induced resources fall into this class. Both factors increase the relative importance of service costs, such that these interventions might have service/core ratios that are as large as or larger than for City Connects. Moreover, this factor depends on how effective the intervention is. Critically, it is possible that the service cost change will be negative. Some students might be discouraged from college if given information on the dropout rate; students who benefit from an intervention may receive subsequently fewer special education services. In these scenarios, an intervention might save resources, making its impact on learning outcomes less relevant.
We do not claim that all educational interventions have service-mediated components. Many interventions are simply treatments, for which existing evaluative approaches are valid. Nevertheless, a sizeable proportion of interventions do have this feature and as such should apply an evaluative approach that correctly defines the theory of change and examines subsequent service receipt to estimate costs and effects.
Also, we do not claim that cost-effectiveness analysis is itself without challenges. It requires that each program is represented by a single measure of effectiveness; and cost-effectiveness ratios may be hard to interpret not least because statistical significance testing is difficult to apply. Also, the researcher must collect additional data over time on both the resources for diagnosis and service receipt to perform such analysis. These data should be collected using the ingredients method based on an appropriate sampling frame. In order to best interpret and design evaluations of service mediation interventions, any induced services received postintervention and prior to the measurement of the outcome of interest must be accounted for in explaining the effect and in estimating the cost of achieving that effect.
Footnotes
Declaration of Conflicting Interests
The author(s) declared no potential conflicts of interest with respect to the research, authorship, and/or publication of this article.
Funding
The author(s) disclosed receipt of the following financial support for the research, authorship, and/or publication of this article: We gratefully acknowledge funding for the benefit-cost analysis of City Connects from the GHR Foundation and appreciate the collaborative partnership with the City Connects team at Boston College.