



Abstract
More evaluators have anchored their work in equity-focused, culturally responsive, and social justice ideals. Although we have a sense of approaches that guide evaluators as to how they should attend to culture, diversity, equity, and inclusion (DEI), we have not yet established an empirical understanding of how evaluators measure DEI. In this article, we report an examination of how evaluators and principal investigators (PIs) funded by the National Science Foundation's Advanced Technological Education (ATE) program define and measure DEI within their projects. Evaluators gathered the most evidence related to diversity and less evidence related to equity and inclusion. On average, PIs’ projects engaged in activities designed to increase DEI, with the highest focus on diversity. We believe there continues to be room for improvement and implore the movement of engagement with these important topics from the margins to the center of our field's education, theory, and practice.
Over the course of the past few years, the landscape of the field of evaluation has dramatically changed. The brutal murder of George Floyd on May 25, 2020, by Minneapolis police officers has powerfully ushered in an era of increased awareness of and attention to racism, prejudice, and discrimination in our field. There has been a flurry of anti-racist seminars, equity presentations, and new interpretations of culturally responsive and equity-focused approaches to evaluation. Although social justice-oriented evaluation is not new (Mertens & Wilson, 2018), the past few years point to a renewed interest in these value commitments by evaluators and our field. Such interest would suggest that perhaps some in our field have not been explicitly attending to diversity, equity, or inclusion (DEI) in their practice.
Although we have a sense of approaches that provide justification and guide evaluators as to how they should attend to culture, DEI, and social justice, we have not yet established an empirical understanding of how evaluators measure and define DEI. To effectively evaluate whether DEI is taking place within a project or program, it needs to be adequately measured and investigated. Ultimately, if evaluators are not explicitly investigating and measuring the constructs of DEI, our evaluations are in danger of upholding systems of oppression and perpetuating inequity (Hall, 2018).
Study Rationale and Research Questions
In this article, we report an examination of how evaluators and principal investigators (PIs) funded by the National Science Foundation's (NSF) Advanced Technological Education (ATE) program (NSF, 2018) attend to DEI within their projects. This work is part of a larger NSF-funded research project that builds on developments in culturally responsive evaluation (Boyce, 2017; Chouinard & Cousins, 2009; Chouinard & Cram, 2020; Hood et al., 2015b; Mertens & Hopson, 2006; Samuels & Ryan, 2011) to investigate how practices suggested by the National Academy of Sciences (NAS) report Indicators for Monitoring Undergraduate STEM Education (2018) can be applied in two-year college contexts to improve assessment of and engagement with DEI, particularly within ATE projects. The National Academy of Sciences calls on the nation to “strive for equity, diversity, and inclusion of Science Technology Engineering and Mathematics (STEM) students and instructors by providing equitable opportunities for access and success” (NAS, 2018, p. 3). The NAS defines the three constructs as follows (p. 19):
In this study, we focus on the following research questions:
How are ATE external evaluators and principal investigators (PIs) defining and measuring diversity, equity, and inclusion (DEI) in their project and evaluation practices? To what extent do definitions align with the NAS definitions?
The data utilized in our study are from two surveys conducted in 2019. We begin by providing a brief literature review, then an overview of the history of DEI in STEM and situate our mixed-methods survey study in the context of the Advanced Technological Education (ATE) program. Afterward, we outline our methodology and present detailed findings and discussion of implications and limitations of this work.
History of DEI and Social Justice in Evaluation
Evaluators have anchored their work in inclusive, emancipatory, culturally responsive, and social justice ideals for over 30 years (Greene et al., 2006; Hood, 1998; Madison, 1991). In the 1970s, 1980s, and 1990s, evaluators began formally reflecting upon the role social justice should and could play in practice and ruminated on the field's lack of engagement with this important topic (Ericson, 1990; House, 1980, 1991; MacDonald, 1976; Weiner, 1990). Many evaluators have continued to pushback on the field's initial tenets requiring strict adherence to quantitative experimental/quasi-experimental approaches and have argued that by very definition they preclude multifarious perspectives, voices, and ways of knowing (Boyce, 2019; Thomas & Madison, 2010). Many evaluators have ultimately endorsed reflection on ourselves as evaluators (Smith et al., 2015; Tovey & Skolits, 2021), the role of privilege (Hall, 2020), our context, the humans involved in program and evaluation activities (Tovey & Archibald, 2022; Tovey & Skolits, 2021), the prescription of values (House & Howe, 1999), cultural responsiveness (Frierson et al., 2010), and an equity orientation in theory and practice (Dean-Coffey, 2018).
DEI and Social Justice in Evaluation Currently
In 2015, there were over 200 articles that mentioned culturally responsive or culturally competent evaluation in the literature (Hood et al., 2015a). Training and overviews of frameworks that attend to DEI, especially culturally responsive and equity-focused approaches, are offered at Voluntary Organizations for Professional Evaluation (VOPE) conferences around the world (Catsambas et al., 2013) and within university courses (Davies & MacKay, 2014). The years 2020 and 2021 saw a surge in webinars and presentations about DEI, anti-racism, and social justice. Over a dozen evaluation frameworks or approaches guide users to explicitly address issues of power, social justice, inequities, human rights, and cultural complexity (Mertens & Wilson, 2018), and the American Journal of Evaluation (2018) hosted a section on Race and Evaluation with five reflective manuscripts written by leaders in the field. Further, evaluators have issued multiple “calls to action: for their peers” (Hall, 2018; Reid et al., 2020). Evaluators working in STEM fields have long called for attention to culture and DEI (Greene et al., 2006; Mertens & Hopson, 2006) as evidence suggests STEM fields have been riddled with biases (Committee on Equal Opportunities in Science and Engineering, 2017; Lee, 2015) and that a culture of exclusion and limited accessibility persists (Avendano et al., 2019; Packard, 2015).
DEI in STEM
Historically, minoritized groups (women, ethnic minorities, persons with disabilities, and economically disadvantaged groups) in the United States have had a much smaller presence in STEM professional fields than their peers (Madison, 2007; Marra, 2015; National Center for Education Statistics, 2009; Osei-Kofi & Torres, 2015). Over the past several decades, many STEM fields have witnessed a growth in participation and degrees earned by these groups, yet they remain disproportionately underrepresented in STEM fields (NAS, 2018; President's Council of Advisors on Science & Technology [PCAST], 2020).
The exclusion of certain groups has led to homogenous perspectives in STEM fields and ultimately hindered innovation and advancement in STEM (American Society of Higher Education, 2011; Charleston, 2012; Smith & Wingate, 2016). Recently, policymakers, industry leaders, and scholars have pushed to improve STEM education and grow the number of diverse students interested in STEM majors and careers. The National Science Foundation's “Broadening Participation” initiatives aim to encourage and support individuals from underrepresented groups to pursue science-related degree programs and professions (National Science Foundation, 2008).
NSF Advanced Technological Education Program and EvaluATE
In 1993, the NSF created the Advanced Technological Education (ATE) program following the Scientific and Advanced Technology Act of 1992, which directed funding for advanced technical training programs toward associate-degree-granting colleges. The ATE program focuses on educating technicians for technology fields vital to United States economic growth through partnerships with two-year academic institutions, secondary schools, and industry (NSF, 2018). Fields of technology supported by the ATE program include but are not limited to, agriculture and biotechnology, engineering technologies, security technologies, micro and nanotechnologies, and advanced manufacturing (ATE Central, 2021). As part of the ATE program, NSF encourages faculty at two-year colleges to serve as principal investigators of ATE projects which aim to attract a more diverse student population into STEM (ATE Impacts, 2020). According to ATE Impacts, two-year, associate-degree-granting institutions enroll the highest number of minority and first-generation college students, with ATE programs influencing their career paths into the technical workforce. Therefore, the ATE program is playing a role in increasing the number of individuals qualified for STEM careers and the participation of minorities and women in advanced technological fields (Smith & Wingate, 2016).
EvaluATE is the evaluation learning and resource hub for the National Science Foundation's ATE program. The mission of EvaluATE is to partner with ATE projects and centers to strengthen the programs’ evaluation knowledge base, expand the use of exemplary evaluation practices, and support the continuous improvement of technological education throughout the nation. The majority of the EvaluATE research team is housed at Western Michigan University's Evaluation Center. This study was conducted by EvaluATE researchers located at Arizona State University and UNC Greensboro. Our overall goals are to conduct research on and provide strategies to the ATE community and beyond regarding how to engage with DEI within ATE evaluation and programming.
Method
Survey Instruments
Data collected for the study were included in existing EvaluATE data collection procedures. Two sets of subquestions were embedded in 2019 ATE surveys of grantees and evaluators.
DEI subsection in evaluator survey
During survey data collection for the larger EvaluATE project, evaluators were asked 10 questions regarding DEI. First, participants with multiple ATE projects were asked to respond to the questions about the most active ATE project that evaluates issues around DEI. Then, participants were provided with the NAS (2018, p. 19) definitions of diversity, equity, and inclusion and were asked two Likert questions: (1) “To what extent does the ATE project you evaluate directly engage in activities designed to increase equity, diversity, and inclusion?” and (2) “To what extent does the evaluation of this ATE project gather evidence related to equity, diversity, and inclusion?” Participants rated all three terms separately for both questions on the following scale: (1) not at all, (2) minimal extent, (3) moderate extent (4) substantial extent, and (5) very substantial extent. If participants responded that their evaluation of their ATE project engages at all in gathering evidence related to diversity, equity, or inclusion, they were then provided with a separate qualitative box for each construct and were asked to describe what kind of data they gather to document that construct in the ATE project they evaluate.
DEI subsection in PI survey
At the end of the yearly survey of ATE grantees, project PIs were asked nine questions regarding DEI. First, participants were provided with the NAS (2018, p. 19) definitions of DEI and were asked to respond to the question: “To what extent does your ATE project directly engage in activities designed to increase equity, diversity, and inclusion?” Participants rated each term separately on the following scale: (1) not at all, (2) to a small extent, (3) to some extent, (4) to a moderate extent, and (5) to a great extent.
Participants who responded that their project engaged at all in activities around any of these terms were provided with a separate qualitative box to “describe and provide examples of how they address [DEI] in their ATE project.” Finally, PIs were asked, “To what extent does your ATE project's evaluation gather evidence related to equity, diversity, and inclusion?” Participants again rated each of the three terms separately on the same five-point scale.
Data Collection Procedures
The respective sets of DEI-related questions were included in the 2019 survey of ATE grantees and the 2019 ATE evaluator survey. Each of the surveys was sent out as a part of regular EvaluATE programmatic practices to the appropriate ATE program participant audiences by EvaluATE team members at Western Michigan University (WMU). The 2019 ATE PI survey launched on March 4, 2019, and closed on April 19, 2019, and the ATE evaluator survey was administered from June 25, 2019, to July 31, 2019. Raw survey responses to the DEI-related sets were provided by Western Michigan University to the (Arizona State University and UNC Greensboro) team.
Data Analysis and Themes
We analyzed the quantitative survey data using descriptive statistics. For the qualitative analysis, we engaged in a process of coding and thematic analysis (Braun & Clarke, 2006). We also specifically coded responses from both evaluators and PIs to see how well their responses aligned with the NAS (2018, p. 19) definitions of DEI provided in the survey. Responses were coded as yes if they matched the definitions closely, maybe if there was any ambiguity in their response's relationship to the NAS definitions, and no if the response was clearly not in alignment. Utilizing ATLAS.ti, we coded the data using an iterative process and multiple coders.
Research team members engaged in independent coding of the qualitative responses from both the evaluator and principal investigator surveys. Upon completion of the independent coding, team members reviewed the individual codes, engaged in dialogue to come to a consensus in understanding, and combined the codes that were similar in nature, grouping them into themes for each of the constructs based on the similarity of the codes in conjunction with the activities/domains under which the codes fell. Iteratively, the research team met to build further consensus, refine, and deliberate regarding diverging and conflicting codes. Descriptive statistics and qualitative responses are paired together in our findings to understand the perceptions of PIs and evaluators regarding the use and understanding of DEI in their work.
Participants
Participants for this study were respondents to two surveys implemented by the EvaluATE evaluation hub at Western Michigan University. These two surveys were distributed to ATE project evaluators and Principal Investigators (PIs).
ATE evaluators
Evaluators who were working on at least one NSF-funded ATE program (some evaluators worked on multiple projects) were invited to participate in this survey. The survey response rate was 48.3% (n = 69/143). Of the participants who identified their gender, 56.5% were female and 37.7% were male. The majority of evaluators (83%) identified as White/Eastern European. Their number of years working as an evaluator ranged from 1 year to 40 years, (M = 2.89, SD = 1.79). Most of them (98.6%) were external evaluators, and they worked in settings such as independent consulting practice (41.2%); consulting, research, or evaluation firms (33.8%); or higher education (19.1%). Most of them (82.6%) evaluated between one and three projects. Detailed demographic information is presented in Table 1.
Evaluator Demographics.

Principal investigators
The survey was sent to all project PIs with active grants, and 92% (n = 279) responded. In some cases, the principal investigators were working on multiple ATE projects. ATE PIs who took the survey were 63% male, and the majority (83%) identified as White/Eastern European. Most of the ATE grants they engaged in were project-based (61.6%). Project PIs were mainly located in two-year colleges or two-year college systems. A little over half (51%) of the institutions in which the Project PIs were located were not designated as minority-serving institutions (MSIs). The most frequently reported number of years covered by the grants ranged from one to five years (97.7%). Detailed demographic information for PIs is presented in Table 2.
Project PI's Demographics.

Evaluator Survey Findings
According to ATE evaluators, their projects directly engage in activities designed to increase diversity, equity, and inclusion between a moderate and substantial extent on average (which is also reflected in the modes, which is slightly higher than the midpoint.) Few evaluators (between 1.5% and 6%) indicated that the projects they work on did not engage in these activities at all. See Table 3 for a detailed display of these findings, with the most frequent response bolded.
Evaluators: To What Extent Does the ATE Project You Evaluate Directly Engage in Activities Designed to Increase Diversity, Equity, and Inclusion?
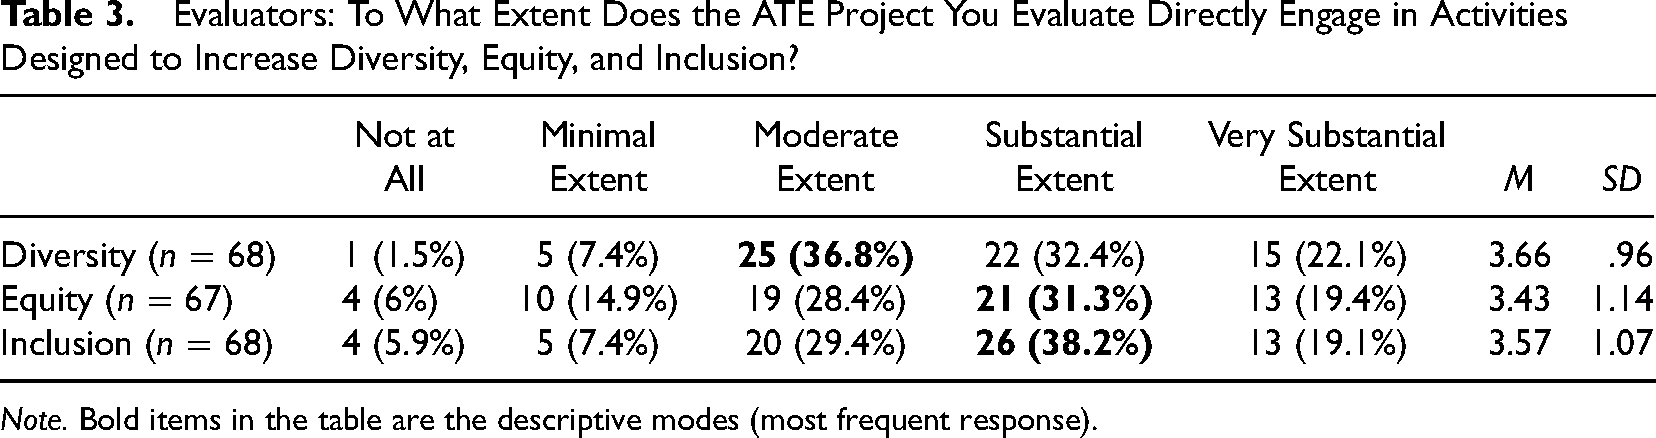
Note. Bold items in the table are the descriptive modes (most frequent response).
We also looked at the ratings for the extent to which the evaluation of this ATE project gathered evidence related to DEI, and evaluators reported gathering less evidence about equity (M = 2.82, SD = 1.19) and inclusion (M = 2.96, SD = 1.23) as compared to diversity (M = 3.43, SD = 1.04). Less than 5% of participants noted that they did not gather any diversity evidence. Sixteen percent of evaluators did not gather evidence related to equity and 14.7% did not gather evidence related to inclusion (Tables 4–6).
Evaluators: To What Extent Does the Evaluation of This ATE Project Gather Evidence Related to Diversity, Equity, and Inclusion?
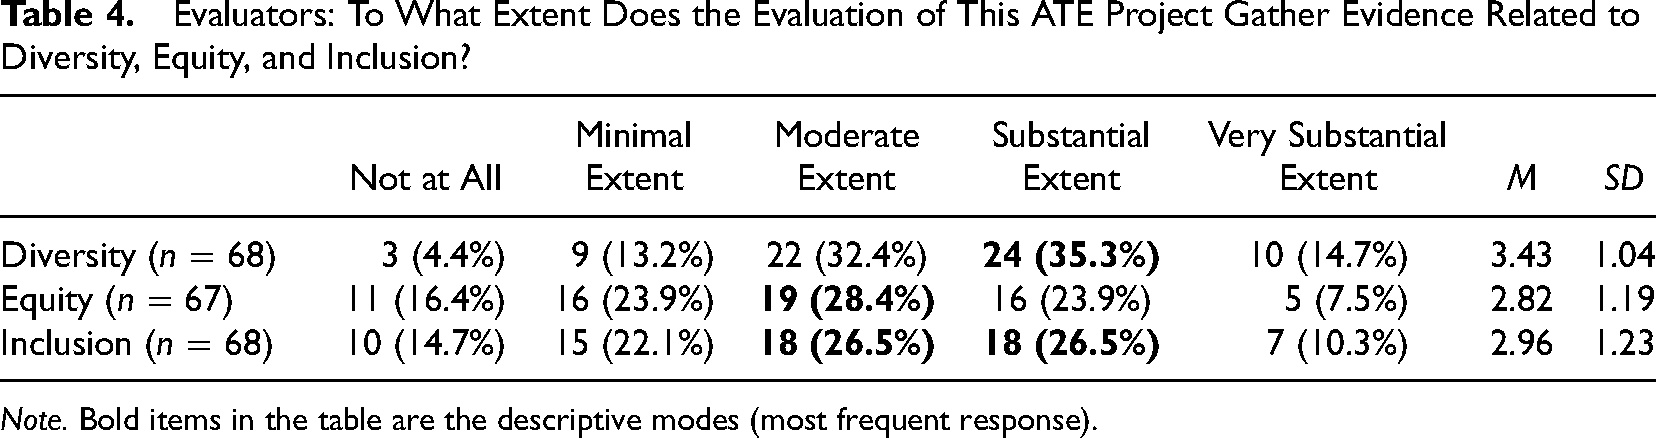
Note. Bold items in the table are the descriptive modes (most frequent response).
Evaluators’ Descriptions of the Data They Collect Regarding Diversity.
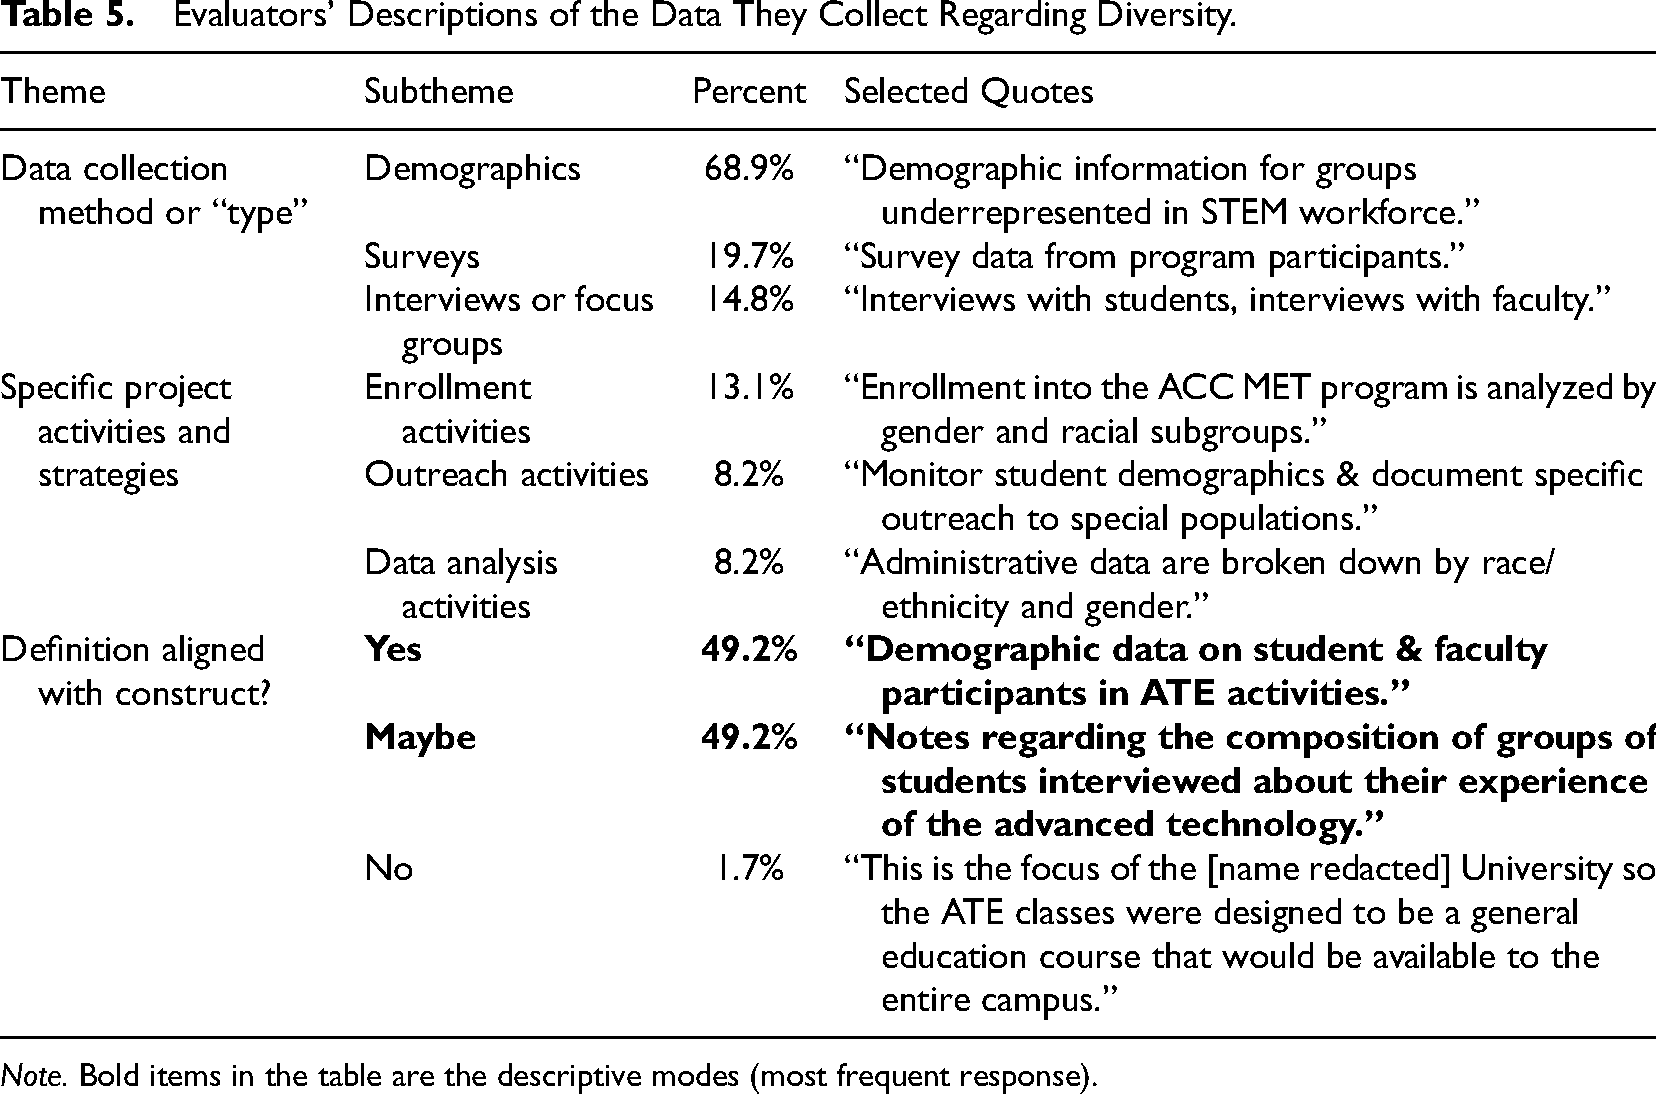
Note. Bold items in the table are the descriptive modes (most frequent response).
Evaluators’ Descriptions of the Data They Collect Regarding Equity.
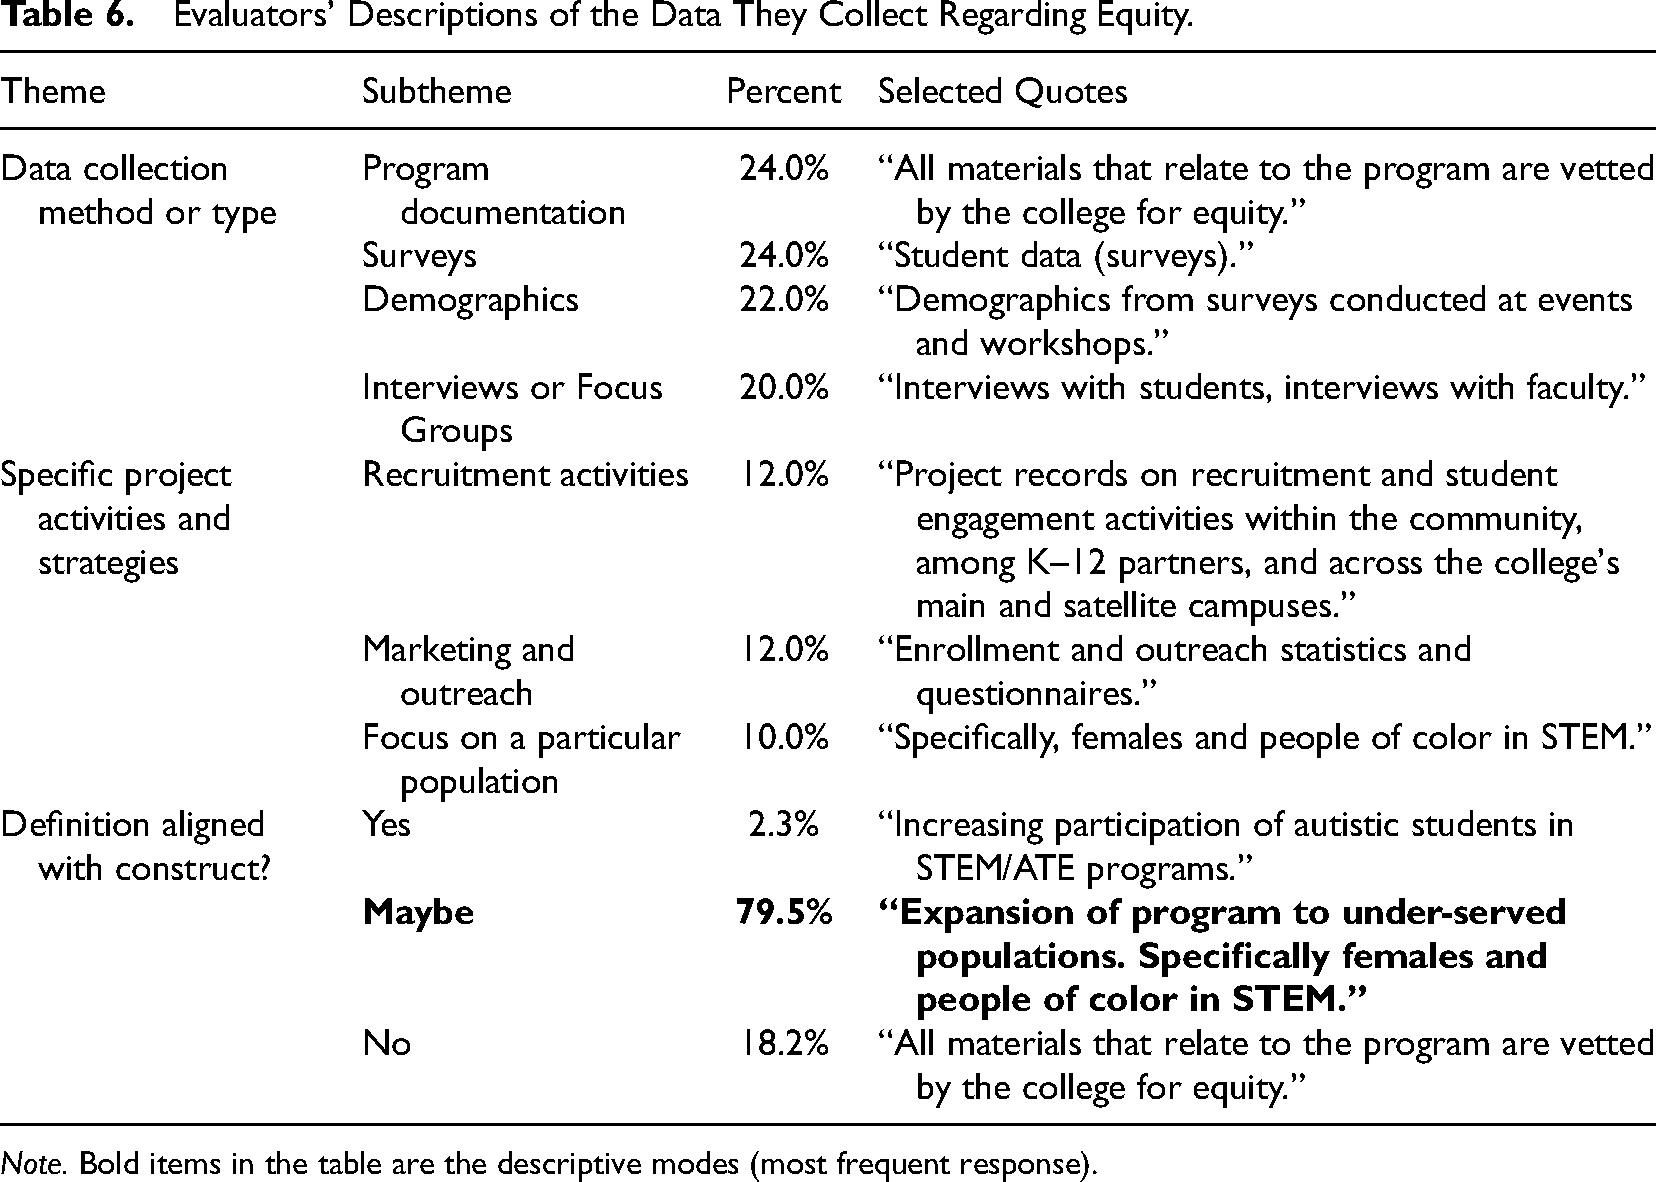
Note. Bold items in the table are the descriptive modes (most frequent response).
Diversity
Sixty-five participants (95.6%) reported that, to some extent, they gathered evidence related to diversity as a part of the evaluation of their ATE project. Of those who reported having collected any evidence related to diversity, 61 participants provided qualitative remarks to the question: What kind of data do you gather to document diversity in the ATE project you evaluate? Participants who noted that they collected data on diversity overwhelmingly reported that they collect demographic information to address this topic (68.9%), often not explaining what they meant. Methods of data collection listed were surveys (19.7%), focus groups or interviews (14.8%), institutional or administrative data (13.1%), program documentation (9.8%), and observational data (6.6%). In addition, participants sometimes listed specific project activities that they focused on, the most common being specific enrollment activities (13.1%), followed by outreach (8.2%), activities for data analysis (8.2%), program participation (6.6%), recruitment (4.9%), and training (3.3%).
The research team coded the qualitative responses according to their alignment with the NAS definition of diversity, which is “differences among individuals, including demographic differences such as gender, race, ethnicity, and country of origin (2018, p. 19).” Participants’ responses regarding diversity were most often coded as maybe or yes (both 49.2% of responses each for a total of 98.4%) in terms of whether the responses aligned with the NAS definition. A maybe response meant there was not enough explanation in the survey responses to deem them to be correctly aligned with the definition. Only one (1.7%) response was coded a no. Diversity received the most responses categorized as being in alignment with the NAS definition, in comparison to equity and inclusion.
Equity
Fifty-six respondents (83.6%) noted that they collected data on equity in the evaluation of their ATE project. Of those participants who reported collecting evidence related to equity, 50 provided qualitative remarks to the question: What kind of data do you gather to document equity in the ATE project you evaluate? These participants gave a wide variety of responses regarding what data they collected around the topic. The most frequent types of data collected regarding equity were program documentation (24%), surveys (24%), demographic information (22%), and interviews or focus groups (20%). Participants also mentioned observational data (6%), course materials (6%), and administrative and institutional data (4%) as part of their collection strategies. Specific project activities associated with collecting data about equity included recruitment (12%), marketing and outreach (12%), focusing on a particular population (10%), enrollment activities (10%), access opportunities (6%), engagement and participation (4%), and program training (4%). The research team coded responses according to their alignment with the NAS (2018) definition of equity. As a reminder, the NAS defines equity as “Fair distribution of opportunities to participate and succeed in education for all students” (p. 19).
Participants’ responses regarding equity were most often considered maybes (79.5%) in terms of whether the responses aligned with the definition of equity established by NAS, meaning that their responses to the questions were not clear or explanatory enough to make specific determinations about their alignment. According to our analysis, only one individual (2.3%) provided an explanation that aligned with the definition. Interestingly, 18.2% of respondents provided an explanation that did not align with the established definition.
Inclusion
Fifty-eight participants (85.3%) reported having collected data on inclusion in their evaluations of ATE projects. Of those who reported having gathered any evidence related to inclusion in their ATE projects, 44 participants provided qualitative comments to the question: What kind of data do you gather to document inclusion in the ATE project you evaluate? These respondents also provided a variety of data collection methods or types that were associated with this construct.
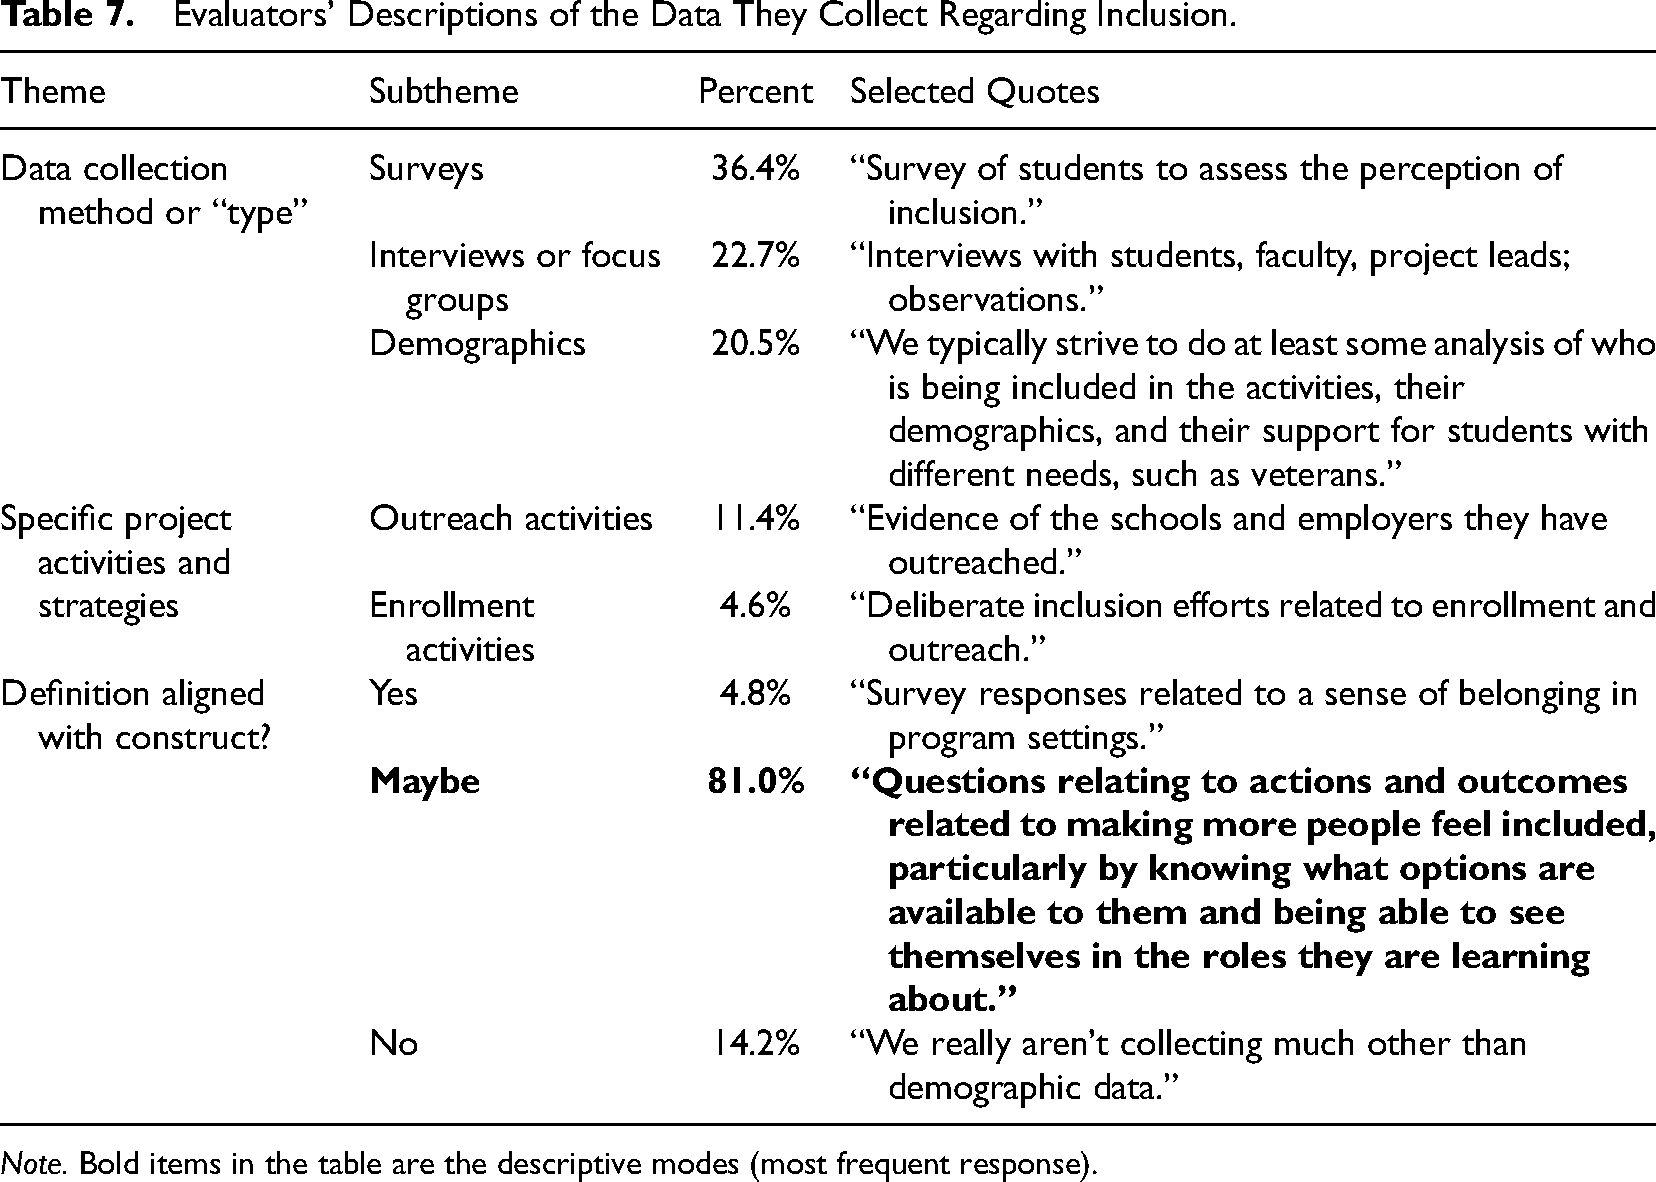
The most frequent method of collecting data about inclusion was surveying (36.4%), followed by interviews or focus groups (22.7%), and many respondents noted demographics (20.5%) specifically again for inclusion. In addition, participants mentioned document review (9.1%), observation (6.8%), use of course materials as data (2.3%), case study (2.3%), and administrative and institutional data (2.3%). A handful of respondents noted particular program activities related to the construct of inclusion, including outreach (11.4%) and enrollment activities (4.6%). Some activities were only listed by one participant, including instructor evaluations, expert reviews, recruitment activities, and program training.
Responses to this question were again coded for their alignment with the NAS (2018) definition of inclusion. As a reminder, the NAS defines inclusion as “processes through which all students are made to feel welcome and are treated as motivated learners” (p. 19). Participants’ responses regarding inclusion were again most often considered maybes (81.0%), while only two responses (4.8%) received a yes categorization, and 14.2% were coded as not aligning with the definition. Table 7 below elaborates further on these findings and applicable quotes.
Evaluators’ Descriptions of the Data They Collect Regarding Inclusion.
Note. Bold items in the table are the descriptive modes (most frequent response).
Principal Investigator Survey Findings
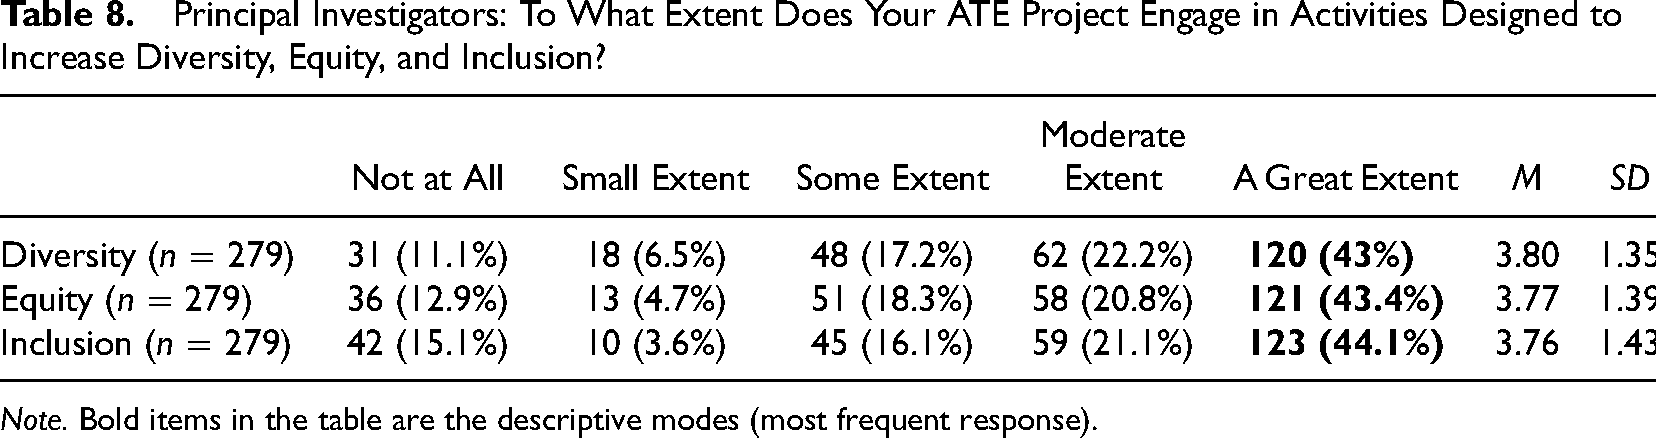
According to project PIs, on average, their ATE projects engaged in activities designed to increase equity, diversity, and inclusion between “some extent” and “moderate extent” on average, with the highest-rated item being diversity (M = 3.80, SD = 1.35). However, it is interesting to note that the most frequent response was “a great extent” (bolded in Table 8), which fell above the average for all three terms. Several project PIs noted that they don't engage in these activities at all (between 11.1% and 15.1%).
Principal Investigators: To What Extent Does Your ATE Project Engage in Activities Designed to Increase Diversity, Equity, and Inclusion?
Note. Bold items in the table are the descriptive modes (most frequent response).
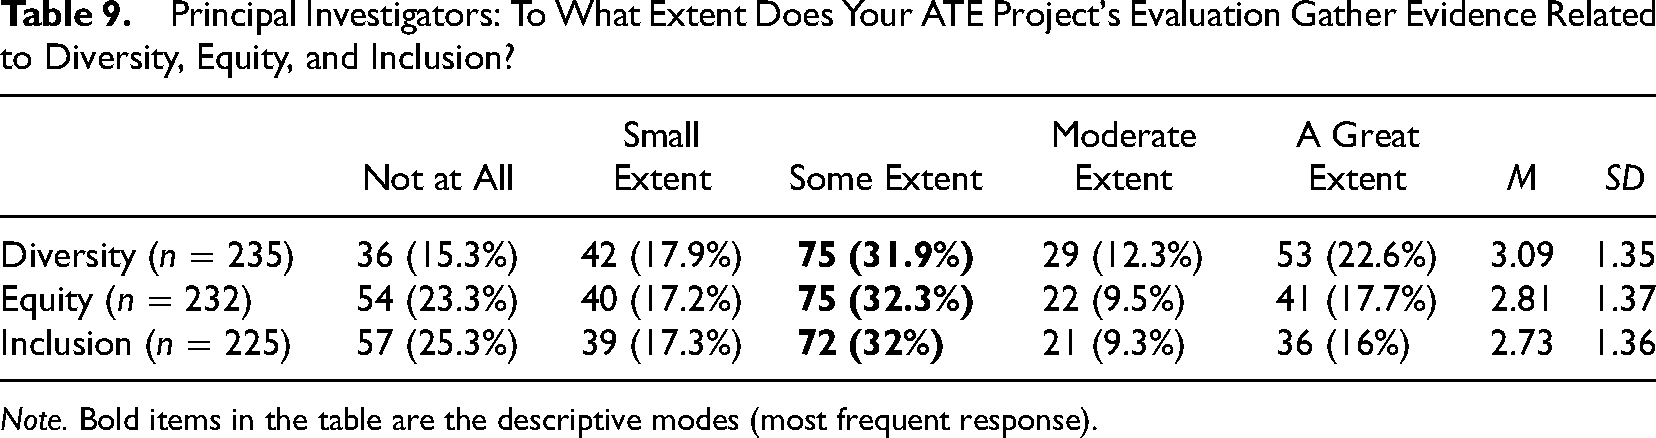
When looking at the perspectives of PIs regarding the extent to which their project's evaluation gathers evidence related to DEI, we see that on average they rated diversity the highest, at just above the midpoint (M = 3.09, SD = 1.35), though average ratings were similar across the constructs. Similarly, mode responses were also at the midpoint for all three constructs. Table 9 outlines these findings further.
Principal Investigators: To What Extent Does Your ATE Project's Evaluation Gather Evidence Related to Diversity, Equity, and Inclusion?
Note. Bold items in the table are the descriptive modes (most frequent response).
Diversity
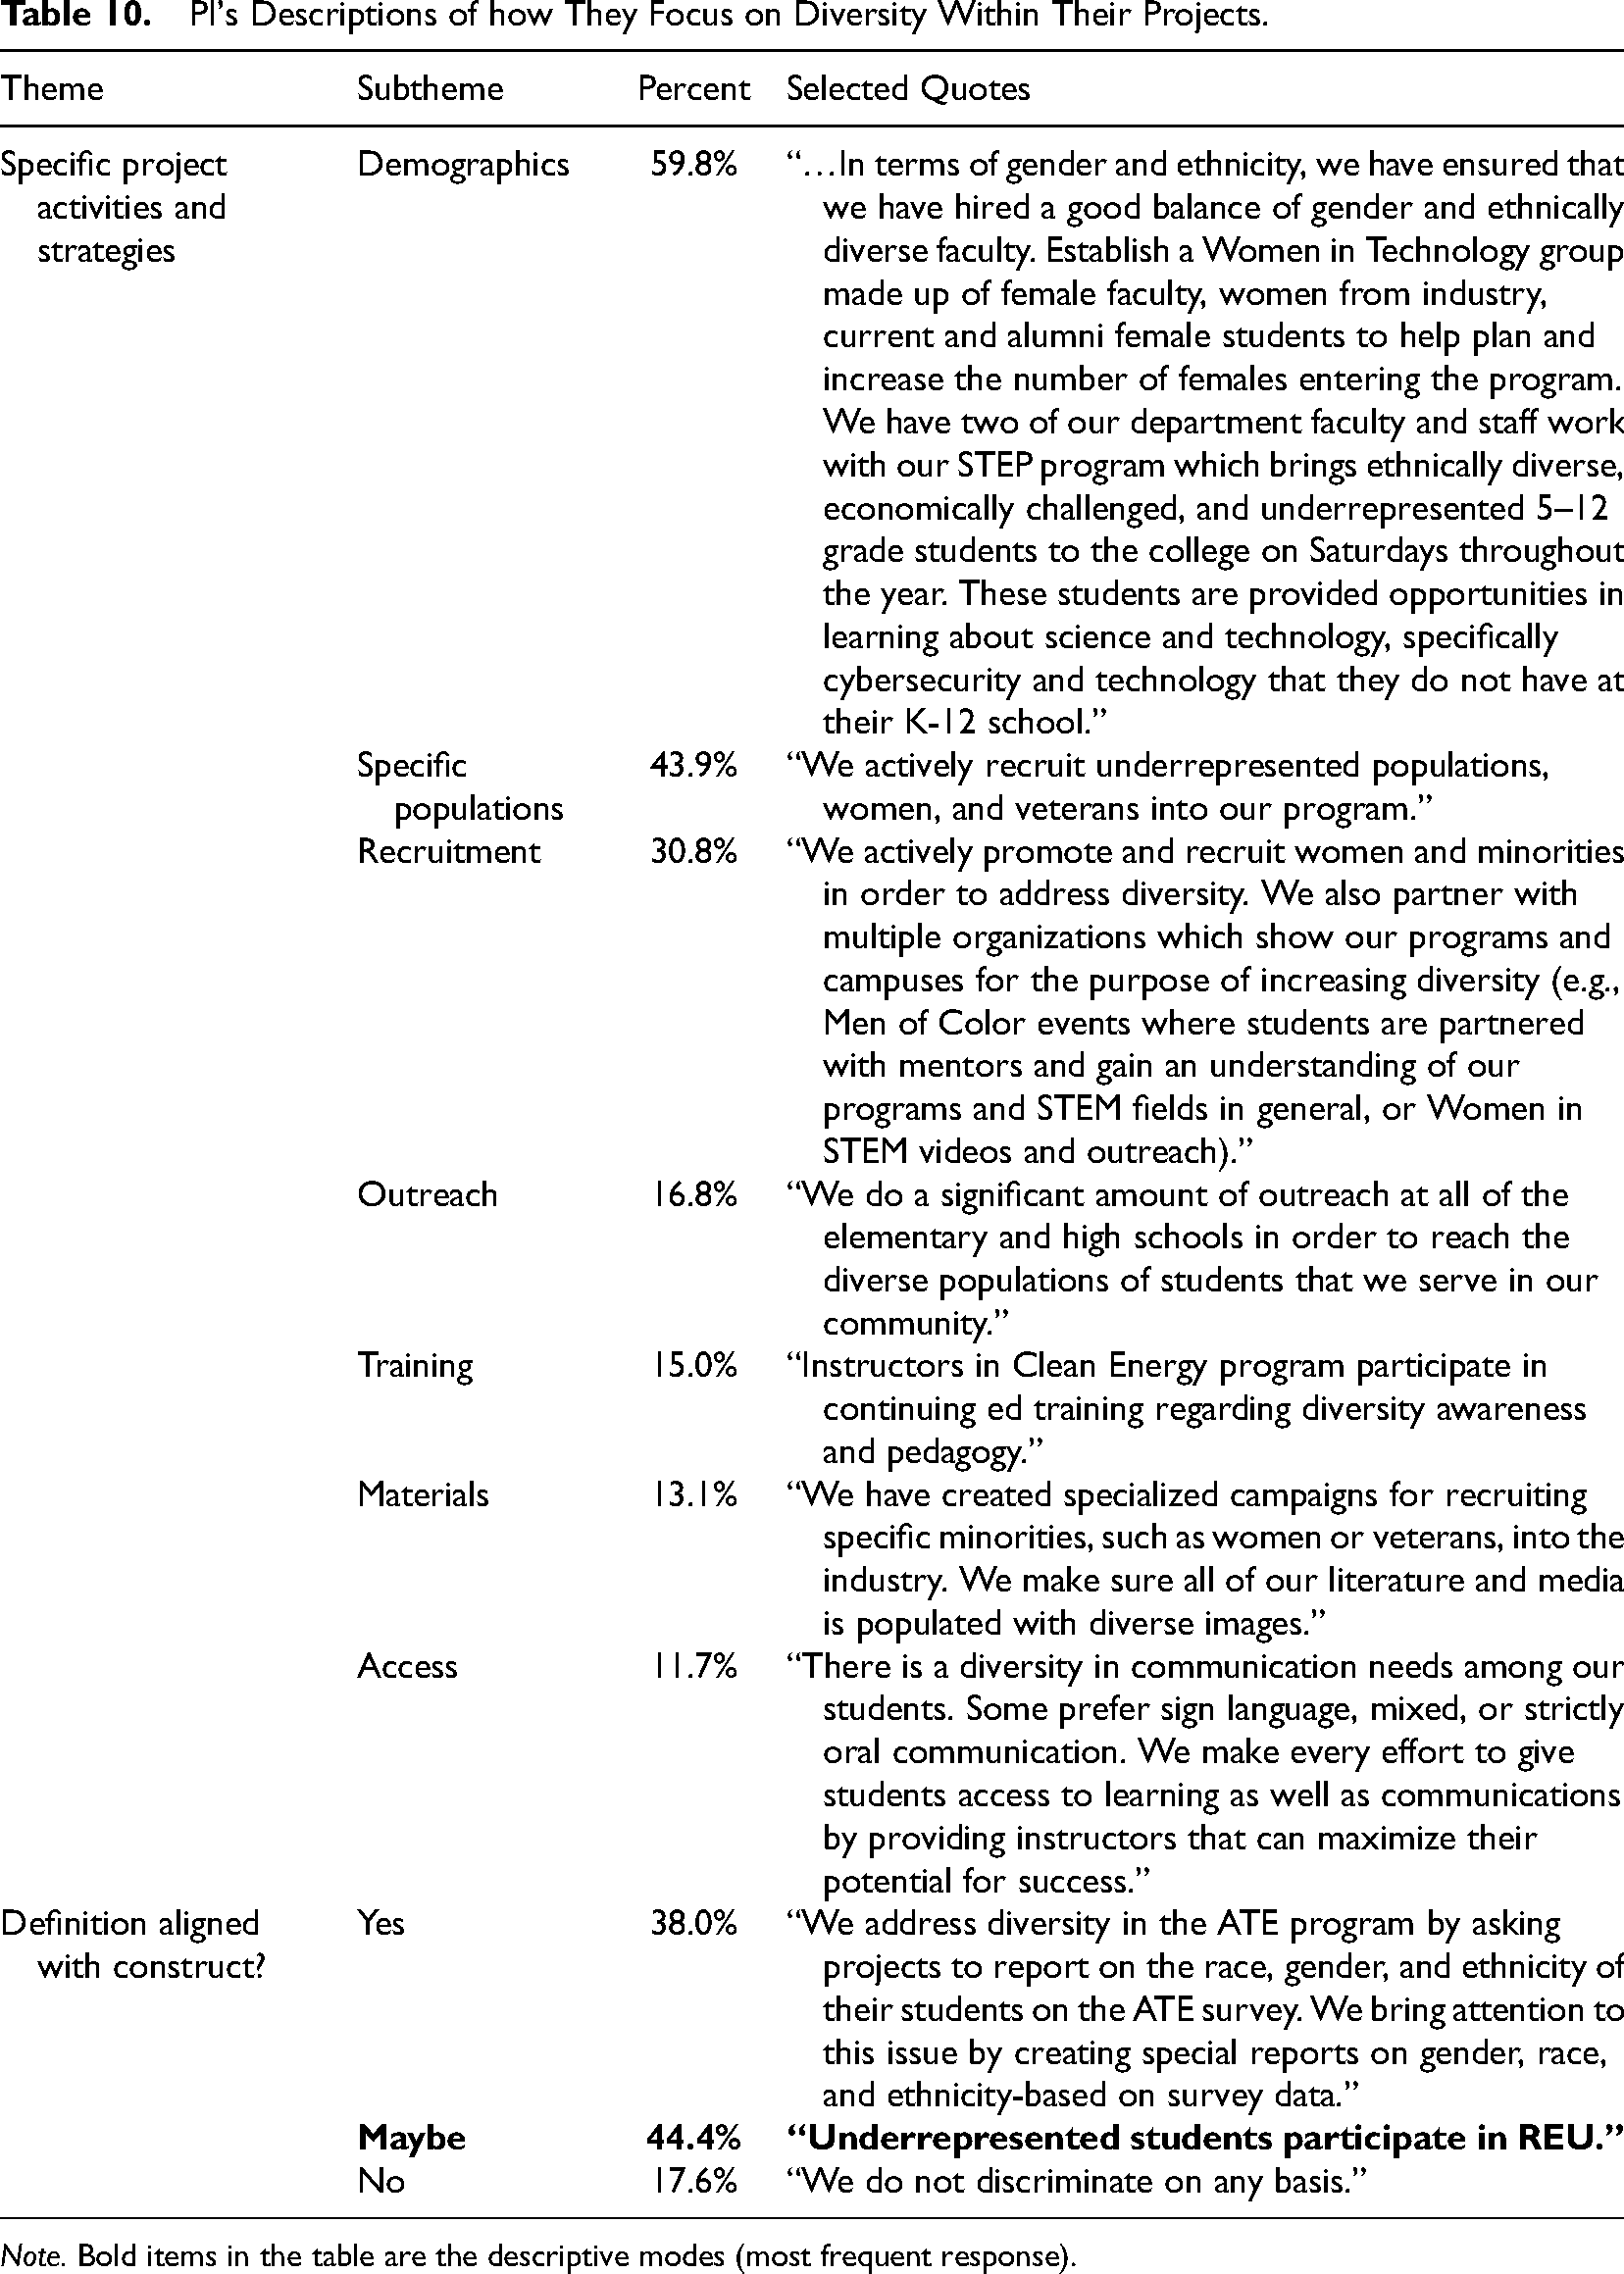
A total of 248 participants (88.9%) reported that they focus on diversity as a part of their ATE project. Of those participants who reported engaging in activities related to diversity, 214 provided qualitative remarks to the question: Please describe and provide examples of how you address
Principal Investigators’ responses regarding diversity were most often considered maybes (44.4%) in terms of whether the responses correctly aligned with this definition. A maybe response meant there was not enough explanation in the survey response to deem it to be aligned with the definition. Interestingly, 38.0% of responses were considered in alignment with the definition, and 17.6% were considered not in alignment (Table 10).
PI's Descriptions of how They Focus on Diversity Within Their Projects.
Note. Bold items in the table are the descriptive modes (most frequent response).
Equity
A total of 243 (87.1%) respondents noted that they focus on equity as part of their ATE project. Of those who reported engaging in activities associated with equity, 210 provided qualitative remarks to the question: Please describe and provide examples of how you address
Participants’ responses regarding equity were almost evenly spread across yes (35.3%), maybe (30.9%), and no (33.8%) categories, with yes meaning that their responses to the questions fit the NAS definition of equity; maybe meaning that their responses to the questions were not explanatory enough to make specific determinations about their alignment; and no meaning that their responses to the question did not align with the definition. See Table 11 for a summary of these findings and applicable quotes.
Principal Investigators’ Descriptions of How They Focus on Equity Within Their Projects.
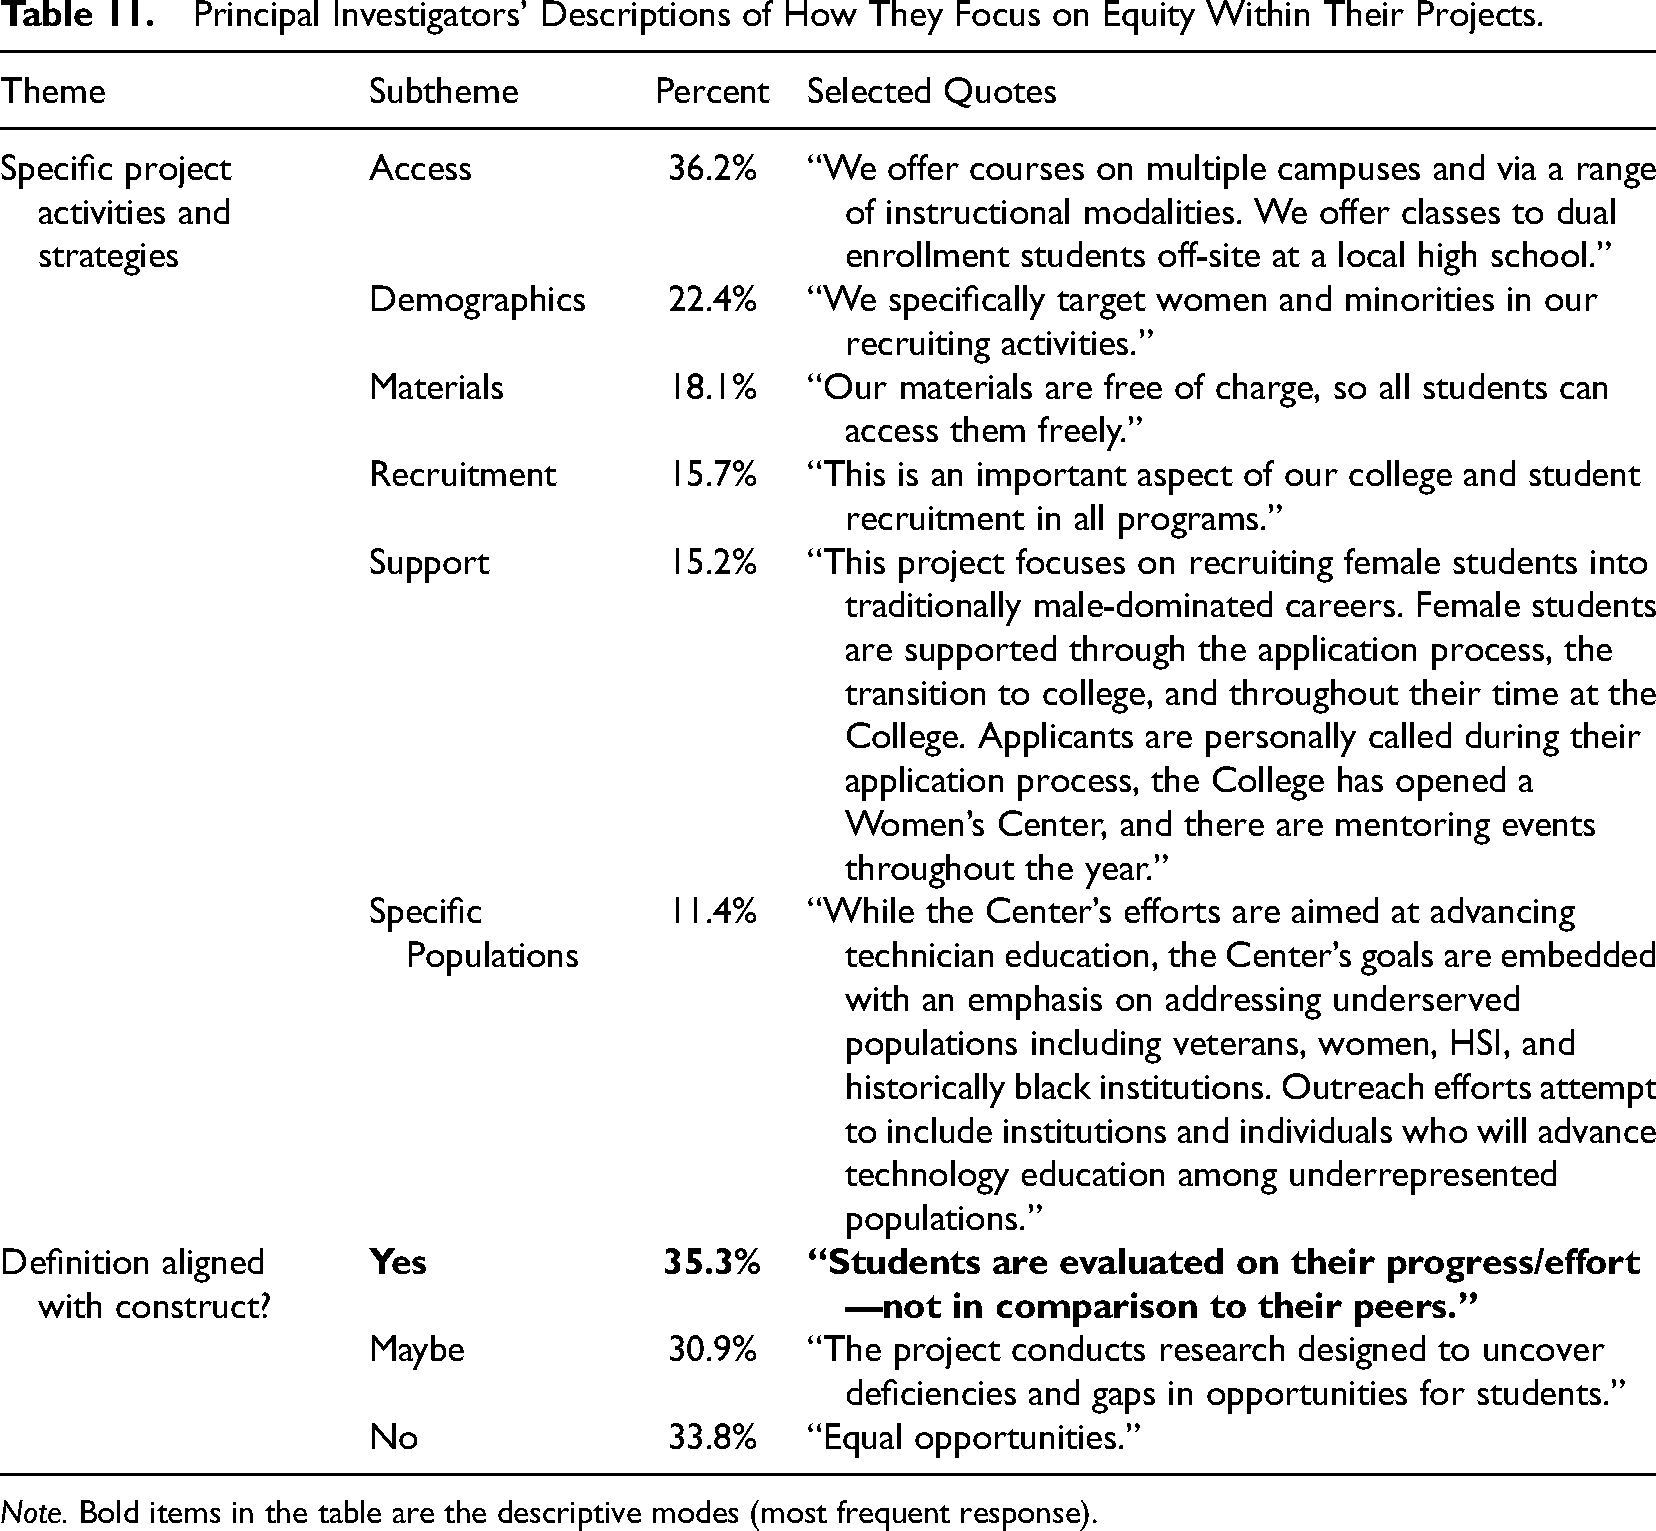
Note. Bold items in the table are the descriptive modes (most frequent response).
Inclusion
A total of 237 respondents (85.0%) noted that they focused on inclusion as part of their ATE project. Of those PIs who reported engaging in activities related to inclusion as a part of their ATE project, 196 provided qualitative remarks to the question: Please describe and provide examples of how you address
Participants’ responses regarding inclusion were most often considered maybes (45.8%). Compared to diversity and equity, inclusion received the most responses categorized as maybes. In addition, inclusion received fewer responses categorized as yes than did either diversity or equity. See Table 12 for a summary of these findings and applicable quotes.
Principal Investigators’ Descriptions of How They Focus on Inclusion Within Their Projects.

Note. Bold items in the table are the descriptive modes (most frequent response).
In order to further contextualize our findings and associated understanding of the data garnered from the PIs and evaluators, we analyzed the qualitatively coded data with descriptive crosstabs of definitional coding (Yes/Maybe/No) by respondent gender identity and racial and ethnic minority/non-minority identity. There were a few interesting trends. For example, within the Equity (Yes/Maybe/No) PI data, men (38.0%) most frequently received yes ratings, while women (43.2%) most frequently received no ratings. In terms of ethnic/racial minorities for PIs, there were no descriptively meaningful differences in ratings on any of the three constructs. For evaluators, cell sizes were simply not large enough to make meaningful comparisons.
Comparing Evaluators’ and Principal Investigators’ Responses
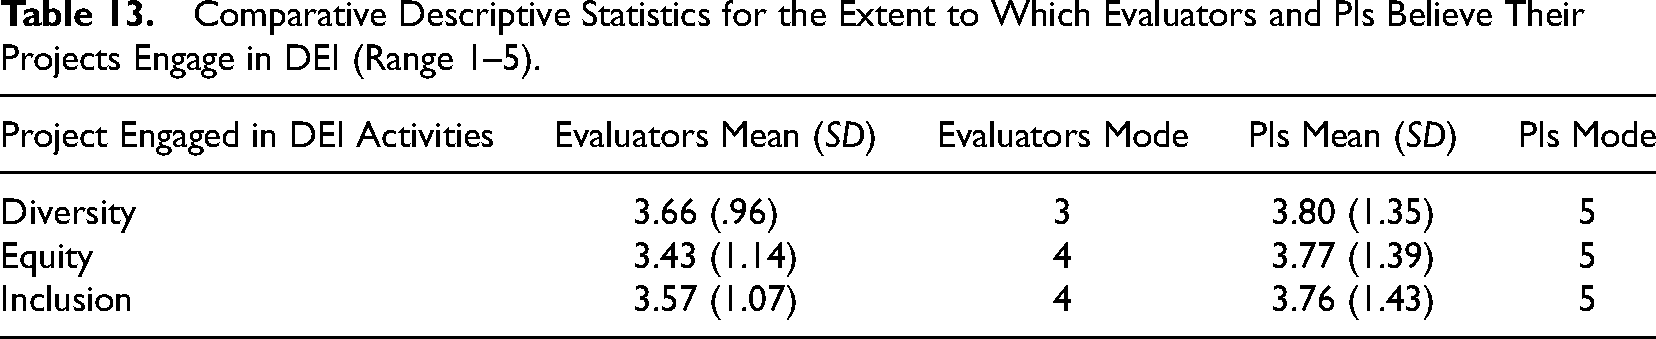
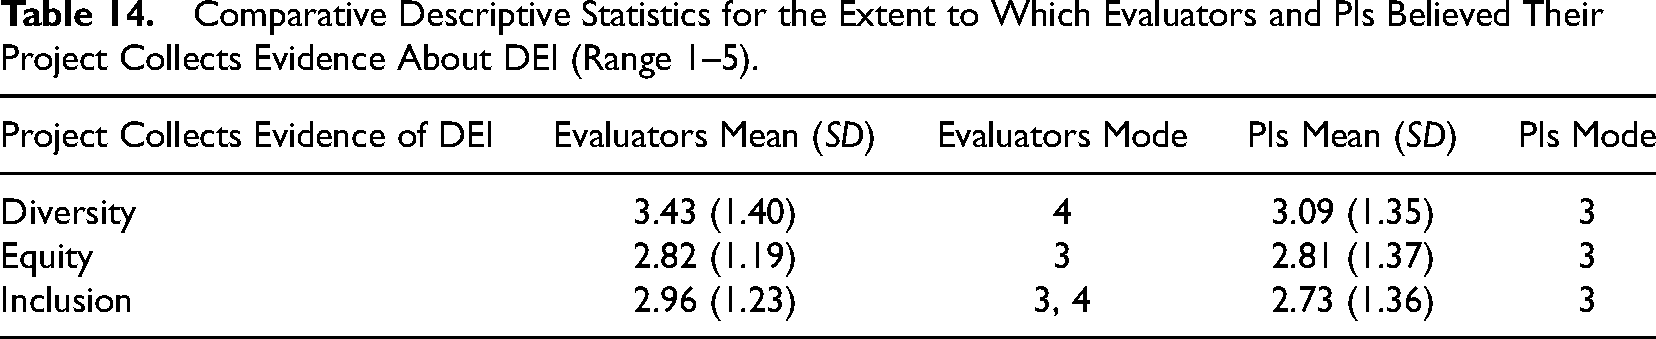
When looking at both groups together, we see interesting distributions between the ways evaluators and PIs responded to the quantitative questions. When examining the extent to which evaluators and PIs believe their project was engaged in DEI, there are differences in the modes and standard deviations, with slight differences in the means. Evaluators were more conservative in their estimations of engagement with DEI. When comparing responses about the extent to which evaluators and PIs believed they collected evidence of DEI in their projects, evaluators and PIs were similar in their responses, with the only difference being diversity. PIs rated the collection of evidence for diversity lower than evaluators did.
When considering open-ended responses to this survey, PIs provided richer, more descriptive examples, and meaningful engagements with these topics in their work than did evaluators, as indicated by the detailed quotes in the PI thematic tables above. This may have been due to how each of those open-ended questions was phrased. Evaluators were asked to explain the types of DEI data collected, while PIs were asked to provide examples of how they addressed DEI in their projects (Tables 13–15).
Comparative Descriptive Statistics for the Extent to Which Evaluators and PIs Believe Their Projects Engage in DEI (Range 1–5).
Comparative Descriptive Statistics for the Extent to Which Evaluators and PIs Believed Their Project Collects Evidence About DEI (Range 1–5).
Alignment with NAS Definition.
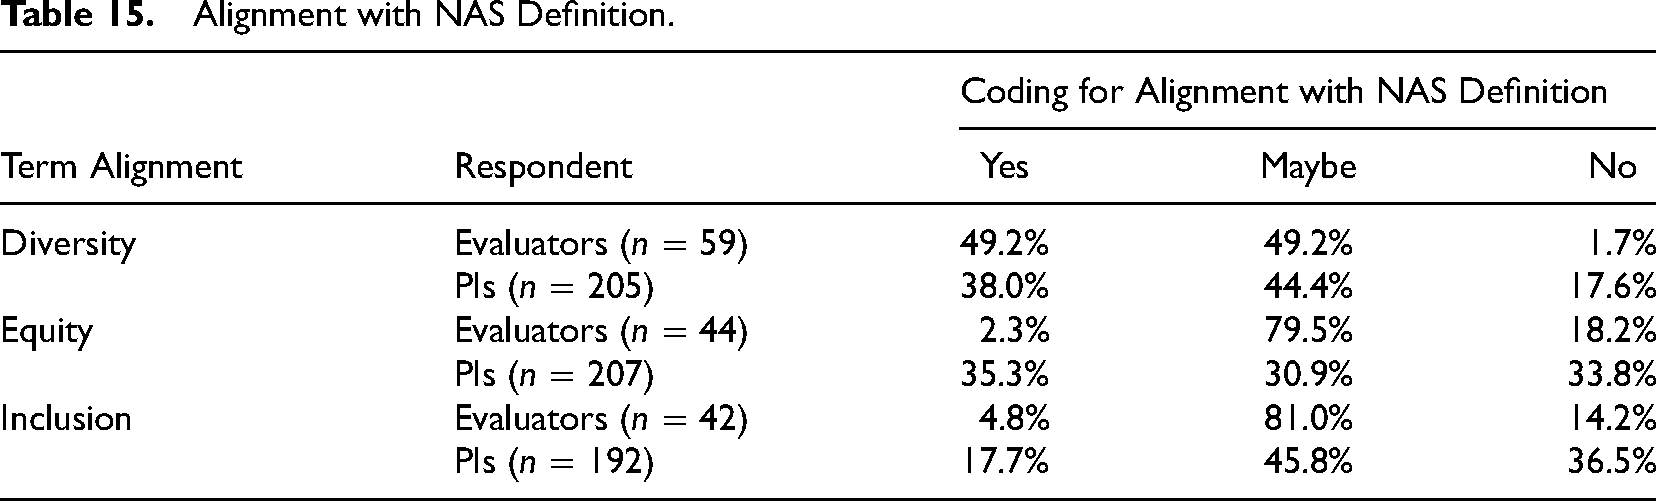
In comparing both PIs’ and evaluators’ responses to the survey regarding the NAS (2018, p. 19) definitions of each term, we saw some differences between the two groups. For example, we categorized evaluators’ responses to the diversity question as yes more often than the PIs’ responses. However, this flipped in the analysis of equity and inclusion. About 2% of evaluators who indicated that they measured equity provided responses that were clearly aligned with the NAS definition, as compared to 35% of PIs. With inclusion, though we categorized fewer respondents in alignment for both groups, we saw the same pattern as we did with equity, with 17.7% of PIs, and only 4.8% of evaluators, providing responses in alignment.
Discussion
In this section, we discuss the implications of this study around each specific construct measured, fitting our findings into the larger literature base. Particularly, we reflect on the following: (1) diversity has the spotlight in DEI work, (2) how we ought to define equity, and (3) what counts as inclusion. We end our discussion by exploring the limitations to the study.
Diversity Has the Spotlight in DEI Work
The case for attention to and an increase in diversity within many fields, especially STEM, has been sustained for over two decades (American Society of Higher Education, 2011; Kulik & Roberson, 2008). As such, diversity initiatives within universities and organizations continue to gain traction (Klenk et al., 2015). Our findings suggest that diversity is the construct easiest to define and measure. Both PIs and evaluators reported measuring diversity more than equity and inclusion. Further, respondents’ answers about diversity most correctly aligned with the NAS (2018) definitions (for both evaluators and PIs). As a reminder, the NAS (2018) defines diversity as “differences among individuals, including demographic differences such as gender, race, ethnicity, and country of origin” (p. 19).
We asked PIs in our study to describe and provide examples of how they address diversity in their ATE projects, and we asked evaluators to describe what kind of data they gather to document diversity. PIs conceptualize their focus on diversity through identifying specific populations to work with, recruiting underrepresented minorities, and developing outreach efforts. Evaluators responded that they measure diversity with surveys, administrative data, interviews, and focus groups. Although across the DEI dimensions, responses were coded as may be between 44% to almost 50% of the time, it was clear when reviewing the data that respondents had more to say, and in more clarity, about diversity. A recent study that qualitatively investigated NSF ADVANCE project proposals found “variation and narrow meanings with terms connected to social justice” (Avent, 2020, p. 88), further highlighting the sometimes difficult nature of conceptualizing and operationalizing diversity, equity, and inclusion.
Although diversity is a fine starting point, ultimately diversity is not enough (Puritty et al., 2017). Research has shown that minoritized ethnic groups uniquely encounter isolation, fear, microaggressions, and distrust while in the workplace and at school (Auguste et al., 2018; Mapedzahama et al., 2012; McCabe, 2009; Turner & Grauerholz, 2017). If there is a goal of increasing diversity, but a lack of attention to inclusivity or no focus on ensuring equity across participation, access, and outcomes, then initiatives could be in danger of doing more harm than good by bringing diverse populations into chilly climates or spaces without adequate curriculum, strategies, or resources to support them.
There have been a plethora of authors, scholars, and students from systematically marginalized groups who have written about and researched experiences with demeaning, dismissive, insensitive, and/or hostile environments and individuals (Cleveland, 2004; McGee, 2021). All of these articles point to the fact that if projects (and their evaluations) only engage with and/or measure diversity, it has the potential to be problematic as it could ignore the more substantive constructs related to parity in access, participation, and belongingness in these spaces (equity and inclusion).
How Ought We Define Equity?
Equity was harder to conceptualize and measure than diversity for both PIs and evaluators. Interestingly, we rated the alignment of PIs’ responses regarding equity to the NAS definition of equity almost as positively as we rated their responses related to diversity. However, evaluators’ alignment was much lower, at only 2%. This may be because we did not probe for specific enough information for evaluators to provide a targeted response; thus, the vast majority of evaluators’ responses (79.5%) ended up in the maybe category. It could also be that it is harder for evaluators to articulate or operationally define equity within the scope of the evaluation work to be done. As a reminder, the NAS (2018) defines equity as a “fair distribution of opportunities to participate and succeed in education for all students” (p. 19).
Equity can be a difficult concept to measure and operationalize because, to achieve equity, PIs and evaluators must have a deep understanding of the educational injustices operating against the population they are working with and aim to serve (Vossough et al., 2016). For example, ensuring equitable access goes beyond focusing on equal recruitment efforts. There would need to be an understanding about groups that have not previously had access or the additional resources and time they would need to be committed to those access and recruitment efforts. Further, educational equity requires differentiation of instruction and an understanding of participants’ various cultural, cognitive, and linguistic learning styles and backgrounds (Lincoln, 2015).
Based on these findings and our own work, we believe that the NAS definition for equity could use some refinement (see Table 16). We think of equity as parity in program access, participation, and accomplishment for all program participants, especially those least well-served in the context (Greene et al., 2011). The key differences here are the focus on those least well-served and keeping in mind the context in which the program operates as it relates to such a focus. To be equitable, we cannot just be concerned with providing “equal” opportunities for participants. Rather, to make opportunities or accomplishments equal, there will need to be differentiation of access and resources, especially for those who traditionally have not received them. Although the NAS definition utilized the word fair, we believe additional nuance could be useful in determining focuses and direction for both PIs and evaluators doing this work. What does it mean for something to be fair? How can we further distinguish between equity and its often equated and similar companion, equality?
NAS (2018) Definition of Equity and Suggested Revision.

What Counts as Inclusion?
Although we argue that inclusion is essential to diversity efforts, its complexity can make it difficult to measure. Evaluators’ responses’ alignment with the NAS definition of inclusion were overwhelmingly maybe (81%), similar to ratings for equity. Evaluators most often reported measuring inclusion through surveys, interviews, and demographic information. PIs, on the other hand, had ratings of 45.8% maybe and 36.5% no. PIs received the most no ratings for responses within this construct. No's were assigned to PIs most often because responses would have fit more within the equity or diversity constructs, while no's for evaluators were often because they stated it was the PIs job to ensure inclusion. PIs most often reported focusing on inclusion in their projects through focusing on demographics, support for students, supplemental activities, and recruitment strategies. From our findings, it seems that PIs are engaging in activities that aim to foster inclusion, but it is unclear if evaluators are capturing those efforts or the outcomes of those efforts directly.
The NAS (2018) defines inclusion as “processes through which all students are made to feel welcome and are treated as motivated learners” (p. 19). Scholars and educators have argued that inclusivity is especially important when diversity is one of the aims of a project (e.g., Klenk et al., 2015). When broadening participation, especially in STEM, if efforts are not made to increase positive climates, then as the context is diversified, underrepresented individuals may not feel valued, welcomed, or like they belong (Puritty et al., 2017). Again, we believe that the NAS definition for inclusion could use some refinement for clarity. The current definition focuses on what is supposed to be done and less on the voices of the stakeholders or intended beneficiaries for whom the efforts are being made. We would argue the definition of inclusion should not focus on the processes to make students feel welcome, but instead have an explicit focus on intended outcomes and/or measurement of those efforts. A suggested revision to this definition is in Table 17 below.
NAS (2018) Definition of Inclusion and Suggested Revisions.

Limitations
The terms diversity, equity, and inclusion are highly ambiguous and contentious. We were limited in our space to ask questions on the survey and align respondent identities across the two surveys, as this DEI-related research effort is one of four research studies that were collecting survey data simultaneously (within the same survey) for the EvaluATE project at the time. All of the studies also shared the same participant population of ATE PIs and external evaluators. Although it has been useful to be a part of a larger research team, it was difficult to only have access to survey data collection methods and be dependent on the timeline of the larger EvaluATE project. Thus, we had to reduce our measurement of DEI to just a handful of closed- and open-ended questions for each survey. This resulted in responses that were difficult to understand and categorize. For example, in the evaluators’ qualitative descriptions of the types of data they collected, there may have been no indication of who the sample was, how the data were collected, the type of data collected, or the data source. In a survey, probing further on complex topics is already difficult; the limited space added a layer to that difficulty.
Both the PI and evaluator surveys contained two Likert-style items: one inquiring about the direct engagement in activities associated with DEI and one inquiring about the extent to which evidence was gathered in relation to DEI. Although it is desirable to have the same scale point labels, the labels between the PI survey and the evaluator survey varied slightly. For evaluators, scale options were (1) not at all, (2) minimal extent, (3) moderate extent, (4) substantial extent, and (5) very substantial extent. For PIs, scale options were (1) not at all, (2) to a small extent, (3) to some extent, (4) to a moderate extent, and (5) to a great extent. The decision to have slightly different questions for PIs and evaluators emerged from the desire to fully answer the research questions. Even with this difference in response options, we do not believe that it substantially detracted from our ability to compare responses between the two populations, though these findings should be interpreted with caution. Also, we were unable to link PIs and evaluators by project, so both datasets stand on their own, although some PIs and evaluators may have filled out the survey about the same project.
These findings represent the first of a series of investigations within a larger research project. We understand the limitations associated with survey methodology including lack of triangulation of responses as well as the inability to gauge the nuance of individuals, experiences and perspectives around the constructs of DEI. However, we believe these findings provide a novel and timely window into the complexity of these constructs in project and evaluation practice.
Conclusion: Promoting Reflective Practice and Centering DEI
These findings are salient, as soon after this data collection occurred, the societal and political relevance of these issues was heightened, and further exploration into these areas has become more necessary and pertinent than ever. During conversations (formal and informal), presentations, and panels at numerous evaluation conferences, we have learned that ATE evaluators and PIs, while well-intentioned, may not be attending to DEI holistically in their work.
Although both PIs and evaluators agree that the project itself is engaging with DEI, there is much less confidence about the evaluation of and measurement of these efforts. Furthermore, when we examined responses about the ways in which and type of data being collected, the majority of the time, we were unable to definitively say it aligns with how the NAS (2018, p. 19) has defined diversity, equity, and inclusion. From a methodological standpoint, that is problematic; as evaluators, we should collect data to examine the success of project goals. In addition, for us to move the needle on these issues, we need to engage in critical, explicit, conversations with our PIs around diversity, equity, and inclusion issues regardless of the extent to which PIs are directly engaging in DEI.
We have to collect data on what's being done, what is not being done, what's working, and what's not working. Our efforts as evaluators need to be both aligned with the activities happening in the context of our projects and also be sensitive enough to interrogate DEI even when it is not clear how PIs or projects plan to or are engaging in these constructs. Additionally, our inquiry into this process has led to further reflection by ATE leadership, PIs, and evaluators on how to better focus on these issues; after taking our survey, study participants have made multiple requests for workshops (which we provided) on developing indicators and measuring DEI.
To further develop DEI-related work, it is important to be intentional in our efforts; specifically, our findings suggest that evaluators need to actively promote evaluative thinking and critical reflective practice in their work (Archibald et al., 2018; Buckley et al., 2015; Freire, 1996; Smith et al., 2015; Tovey & Archibald, 2022; Tovey & Skolits, 2021). Our work's embeddedness in context, culture, and humanness demands it. We, in upholding our principle toward the common good, need to do our best to ensure that we are not implicitly condoning and perpetuating oppressive systems and practices. Evaluation can “give voice to those who have suffered generations of inequities in the social and political power structures maintained by the status quo” (Thomas & Madison, 2010, p. 575).
Such reflection could lead to the disruption and rejection of the status quo; a challenging of discursive, temporal, relational, and political power (Stickl Haugen & Chouinard, 2019); and a centering of social justice as fundamental in evaluation (Boyce & Chouinard, 2017; Mertens & Hopson, 2006). To effectively measure DEI in evaluation contexts, we need to be willing, able, and ready to facilitate critical reflection on what is going well, what is not going well, and what could be done to improve programmatic attention toward diversity, equity, and inclusivity.
We will continue to argue that program evaluation can embody the values of a more just society and be positioned as a social, cultural, and political force to address inequity. We desire that this study will provide insight into the extent and ways in which evaluators and PIs are measuring and defining diversity, equity, and inclusion. We believe there continues to be room for improvement and implore the movement of engagement with these important topics from the margins to the center of our education, theory, and practice (Thomas & Madison, 2010). As we watch recent trends within the field, we are increasingly, though cautiously, optimistic that our colleagues who have spent their careers issuing clarion calls will soon see their visions realized and that social justice, cultural responsiveness, and engagement with diversity, equity, and inclusion will become the ethos of our field.
Supplemental Material
sj-pdf-1-aje-10.1177_10982140221108662 - Supplemental material for Exploring NSF-Funded Evaluators’ and Principal Investigators’ Definitions and Measurement of Diversity, Equity, and Inclusion
Supplemental material, sj-pdf-1-aje-10.1177_10982140221108662 for Exploring NSF-Funded Evaluators’ and Principal Investigators’ Definitions and Measurement of Diversity, Equity, and Inclusion by Ayesha S. Boyce, Tiffany L.S. Tovey, Onyinyechukwu Onwuka, J.R. Moller, Tyler Clark and Aundrea Smith in American Journal of Evaluation
Supplemental Material
sj-pdf-2-aje-10.1177_10982140221108662 - Supplemental material for Exploring NSF-Funded Evaluators’ and Principal Investigators’ Definitions and Measurement of Diversity, Equity, and Inclusion
Supplemental material, sj-pdf-2-aje-10.1177_10982140221108662 for Exploring NSF-Funded Evaluators’ and Principal Investigators’ Definitions and Measurement of Diversity, Equity, and Inclusion by Ayesha S. Boyce, Tiffany L.S. Tovey, Onyinyechukwu Onwuka, J.R. Moller, Tyler Clark and Aundrea Smith in American Journal of Evaluation
Footnotes
Acknowledgments
The authors would like to thank Adeyemo Adetogun, Grettel Arias Orozco, Cherie Avent, Sharon Ladokun, Kellar Poteat, Aileen Reid, and Myrah Stockdale for their assistance with survey item development and data analysis during the initial phase of this project. The authors also thank Western Michigan University EvaluATE team members for their feedback and support at every stage of this research project.
Declaration of Conflicting Interests
The author(s) declared no potential conflicts of interest with respect to the research, authorship, and/or publication of this article.
Funding
The author(s) disclosed receipt of the following financial support for the research, authorship, and/or publication of this article: This work was supported by the National Science Foundation (grant number 1841783).

Supplemental Material
Supplemental material for this article is available online.
References
Supplementary Material
Please find the following supplemental material available below.
For Open Access articles published under a Creative Commons License, all supplemental material carries the same license as the article it is associated with.
For non-Open Access articles published, all supplemental material carries a non-exclusive license, and permission requests for re-use of supplemental material or any part of supplemental material shall be sent directly to the copyright owner as specified in the copyright notice associated with the article.
