



Abstract
School-wide positive behavior support (SWPBS) focuses on promoting social competence through the establishment of behavior expectations that are explicitly taught and reinforced by all teachers across all settings. This study investigated the validity of using adherence to SWPBS behavior expectations as a screening tool for predicting behavior risk status. A total of 961 students at a middle school serving Grades 6 through 8 were screened using the school’s SWPBS expectations and a standardized norm-referenced emotional and behavioral screener. Results revealed strong associations between the extent of students’ adherence to SWPBS expectations and the adaptive, externalizing, and school problem constructs derived from the norm-referenced screener items; associations with the norm-referenced screener’s internalizing construct were weaker. Classification analyses yielded mixed results despite the comparability between the results of the SWPBS expectations procedure and the standardized norm-referenced screener.
Keywords
School-wide positive behavior support (SWPBS) is a prevention-oriented approach that focuses on reducing school-based behavior problems and increasing students’ social and behavioral success. SWPBS focuses on evidence-based behavioral practices (Sugai, Hagan-Burke, & Lewis-Palmer, 2004; Sugai & Horner, 2006) and incorporates many features of a response to intervention (RtI) approach (Hawken, Vincent, & Schumann, 2008; Sugai & Horner, 2006, 2009). Sugai and Horner (2009) noted that RtI provides a framework and coherent set of principles for guiding assessment, decision making, and intervention. Moreover, they paralleled SWPBS levels (i.e., tiers) of intervention for schools and classrooms with an RtI approach. Specifically, in gauging responsiveness to SWPBS, approximately 80% of students in a school will typically respond favorably to SWPBS as a universal (i.e., Tier 1) intervention (Sugai & Horner, 2006). However, approximately 15% of a school’s student population will also require secondary (i.e., Tier 2) behavioral supports, and approximately 5% will require tertiary (i.e., Tier 3) intervention to successfully meet the social-behavioral demands of school (Sugai & Horner, 2006).
General Features of SWPBS
There are several general features of most SWPBS implementations (Sugai et al., 2004; Sugai & Horner, 2006). At Tier 1, or the universal tier, the implementation of SWPBS focuses on preventing and reducing school discipline and behavior problems through the development and implementation of a school discipline plan. The SWPBS leadership team in conjunction with staff, parents, and students typically develops a school discipline plan. At the core of this plan is a set of positively worded behavior expectations (i.e., SWPBS behavior expectations). The SWPBS behavior expectations provide a focal point for implementation and often reflect highly valued traits, behavioral characteristics, and expected prosocial behaviors.
Detailed procedures are included in the SWPBS discipline plan for explicitly teaching the SWPBS behavior expectations to all students across all settings (Sugai et al., 2004). For each SWPBS expectation, procedures focus on identifying and teaching specific appropriate behaviors and social skills to be in a variety of classroom and nonclassroom situations (e.g., hallways, cafeteria, and recess). Teaching SWPBS behavior expectations extends beyond merely telling students the rules and having them sign a copy, or posting the rules on a wall. Rather, instruction is presented in a similar fashion as academic content, using a range of examples and nonexamples, ample opportunities for students to respond and practice during the lesson, evaluation tasks to assess the extent of students’ understanding, and planned practice in natural contexts.
Additional features of a SWPBS discipline plan include procedures for acknowledging and reinforcing students who successfully adhere to the SWPBS behavioral expectations, and disciplinary procedures for consistently responding to students who continue to violate SWPBS behavioral expectations (Sugai et al., 2004). Finally, SWPBS discipline plans typically outline procedures for monitoring behavioral progress. A variety of different data sources can be used to accomplish this. Office discipline referrals (ODRs) are often used to monitor patterns of problem behaviors as well and identify those students who may be nonresponsive to SWPBS and in need of more intensive (i.e., Tiers 2 or 3) behavior support (Sugai, Sprague, Horner, & Walker, 2000).
Behavioral Screening Using SWPBS Expectations
Universal screening for risk is a fundamental feature of RtI (Sugai & Horner, 2009) and a current topic in the areas of special education, school psychology, and mental health (Cook, Volpe, & Livanis, 2010; Elliott, Huai, & Roach, 2007; Severson, Walker, Hope-Doolittle, Kratochwill, & Gresham, 2007). Some researchers have discussed integrating universal behavioral screening into SWPBS implementations to predict and identify behavioral risk (Hawken et al., 2008; Lane, Parks, Kalberg, & Carter, 2007; Walker, Cheney, Stage, & Blum, 2005). However, to date, ODRs have been the predominant metric for identifying students at behavioral risk within SWPBS implementations (Lane et al., 2007; McIntosh, Campbell, Carter, & Zumbo, 2009; Sugai et al., 2000). To determine behavioral risk status, Sugai et al. (2000) indicated that students who receive 0 to 1 ODR in a given school year are at low risk for behavioral problems, whereas earning 2 to 5 ODRs in a school year is associated with moderate risk and receiving more than 6 ODRs is associated with high risk for behavioral problems. ODRs are a practical method for identifying students who may have conduct problems. Unfortunately, the use of ODRs alone is not sufficiently proactive for universal screening within SWPBS implementations. When monitoring ODRs to determine potential behavioral risk, students must commit multiple behavior violations to be identified for secondary or tertiary tier interventions. In an ideal situation, those students who may need Tier 2 or Tier 3 behavioral support would be identified earlier in the school year, long before they have exhibited problem behaviors that are frequent and intense enough to warrant multiple ODRs and subsequent disciplinary actions.
Perceived adherence to the behavior expectations developed by school teams implementing SWPBS could be useful as a screening tool for identifying students who may need more intensive support (Burke et al., 2012). The positively worded behavior expectations developed by SWPBS teams communicate a common set of social expectations or, rather, a local standard of behavioral competence typically reflected by socially desirable traits, characteristics, and prosocial behaviors (see Lynass, Tsai, Richman, & Cheney, 2012, for a thorough description on the use of behavior expectations in SWPBS). For example, Taylor-Greene et al. (1997) implemented SWPBS in a rural middle school of approximately 530 students. Their SWPBS expectations were (a) be respectful, (b) be responsible, (c) be there—be ready, (d) follow directions, and (e) keep hands and feet to self. In another example, Warren et al. (2006) focused their SWPBS expectations on (a) be responsible, (b) be respectful, (c) be ready to learn, (d) be cooperative, and (e) be safe in an inner-city middle school implementation of SWPBS with approximately 737 students. Similarly, Bohanon et al. (2006) used (a) be respectful, (b) be responsible, (c) be academically engaged, and (d) be caring in a high school SWPBS implementation with 1,800 students. In each of these instances, the behavioral expectations used by these schools were developed as part of SWPBS implementation. To some degree, the SWPBS expectations in these schools guided implementation efforts, and perhaps the extent of student adherence could have functioned as a mechanism for universal screening to identify students who were at risk of school-based behavior problems.
The school-wide behavior expectations developed during the course of a SWPBS implementation relate well conceptually to the construct of social competence. Gresham (2000) defined social competence as “an evaluative term based on judgments that a person has performed a social task competently” (p. 52). In the case of SWPBS implementations, the focus is on mastery of key social competencies related to school expectations and the social task is adhering to a particular school’s behavioral expectations (Walker, Ramsey, & Gresham, 2004). Whether a student can meet these expectations is an indicator of a range of social and behavioral outcomes (Burke et al., 2012). Moreover, adherence to behavioral expectations can also be regarded as an indicator of whether there is a good person–environment fit or, rather, the degree to which there is a match between the capabilities, skills, resources, and motivations of the student and the demands of the school environment (Walker et al., 2004). Students who have difficulty meeting the behavioral expectations set by a school within the context of SWPBS are less likely to have a good person–environment fit and are more likely to experience difficulty meeting the social, academic, and behavioral demands required for school success (Burke et al., 2012; Walker et al., 2004).
Anchoring SWPBS behavior expectations as items for universal screening may provide schools implementing SWPBS with a brief, low-cost, teacher-friendly, and criterion-referenced screening tool (Burke et al., 2012). As illustrated by Taylor-Greene et al. (1997), Warren et al. (2006), and Bohanon et al. (2006), the focus of SWPBS is to build a culture of social-behavioral competence by defining, explicitly teaching, and positively reinforcing a set of school-wide behavioral expectations. Within a SWPBS framework, behavioral expectations may have greater utility when used as a broadband screener by providing school teams with a contextually relevant set of items that can help inform judgments of behavioral risk and responsiveness to school-wide intervention (Burke et al., 2012). When a student is perceived as failing to adhere to the behavioral expectations developed for SWPBS implementation, there is cause for concern and these students may be in need of Tier 2 or Tier 3 behavior interventions (Burke, Vannest, Davis, Davis, & Parker, 2009; Hagan-Burke, Burke, & Sugai, 2007; Hawken, MacLeod, & Rawlings, 2007; Sugai, Lewis-Palmer, & Hagan-Burke, 1999–2000; Vannest, Davis, Davis, Mason, & Burke, 2010).
Moreover, the use of SWPBS expectations as screening items may be more acceptable to schools implementing SWPBS that want to minimize the labeling and stigma associated with the mental health-oriented items on many standardized screening protocols. There are legitimate concerns regarding universal screening that often must be overcome by schools adopting a behavioral screening system. For example, Volpe, Briesch, and Chafouleas (2010) indicated that some screeners emphasize or use items associated with psychopathology as many instruments were developed for the purpose of screening to “identify students in need of further assessment for diagnosis of psychiatric disorders or special education classification” (p. 241). Similarly, Chafouleas, Kilgus, and Wallach (2010) identified community acceptance, family rights, and misidentification among several concerns regarding universal screening for behavior problems. They point out that screeners that include items querying sensitive information (e.g., illegal, antisocial, self-incriminating, or demeaning behavior), or focus on the mental or psychological problems of the student or his/her family, may prove difficult for widespread implementation due to community and family concerns.
A considerable investment of time and effort is made during an SWPBS implementation to gain teacher, administrator, and parental buy-in regarding the development of a school’s SWPBS expectations. For the individual school implementing SWPBS, the SWPBS expectations represent highly valued standards of social-behavioral competence that are self-identified by the school as being important. From this perspective and within the context of a SWPBS implementation, the use of SWPBS expectations as screening items has strong face validity.
Study Rationale and Research Questions
In this current study, we examined the degree to which using SWPBS expectations used for behavioral screening in middle school is associated with aspects of behavioral risk. Universal or school-wide behavioral screening using SWPBS expectations provides a relatively brief, low-cost, teacher-friendly tool for proactively predicting risk and identifying students having difficulties adhering to those expectations, and thus, potentially nonresponsive to SWPBS. Previously, we investigated use of SWPBS expectations for behavioral screening in identifying risk at the elementary school level (Burke et al., 2012). Middle school represents a different stage in the social development of children as they transition into adolescence. To extend the previous research at the elementary school level and examine the viability of using SWPBS expectations as a screening tool in middle school, we investigated the relations among SWPBS expectation items, an established standardized norm-referenced emotional and behavior screener, and the ODRs from a middle school implementing SWPBS.
Empirical examination of the relations between measures and any underlying constructs is a fundamental step required to establish the validity of a measure, procedure, or instrument that would be used for the purpose of behavioral screening (Messick, 1995). Examining the patterns of associations of a new or experimental procedure with an instrument with known measurement properties helps in understanding the new procedure or, rather, helps establish the validity of the new procedure (Salvia, Ysseldyke, & Bolt, 2007). The teacher report screener from the Behavior Assessment System for Children—Second Edition (BASC-2) Behavioral and Emotional Screening System (BESS; Kamphaus & Reynolds, 2008) was selected as an established outcome measure due to the range of empirically derived items contained on the instrument that tap multiple social-behavioral risk constructs. The strength of the relationship between adherence to meeting SWPBS expectations and behavioral risk characteristics can be determined by examining converging or diverging patterns of associations with the BESS. In addition, the extent to which the SWPBS expectation procedure is correctly identifying those students who are, or are not, at behavioral risk can be determined by examining classification accuracy.
More specifically, we first investigated whether the correlations between the SWPBS expectations converged or diverged with individual BESS items (Kamphaus & Reynolds, 2008). Second, we examined the constructs of the SWPBS screening approach by relating the expectation construct reflected in the SWPBS expectations with the four underlying constructs (adaptive skills, school problems, externalizing, internalizing) reflected by the BESS. Third, we examined the classification accuracy of SWPBS expectations with the norm-based risk status categories derived from the BESS. Last, we examined the classification accuracy of the SWPBS expectation procedure and BESS in predicting ODR risk status.
Method
Participants and Setting
A middle school located in a suburban area of central Texas whose school district was implementing SWPBS agreed to participate in the study. From this middle school, 43 content area teachers (e.g., math, science, social studies, but not elective teachers) completed screening protocols on 961 students. This middle school was beginning their 2nd year of SWPBS implementation, reflected by a total School-Wide Evaluation Tool (SET; Horner, 2004) score of 73%. The school had developed SWPBS expectations, had developed a behavioral matrix and reinforcement program, had a SWPBS leadership team in place, and was receiving ongoing support from a district-level behavioral coach. Table 1 provides the middle school’s demographics. As displayed, there were slightly more students in the sixth grade than in the other grades, and slightly more girls than boys. The middle school served an ethnically diverse population with a large number of Hispanic/Latino (n = 331) and Black/African American (n = 231) students. Approximately, 356 students were considered to be economically disadvantaged and were receiving either free or reduced-cost lunch. A total of 72 students were receiving some type of special education service.
Description of Students at Participating Middle School.

Note. ELL = English language learner.
Instruments and Measures
SWPBS expectations
We used the school’s SWPBS expectations, initially developed by the school’s SWPBS implementation team, as descriptor items for a brief universal screening protocol that occurred in October of the school year. The specific SWPBS expectations developed by the school were (a) preparation, (b) respect, (c) integrity, (d) dedication, and (e) effort (PRIDE). Content area teachers were asked to rate the degree to which their students were meeting or adhering to each behavioral expectation on a 5-point Likert-type scale (1 = never or almost never, 2 = rarely, 3 = sometimes, 4 = often, 5 = always or almost always). A class list with student names was provided for each teacher along with the behavioral expectations using a web site developed for this study. The administration directions were as follows: Listed below is your student roster. Please respond to the question regarding the degree to which each student listed meets your school-wide expectations. Please rate each student 1 through 5. Please mark every item. If you don’t know or are unsure of your response to an item, give your best approximation. The internal consistency using Cronbach’s alpha was .95 for the five expectations.
BASC-2 BESS
We administered the teacher report from the BASC-2 BESS (Kamphaus & Reynolds, 2008) as a criterion measure in October of the school year, approximately 2 weeks after the SWPBS expectation procedure. The BESS is a standardized behavioral screener, and the teacher form consisted of 27 items empirically derived from the original BASC (Kamphaus & Reynolds, 2008). The screener consists of items that reflect behavioral risk from four domains: externalizing problems, internalizing problems, school problems, and adaptive skills. Each domain is represented by six items except for internalizing, for which the BESS oversamples with nine items. Items are rated on a 4-point Likert-type scale (never, sometimes, often, always). Scores from these domains are translated into a total behavior risk score, which is compared with a national norm for determining risk categories. The test–retest reliability, as stated in the BESS manual, is .91, with a split-half reliability of .96. Correlations between the BESS and the BASC-2 teacher rating scales are .80 for externalizing problems, .64 for internalizing problems, .89 for school problems, −.85 for adaptive skills, and .91 with the behavioral symptoms index.
ODRs
We used the number of ODRs in February of the school year to examine short-term classification accuracy. Data were downloaded from the Referral Assessment Management Portal (RAMP; Education Service Center Region XIII, 2010). RAMP is a web-based data system developed and supported by a local regional center serving the participating middle school. The number of ODRs generated by student was downloaded and coded for behavioral risk. ODRs from zero to one were considered an indicator of nonrisk status, whereas two or more ODRs were considered to be an indicator of increased behavioral risk (Sugai et al., 2000).
Procedures
The SWPBS expectations screener and the BESS were administered in October, thus providing several weeks after the start of the school year for teachers to become familiar with their students. The SWPBS expectations items were administered online using a website developed for this study. Teachers were given a password that provided them access to a webpage that listed their class lists and the SWPBS expectations for their school. For each SWPBS expectation, they were asked to rate on a 5-point Likert-type scale the degree to which a particular student met the expectation. The data collection for the SWPBS procedure was conducted at the beginning of October and content area teachers were targeted as respondents for the two screeners; thus, each student was only rated once. Once all teachers had responded to the SWPBS expectations, the BESS was distributed to teachers by the SWPBS coach. Teachers were allowed 2 weeks to complete and return the BESS. The SWPBS coach followed up with teachers at the middle school regarding missing students or items either by e-mail, or, if needed, in person. The ODRs were then downloaded in February from the RAMP system and coded for behavioral risk.
Data Analysis
We developed a data analysis plan to examine the relations between the SWPBS screening procedure and items from the norm-referenced BESS. After examining the descriptive statistics, we generated a correlation matrix that reflected the associations between SWPBS expectations and the BESS items. Second, we further examined the concurrent and construct validity of the SWPBS expectation procedure through structural equation modeling (SEM; Kline, 2004) by relating the underlying school expectation construct to four risk domains derived from the BESS. The behavioral risk constructs formed from the BESS consisted of externalizing problems, internalizing problems, school problems, and adaptive skills. SEM can analyze measurement and structural models that take measurement error into account so that relations may be examined among error-free constructs. In the models generated, we used the type = complex routine in Mplus (Muthén & Muthén, 2007) to account for the dependency among observations (student) within clusters (teacher). This particular procedure takes the nested structure and the nonindependent observations into consideration by adjusting the standard error of the estimated coefficients. We evaluated the overall SEM model using several fit indices, including (a) the root mean square error of approximation (RMSEA; Steiger, 1990) and its 90% confidence interval (CI; MacCallum, Browne, & Sugawara, 1996), (b) the standardized root mean square residual (SRMR; Hu & Bentler, 1998), and (c) the comparative fit index (CFI; Bentler, 1990). The fit of the model was determined by commonly used criteria, including a RMSEA of less than .08, SRMR of less than .08, and a CFI of greater than .90. Once the SEM models were constructed, the variance explained by the expectations-based construct was determined. The R2 was then obtained by subtracting the residual variance of the latent factor from 1, given that there was no other predictor and that all coefficients were standardized so that the variance of latent factor equals 1. Last, we used logistic regression (LR) and receiver operator characteristic (ROC) curve outputs (Pepe, 2003; Swets, Dawes, & Monahan, 2000; Zhou, Obuchowski, & McClish, 2002) to evaluate the odds ratios and classification accuracy of the SWPBS expectations screener with two categorical behavioral risk levels from the BESS (elevated/not elevated) and two categorical risk levels using ODRs (less/more than two ODRs). Reported from the LR outputs are the sensitivity index, specificity index, positive predictive value (PPV), and negative predictive value (NPV) for various cut points. The sensitivity index focuses on whether the SWPBS expectations items will correctly identify those students who have been identified on the outcome measure as at risk (BESS or ODRs). Sensitivity is defined as the proportion of students who are “at risk” on both measures (i.e., true positives) divided by the sum of true positives and false negatives on an outcome measure (TP / [TP + FN]). False negatives are defined as students who were found to be at risk on the BESS or ODR metric but not at risk on the SWPBS measure. Specificity focuses on whether SWPBS expectations will accurately identify those students who have been identified from the BESS or ODRs as not at risk. The specificity index is defined as the proportion of students who are not at risk on both measures (i.e., true negatives) divided by the sum of true negatives and false positives on an outcome measure (TN / [TN + FP]). False positives are defined as students who were found to be not at risk on the BESS or ODR metric but at risk on the SWPBS measure. PPV indicates the accuracy of the SWPBS expectation procedure in determining students at risk. PPV is the proportion of true positives divided by all students found to be at risk on the SWPBS measure (TP / TP + FP). Conversely, the NPV indicates the accuracy of the SWPBS expectations in determining students who are not at risk. NPV is the proportion of true negatives divided by all students found to be not at risk on the SWPBS measure (TN / TN + FN).
Results
Descriptive Statistics and Correlations
Table 2 provides the means, standard deviations, and correlations for the SWPBS expectations and BESS items. Due to a large number of correlations between measures, we only report the correlations between the SWPBS expectations and the BESS items. Correlations between SWPBS expectations and most of the BESS items should be interpreted as negative. In other words, as the scores on expectations increase, the relative risk on most BESS areas decreases. Two exceptions are BESS Item 1 (pays attention) and the adaptive skills items, which are interpreted as positive correlations. The correlations between school expectations and BESS items ranged from (a) .53 to .65 for school problems, (b) .47 to .71 for the externalizing items, (c) .13 to .60 for the internalizing items, and (d) .40 to .65 for the adaptive skills items. For all five domains, items within a domain were significant and positively correlated with each other (at p < .05), with correlations ranging from .22 to .86. The SWPBS expectations total score was also correlated with BESS items. The correlations between SWPBS expectations total score and individual BESS items ranged from (a) .61 to .70 for school problems, (b) .62 to .71 for the externalizing items, (c) .16 to .57 for the internalizing items, and (d) .48 to .68 for the adaptive skills items. The relationship between total expectation score and BESS subscale total score was also investigated. The BESS subscale total score was the sum of items within a subscale. The correlations between the SWPBS expectation and BESS-derived subscale scores were .77 for school problems, .73 for the externalizing items, .47 for the internalizing items, and .69 for the adaptive skills items. The correlation between the school expectations total score and the BESS total behavioral risk score was .82.
Correlations, Mean, and Standard Deviations (N = 961) Among SWPBS Expectations and BESS Items.

Note. SWPBS = school-wide positive behavior support; BESS = Behavioral and Emotional Screening System. All correlations are significant at alpha = .05; TS = Total expectation score.
SWPBS expectations: PRIDE 1 = preparation, 2 = respect, 3 = integrity, 4 = dedication, and 5 = effort.
SEM
Figure 1 illustrates the hypothesized SEM model with the SWPBS expectations construct predicting the four constructs (or domains) of BESS. The overall fit of the original model was not fully satisfactory (CFI = .866, RMSEA = .066 with 90% CI = [.060, .072], and SRMR = .083). Six correlated residuals were added to improve the overall model fit as follows: (a) Items 2 and 4 from the externalizing problem domain, (b) Items 14 and 20 from the internalizing problems domain, (c) Items 15 and 22 of the internalizing problems domain, (d) Items 23 and 26 of the school problems domain, (e) Items 5 and 24 of the adaptive skills domain, and (f) the Respect and Integrity expectations from the school expectation domain. Correlated residuals often imply content overlap or similar phrasings, and allowing residuals to be correlated is sometimes necessary for model improvement and interpretation (Brown, 2006). The added correlated residuals were only between items from the same domain. Compared with the original model, the modified model fits the data better (CFI = .903, RMSEA = .054 with 90% CI = [.051, .056], and SRMR = .081). All coefficients had the same pattern and significance between the models with and without correlated residuals. All the items of the five constructs were significant at p < .05 and positively loaded on the corresponding constructs. In addition, the SWPBS expectations factor negatively predicted the externalizing problems, internalizing problems, and school problems, whereas it positively predicted the adaptive skills. In other words, students who were more likely to meet the school expectations were less likely to have externalizing problems, internalizing problems, and school problems, and more likely to display adaptive skills. All the path coefficients were standardized and statistically significant at p < .05 after controlling for three student-related demographic variables: grade, gender, and ethnicity. Finally, SWPBS expectations explained 50% of the variance in externalizing problems, 21% of variance in internalizing problems, 55% of variance in school problems, and 31% of variance in adaptive skills.

Structural equation model of the SWPBS expectations and EX, IN, and SP, and AS constructs.
Classification Accuracy
Table 3 provides classification accuracy comparisons of (a) SWPBS total scores with BESS risk status, (b) SWPBS total scores with ODR risk status, and (c) BESS risk status with ODR risk status. Overall, the BESS indicated that for a T-score of 60, 816 (85%) were found to be not at risk on the BESS, meaning they were in the normal range of functioning when compared with the BESS national norm group, whereas 145 (15%) were found to have elevated risk levels. For ODRs, 840 (87%) had either zero or one ODR and were considered not at risk, whereas 121 (13%) had two or more major ODRs.
Classification Accuracy Comparisons of SWPBS Cut Scores With BESS Risk Status, SWPBS Cut Scores With ODR Risk Status, and BESS Risk Status With ODR Risk Status.

Note. SWPBS = school-wide positive behavior support; BESS = Behavioral and Emotional Screening System; ODR = office discipline referral.
Sensitivity = (TP / [TP + FN]).
Specificity = (TN / [TN + FP]).
PPV = positive predictive value (i.e., TP / [TP + FP]).
NPV = negative predictive value (i.e., TN / [TN + FN]).
Cut score values for these comparisons are from the SWPBS expectations total score.
Cut score value for this comparison is from the BESS T-score indicating elevated and extremely elevated levels of risk.
SWPBS expectations and BESS risk status
A LR was conducted to predict student behavioral risk status as assessed by the BESS using SWPBS expectations as a continuous predictor. A test of the full model was statistically significant, indicating that the SWPBS expectations reliably distinguished between nonrisk and at-risk students as determined by the BESS, χ2(N = 961, 1) = 376.983, p = .000. Moreover, Nagelkerke’s R2 of .577 indicated a moderate relationship between prediction and group membership. Prediction success was 90% overall, with 97% for nonrisk and 54% for at risk. The odds ratio value indicates that when SWPBS scores decrease by 1 point, students are 0.605 times more likely to be classified as at risk. Conversely, the odds ratio value indicates that when SWPBS scores increase by 1 point, students were 1.652 times more likely to be classified as nonrisk. Moreover, there was an increased probability of being at risk on the BESS if students failed to meet expectations. Likewise, the probability of being not at risk on BESS increased as students met expectations. Provided is the overall accuracy, sensitivity, specificity, PPV, and NPV, which varied depending on the cut score. For example, a cut score of 16 corresponding to the 20th percentile resulted in an overall accuracy of 89%, sensitivity of 81%, a specificity of 91%, PPV of 61%, and a NPV of 96%. Overall accuracy across scores ranged from 89% to 90%, sensitivity ranged from 31% to 81%, specificity ranged from 91% to 99%, PPV ranged from 61% to 90%, and NPV ranged from 89% to 96%. In addition, a ROC analysis of the SWPBS expectations using BESS elevation scores as the outcome yielded an area under curve (AUC) estimate of .93 (see Figure 2). The AUC indicates a high likelihood that a randomly selected student with an “elevated” score on the BESS would have a lower sum score on the SWPBS expectations screener than a randomly selected student without an “elevated” score on the BESS.

ROC curve of SWPBS total score and BESS risk status.
SWPBS expectations and ODR risk status
A LR was conducted to predict student behavioral risk status using ODR data as the outcome and SWPBS expectations as a continuous predictor. A test of the full model was statistically significant, indicating that the SWPBS expectations reliably distinguished between nonrisk and at-risk students as assessed by ODR data, χ2(N = 961, 1) = 198.207, p = .000. Nagelkerke’s R2 of .360 indicated a weak relationship between prediction and group membership. Prediction success was 89% overall, with 98% for nonrisk and 27% for at risk. The odds ratio value indicates that when SWPBS scores decrease by 1 point, students are 0.735 times more likely to be classified as at risk on ODRs. Conversely, an odds ratio value indicates that when SWPBS scores increase by 1 point, students are 1.362 times more likely to be classified as nonrisk. Similar to when the BESS is used as an outcome, there was an increased probability of being at risk on ODRs as students failed to meet expectations. Likewise, the probability of being not at risk on ODRs increased as students met expectations. A cut score of 16, corresponding to the 21st percentile, resulted in an overall accuracy of 83%, sensitivity of 68%, a specificity of 86%, PPV of 41%, and a NPV of 95%. Overall accuracy across scores ranged from 83% to 89%, sensitivity ranged from 34% to 68%, specificity ranged from 86% to 97%, PPV ranged from 41% to 61%, and NPV ranged from 91% to 95%. In addition, SWPBS expectations were evaluated using student ODR risk categories as the outcome. A ROC analysis yielded an AUC estimate of .85 (see Figure 3). The AUC indicates a high likelihood that a randomly selected student with two or more ODRs would have a lower sum score on the SWPBS expectations screener (i.e., failing to meet expectations) than a randomly selected student without two or more ODRs.
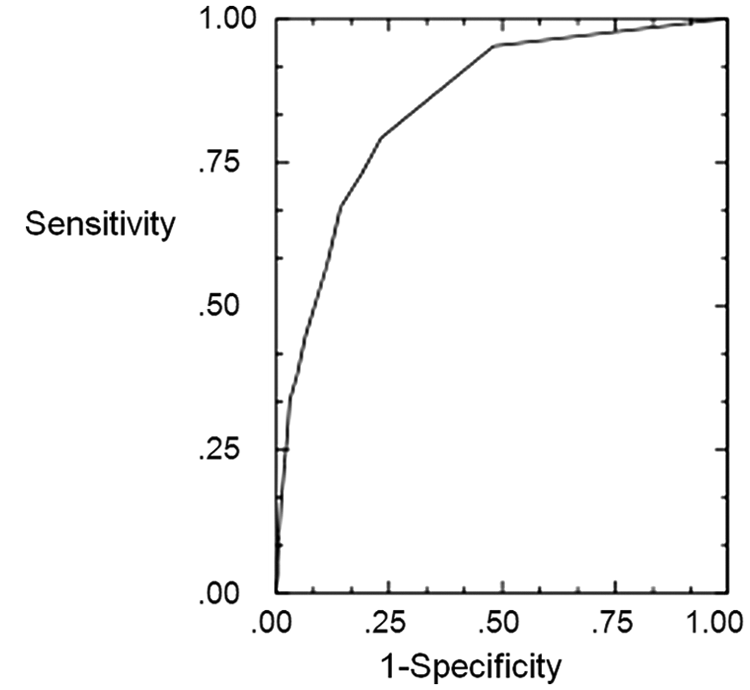
ROC curve of SWPBS total score and ODR risk status.
BESS risk status and ODR risk status
We conducted a LR to predict behavioral risk using ODR risk status as the outcome and the BESS as dichotomous predictor. A test of the full model was also statistically significant, indicating that the BESS reliably distinguished between normally functioning and at-risk students as assessed by ODR data, χ2(N = 961, 1) = 120.413, p = .000. Nagelkerke’s R2 of .228 indicated a weak relationship between prediction and group membership. Prediction success was 88% overall with 100% for nonrisk and 0% for at risk. The odds ratio value indicates that when BESS predictor changes from nonrisk to at risk, students are 0.087 times more likely to be classified as at risk using ODR as the outcome. Conversely, odds ratio value indicates that when BESS predictor changes from at risk to nonrisk, students are 11.456 times more likely to be classified as nonrisk on ODRs.
Discussion
The current study examined the degree to which using SWPBS expectations used for behavioral screening in middle school is associated with aspects of behavioral risk. Correlational analyses revealed overall patterns consistent with the previous elementary school study (Burke et al., 2012). SWPBS expectations primarily converged with the school problems, externalizing problems, and adaptive skills items on the BESS. The correlations between SWPBS expectations and BESS indicated that as scores on SWPBS expectations increased, scores on the BESS items related to school problems and externalizing problems decreased. In other words, the more likely a student was rated by a teacher as meeting SWPBS expectations, the less likely he or she was to be rated as having school or externalizing problems. Furthermore, moderate to strong positive correlations found between the SWPBS expectations and the adaptive skills items on the BESS indicated that the more likely a student was to meet SWPBS expectations, the better his or her adaptive skills. Likewise, the total scores from SWPBS expectations and the BESS showed moderate to strong correlations. In particular, a strong correlation was observed between SWPBS expectations and the BESS total score, indicating a close association between low adherence to SWPBS expectations and general behavioral risk. However, as with the earlier elementary school study (Burke et al., 2012), correlations diverged between SWPBS expectations and the internalizing items from the BESS, indicating that meeting or failing to meet expectations is not associated with internalizing behavioral risk.
We further examined SWPBS screening approach by relating the underlying expectation construct reflected by SWPBS expectations with the emotional and behavioral constructs reflected on the BESS using SEM. A pattern similar to the correlations reported in Table 2 was observed. Consistent with the prior research conducted at the elementary school level (Burke et al., 2012), we found that the constructs formed from the SWPBS expectations related well to the behavioral risk constructs of school problems, externalizing, and adaptive skills. Similarly, results from the structural model and standardized coefficients indicated SWPBS expectations had a strong concurrent relationship with school problems, externalizing problems, and adaptive skills constructs, but diverged from the internalizing construct. Likewise, the amount of variance explained by SWPBS expectations for the school problems, externalizing problems, and adaptive skills constructs was substantive, whereas the amount of explained variance from the internalizing construct was weaker.
Finally, a screening tool should ideally have reasonably good sensitivity and specificity, and accurately predict those students most likely to experience behavioral difficulties. This prediction involves a balance between four different classification rates. Correct classification involves accurately identifying those students as at risk who are most likely to experience behavioral difficulties (true positives) while also correctly identifying those not at risk (true negatives), but minimizing misidentifying students as not at risk when they really are (false negatives) or misidentifying students as at risk when they really are not (false positives; Walker et al., 2004). Both false positives and false negatives represent prediction error, and the goal of a classification analysis is to identify a cut score that minimizes both while maximizing accurate classification. In this study, overall classification was excellent, as was the AUC, NPV, and specificity; however, PPV and sensitivity remained relatively modest. The high specificity levels and high NPV suggest that the SWPBS expectation procedure was better able to identify those students who were not at risk relative to those who were. These results are comparable when examining the classification rates of the BESS as a comparison. This result is similar to our earlier finding at the elementary school level (Burke et al., 2012), where sensitivity and PPV levels were also modest until the 20th percentile was reached. A comparison of the SWPBS expectations procedure and the BESS shows somewhat similar results for both screening measures. Although at-risk determination was mixed, both were accurate at determining who was not at risk, and SWPBS expectations are roughly equivalent to the BESS at the 16th percentile.
Implications for Integrating Screening Into SWPBS Implementations
This study has several implications for integrating screening practices into SWPBS implementations. A primary goal of SWPBS is to improve prosocial behaviors and put multiple interrelated procedures in place that increase the number of students who successfully meet SWPBS behavior expectations (Sugai et al., 2004). The goal of using SWPBS expectations as a screening tool is to identify those students who are not sufficiently adhering to the expectations early enough in the school year to intervene in time to avoid the cumulative disciplinary actions associated with multiple ODRs. Results of this study indicate that SWPBS expectations may be viable as an initial gate, in which students identified as having difficulty adhering to SWPBS expectations can be reviewed by SWPBS teams. In the current study, we found that a risk pool constituting approximately 20% of the students screened produced reasonably good classification rates. This finding is similar to our previous work at the elementary level (Burke et al., 2012) and consistent with the result provided by the BESS in this study. Moreover, the 20% threshold aligns with the prevention-based logic of SWPBS, which states that approximately 15% of a school population will have elevated risk levels and may require Tier 2 intervention and approximately 5% will require more intensive Tier 3 intervention (Sugai et al., 2004; Sugai & Horner, 2006).
Potentially, schools implementing SWPBS could use the behavior risk lists developed from the SWPBS expectation screening procedure as a complement to ODRs to determine which students need to be targeted for additional intervention. School teams implementing typically SWPBS engage in problem solving to identify interventions for students who are at risk (e.g., Todd et al., 2011). When using the screening procedure described in this article, each student in a school would be evaluated, preferably after the first few weeks of the school year when the primary focus of a SWPBS implementation is on teaching and establishing adherence to the SWPBS expectations. The SWPBS expectation risk score could then be used as an additional source of data by school teams to identify students early on for proactive problem solving and support, before they display problem behaviors that are frequent or intense enough to warrant an ODR.
Limitations and Future Directions for Using SWPBS Expectations in Screening
Although this study provides preliminary evidence supporting the use of SWPBS behavior expectations as behavioral screening items, its limitations must be considered. First, the number of raters may not have provided a full account of students’ behavioral functioning. Only one content area teacher (e.g., math, science, social studies) rated each student. This approach minimized the amount of time it would take to complete the ratings. Although schools must strive to strike a balance between the time it takes to screen all students and the value of information gathered, multiple raters may have yielded improved classification rates and provided a more accurate risk profile. Specifically, problem behaviors are often “context dependent,” and it is likely that some students exhibited varying types and amounts of problem behaviors across settings. Existing research does not provide guidance regarding the number or type of raters sufficient for middle school behavior screening, as we were unable to locate other screening studies at the middle school level that used multiple raters. Further studies are needed to establish the optimal number of raters to provide an accurate measure of social competence as reflected in SWPBS expectation adherence at the middle school level.
As a second limitation, we continue to have concerns similar to Burke et al. (2012) regarding the use of SWPBS expectation adherence as a predictor of internalizing problem behaviors. Our findings showed that SWPBS behavioral expectations were more closely related to externalizing types of problem behaviors. Interesting, this finding is similar to a concurrent validity study by McIntosh et al. (2009), who found that ODRs failed to correlate with the internalizing composite of the BASC-2. It is unlikely that screening using SWPBS expectations or ODRs will predict internalizing characteristics (e.g., being sad, easily upset, excessively worrying, and being negative) unless those students are extremely disengaged from school. Using SWPBS expectations for behavioral screening is likely better suited for identifying behavioral risk among students who struggle to meet the behavioral expectations and standards developed within a SWPBS implementation. These students may be more likely to exhibit externalizing problem behaviors rather than internalizing difficulties. Early detection of risk for internalizing problem behaviors will likely require a more comprehensive screening approach. For example, the BASC-2 BESS (Kamphaus & Reynolds, 2008) and the systematic screening of behavior disorders (SSBD; Walker & Severson, 1990) screen for a broad array of learner characteristics associated with the externalizing and internalizing risk domains.
A third limitation of this study is that we did not collect information on the length of time required for a teacher to complete the SWPBS expectation screening. Anecdotal reports from teachers indicated that it took approximately 30 min to screen an entire class of students for the SWPBS expectation screener. The BESS screener (Kamphaus & Reynolds, 2008) typically takes approximately 5 to 10 min per student. A class of 30 would therefore take approximately 150 to 300 min to complete. At the middle school level, this number would potentially be multiplied several times as teachers typically teach more than one section of a class. When selecting a screening approach, SWPBS teams should consider whether the additional information gained from a more comprehensive screener with more items is worth the additional time investment. Although we used the SWPBS expectations as the basis for screening, simple teacher nominations similar to the first gate of the SSBD (Walker & Severson, 1990) might also be a time-efficient approach in developing an initial pool of students who could be vetted for risk. In addition, schools that are implementing SWPBS with fidelity may deem it necessary to screen for a broader range of risk characteristics than those assessed by the SWPBS expectation procedure described in this article. If so, other screening screeners should be explored that screen for multiple areas of social, emotional, and behavioral risk.
A final limitation noted regards the mixed classification results. Although similar to the BESS results for classifying ODR risk status, the sensitivity and PPV for the SWPBS behavioral expectations are of concern. The SWPBS expectations procedure did an excellent job at ruling out those who were not at risk. If a student was clearly rated as adhering to the school-wide expectations, the likelihood of being at behavioral risk on the BESS or becoming a conduct problem based on ODRs was low. Likewise, if a student was clearly not adhering to the SWPBS expectations, then there was an increased likelihood of being found at risk on the BESS or becoming a conduct problem based on ODRs. However, our interpretation of the classification rates displayed in Table 3 is that it is considerably easier to rule out who will not have behavioral difficulties, rather than accurately predict who will actually engage in problem behavior. Ruling out those who are not at risk is important, but it is considerably more difficult to determine who should be included in a risk pool. Based on the results from this study, and in line with the SWPBS prevention logic, approximately 20% of the school would likely need to be vetted and put into an initial risk pool to achieve acceptable classification rates. Unfortunately, there are few other studies on universal behavioral screening outside our previous study at the elementary school level (Burke et al., 2012) that report classification rates. Those studies that did include ODRs as an outcome tend to focus on discriminating between risk groups rather than accurate risk classification (e.g., Lane et al., 2007). Likewise, there are few other studies that explore the social validity (Wolf, 1978) and consequential validity (Messick, 1998) of how screening results might be used by behavior support teams for problem solving and developing interventions. The linkage to behavioral interventions such as daily behavior report cards (DBRCs; Burke et al., 2009; Vannest et al., 2010) and check in/out programs (Hawken et al., 2007) is apparent. We organized the data and shared the risk lists to the leadership team coordinating implementation of SWPBS in the middle school that participated in this study. Moreover, the school was identifying selected students for intervention using DBRCs (Burke & Vannest, 2008). However, we did not track which students the leadership team identified or how the data were used to address other aspects of SWPBS implementation.
In summary, use of school behavioral expectations for screening provides a contextually appropriate and relatively low inference set of items that are directly compatible with SWPBS. Their use as items for screening to determine which students are adhering to the SWPBS expectations aligns with the purpose of SWPBS, which is to improve discipline school-wide by promoting prosocial behaviors and reducing problem behaviors associated with a small number of positively stated school expectations (Sugai & Horner, 2006). As a final note, using behavioral expectations for screening is not meant to be a comprehensive screener of emotional and behavioral risk, and the SWPBS expectation screening procedure should be viewed as a complement to and not a replacement for collecting and using ODRs to inform the implementation of SWPBS. However, the procedure does provide an additional tool to those behavior teams that want to integrate behavioral screening with the implementation of SWPBS.
Footnotes
Declaration of Conflicting Interests
The author(s) declared no potential conflicts of interest with respect to the research, authorship, and/or publication of this article.
Funding
The author(s) received no financial support for the research, authorship, and/or publication of this article.