
Abstract
As interest in proactive and systematic approaches to supporting positive student behavior grows, important questions remain about the ways in which special education staff and their students participate in school-wide Positive Behavioral Interventions and Supports (PBIS). We report findings from a statewide study of 849 special educators addressing (a) their involvement in their school’s PBIS framework, (b) the ways their students with disabilities participate, (c) potential barriers to such participation, and (d) the topics and avenues through which they desire professional development. Special educators rarely participated in school-wide PBIS teams, reported variability in the extent to which their students with disabilities participated in aspects of the school’s framework, indicated that they implemented some features of the framework in their classroom more than others, and highlighted salient barriers to student involvement. The views and actions of special educators working primarily with students with low-incidence disabilities differed from those of teachers working with students with high-incidence disabilities. We discuss implications for research and practice aimed at enhancing the implementation and impact of school-wide PBIS on students with disabilities.
Designing effective schools has been a long-standing focus of research, policy, and practice. Although addressing the academic preparation of students has been the dominant theme of this work, a strong education must attend to both the academic and behavioral needs of students (Algozzine, Wang, & Violette, 2011). Attending well to the social and behavioral needs of students with and without disabilities puts them in the best position to develop academically. Conversely, schools in which social and behavioral challenges are pervasive or poorly addressed become difficult places to teach and learn. Schools have traditionally responded to these challenges by adopting an eclectic mix of idiosyncratic approaches across teachers, instituting reactive disciplinary approaches throughout a school, or pursuing no systemic approach at all (Netzel & Eber, 2003; Sugai, Simonsen, Bradshaw, Horner, & Lewis, 2014).
The last two decades have been marked by burgeoning interest in the implementation of more proactive and comprehensive approaches for supporting the behavior and learning of students with and without disabilities. Among the most widely implemented and extensively evaluated of these approaches is school-wide Positive Behavioral Interventions and Supports (PBIS). This multitiered framework involves a “set of intervention practices and organizational systems for establishing the social culture and intensive individual behavior supports needed to achieve academic and social success for all students” (Horner et al., 2014, p. 197). More than 21,000 schools have adopted this approach (Horner & Sugai, 2015). The first tier focuses on primary prevention and involves establishing, teaching, and reinforcing a consistent set of school-wide expectations; implementing a consistent set of consequences for problem behavior; and screening student data to make decisions about more intensive supports. The second tier focuses on secondary prevention and involves delivering validated, group-based interventions (e.g., Check and Connect, Check-in/Check-out; Anderson, Christenson, Sinclair, & Lehr, 2004; Crone, Horner, & Hawken, 2003) for students who do not respond in the first tier. The third tier focuses on tertiary intervention and involves higher intensity, individualized interventions for students. In other words, the reach of this data-driven approach is expected to extend to all students and all staff across all contexts of school life (Sugai et al., 2014).
Our interest in the present study was on the involvement of special educators and students with disabilities in this framework for supporting positive behavior and learning. Students with disabilities comprise 12.9% of all public school enrollment (U.S. Department of Education, 2015). Their need for more intensive and individualized supports across academic, social, and behavioral domains is marked and provides the primary impetus for special education services. These 6,400,000 students receive some or all of their instruction from more than 390,000 special educators (12.7% of all public school teachers; U.S. Department of Education, 2015). Despite the prevalence of these students and staff in schools across the country, few studies have focused centrally on their engagement in PBIS. Additional research is needed in several areas.
First, as the staff most directly responsible for students with the most intensive support needs in a school, special educators have an important vantage point from which to contribute to school-wide PBIS implementation (Handler et al., 2007; Simonsen, Sugai, & Negron, 2008). For example, they bring expertise on data-based decision making, individualization, secondary and tertiary interventions, and functional behavior assessment. The involvement of a special educator in PBIS teams has been included in fidelity checks used for initial adoption of school-wide PBIS (e.g., Team Implementation Checklist; Sugai, Horner, Lewis-Palmer, & Rossetto Dickey, 2012, from Sugai, Horner, & Lewis-Palmer, 2001). Yet, the extent to which special educators serve on school-wide PBIS teams, provide input into the development of a school’s PBIS framework, or receive training on that framework has not been studied. Likewise, the extent to which special educators implement important features of their schools’ PBIS framework in their classrooms (e.g., referencing, teaching, and modeling school-wide expectations; implementing school-wide consequences) has received limited attention in the literature. The degree to which special educators adopt PBIS could ultimately influence whether and how students with disabilities benefit from this framework.
Second, researchers and practitioners have raised important questions about the participation of students with disabilities within school-wide PBIS, particularly students with severe disabilities (e.g., Carr, 2008–2009; Freeman et al., 2006; Hawken & O’Neill, 2006; Landers, Courtade, & Ryndak, 2012). Although school-wide PBIS is clearly intended for all students, tensions can surround how the individualized needs of students with disabilities are addressed across all tiers, within self-contained settings, or by diverse school personnel. In their survey of PBIS state coordinators’ perceptions on including students with severe disabilities in school-wide PBIS, Landers et al. (2012) found that 31% of respondents believed that these students could only partially participate in school-wide PBIS. Understanding how special educators involve their students with disabilities in different aspects of this framework and potential barriers they perceive related to student participation could inform efforts to ensure that every student in a school benefits maximally from school-wide PBIS.
Third, ensuring staff receive strong training and relevant resources to implement effective educational interventions has been an enduring concern. Equipping special educators with the commitment and capacity to contribute to school-wide PBIS is essential to promoting high implementation fidelity, supporting widespread adoption, and maximizing impact (Coffey & Horner, 2012; Horner et al., 2014). Landers et al. (2012) reported that 69% of PBIS state coordinators indicated that either (a) students with disabilities were not discussed at all in initial training sessions on PBIS, or (b) no strategies for including students with disabilities in school-wide PBIS were provided. Moreover, including students with disabilities well in PBIS is predicated on teachers having access to relevant professional development and support (Tillery, Varjas, Meyers, & Collins, 2010). Identifying those areas in which special educators desire additional training could inform the design of technical assistance and professional development efforts. Lane, Carter, Jenkins, Magill, and Germer (2015) surveyed more than 365 school administrators about the topics they prioritized for professional development and the avenues through which their staff would be most likely to access training and support related to tiered systems. Topics such as implementing functional behavior assessments, using behavior-specific praise, writing behavior intervention plans, and crafting behavioral contracts were all ranked highly. Validating these training topics with special educators is a much-needed next step in this research. Likewise, it is important to identify those avenues through which special educators might access relevant professional development. Prior studies highlight the need to look beyond journal articles, conferences, and one-shot trainings as the only avenues through which recommended practices are disseminated (e.g., Brock, Huber, Carter, Juarez, & Warren, 2014; Lane et al., 2015).
Recognizing that the success and sustainability of school-wide PBIS programs depend on having a strong support and participation of all educational stakeholders, prior studies have explored the perspectives of educational personnel such as school psychologists (Sullivan, Long, & Kucera, 2011), behavioral professionals (Filter, Tincani, & Fung, 2009), general educators (Debnam, Pas, & Bradshaw, 2011), and administrators (Lane et al., 2015). None have focused on special educators. The purpose of this study was to examine the involvement of special education teachers in school-wide positive behavioral support systems, as well as their perceptions of the involvement of students with disabilities. Our research questions are as follows:
In Research Questions 2 and 3, we also examined differences based on whether teachers served students with low- versus high-incidence disabilities.
Method
Participants
Participants included 849 special educators representing 491 elementary, middle, and high schools in Tennessee. The majority of respondents (83.8%) were White; other respondents were Black (13.6%), Hispanic/Latino (0.8%), Multiracial (0.8%), Asian (0.2%), American Indian/Alaskan Native Race (0.1%), or Other (0.6%). Most (90.0%) were female. The highest level of education for most special educators was master’s degree (55.9%), followed by bachelor’s (34.2%), doctoral or specialist degrees (6.9%), and other degrees (2.9%).
On average, teachers reported having 6.8 (SD = 7.0) years of experience as a special educator at their school and 13.4 (SD = 10.2) years of total experience anywhere. Most respondents held a Comprehensive K-12 special education certification (i.e., state-credentialed category focused on severe disabilities; 54.4%) and/or a Modified K-12 special education certification (i.e., state-credentialed category focused on high-incidence disabilities; 54.3%; more than one level was possible). Respondents reported an average of 24.3 (SD = 30.2) students with disabilities on their current caseload. Although a wide range of caseloads were reported (e.g., caseloads exceeding 100 for participants who served students county- or system-wide), 25% of participants reported caseloads under 12, 50% of participants reported caseloads under 20, and 75% of participants reported caseloads under 30. The percentage of teachers having at least one student under the following disability categories was 76.7% autism, 70.2% specific learning disabilities, 70.0% other health impairments, 67.8% speech or language impairment, 57.8% intellectual disability, 51.6% developmental delay, 40.6% emotional disturbance, 34.4% functional delay, 34.5% multiple disabilities, 18.9% hearing impairment, 17.8% visual impairment, 13.9% orthopedic impairment, 13.4% intellectually gifted, 9.4% traumatic brain injury, 5.5% deafness, and 2.8% deaf-blindness. When asked which special education category best described the largest number of students they served, 48.3% said specific learning disability, 15.4% said intellectual disability, 8.8% said developmental delay, 8.5% said autism spectrum disorder, 5.5% said speech or language impairment, 4.8% said other health impairments, 3.1% said intellectually gifted, 2.2% said emotional disturbance, and 1.8% said multiple disabilities. Less than 1% of teachers reported primarily serving students with functional delay, hearing impairment, and deafness.
Schools
Participants worked in 491 schools in 113 districts. Most respondents (53.5%) taught in schools serving elementary levels, 38.2% worked in schools serving middle/junior high levels, 24.5% worked in high school levels, and 3.2% worked in schools serving other levels (e.g., preschool, postsecondary; more than one level was possible). These districts were diverse in size, with 30.0% serving fewer than 2,500 students, 24.9% serving 2,500 to 9,999 students, 19.0% serving 10,000 to 24,999 students, 18.6% serving 25,000 to 99,000 students, and 7.5% serving more than 100,000 students. Student ethnicity across represented schools was 68.5% (SD = 32.1) White, 24.2% (SD = 30.5) Black, 7.2% (SD = 9.0) Hispanic/Latino, 1.5% (SD = 2.0) Asian American, and 0.5% (SD = 0.4) Native American. The percentage of students receiving free or reduced-price meals averaged 66.9% (SD = 21.3), compared with 58.8% of all schools in the state.
Procedures
Data collection began in November of the academic year and lasted 4 months. To ensure a representative sample of special educators working with students with disabilities, we used the state public school database from the Tennessee Department of Education to identify all schools and lead principals. From that list, we created a comprehensive list of special education teachers we obtained from each school’s website with inclusion criteria for job titles, indicating that the teacher taught special education (e.g., student support services, special education, special services).
Beginning with districts that approved the study and districts with no separate approval process, we emailed all special educators on the list as well as one lead administrator at each school. Three districts declined participation, and two districts did not respond to our approval request. The email included a cover letter explaining the research, an electronic survey link directing all participants to the survey housed on a secure online database (Research Electronic Data Capture [REDCap]; Harris et al., 2009), and a statement and/or copy of a letter indicating that we had obtained approval from that specific district, if applicable. We indicated that the purpose of the survey was to learn how best to tailor trainings, resources, and support to meet the needs of local teachers by gathering their input on the benefits and challenges of including students with disabilities in school-wide PBIS efforts. We indicated that participation was voluntary and confidential.
When email addresses for educators were not publicly available or were outdated, we asked the lead administrator(s) of the school to forward the survey to teachers on our behalf. We did this to make sure that special educators at every school had the opportunity to participate. In all, we sent the survey to 1,772 special education teachers and 1,662 administrators. We took several measures to obtain a sufficient participation rate. First, we indicated that 40 participants would be randomly selected to win a US$20 gift card of their choice of three businesses. Second, we asked administrators to ensure that at least one special education teacher in the school had the opportunity to participate. Third, we made the survey relatively short (approximately 20 min) and available online. Finally, we indicated that every teacher who completed the survey would receive a series of free practice guides. Given our multipronged recruitment approach, we cannot determine the total number of special educators who ultimately received the survey. The 849 special educators who completed the survey represented 19.2% of all special educators employed in participating districts (i.e., omitting five districts) during the 2014–2015 school year (Tennessee Department of Education, 2015). Moreover, our sample represented 27.1% of the state’s 1,811 schools and 77.4% of the state’s 146 districts.
Instrument
Drawing upon previous studies addressing students with disabilities (e.g., Freeman et al., 2006; Landers et al., 2012), research on tiered systems of support (e.g., Bambara, Goh, Kern, & Caskie, 2012; Bambara, Nonnemacher, & Kern, 2009; Lane et al., 2015), and implementation checklists (e.g., Sugai et al., 2012), we developed two survey versions. One version was for special educators who reported that their schools implemented a PBIS framework; the other was for special educators who indicated that their schools did not implement PBIS (or who did not know).
Demographics
We asked teachers to provide information about their professional role in their school, number of years employed as special educators, number of years at their current school, teaching certification category, and highest degree earned. We also asked for the number of students on their caseload, the special education categories under which their current students were served, and the special education category that described the largest number of students served. We requested information from teachers about the size of their school, the size of the community served by the school, and the grade levels of students they served.
School-wide implementation of PBIS components
Teachers rated their school’s implementation of nine components of PBIS (see Table 1 for items). These items were drawn from the PBIS Team Implementation Checklist (Sugai et al., 2012). For each item, we asked teachers to rate the extent to which their school implements each component using a 4-point, Likert-type scale (1 = not at all, 2 = a little, 3 = mostly, 4 = fully). Cronbach’s alpha for this section was .88. We then asked teachers to read a brief description of PBIS and answer the question: “Does your school use a PBIS framework to address students’ social and behavioral concerns?” Teachers who responded “yes” were asked whether their school had a PBIS Leadership Team, received support or coaching on the PBIS framework, and went through school-wide PBIS training before implementation.
Special Educators’ Ratings of Their School’s Implementation of Nine Components of PBIS.
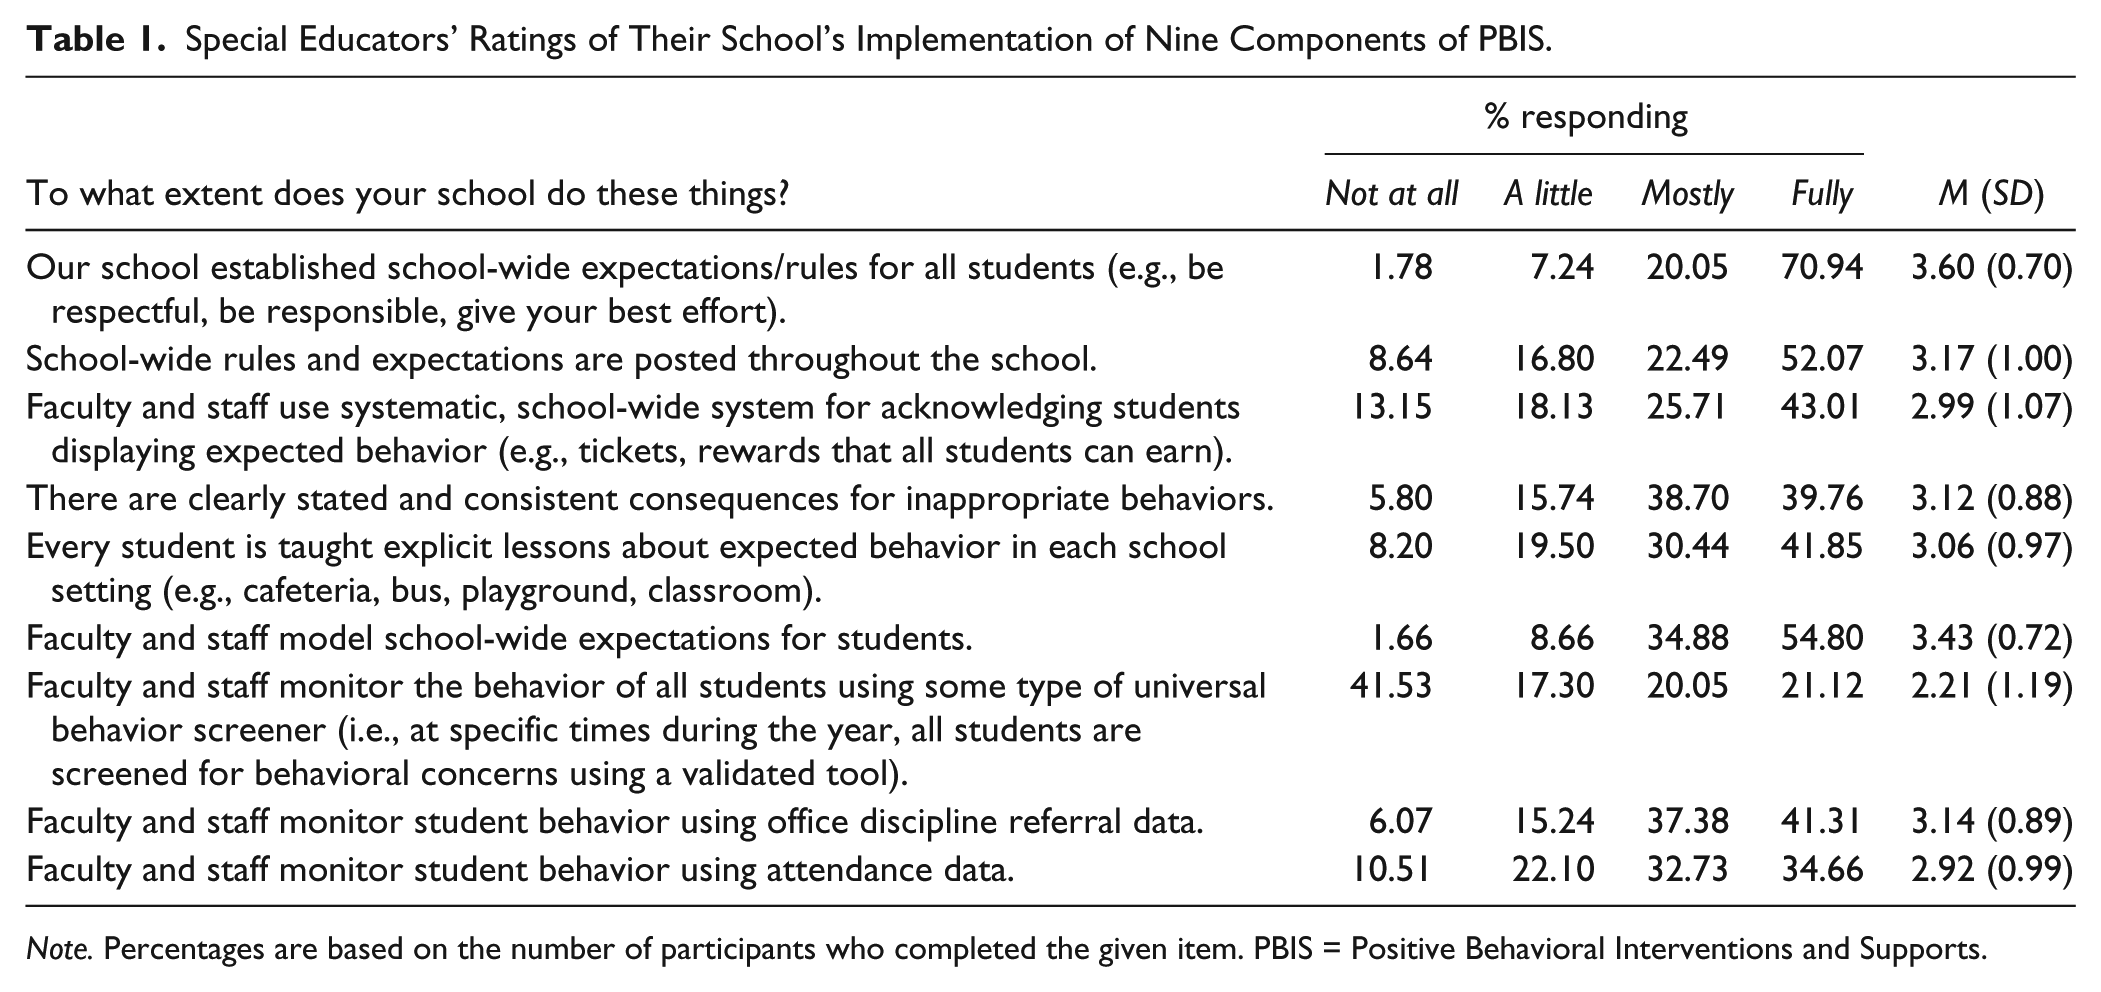
Note. Percentages are based on the number of participants who completed the given item. PBIS = Positive Behavioral Interventions and Supports.
Participation of students with disabilities in PBIS
Teachers who indicated that their school implemented a PBIS framework were asked to rate the participation of their students with disabilities in PBIS on eight items (see Table 2). Items were drawn from the Team Implementation Checklist (Sugai et al., 2012) and the Benchmarks of Quality (Kincaid, Childs, & George, 2010). Ratings were made on a 4-point, Likert-type scale: 1 = not at all, 2 = a little, 3 = mostly, 4 = fully. Cronbach’s alpha for this section was .85.
Student Participation in the PBIS Framework Among Schools Currently Implementing PBIS.
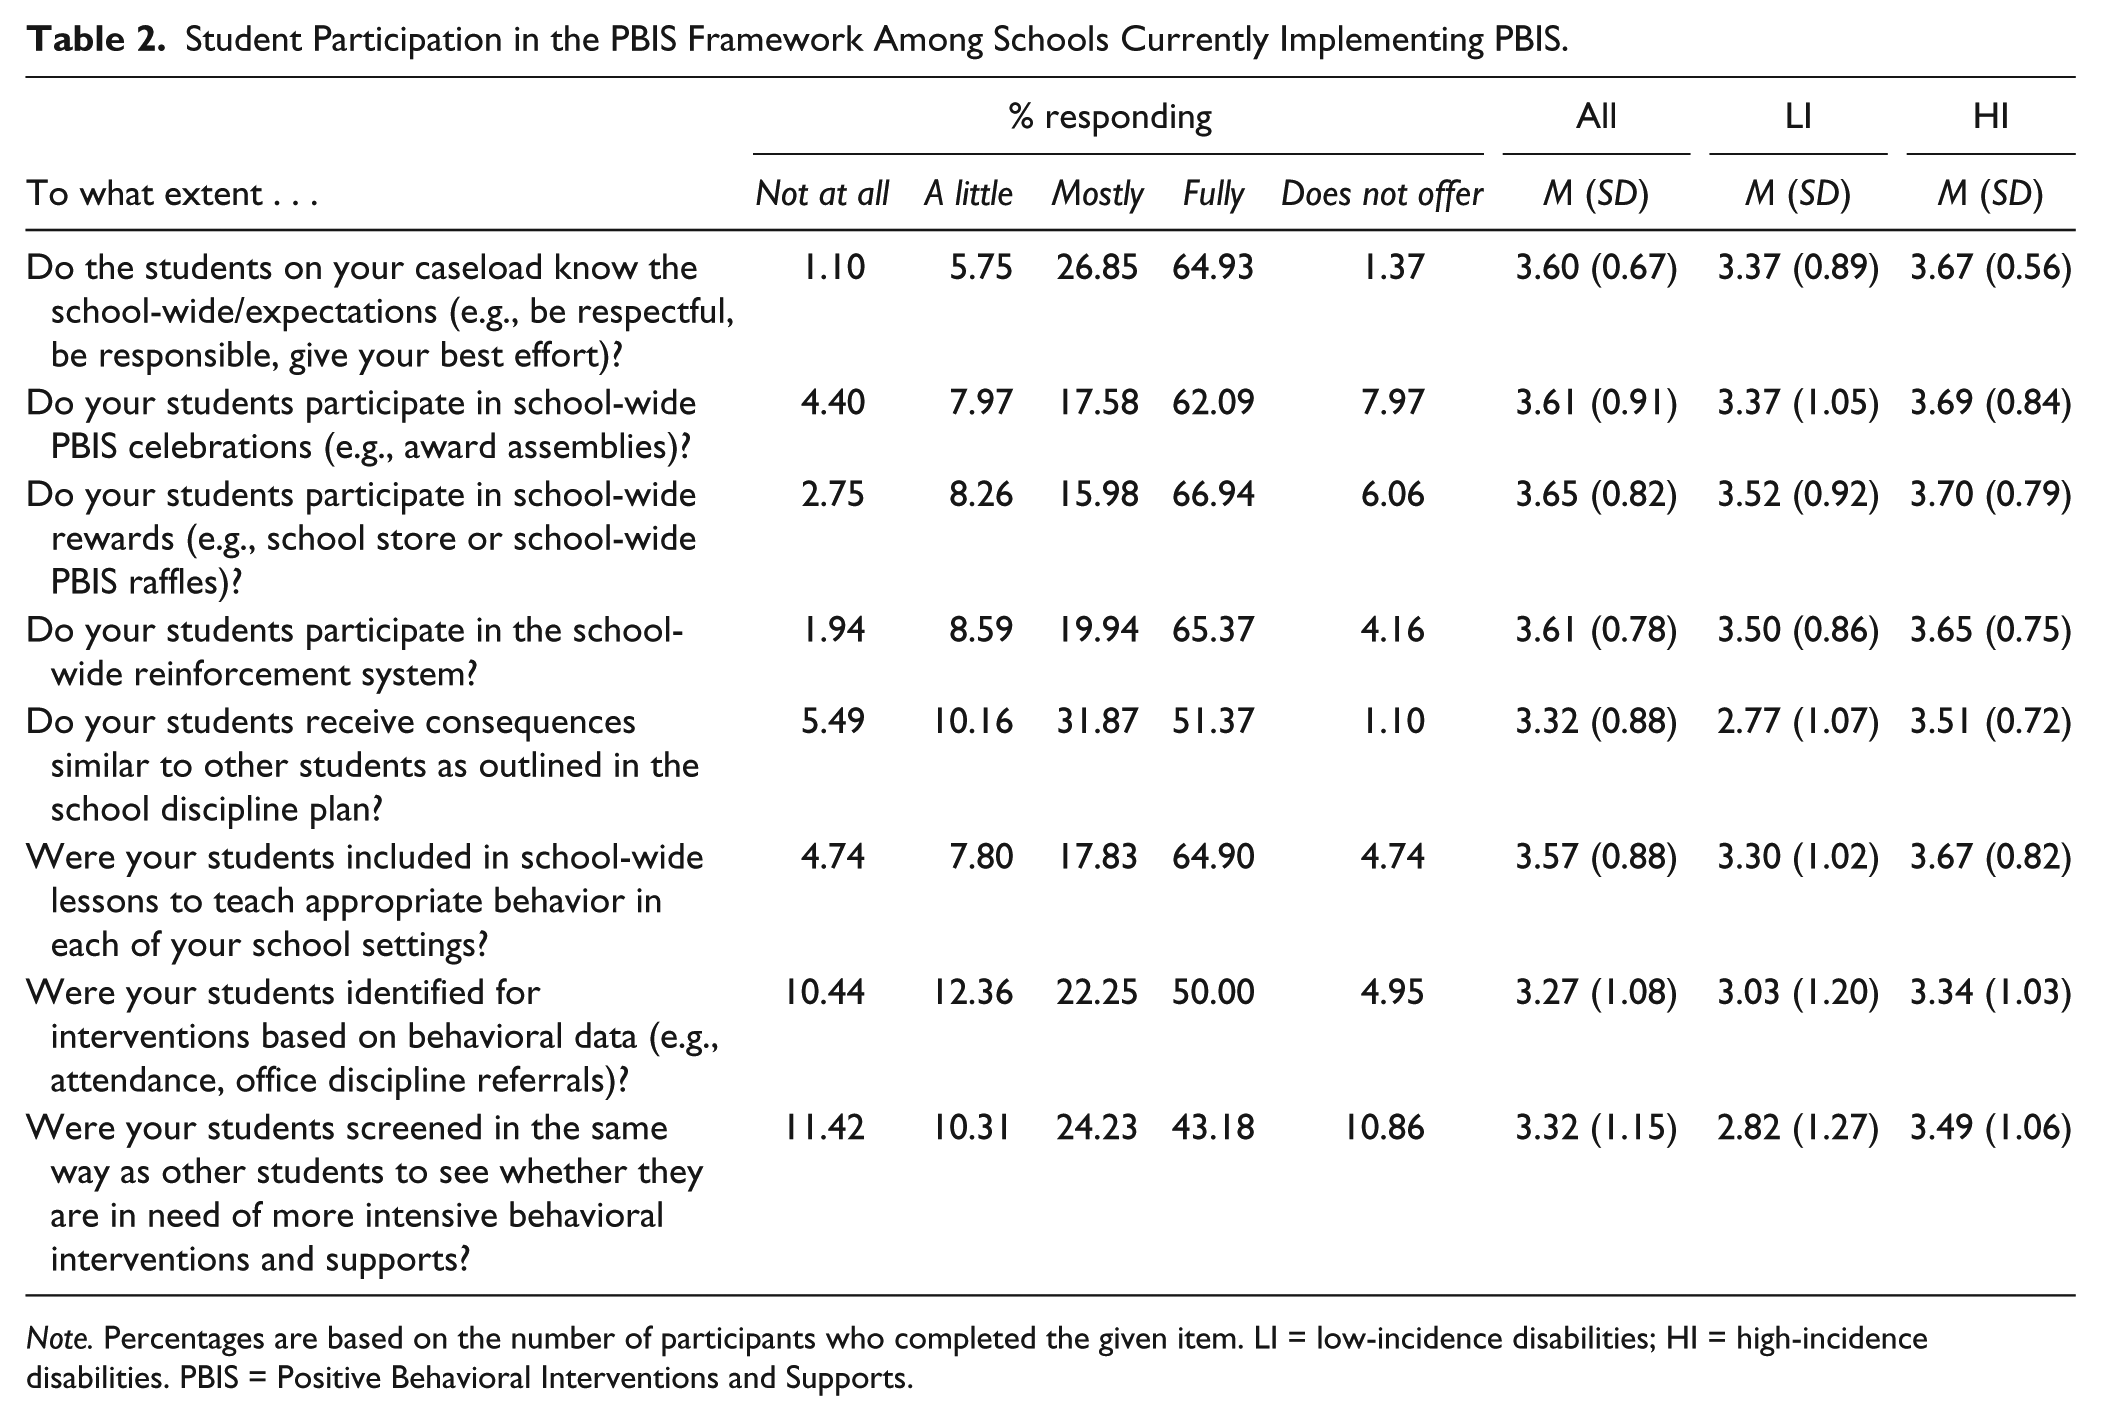
Note. Percentages are based on the number of participants who completed the given item. LI = low-incidence disabilities; HI = high-incidence disabilities. PBIS = Positive Behavioral Interventions and Supports.
Participation of special educators in PBIS
Teachers who reported their school implemented PBIS were asked nine questions about their participation (see Table 3). Ratings were made using a 4-point, Likert-type scale: 1 = not at all, 2 = a little, 3 = mostly, 4 = fully (Cronbach’s α = .83). For teachers at schools that were not implementing PBIS, questions addressed teacher’s anticipated involvement. Responses were provided on a 4-point, Likert-type scale: 1 = very unlikely, 2 = unlikely, 3 = likely, 4 = very likely (Cronbach’s α = .90).
Special Educator Participation in the PBIS Framework.
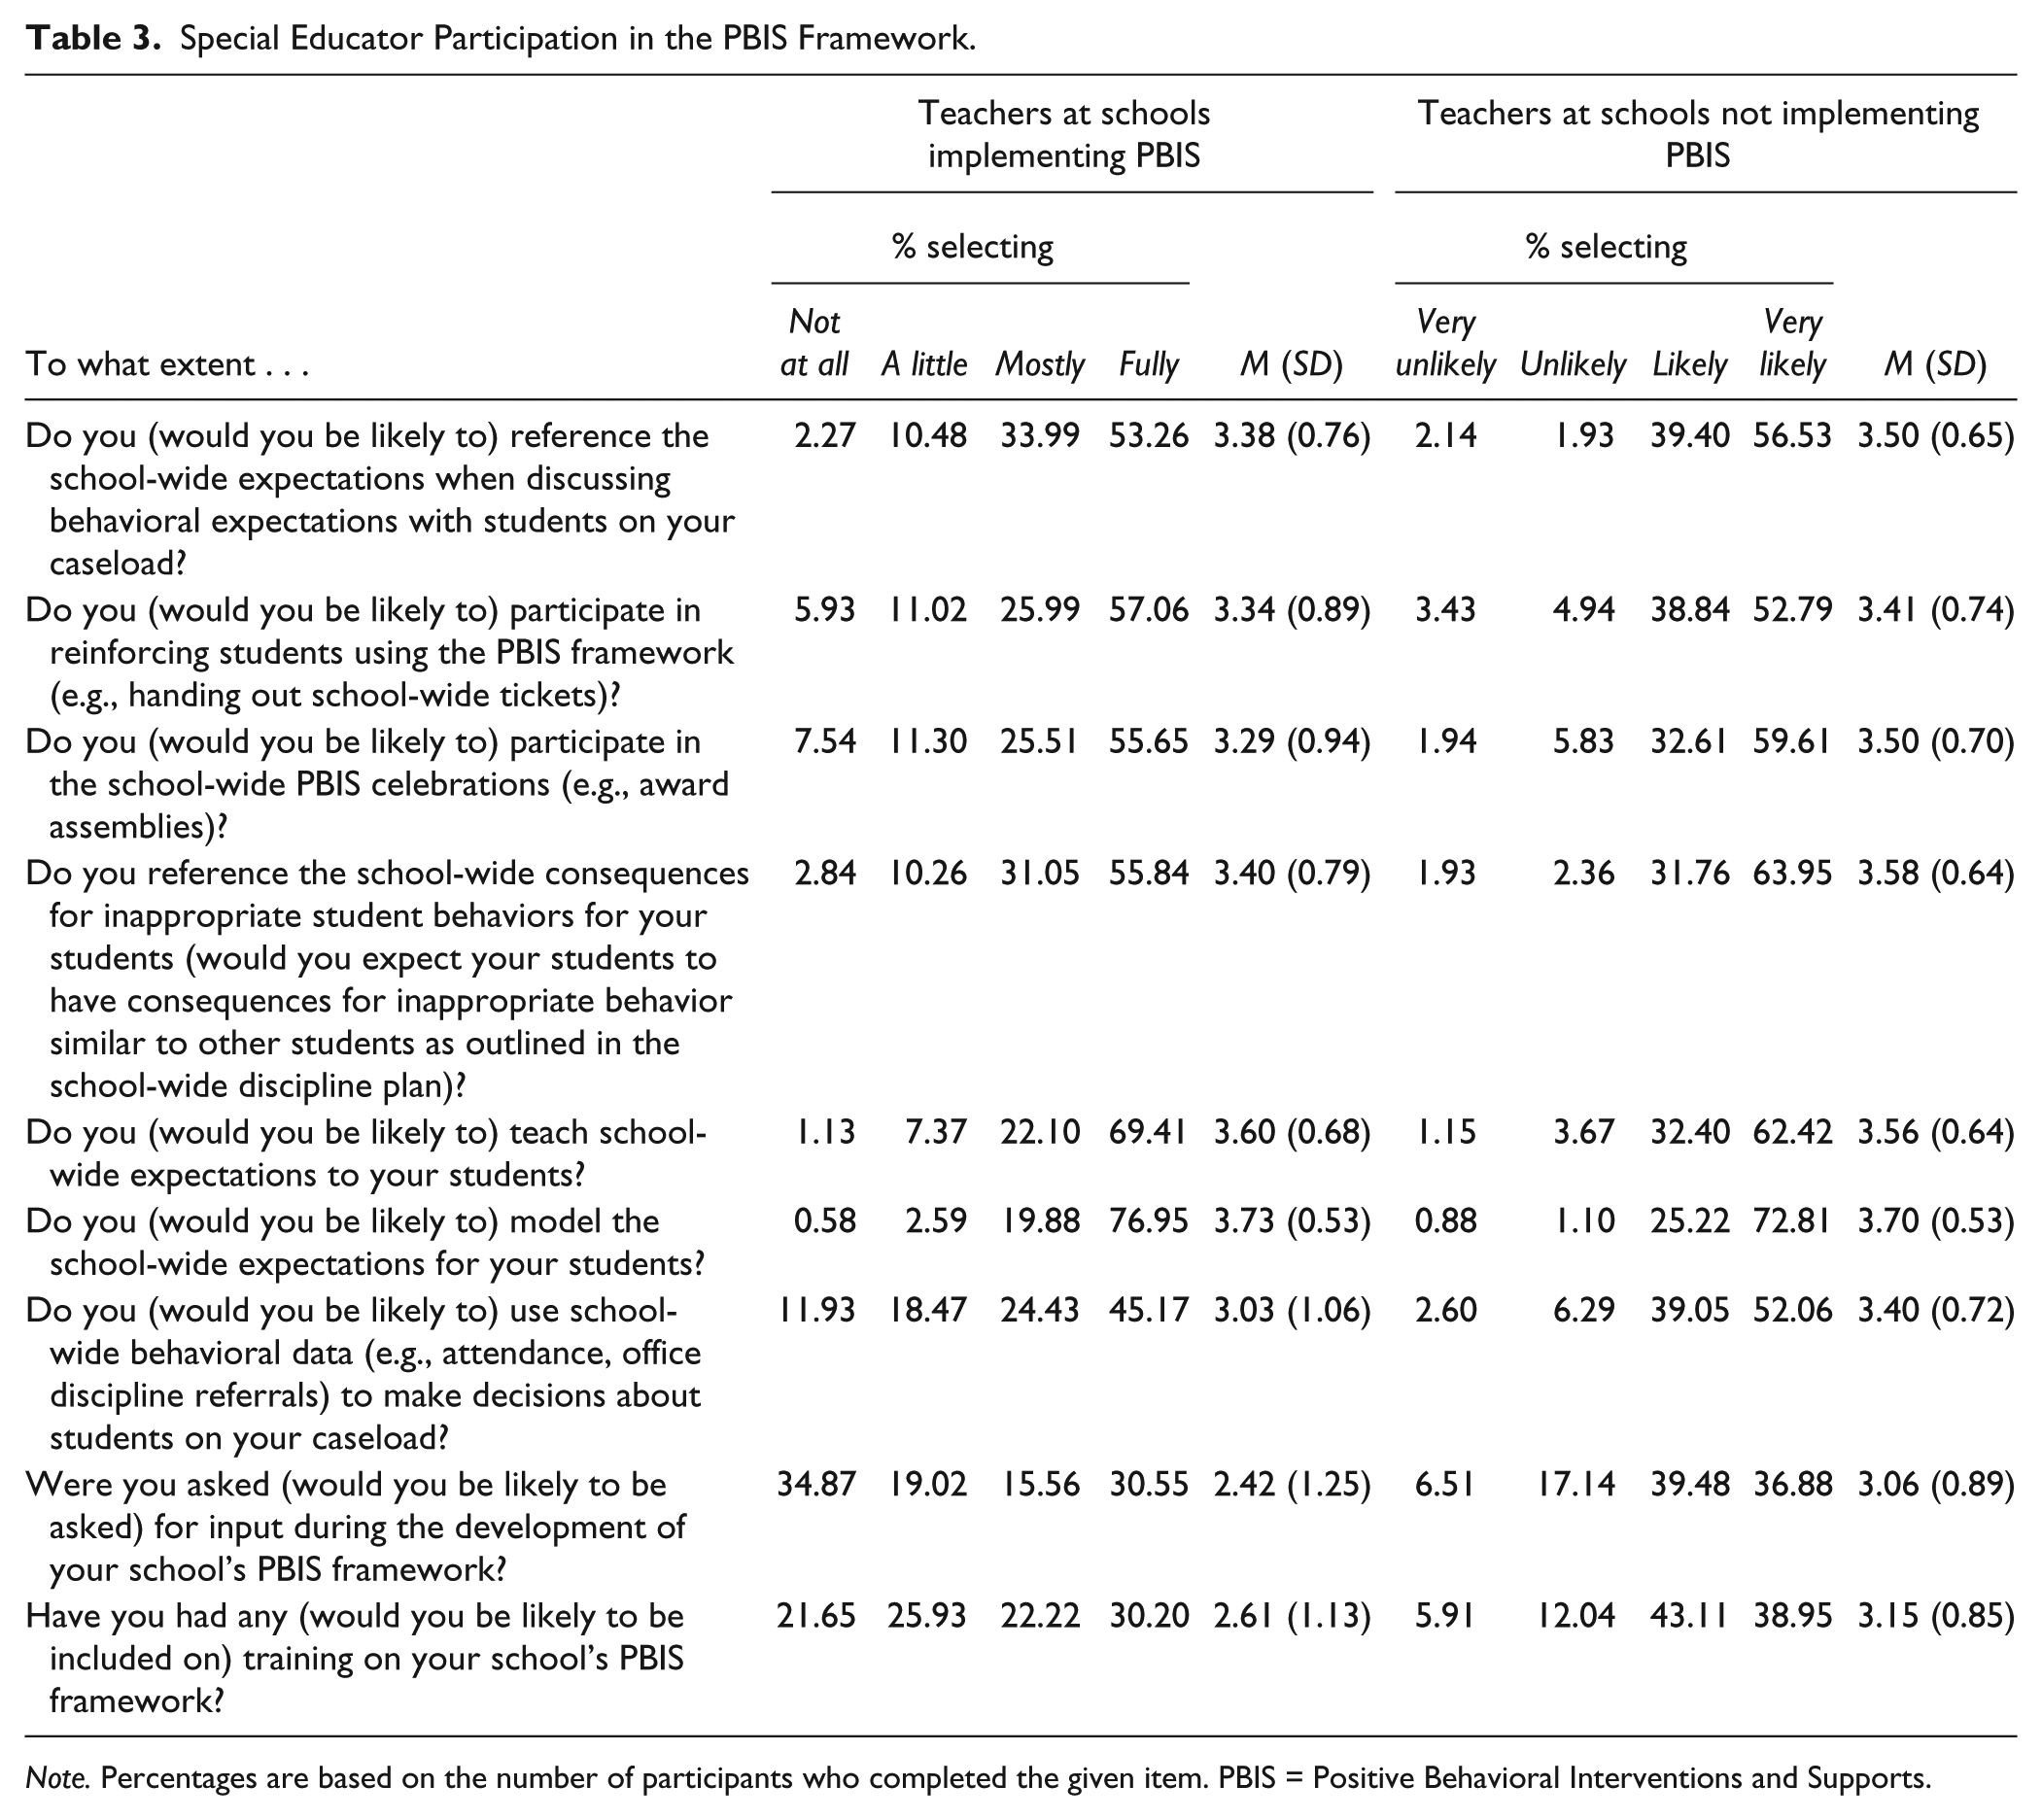
Note. Percentages are based on the number of participants who completed the given item. PBIS = Positive Behavioral Interventions and Supports.
Benefits of PBIS for students with disabilities
Teachers who indicated that their school implemented a PBIS framework were asked to rate the extent to which the students on their caseload benefited from eight components of PBIS (see Table 4). Ratings were provided using a 4-point, Likert-type scale: 1 = not at all, 2 = a little, 3 = mostly, 4 = fully (Cronbach’s α = .94). All other teachers were asked about anticipated benefits for their students in these same areas. Responses were provided on a 4-point, Likert-type scale: 1 = very unlikely, 2 = unlikely, 3 = likely, 4 = very likely (Cronbach’s α = .93). All teachers were asked two additional questions regarding time allocated by their school or district for training on PBIS (see Table 4).
Actual and Anticipated Benefits of Student Participation in PBIS.
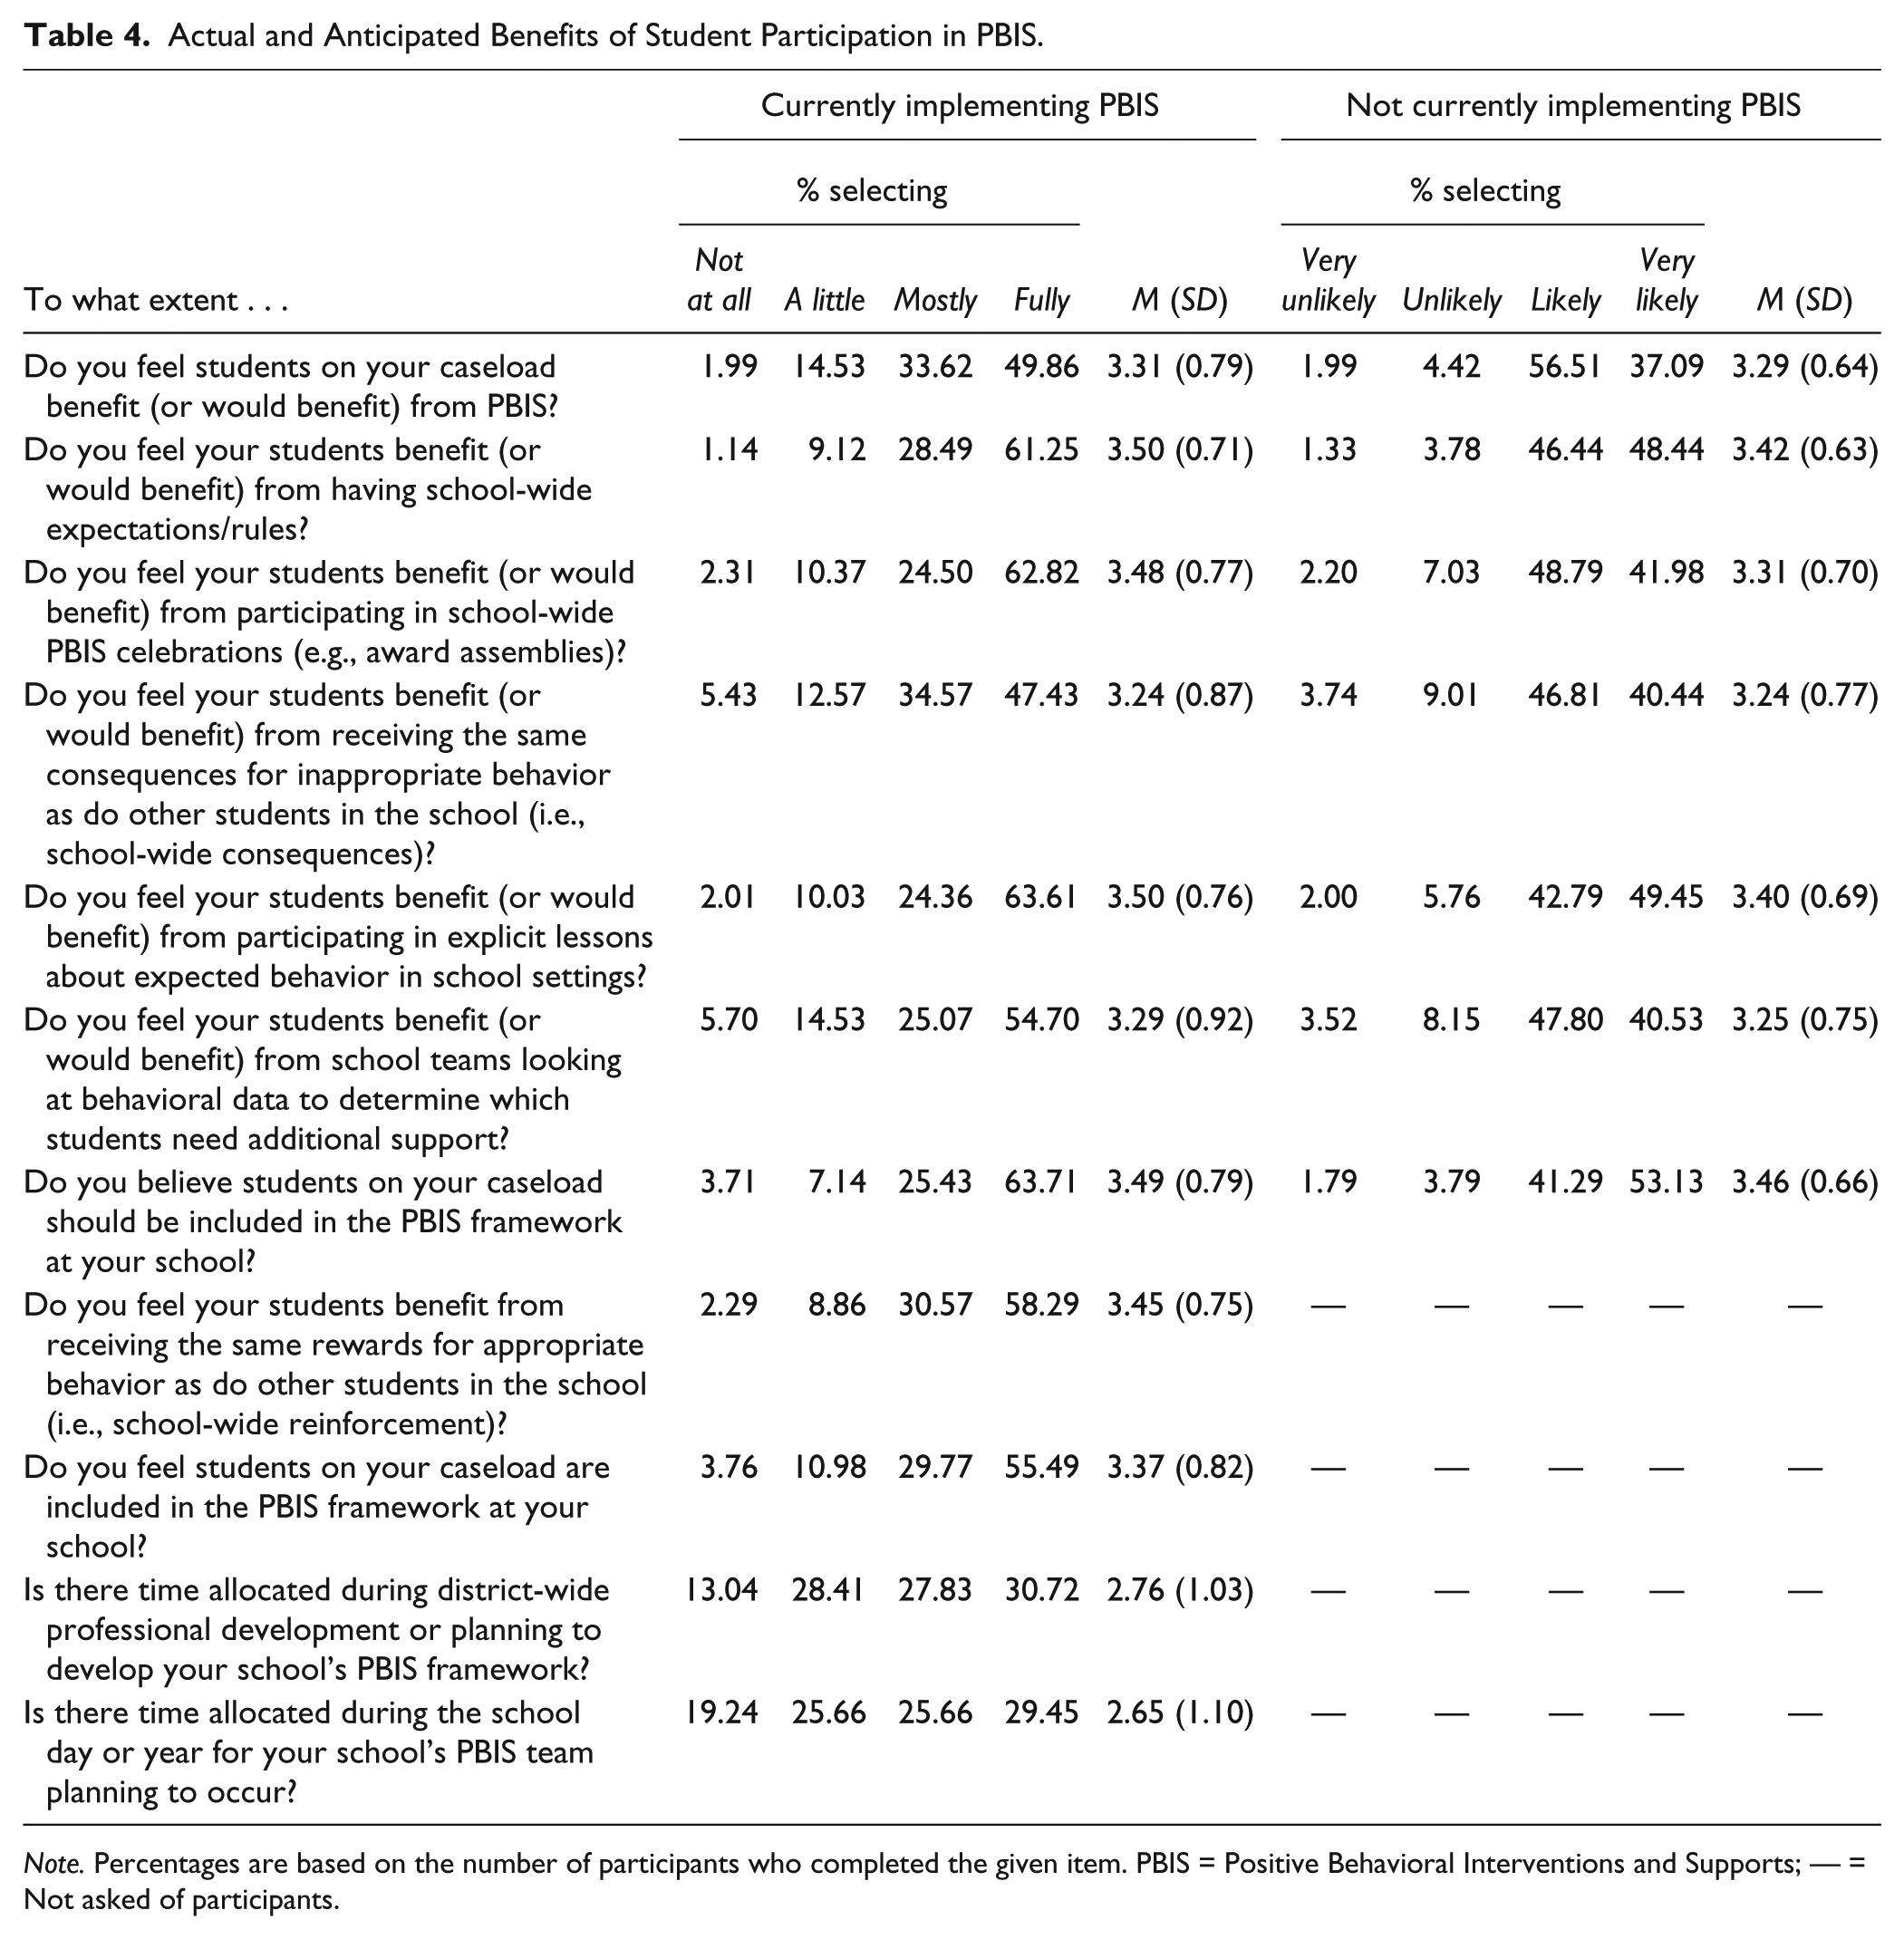
Note. Percentages are based on the number of participants who completed the given item. PBIS = Positive Behavioral Interventions and Supports; — = Not asked of participants.
Barriers to the participation of students with disabilities in PBIS
Teachers who indicated their school implemented PBIS were asked to assess nine potential barriers to the participation of students with disabilities in their school’s PBIS framework (see Table 5). These barriers were drawn from the prior literature (e.g., Carr, 2008–2009; Hawken & O’Neill, 2006; Landers et al., 2012) as well as reports from schools for which the authors provided technical assistance. Ratings were provided on a 4-point, Likert-type scale: 1 = not at all, 2 = a little, 3 = mostly, 4 = fully (Cronbach’s α = .91). All other teachers rated whether these same items would be potential barriers for students on their caseload if their school were to implement PBIS. Ratings were made on a 4-point, Likert-type scale: 1 = very unlikely, 2 = unlikely, 3 = likely, 4 = very likely (Cronbach’s α = .88).
Special Educators’ Ratings of Barriers to Participation in PBIS.
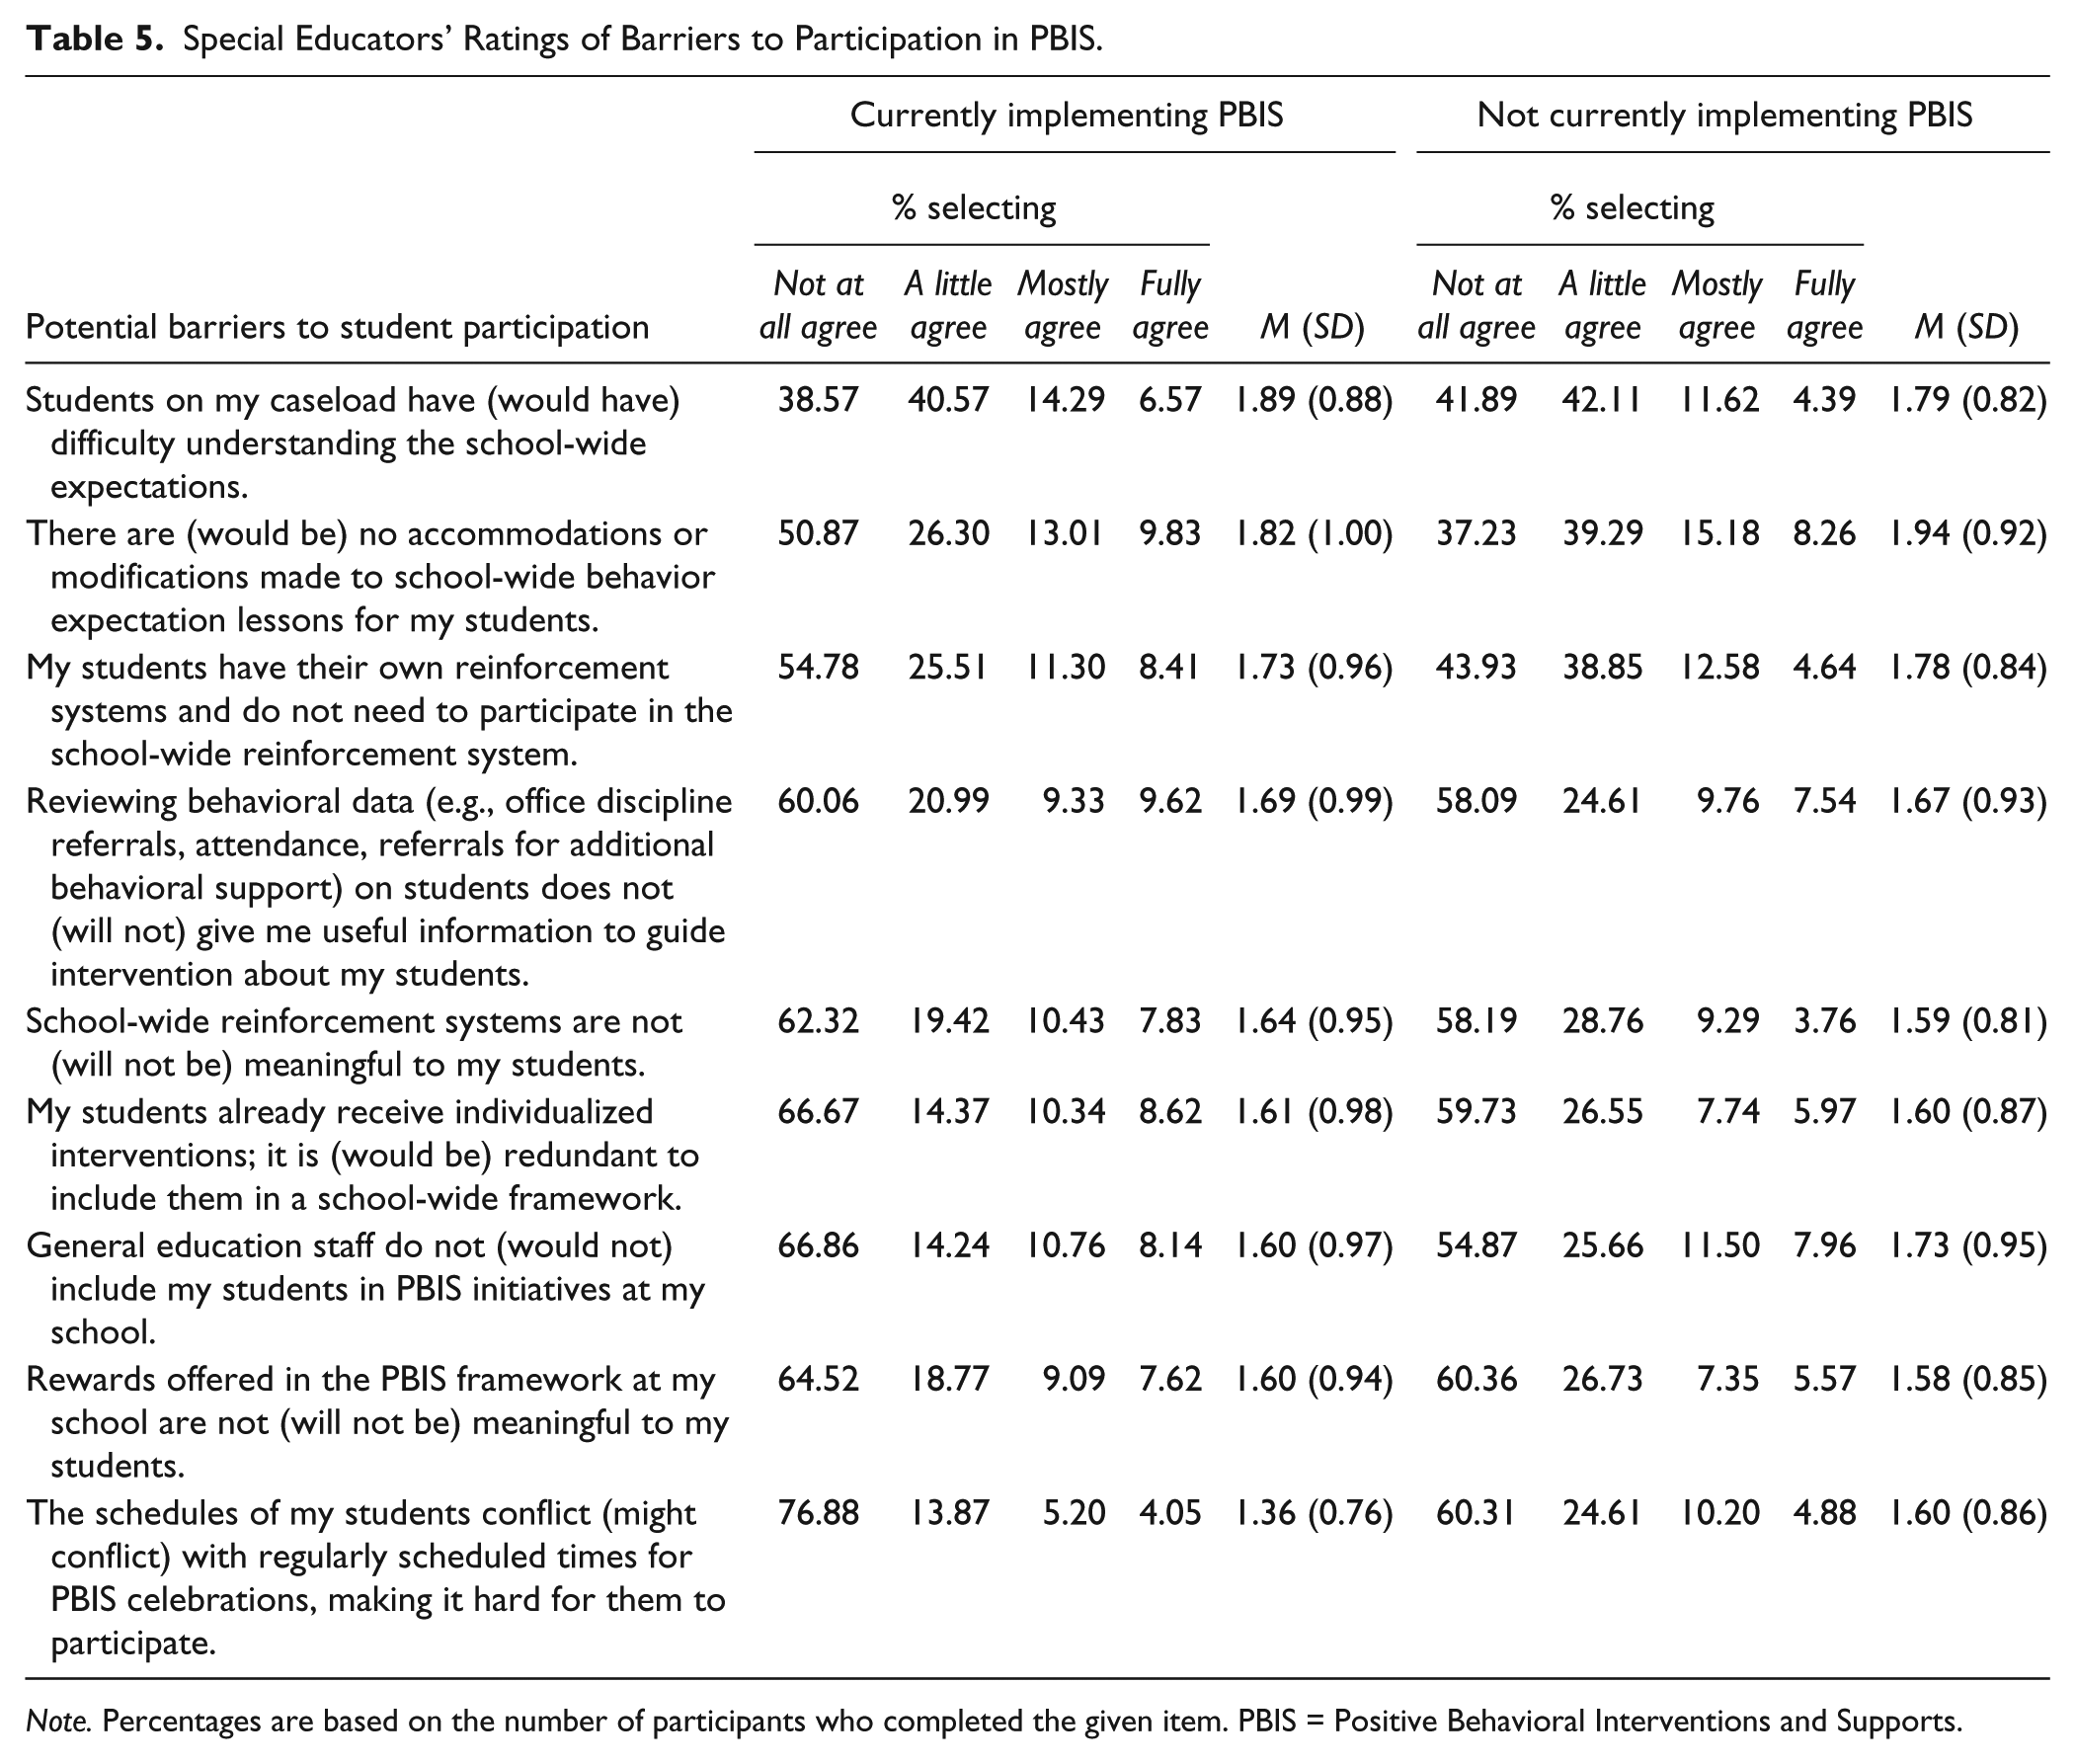
Note. Percentages are based on the number of participants who completed the given item. PBIS = Positive Behavioral Interventions and Supports.
Professional development avenues and needs
We asked all teachers, regardless of whether their school was implementing PBIS, to rate the extent to which they would be likely to access each of 13 avenues of professional development to learn more about PBIS (see Table 6 for items). Teachers rated each avenue using a 4-point, Likert-type scale: 1 = very unlikely, 2 = unlikely, 3 = likely, 4 = very likely (Cronbach’s α = .90). The final section of the survey asked participants to rate their interest in additional support on 14 educational practices schools implement as part of PBIS (see Table 7). These items were drawn from prior professional development studies (e.g., Brock et al., 2014; Lane et al., 2015). Teachers used a 4-point, Likert-type scale: 1 = no interest, 2 = little interest, 3 = interest, 4 = strong interest (Cronbach’s α = .96).
Likelihood of Accessing Various Avenues of Professional Development on PBIS.
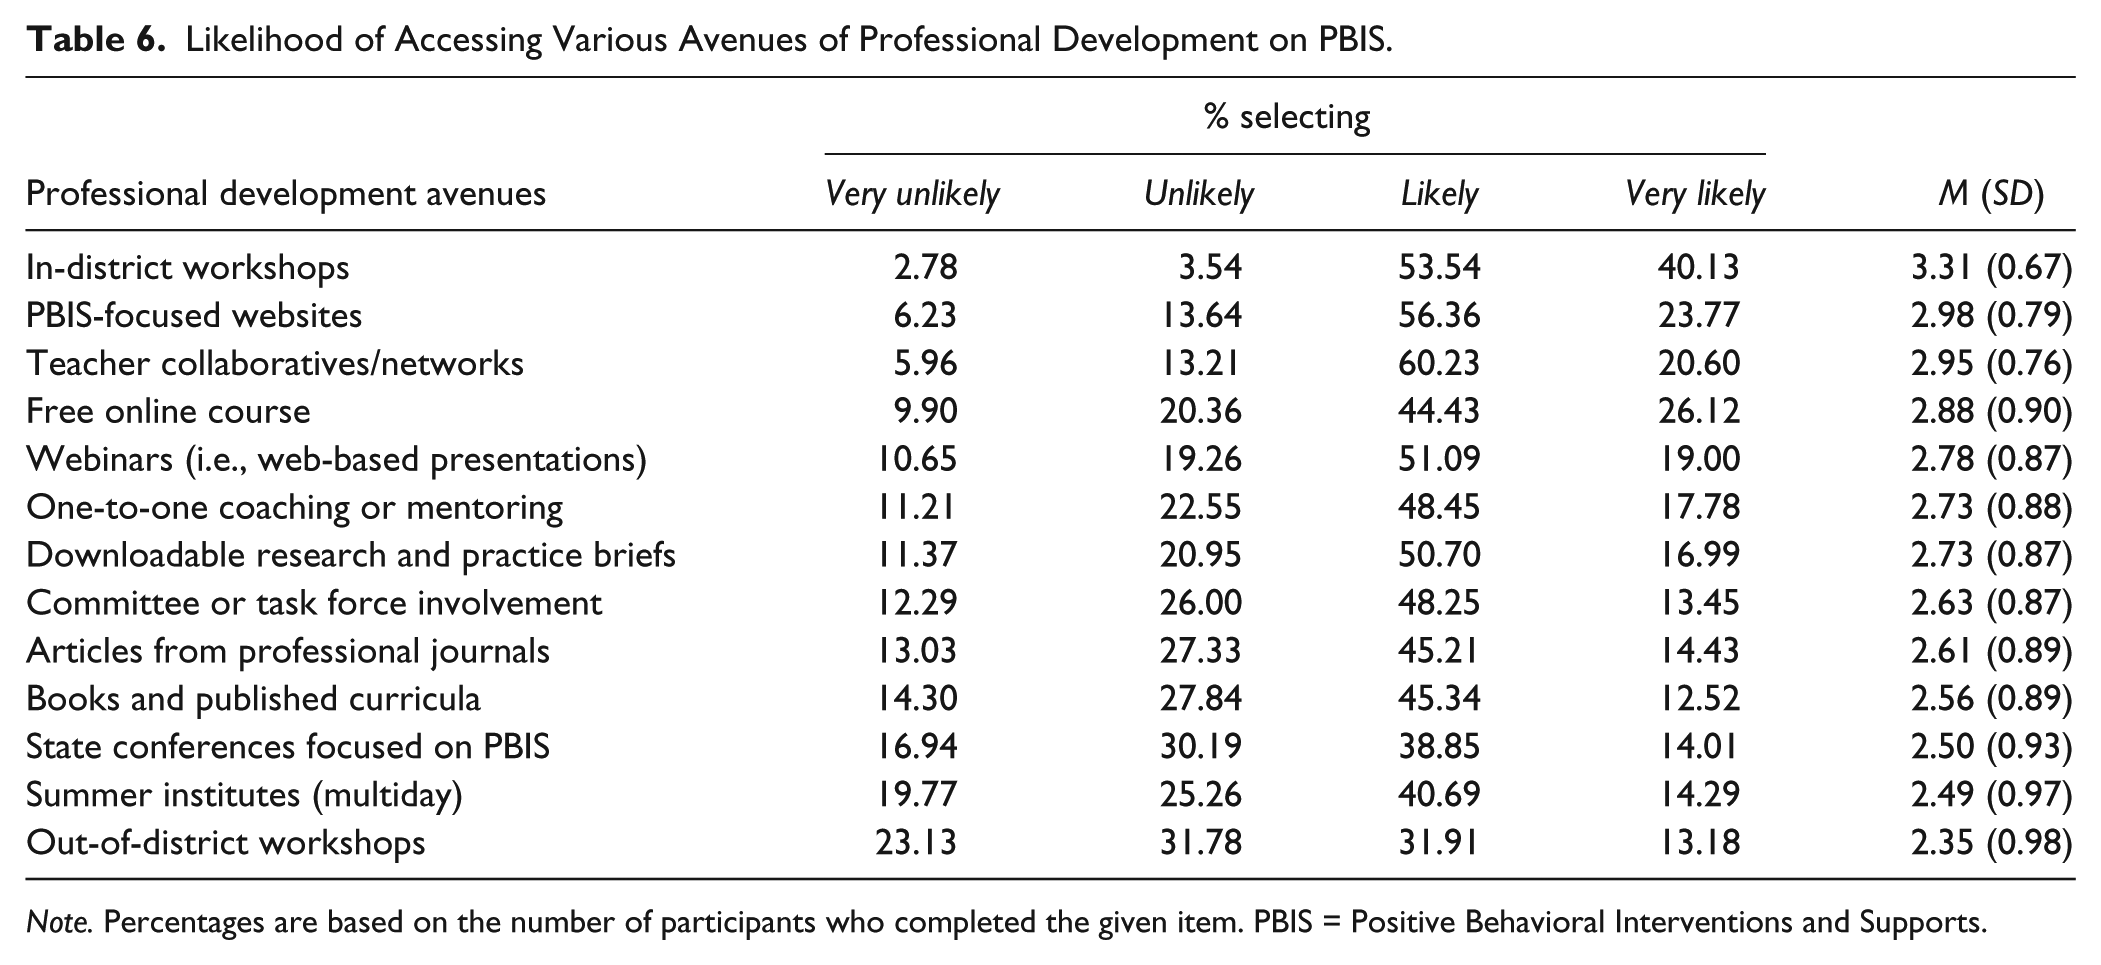
Note. Percentages are based on the number of participants who completed the given item. PBIS = Positive Behavioral Interventions and Supports.
Professional Development Interests Related to PBIS.
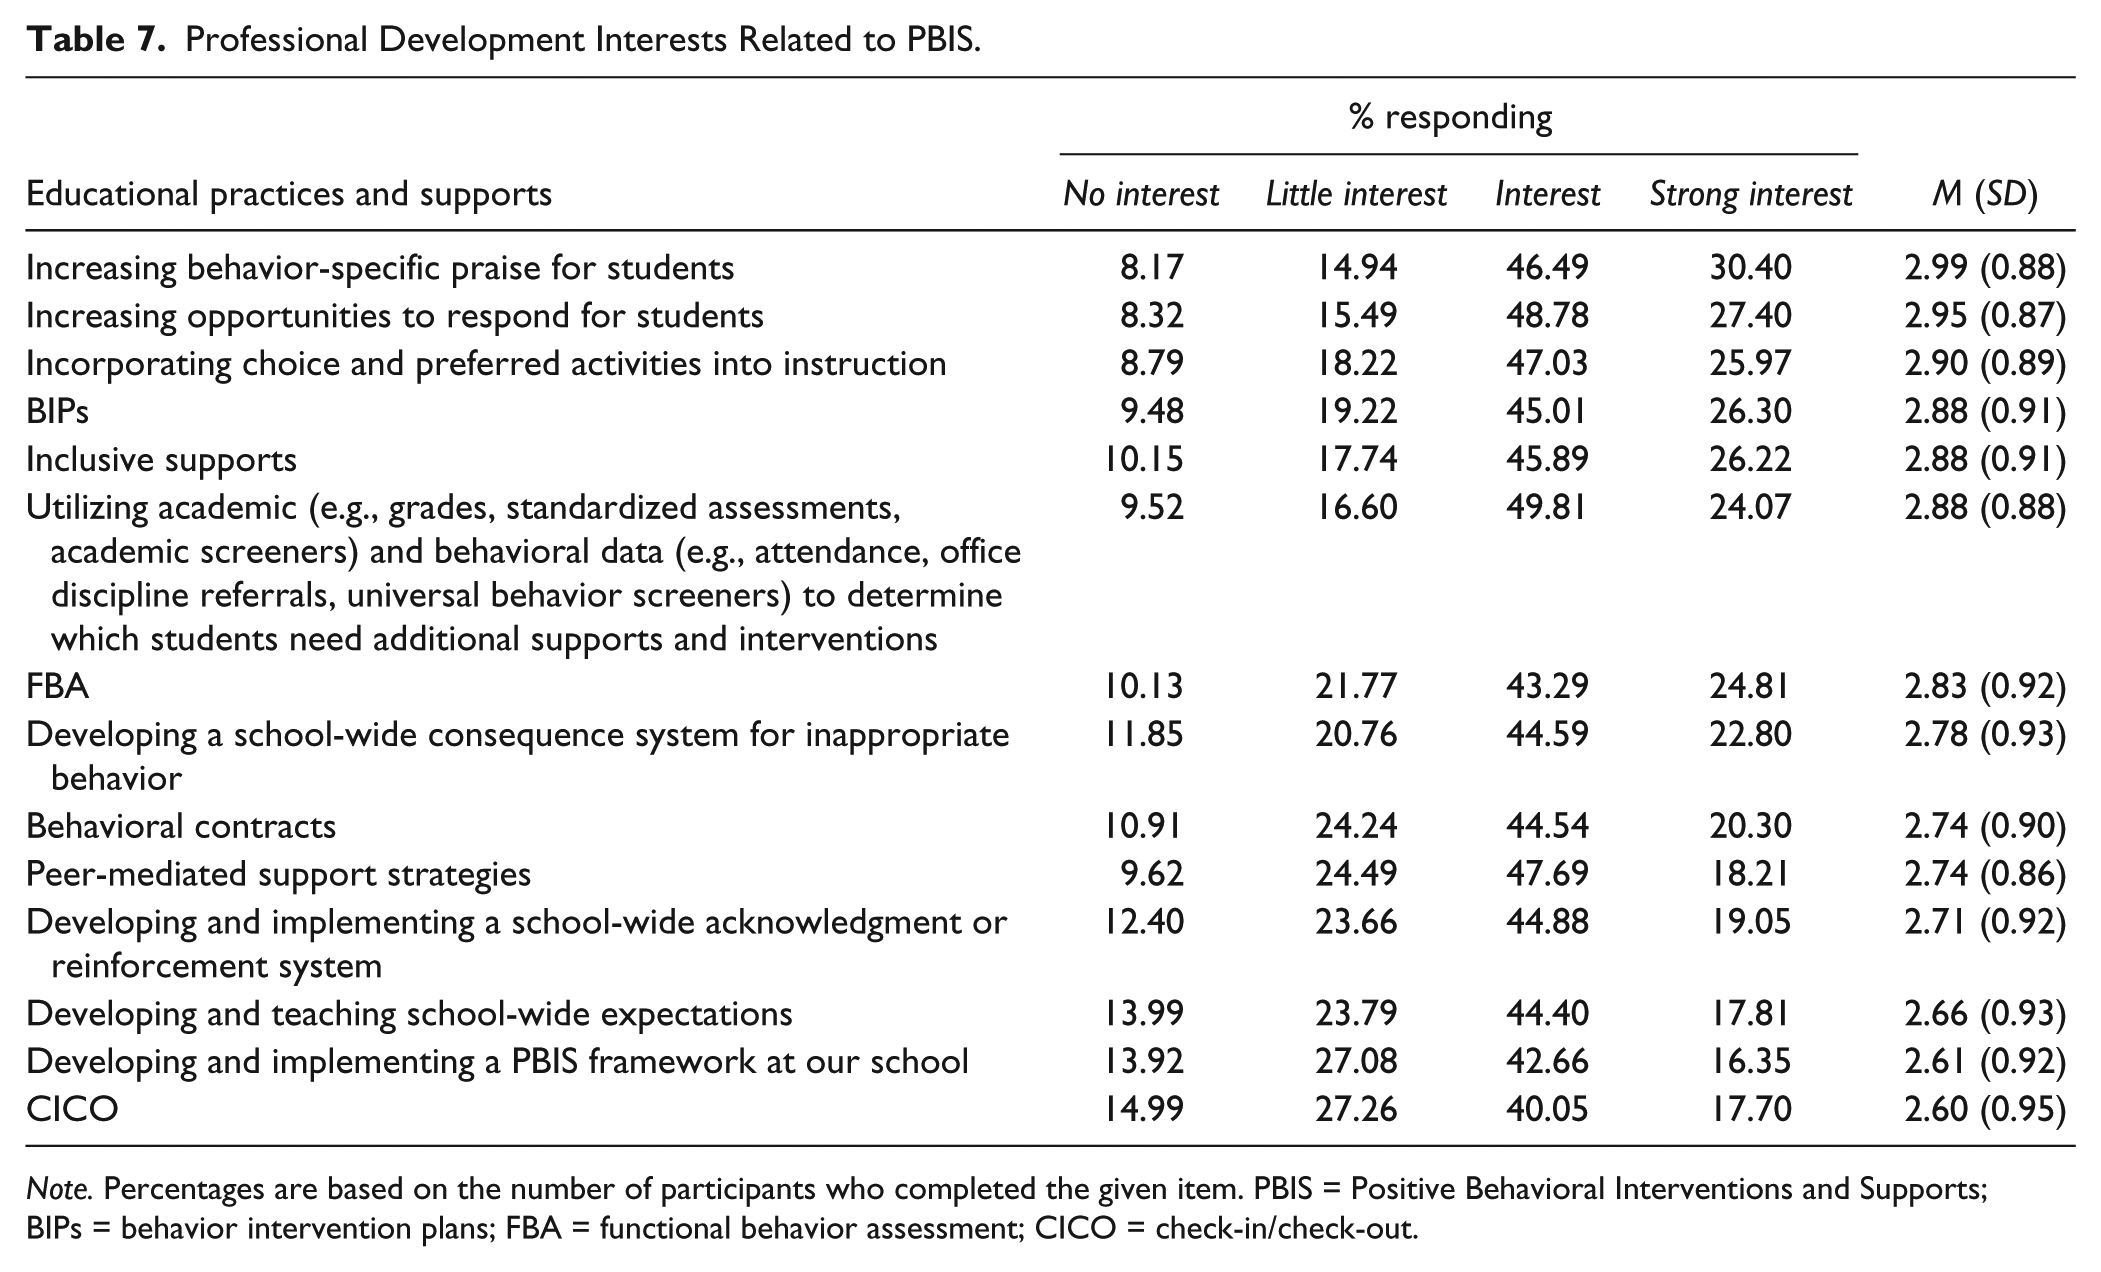
Note. Percentages are based on the number of participants who completed the given item. PBIS = Positive Behavioral Interventions and Supports; BIPs = behavior intervention plans; FBA = functional behavior assessment; CICO = check-in/check-out.
Data Analysis
We used descriptive statistics to summarize findings related to each of our research questions. We conducted Wilcoxon’s Signed-Rank tests (see Note 1) to compare special educator ratings among items in the following four domains: (a) school-wide implementation of PBIS components, (b) special educator participation in PBIS (actual vs. anticipated), (c) professional development avenues, and (d) professional development needs. We also conducted a series of independent-samples t tests (see Note 2) to compare mean scores based on whether special educators worked primarily with students with low-incidence disabilities (i.e., intellectual disability, autism, multiple disabilities) or high-incidence disabilities (i.e., all other disability categories). We dichotomized participants based on the special education category they reported that best described the largest proportion of students they served. We made these comparisons on special educators’ ratings of student participation, benefits, and barriers for those working at schools currently implementing PBIS. We hypothesized that actual implementation and perceived benefits would be lower for students with low-incidence disabilities; we anticipated that barriers would be higher. We calculated effect sizes (Cohen’s d) for all comparisons that were statistically significant.
Results
School-Wide Implementation of PBIS Components
When asked whether their school had a PBIS framework in place, 43.7% of special educators said yes, 34.3% said no, and 22.0% indicated that they did not know. When a framework was in place, 74.8% of teachers said that their school had a PBIS leadership team and 23.8% of these teachers said that they were part of that team. Less than half (42.0%) of these teachers said that their schools received any support or coaching for their PBIS framework. Slightly more than half of implementing schools (53.7%) completed training before implementing the PBIS model.
When considering each of the nine individual components of PBIS, the overall ratings of all teachers suggested modest to high implementation at their school, with mean scores ranging from 2.21 (SD = 1.19) to 3.60 (SD = 0.70; see Table 1). The components for which the highest percentage of teachers said their school was implementing mostly or fully were as follows: establishing school-wide expectations for all students (91.0%), and having faculty and staff model those expectations (89.7%). Teacher ratings of implementation for these two components were significantly higher than for all other components, Z ≥ 7.39, p < .001 (criterion alpha). Less than half of schools had similar levels of implementation related to using some type of universal behavior screener to monitor the behavior of all students (41.2%). Teacher ratings of implementation for this component were significantly lower than for all other components, Z ≤ −15.01, p < .001 (criterion alpha).
Participation of Students With Disabilities in PBIS
Within schools implementing PBIS, the participation of students with disabilities was reported to vary widely within and across elements of the school’s PBIS framework (see Table 2). Across the eight components, between 33.1% and 56.8% of special educators said that students on their caseload were participating less than fully. The highest involvement was found for participation in school-wide rewards (e.g., school store, school-wide raffles). The lowest involvement was found in whether students with disabilities were screened in the same way as other students to gauge their need for intensive behavioral interventions and supports.
We conducted a series of independent-samples t tests to contrast ratings of special educators working primarily with students with low-incidence versus high-incidence disabilities. Results of these contrasts were significant for six of eight items. Ratings were significantly lower for students with low-incidence disabilities for knowing school-wide expectations, t(1, 113) = −3.06, p = .003 (d = −0.41); participating in school-wide celebrations, t(1, 127) = −2.62, p = .01 (d = −0.34); receiving consequences similar to other students as outlined in the school discipline plan, t(1, 119) = −6.17, p < .001 (d = −0.81); being included in school-wide lessons to teach appropriate behavior, t(1, 128) = −3.00, p = .003 (d = −0.39); being identified for interventions based on behavioral data, t(1, 137) = −2.22, p = .028 (d = −0.28); and being screened in the same way as other students to determine whether they are in need of more intensive supports, t(1, 135) = −4.46, p < .001 (d = −0.56).
Participation of Special Educators in PBIS
Special educators reported involvement that varied widely within and across elements of the framework (see Table 3). Across most elements, teachers said that they were mostly or fully implementing. The areas in which the largest percentage of teachers reported high involvement were modeling school-wide expectations for students (96.8%) and teaching the school-wide expectations to their students (91.5%). Mean ratings of teacher involvement for these two elements were significantly higher than mean ratings for all other elements, Z ≥ 4.64, p < .001 (criterion alpha). The elements found to have the most limited involvement were using school-wide behavioral data to make decisions about students on their caseload (69.6%), receiving training on the school’s PBIS framework (52.4%), and providing input on the development of the school’s PBIS framework (46.1%). Mean ratings of teacher involvement for these three elements were significantly lower than for all other elements, Z ≤ −3.74, p < .001 (criterion alpha).
At schools not implementing a PBIS framework, the anticipated involvement of special educators was fairly high (M = 3.06–3.70). More than 90% of teachers said that they would be likely or very likely to participate in seven of the nine elements about which we asked. Modeling school-wide expectations for students was the only anticipated element that was rated significantly higher than all other elements, Z ≥ 4.77, p < .001 (criterion alpha). The anticipated involvement was lowest for providing input into the development of the school’s PBIS framework (76.4% likely or very likely to participate) and being included in training on the school’s PBIS framework (82.1% likely or very likely to participate). These two elements were rated significantly lower than all other elements, Z ≤ −6.01, p < .001 (criterion alpha).
Benefits of PBIS for Students With Disabilities
As shown in Table 4, teachers at schools implementing PBIS reported a number of benefits to their students’ participation in this framework (M = 3.24–3.50). Between 79.8% and 89.7% of special educators indicated that their students mostly or fully benefited from the eight components about which we asked, including school-wide expectations, celebrations, reinforcement, consequences, and explicit lessons about expected behavior. Special educators at nonimplementing schools provided similar perspectives on the potential benefits to the involvement of their students in these components.
However, tests contrasting the ratings of special educators primarily working with students with low-incidence versus high-incidence disabilities were all significant. Ratings were significantly lower for students with low-incidence disabilities on whether students benefit from PBIS, t(1, 123) = −4.17, p < .001 (d = −0.55); benefit from having school-wide expectations, t(1, 116) = −3.37, p = .001 (d = −0.45); benefit from receiving the same rewards for appropriate behavior as do other students in the school, t(1, 120) = −3.24, p = .002 (d = −0.43); benefit from participating in school-wide celebrations, t(1, 119) = −2.78, p = .006 (d = −0.37); benefit from receiving the same consequences for inappropriate behavior as do other students in the school, t(1, 115) = −5.37, p < .001 (d = −0.72); benefit from participating in explicit lessons about expected behavior in school settings, t(1, 114) = −4.08, p < .001 (d = −0.55); and benefit from school teams looking at behavioral data to determine which students need additional support, t(1, 118) = −4.71, p < .001 (d = −0.62). In addition, ratings were significantly lower for students with low-incidence disabilities on whether students are included in the PBIS framework at their school, t(1, 117) = −4.12, p < .001 (d = −0.55), and whether students should be included in the PBIS framework at their school, t(1, 109) = −4.28, p < .001 (d = −0.58).
Barriers to the Participation of Students With Disabilities in PBIS
As shown in Table 5, teachers at schools implementing PBIS identified some barriers to their students’ participation in this framework (M = 1.36–1.89). Although the majority (range = 50.9%–76.9%) of special educators indicated that seven of the eight issues we described were not at all a barrier to participation at their school, the remaining teachers indicated that some degree of barrier existed. For example, approximately one fifth of teachers mostly or fully agreed that the following issues were barriers to student participation at their school: Students would have difficulty understanding school-wide expectations (20.9%), no accommodations or modifications are made for school-wide behavior expectation lessons (22.8%), students have their own reinforcement systems (19.7%), reviewing behavioral data on students does not provide useful information to guide intervention (19.0%), students already receive individualized interventions and their involvement would be redundant (19.0%), general educators do not include students with disabilities in PBIS initiatives (18.9%), and school-wide reinforcement systems are not meaningful to students with disabilities (18.3%). Special educators at nonimplementing schools provided similar perspectives on potential barriers to the involvement of their students.
In addition, tests contrasting the ratings of special educators working primarily with students with low-incidence versus high-incidence disabilities were significant for all barriers. Ratings were significantly higher for students with low-incidence disabilities on the following barriers: Students with disabilities have difficulty understanding school-wide expectations, t(1, 348) = 5.970, p < .001 (d = 0.72); students with disabilities have their own reinforcement system and do not need to participate in the school-wide reinforcement system, t(1, 121) = 4.512, p < .001 (d = 0.59); school-wide reinforcement systems are not meaningful for students with disabilities, t(1, 343) = 3.499, p < .001 (d = 0.43); there is a lack of accommodations or modifications to school-wide behavior expectation lessons for students with disabilities, t(1, 344) = 2.602, p = .010 (d = 0.32); general education staff do not include students with disabilities in PBIS initiatives at their school, t(1, 342) = 3.721; p < .001 (d = 0.45); it is redundant to include students with disabilities in school-wide frameworks because they already receive individualized interventions, t(1, 128) = 4.020, p < .001 (d = 0.52); reviewing behavioral data on students with disabilities does not provide useful information to guide intervention, t(1, 341) = 3.990, p < .001 (d = 0.48); student schedules conflict with regularly scheduled times for PBIS celebrations, t(1, 125) = 2.395, p = .018 (d = 0.31); and rewards offered in the PBIS framework are not meaningful to students with disabilities, t(1, 339) = 1.986, p = .048 (d = 0.24).
Professional Development Avenues and Needs
When asked how likely they would be to draw upon various avenues for professional development to learn about implementing PBIS (if they were available), more than two thirds of special educators said that they would be likely or very likely to access in-district workshops (93.7%), PBIS-focused websites (80.1%), teacher collaboratives/networks (80.8%), free online courses (70.6%), and webinars (70.1%). Special educator ratings of in-district workshops were significantly higher than ratings for all other professional development avenues, Z ≥ 10.47, p < .0006 (criterion alpha). The lowest ratings of likelihood were found for multiday summer institutes (55.0%) and out-of-district workshops (45.1%). Out-of-district workshops were rated significantly lower than all other professional development avenues, Z ≤ −3.95, p < .0006; summer institutes were rated significantly lower than eight of the other professional development avenues, Z ≤ −3.93, p < .0006.
When asked about their interest in receiving additional support (e.g., training, coaching, print or web-based resources) related to various educational practices and supports, special educators tended to rate all topics similarly (M = 2.60–2.99). Overall, special educators expressed a little to strong interest in all of the items; none of the topics were described as being of no interest by more than 15% of the teachers. The highest levels of interest were found for the topics of increasing behavior-specific praise to students, increasing opportunities to respond for students, and incorporating choice and preferred activities into instruction. Ratings of interest in these three practices were significantly higher than seven of the remaining practices (i.e., developing a school-wide consequence system for inappropriate behavior, behavioral contracts, peer-mediated support strategies, developing a school-wide acknowledgment system, developing and teaching school-wide expectations, developing and implementing a PBIS framework, and check-in/check-out; Z ≤ −3.84, p < .0005 [criterion alpha]).
Discussion
The primary aim of our statewide survey was to examine the involvement of special education teachers and students with disabilities in school-wide PBIS. Our findings revealed disparate patterns of involvement for special educators at the school versus classroom levels, as well as for special educators who primarily support students with low-incidence versus high-incidence disabilities. At the school level, special educators reported limited involvement in PBIS, with more than 20% reporting that they did not know whether their school used a PBIS framework. This suggests that many special educators may be uninformed or isolated from school-wide PBIS initiatives. In addition, only one fifth of special educators reported serving on a PBIS leadership team at their school. Although fairly low, this may be due to the small size of most PBIS teams (e.g., 6–8 members). While every team should have at least some special education representation, it is not the case that every special educator needs to serve on a team. Of the 371 special educators who reported their school did have a PBIS framework in place, fewer than half were asked to provide input during the initial development of the school-wide PBIS system or were included in training activities at their school. Several components of PBIS are consistent with individualized supports commonly provided for students with disabilities. For example, students with disabilities often need explicit instruction on behavioral expectations, programmed systems of reinforcement to support prosocial behaviors, and adaptations to behavioral supports based on their responsiveness to intervention (Horner, Sugai, Todd, & Lewis-Palmer, 2005). Because these components are aligned with those of PBIS, special educators can bring training and experience implementing these strategies to PBIS leadership teams. Our results suggest that special educators may be an underutilized resource in the design, leadership, and implementation of school-wide PBIS frameworks.
In contrast to their school-wide involvement, special educators at PBIS schools reported moderately high levels of implementation at the classroom level. Specifically, more than 90% of teachers said that they mostly or fully implement components such as teaching and modeling school-wide expectations. Moreover, special educators at schools without PBIS frameworks reported that they would be likely to implement most components of PBIS in their classrooms (i.e., more than 90% reported said likely or very likely). Our finding that nearly half of the special educators at PBIS schools indicated no systematic training prior to implementation, however, raises questions about the extent to which these components were implemented correctly.
Special educators reported varied levels of involvement of their students in the PBIS framework. Overall, the majority of these special educators (80% or more) reported that the students on their caseload mostly or fully participated in school-wide expectations, celebrations, rewards, reinforcement systems, consequence programs, and lessons to teach appropriate behavior. Components for which students with disabilities participated to a lesser extent included (a) being identified for interventions based on behavioral data and (b) being screened in the same way as their peers without disabilities for more intensive supports (72.3% and 67.4%, respectively). In addition, we identified different rating patterns between teachers who primarily served students with low- versus high-incidence disabilities. Ratings of the extent to which their students participated in each component of PBIS were consistently lower for teachers of students with low-incidence disabilities. Although the majority of special educators reported their students either benefit or would be likely to benefit from various components of PBIS, ratings from special educators at schools currently implementing PBIS were consistently lower for students with low-incidence disabilities.
As for barriers to participating in school-wide PBIS, more than 75% of special educators reported that they did not agree at all or only agreed a little with each of the anticipated barriers identified in the survey. This pattern held across special educators at schools with and without PBIS frameworks in place. However, consistent with previous literature emphasizing barriers for students with severe disabilities (e.g., Carr, 2008–2009; Landers et al., 2012), special educators whose caseloads primarily included students with low-incidence disabilities rated all identified barriers higher relative to special educators of students with high-incidence disabilities. These results suggest that while overall, special educators feel willing and able to include their students in PBIS frameworks, some components may need modification to maximize the extent to which students with low-incidence disabilities can participate in and benefit from all PBIS has to offer.
Across avenues for professional development on PBIS, special educators’ mean ratings approximated the midpoint of the rating scale, with the exception of in-district workshops. Coupled with the wide ranges in ratings, these results indicate variability among participants in their preferred avenues of professional development. Such patterns point toward a need to provide multiple pathways for continued education and training in PBIS. There were, however, professional development avenues that were rated consistently higher or lower than others; ratings for in-district workshops were significantly higher than for all other avenues, whereas ratings for out-of-district workshops and multiple-day summer institutes were consistently lower than for other avenues. These results are consistent with those found in a previous survey study on administrator perspectives on tiered systems (Lane et al., 2015), and suggest that convenience and cost may be critical factors in accessing professional development. Finally, more than 40% of teachers indicated that they were unlikely or very unlikely to access articles from professional journals, state conferences, or published books/curricula. Considering these avenues represent common outlets for research, this outcome underscores the need to bridge the research-to-practice gap existing within the domain of PBIS. At the very least, our results highlight a need to expand how current evidence is disseminated to the practitioners responsible for implementation.
Limitations
Results of the current study should be interpreted in consideration of the following limitations. First, the extent to which survey results generalize beyond special educators in the state of Tennessee is unknown. At the time this survey was conducted, Tennessee lacked a unified effort to implement PBIS statewide. In addition, in our work as technical assistance providers, we know of very few districts in the state with district-wide implementation plans. It is possible that similar surveys would reveal different perspectives if replicated in other states—particularly those with statewide PBIS initiatives or states in which district-wide implementation plans are more common. Second, our survey was not accompanied by any direct measures of fidelity of PBIS implementation. We relied on participants’ knowledge of PBIS and its component parts, as well as their interpretations of degrees of implementation, all of which may have varied across educators. Third, although surveys were completed anonymously and on a voluntary basis, educator’s responses may have been affected by social desirability factors. It is possible that their responses overestimated their familiarity with and implementation of PBIS, as well as their views on the inclusion of students with disabilities within these frameworks. Fourth, comparisons between teachers who primarily supported students with high-incidence versus low-incidence disabilities were based on an artificial dichotomy. We categorized teachers according to the disability classification they reported representing the largest proportion of students on their caseload. However, many special educators in our sample supported students with a range of disabilities. Fifth, because we did not include a sample of general education teachers for comparison, we do not know the extent to which responses from special educators represent a distinct viewpoint or distinct patterns of implementation at their school. Comparisons between special and general educators at schools implementing PBIS may be a worthwhile avenue for future research. Finally, because our sample included 849 special educators in 491 schools and 146 districts, there is a possibility of a nesting effect. However, results of intraclass correlation (ICC) analyses suggest that school district accounted for minimal variance in teacher ratings of PBIS implementation at the school, teacher, or student level.
Practical Implications
Our findings have several practical implications for stakeholders. Special educators may need to take the initiative to learn about PBIS efforts at their schools and advocate for supports their students will need to be included across all tiers of the PBIS framework. That is, there may be an implicit assumption that students with disabilities will benefit primarily from Tier II and Tier III interventions. Although some students with disabilities will need intensive, individualized supports, all students (including those with low-incidence disabilities) should have equal access to preventive (Tier I) strategies. Because many special educators have experience making accommodations and modifications for their students, they are well positioned to provide input on how best to include these students in school-wide frameworks. For example, lesson plans on school-wide expectations may be supplemented with visual supports and multiple opportunities to practice. Special educators may also work with PBIS leadership teams to better integrate their students’ individual reinforcement systems with the school-wide system (e.g., students earn tokens for following school-wide behavior expectations in addition to meeting their individual behavior goals).
Administrators may also play a role in setting expectations that school-wide PBIS frameworks will require staff-wide leadership. In addition to communicating expectations for special educators to serve on leadership teams, administrators will need to provide supports necessary for them to become more involved in the leadership process. Considering one eighth of the school-age population includes students with disabilities (U.S. Department of Education, 2015), ensuring adequate representation for this group of students across all tiers of the PBIS framework should be a priority.
Our results also highlight the need for providing high-quality PBIS trainings that include special educators. National training models have emphasized the importance of providing multidisciplinary school teams opportunities to acquire skills via collaborative, practical activities (Dunlap et al., 2000). These activities may provide opportunities for special educators to practice components of PBIS they may struggle to implement (e.g., using school-wide behavioral data for decision making). They might also serve to clarify the purpose behind components of PBIS that special educators consider less relevant for students on their caseload relative to the general education population (e.g., screening to identify needs for more intensive supports). Additional research is needed, however, to identify the key components of PBIS trainings that make them most effective in changing collective staff and student behavior (MacDonald & McGill, 2013). Finally, our results also emphasize the importance of aligning professional development opportunities to the priorities and preferences expressed by school staff. Both administrators and PBIS technical assistance teams may improve such alignment by distributing brief staff-wide questionnaires to collect information on components of PBIS for which additional training is needed, as well as avenues by which staff are most likely to access such training opportunities.
Conclusion
As school-wide PBIS gains an evidence base and is implemented in thousands of schools across the country, little is known about the involvement of special educators and students with disabilities in these frameworks. To maximize the impact of multitiered frameworks like PBIS, we must ensure active engagement of both special educators and students with disabilities. The current study represents a step in this direction by exploring special educators’ experiences and perspectives on school-wide PBIS, including their own actual or anticipated involvement, their students’ participation, barriers to participation, and avenues of support. Overall, reports from special educators suggest that many are supporting their students’ participation in various components of PBIS at the classroom level. At the school level, however, our results suggest that there is more work to be done to ensure meaningful participation of special educators and the students they serve, particularly those with low-incidence disabilities, in PBIS frameworks.
Footnotes
Declaration of Conflicting Interests
The author(s) declared no potential conflicts of interest with respect to the research, authorship, and/or publication of this article.
Funding
The author(s) disclosed receipt of the following financial support for the research, authorship, and/or publication of this article: Support for this research was provided by a grant from the Tennessee Department of Education to Vanderbilt University (Catalog of Federal Domestic Assistance [CFDA] No. 84.027A) and Vanderbilt Institute for Clinical and Translational Research grant support (UL1 TR000445 from National Center for Advancing Translational Sciences [NCATS]/National Institutes of Health [NIH]).