
Abstract
Numerous evidence-based classroom management strategies to prevent and respond to problem behavior have been identified, but research consistently indicates teachers rarely implement them with sufficient implementation fidelity. The purpose of this study was to evaluate the effectiveness of implementation planning, a strategy involving logistical intervention implementation planning and identification of implementation barriers, and participant modeling, a strategy involving didactic and in vivo intervention training, on teachers’ implementation of an evidence-based classroom management plan. A randomized multiple treatment embedded within a multiple baseline design across participants was used to assess (a) teachers’ adherence to the classroom management plans and quality of implementation and (b) student disruptive behavior in the classroom immediately and at follow-up. Results indicated that teachers’ adherence and quality increased with both implementation planning and participant modeling, but these improvements were not fully maintained at 1- and 2-month follow-up. A similar pattern in student disruptive behavior was also observed. These findings highlight the need for ongoing implementation support for behavioral interventions in schools. Implications for future research and practice are discussed.
Keywords
Evidence-based classroom management practices can be organized into five “critical” areas: (a) maximizing structure and predictability (e.g., physical layout facilitates engagement, defining and teaching classroom routines), (b) establishing and teaching expectations (e.g., positively stated expectations; teaching/posting behavior expectations), (c) engaging students in observable ways (e.g., opportunities to respond, direct instruction), (d) using a continuum of strategies to recognize appropriate behaviors (e.g., behavior-specific praise), and (e) using a continuum of strategies to respond to inappropriate behaviors (e.g., brief corrections for inappropriate behavior differential reinforcement; Epstein, Atkins, Cullinan, Kutash, & Weaver, 2008; Office of Special Education Programs, 2016). Effective implementation of these practices promotes student engagement and academic outcomes and decreases disruptive behavior (Epstein et al., 2008). Conversely, poor classroom management implementation has been linked to increased risk for long-term negative academic, social, and behavioral outcomes (Epstein et al., 2008). Despite these findings, research consistently indicates classroom management practices are not implemented with sufficient implementation fidelity (Briere, Simonsen, Sugai, & Myers, 2015; Codding, Livanis, Pace, & Vaca, 2008; Oliver, Wehby, & Nelson, 2015). This finding is not surprising as teachers report behavior management as their greatest challenge and the area in which they need more support (Reinke, Stormont, Herman, Puri, & Goel, 2011).
For decades, behavioral consultation has been used to provide support to teachers regarding interventions, including classroom management (Kratochwill, Altschaefl, & Bice-Urbach, 2014; Kratochwill & Bergan, 1990). Behavioral consultation is an indirect service delivery approach in which a consultant (e.g., school psychologist) works with a consultee (e.g., teacher) who, in turn, provides services to students (Kratochwill et al., 2014). Twenty years of research indicate teacher consultees struggle to demonstrate adequate implementation fidelity following didactic training (i.e., verbal overview of the intervention by consultant) within behavioral consultation, resulting in poorer student outcomes (Noell & Gansle, 2014).
These findings spurred development and evaluation of numerous implementation strategies consultants can utilize to support teacher consultees’ implementation fidelity. Many of these strategies have increased implementation adherence (i.e., extent to which intervention steps were implemented as planned) and quality (i.e., extent to which implementation was appropriately timed, fluent, and authentic; Dart, Cook, Collins, Gresham, & Chenier, 2012; Sanetti & Collier-Meek, 2015; Sanetti, Kratochwill, & Long, 2013; Simonsen, MacSuga, Fallon, & Sugai, 2013; Sterling-Turner, Watson, & Moore, 2002). Evidence-based implementation strategies vary regarding their intensity, requiring different amounts of time, settings for delivery, numbers of sessions, and resources (Sanetti & Collier-Meek, 2015). The availability of empirically supported implementation strategies is an important step toward improving consultation outcomes; yet, there is limited guidance about how to decide what strategy to deliver to which consultees and when to do so (Sanetti & Collier-Meek, 2015).
One data-based decision-making approach is to provide proactive implementation support to all consultees, evaluate consultee responsiveness, and subsequently intensify implementation support as needed (Sanetti & Collier-Meek, 2015). Sanetti and Collier-Meek (2015) conducted a pilot study of this approach, evaluating three implementation supports embedded within behavioral consultation: direct training, implementation planning, and participant modeling. Direct training, the least intensive support, includes an introduction to the intervention, consultant modeling of the intervention, consultant and consultee intervention role play, and feedback (Sterling-Turner et al., 2002). Implementation planning, a slightly more intensive support, is a combination of two behavior change strategies from the health psychology literature: action planning and coping planning (Sanetti et al., 2013). It includes a meeting in which the consultant leads the consultee in detailed logistical planning related to implementation (e.g., who, when, where, resources needed; action planning) and proactive identification and development of solutions to address implementation barriers (coping planning; Sanetti et al., 2013). Participant modeling, a more time-intensive support, includes (a) a meeting to review the intervention and implementation fidelity data, (b) the consultant modeling and then the consultee practicing intervention steps in vivo with students until mastery is demonstrated, and (c) a meeting to debrief (Sanetti & Collier-Meek, 2015). In the pilot study, consultants provided direct training to all six consultees. Subsequently, consultants provided implementation planning to the four consultees who still demonstrated low adherence. Two consultees’ low adherence continued and consultants provided participant modeling. This data-based intensification of implementation support resulted in high levels of adherence of classroom management practices for all consultees (Sanetti & Collier-Meek, 2015). These results suggest (a) organizing implementation supports by intensity, (b) providing the least intensive implementation supports initially, (c) monitoring implementation fidelity data, and (d) providing more intensive implementation supports as needed can be an effective and resource-efficient method of supporting implementation of classroom management practices (Sanetti & Collier-Meek, 2015). These findings are promising as lack of time is a common reason for not providing implementation support (Cochrane & Laux, 2008). More research is needed, however, to understand how implementation supports affect implementation fidelity dimensions across time.
Purpose of Current Study
The current study extends the previous pilot study by examining the effects of implementation planning and participant modeling, delivered as needed during behavioral consultation, on teachers’ implementation adherence and quality of an evidence-based comprehensive classroom management plan (CMP) both immediately and 1 and 2 months after consultation. Four research questions were addressed:
Method
Participants and Setting
Participants included three general education teachers from two suburban public elementary schools in two school districts in the Northeast. Teachers A and B taught at the same school, which serviced 350 preschool through fifth-grade students. Of these students, 63% were White, 14% were Hispanic, 10% were Black, 9% were Asian/Pacific Islander, and 4% identified as having two or more races; 42% qualified for free or reduced-price lunch (National Center for Education Statistics [NCES], 2016). Teacher C’s school serviced 551 preschool through fifth-grade students. Of these students, 58% were White, 19% were Hispanic, 13% were Black, 8% were Asian/Pacific Islander, and 3% identified as having two or more races; 20% qualified for free or reduced-price lunch (NCES, 2016). Both school districts had system-level support for School-Wide Positive Behavioral Intervention and Support (SW-PBIS), and both schools were in their first year of implementing Tier 1 SW-PBIS. Both schools had SW-PBIS teams, received SW-PBIS training and ongoing coaching, and utilized data systems and practices aligned with SW-PBIS. Participating teachers voluntarily requested classroom management support.
Teacher A was a Caucasian female who taught 17 fifth-grade students in a general education classroom. She had general education certification, a master’s degree, and 13 years teaching experience. During her teacher training, Teacher A received instruction on classroom management as part of a course devoted primarily to another topic; throughout her teaching career, she never received professional development on classroom management. She reported there were students receiving special education services under the classifications of learning disability and emotional disturbance in her classroom.
Teacher B was a Latina female who taught 14 fourth-grade students in a general education classroom. She had general education certification, a bachelor’s degree, and 5 years teaching experience. During her teacher training, Teacher B did not receive any instruction on classroom management, but, throughout her teaching career, she received a total of 2 to 3 days of professional development on classroom management. She reported that there were students receiving special education services under the classifications of emotional disturbance, autism, speech and language disability, and learning disability in her classroom.
Teacher C was a Caucasian female who taught 25 fourth-grade students in a general education classroom. She had general and special education certifications, a master’s degree plus additional credits, and 18 years teaching experience. During her teacher training, Teacher C did not receive any instruction on classroom management, but throughout her teaching career, she received 5 days of professional development on classroom management. She reported that there were students receiving special education services under the classifications of emotional disturbance, learning disability, and speech and language disability in her classroom.
Instrumentation
Two categories of instrumentation were utilized in the current study: instruments to inform development and evaluation of CMPs and instruments to measure dependent variables. They are described by category below.
Instruments to inform development and evaluation of CMPs
A classroom management survey was completed by teachers, and direct observations of classroom management were conducted by consultants during the Preimplementation phase to gather information about classroom management practices used by each teacher to inform development of CMPs. At study conclusion, teachers again completed the classroom management survey and also completed a social validity measure focused on the CMP. Each of these instruments is further described below.
Classroom management survey
During the Preimplementation phase and at study conclusion, a classroom management survey was completed by teachers to provide background information on their understanding and use of best practices in classroom management. This survey was adapted from two different measures—the Classroom Ecology Checklist (CEC; Reinke, Herman, & Sprick, 2011) and the Teachers’ Knowledge and Use of Classroom and Behavior Management Strategies (Borthwisck-Duffy, Lane, & Mahdavi, 2002; Moore, Oliver, & Wehby, 2012)—and consisted of 64 items. The first item set pertained to current knowledge of best practices in classroom management strategy had four response options (1 = no knowledge, 2 = limited knowledge, 3 = somewhat knowledgeable, and 4 = very knowledgeable; Moore et al., 2012), and has demonstrated good internal consistency reliability (α = .91). The second item set pertained to the extent of implementation of best practices in the classroom had four response options (1 = not at all, 2 = limited use, 3 = somewhat, and 4 = very frequently; Moore et al., 2012), and has demonstrated good internal consistency (α = .83). The final item set related to the use of specific classroom management strategies had three response options (1 = no, 2 = somewhat, and 3 = yes; Reinke, Herman, & Sprick, 2011), and has demonstrated good internal consistency (α = .83; W. M. Reinke, personal communication, June 13, 2016).
Observation of teacher classroom management behaviors
Five discrete teacher behaviors were observed to provide more direct data to inform the development of a CMP: (a) general praise, (b) specific praise, (c) reprimands, (d) opportunities to respond, and (e) correct academic responses. The 15-min observations were divided into 15-s intervals to facilitate the calculation of interobserver agreement and were conducted during instructional times teachers identified as challenging regarding classroom management (see Table 1). Three (Teachers A and B) or four (Teacher C) observations were conducted; one observation was canceled for Teachers A and B due to a school closing. A frequency count procedure was utilized and a rate per minute was calculated for each behavior.
Percentage of Sessions With Interobserver Agreement Data and Mean Level of Interobserver Agreement Across Teachers and Phases.

Note. OTR = opportunities to respond; CAR = correct academic responses; Initial = Initial Consultation; IP = Implementation Planning; PM = Participant Modeling.
Usage Rating Profile–Intervention Revised (URP-IR)
Teachers completed five subscales, including 26 items, of the URP-IR related to the CMP: acceptability, understanding, feasibility, system climate, and system support. Each item was rated on a 6-point Likert-type scale (1 = strongly disagree to 6 = strongly agree). The URP-IR has demonstrated acceptable levels of internal consistency reliability (α = .80–.95; Chafouleas, Briesch, Neugebauer, & Riley-Tillman, 2011). The Homeschool Collaboration subscale was not applicable to the current study.
Instruments to measure dependent variables
Implementation fidelity and student disruptive behavior data were collected via direct observation during an instructional activity the teacher identified as being most challenging regarding classroom management. Consultants observed at a consistent time and instructional activity throughout the study. Teachers completed measures of social validity regarding implementation strategies at study conclusion.
Implementation fidelity
Direct observation was used to collect estimates of the implementation adherence and quality of the CMPs. The format of the implementation fidelity measure was standardized, but the specific steps were based on each teacher’s CMP. For each operationally defined CMP step, consultants rated (a) adherence (i.e., 0 = not implemented, 1 = implemented with deviation, 2 = implemented as planned, or NO = no opportunity for implementation), (b) implementation quality (i.e., 0 = poor, 1 = fair, 2 = good, or 3 = excellent), and (c) applicability (i.e., 1 = applicable for observation, 0 = not applicable per CMP).
Differentiations between adherence ratings were based on the operationally defined CMP step. For example, one teacher’s CMP required actively scanning and moving around the room during independent seatwork and acknowledging student behavior. For this CMP step, the teacher (a) being on her computer throughout independent seatwork was rated as not implemented; (b) scanning and moving around the room but not acknowledging student behavior, or acknowledging student behavior from her desk, was rated as implemented with deviation; and (c) scanning and moving as defined was rated as implemented as planned.
Quality was calculated as the number of steps rated as excellent or good divided by the total number of steps implemented (either as planned or with deviation). To be rated excellent, a CMP step was implemented skillfully as indicated by (a) appropriate interaction (e.g., appropriate tone, specificity), (b) smooth and natural-looking delivery (e.g., automatic response, materials readily accessible), (c) appropriate timing (e.g., review of behavior expectations before new activity), and (d) competent implementation (e.g., clearly responsive to student’s unique needs). To be rated good, a CMP step was implemented adequately, but in a less skillful manner, and was somewhat flawed in one of the excellent indicators. To be rated fair, a CMP step was implemented poorly in a manner that was seriously flawed in at least one or somewhat flawed in two of the excellent indicators. CMP steps implemented with fewer indicators were rated poor.
A CMP step was applicable if, per the plan, the teacher was expected to implement it during the observation time. Adherence was calculated as the number of CMP steps implemented as planned divided by the number of applicable steps. The 30-min observations occurred 2 to 3 times per week across phases; interobserver agreement data are presented in Table 1.
Disruptive behavior
Disruptive behavior was defined as an action that interrupts regular school or classroom activity (e.g., being out of seat, fidgeting, playing with objects, acting aggressively, talking/yelling about things that are unrelated to classroom instruction; Chafouleas, 2011). A frequency count of disruptive behavior across all students in the classroom occurred 2 to 3 times per week across all phases. The 15-min observations were divided into 15-s intervals to facilitate the calculation of interobserver agreement and were conducted during instructional times teachers identified as challenging regarding classroom management (see Table 1). Continuous frequency counts were used to reflect every instance of disruptive behavior the teacher experienced during the observation session. This approach is more sensitive to treatment effects than other time-sampling methods (Meany-Daboul, Roscoe, Bourret, & Ahearn, 2007). Disruptive behavior rates were calculated by dividing the total frequency by minutes observed.
Social validity
At the end of consultation, teachers independently completed social validity measures of the implementation strategies received via the Usage Rating Profile–Implementation Planning (URP-Implementation Planning) and Usage Rating Profile–Participant Modeling (URP-Participant Modeling). The five subscales of the URP-IR were adapted to assess teacher perceptions of implementation planning and participant modeling (Chafouleas et al., 2011). Items were revised to focus on implementation supports. For example, “This intervention is an effective choice for addressing a variety of problems,” on the URP-IR was revised to “The implementation planning activity is an effective choice for addressing a variety of implementation problems,” on the URP-Implementation Planning and “The teaching with in-class modeling activity is an effective choice for addressing a variety of implementation problems,” on the URP-Participant Modeling.
Procedural Fidelity
Procedural fidelity data were collected for behavioral consultation, implementation planning, and participant modeling.
Behavioral consultation
Consultants completed session checklists immediately after each interview to ensure completion of all behavioral consultation components (Kratochwill & Bergan, 1990). A second rater listened to consultation interview recordings to obtain interrater reliability. Per consultant self-ratings, the average percentage of components completed across all interviews was 100%; average interrater agreement across interviews was 100%.
Implementation planning
Implementation planning procedural fidelity was assessed using measures of the nine steps of action planning and three steps of coping planning (Sanetti et al., 2013). Measures included ratings on adherence, quality, and consultee responsiveness. These measures included (a) a column detailing the behaviorally defined steps of action and coping planning, (b) columns to rate the adherence level of each step (i.e., 0 = none, 1 = limited, 2 = substantial, 3 = complete), and (c) columns to rate the quality of each step (0 = poor, 1 = fair, 2 = good, 3 = excellent). Adherence and quality metrics were calculated in the same manner as CMP implementation fidelity described above. In addition, consultee responsiveness was rated by measuring (a) engagement, the extent to which the consultee purposefully participated in the action/coping planning process, and (b) cooperation, the extent to which the consultee willingly and agreeably collaborated with the consultant during the implementation planning process. Both engagement and cooperation were rated on a 4-point scale (0 = never or 0% of time, 1 = rarely or ≤50% of time, 2 = mostly or >50% of time, 3 = always or 100% of time). Consultants completed the procedural fidelity measures immediately following delivery of implementation planning. A second consultant was present for each implementation planning meeting to facilitate interrater agreement. For action planning and coping planning, average consultant self-ratings were 100% for adherence and 100% for quality. Average consultant ratings of consultee responsiveness were 2.67 for engagement (range: 2–3) and 3 for cooperation during action planning, and 3 for both engagement and cooperation during coping planning. Average interrater agreement for adherence, quality, engagement, and cooperation across action and coping planning was 100%.
Participant modeling
The format of the participant modeling procedural fidelity measure aligned with that used for implementation planning, with adherence and quality ratings for each participant modeling step and holistic ratings of consultee responsiveness (i.e., engagement and cooperation). Consultants completed the procedural fidelity measures immediately following delivery of participant modeling. A second rater listened to the digital recordings to determine interrater agreement for seven of the 11 steps in participant modeling; the in vivo activity was not audio recorded. Consultant self-ratings of all 11 steps were 100% for adherence and 95.46% for quality. Average interrater agreement for the relevant steps was 100% for adherence and quality across all participants. Average consultee responsiveness ratings were 3 for both engagement and cooperation. Interrater agreement was not calculated for consultee responsiveness ratings as a second consultant was not present during in vivo sessions.
Design
A randomized multiple treatment embedded within a multiple baseline across teacher participants was used to evaluate the effects of implementation planning and, for some teachers, participant modeling, delivered within behavioral consultation, on CMP implementation fidelity (Kratochwill & Levin, 2010). After the Preimplementation phase, teachers were randomly assigned to intervention order and the Initial Consultation phase began. Random assignment to baseline order was used to enhance the internal validity of the design. Visual analysis and Tau-U were used to evaluate the experimental outcomes (Kratochwill et al., 2010; Parker, Vannest, & Davis, 2014). Randomization tests could not be conducted as there were three participants and only one aspect of the study was randomized. Teacher A was eligible for the Implementation Planning phase when adherence levels were low (i.e., at least two consecutive days below 80%). When her adherence data demonstrated an increasing trend or level for at least three data points, the next participant entered the Implementation Planning phase. Participating teachers whose average adherence was below 70% in this phase received participant modeling.
Procedure
Prior to engaging in any study procedures, university institutional review board approval was obtained. Subsequently, school district permission was obtained to conduct this study.
Consultant training
One male and two female school psychology graduate students served as consultants and collected interobserver agreement data across cases. Each consultant had previous experience with behavioral assessments and received a minimum of 25 hr of training related to behavioral consultation, classroom management practices, direct observation, and general study procedures. The first and third authors provided training on the disruptive behavior and implementation fidelity direct observation procedures, including didactic instruction and practice with time-sampling procedures, while watching videos of elementary classrooms. Consultants practiced until they obtained a minimum of 80% agreement with a master code across three observations. Each consultant also received 30 to 60 min of clinical supervision weekly from a licensed psychologist (first and/or third authors).
Preimplementation phase
During this phase, consultants measured current classroom management practices and student disruptive behavior, and developed a CMP.
Problem identification interview (PII)
The teacher and consultant completed a PII during which they identified and defined classroom management concerns, currently implemented best practices in classroom management, and relevant environmental variables. The teacher identified instructional activities and times during which managing behavior in the classroom was particularly challenging; this information was used to schedule consistent observation times used for the duration of the study. Teachers A and B identified math instruction and Teacher C identified reading instruction as the most challenging time.
Assessment of classroom management practices and student disruptive behavior
Following the PII, the consultant observed teacher behavior and student disruptive behavior 2 to 3 times per week during instructional activities identified in the PII. After three (Teachers A and B) or four (Teacher C) observations, the consultant reviewed the classroom management survey and direct observation data, and wrote a classroom assessment report (CAR). This report included a summary of the PII, survey results, and the observation data on teacher behavior and student disruptive behavior. The CAR was organized by critical area of classroom management (Simonsen, Fairbanks, Briesch, Myers, & Sugai, 2008). The preimplementation data indicated a need for a CMP in each of the participating classrooms (see Tables 2 and 3).
Pre–Post Data on Teacher Ratings of Their Knowledge, Implementation, and Use of Best Practices in Classroom Management.
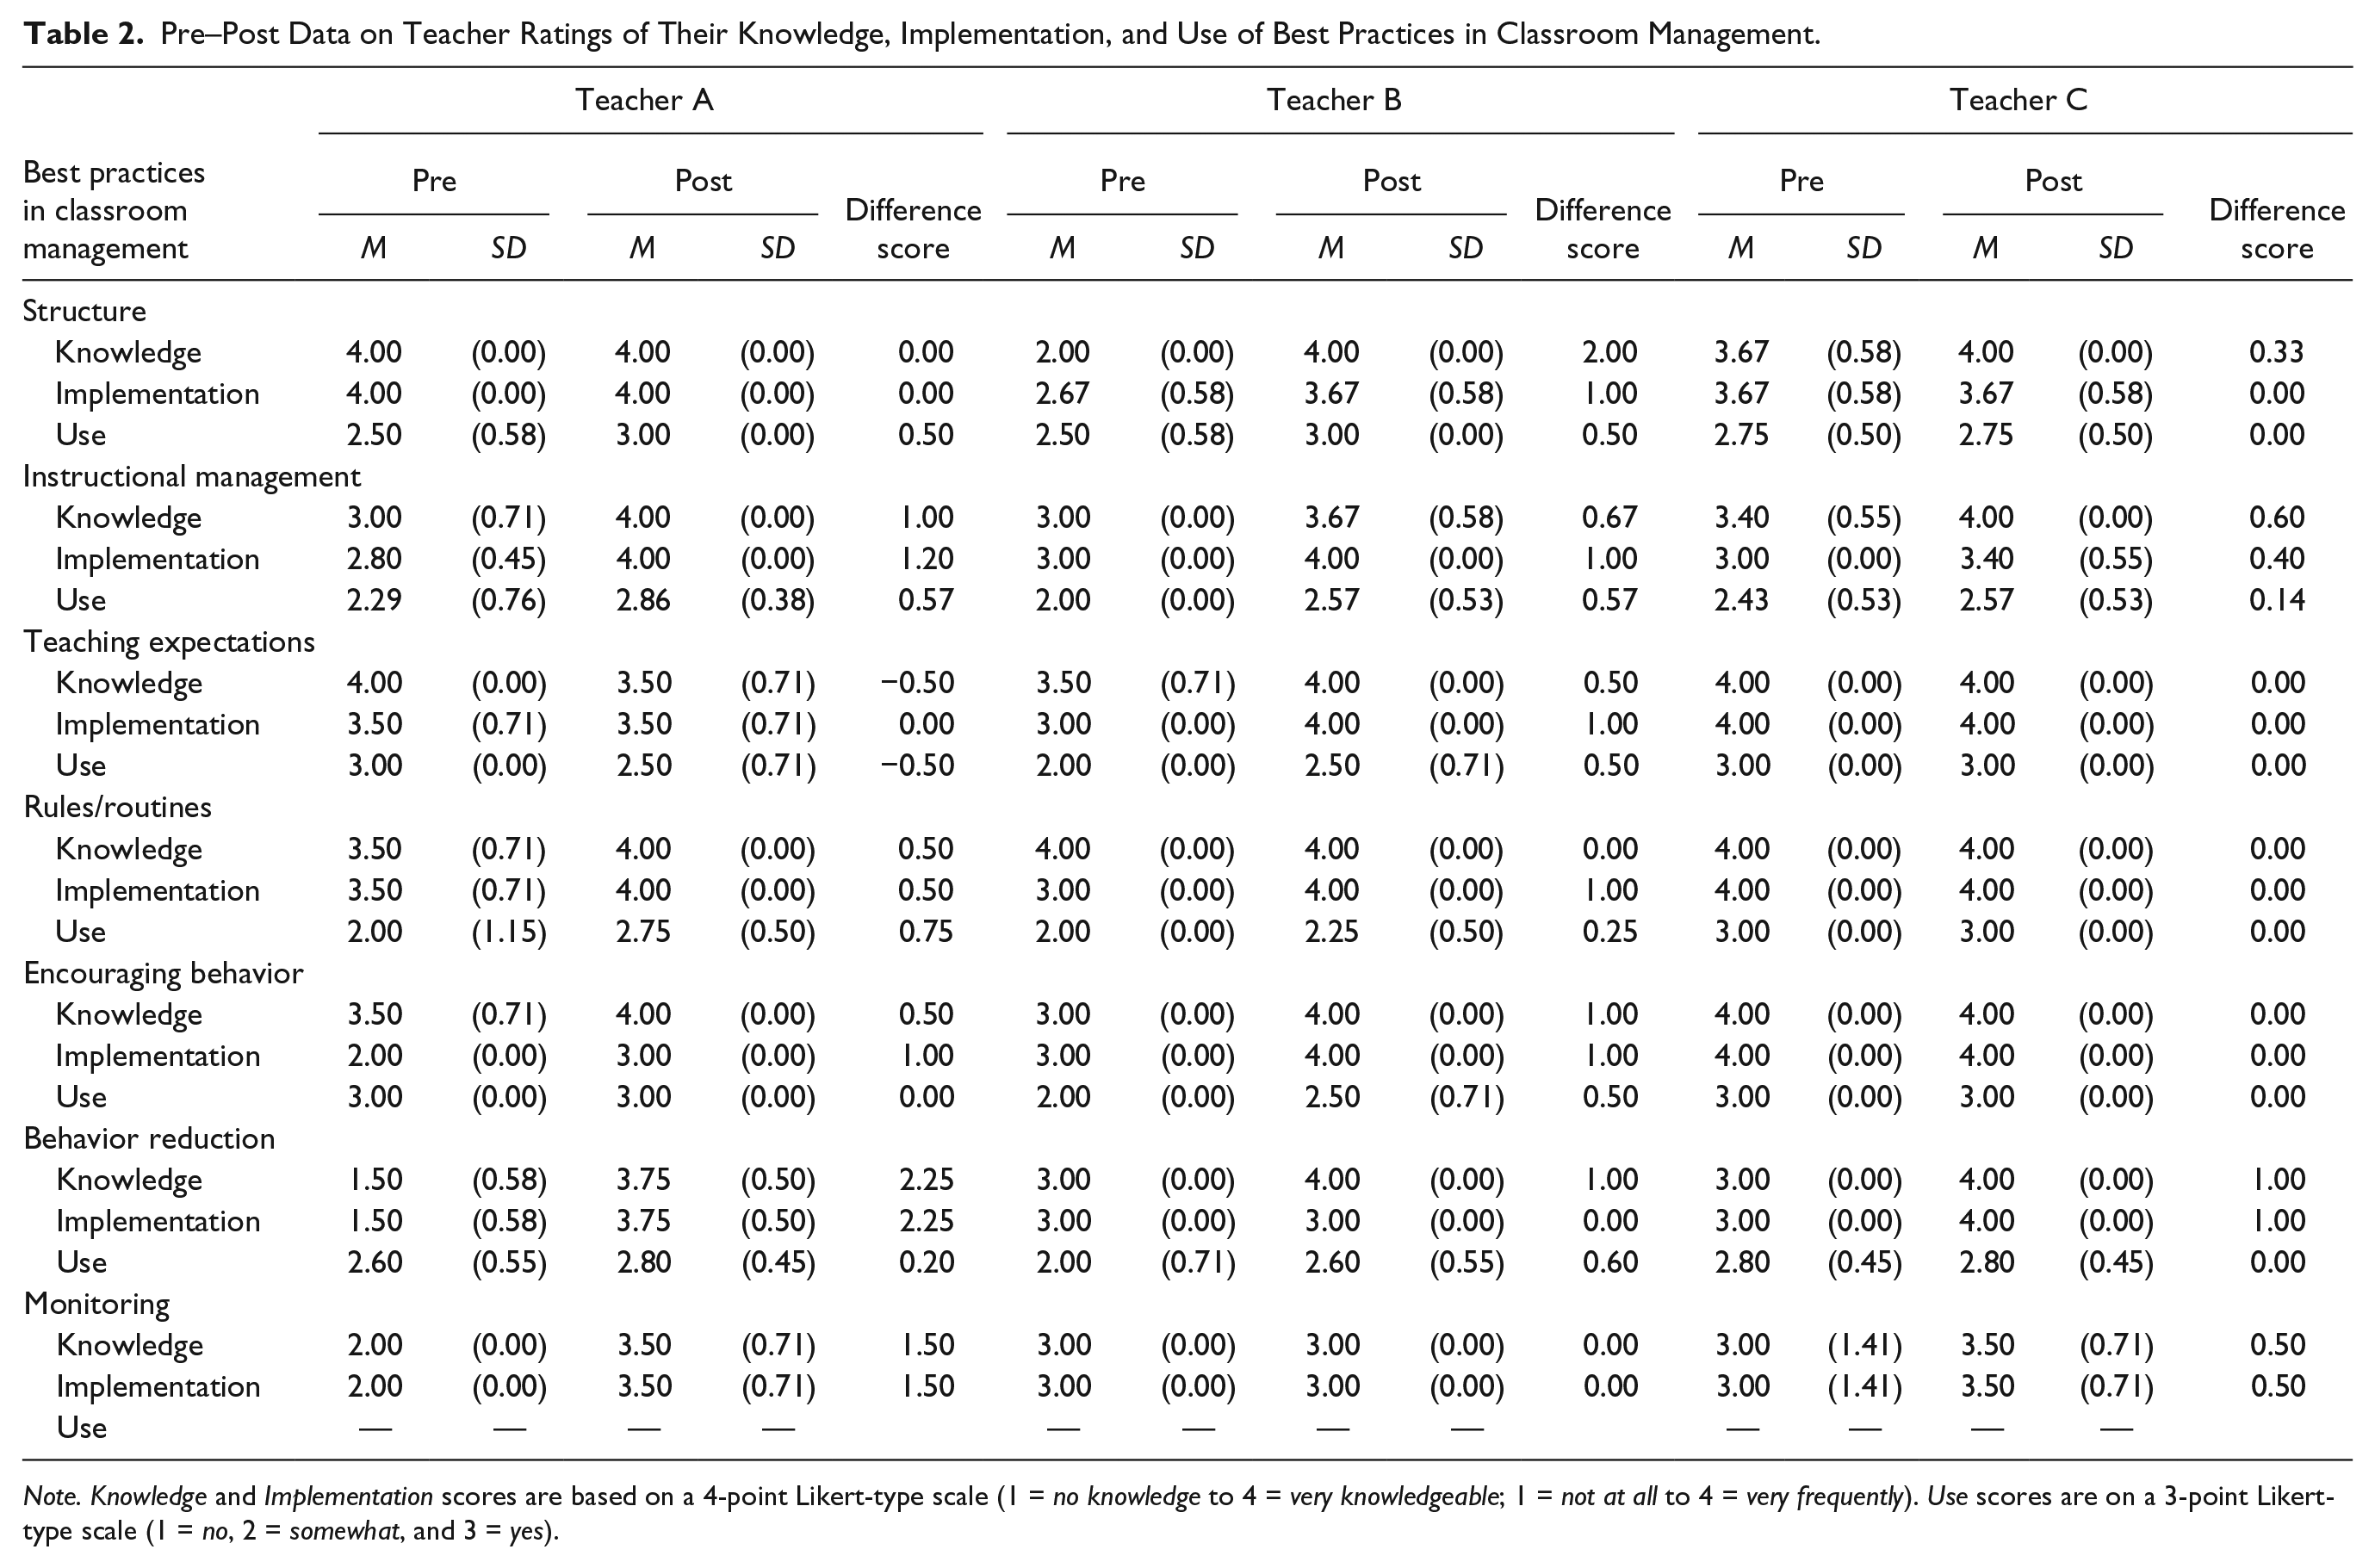
Note. Knowledge and Implementation scores are based on a 4-point Likert-type scale (1 = no knowledge to 4 = very knowledgeable; 1 = not at all to 4 = very frequently). Use scores are on a 3-point Likert-type scale (1 = no, 2 = somewhat, and 3 = yes).
Teacher and Student Behavior Data During Preimplementation Phase.
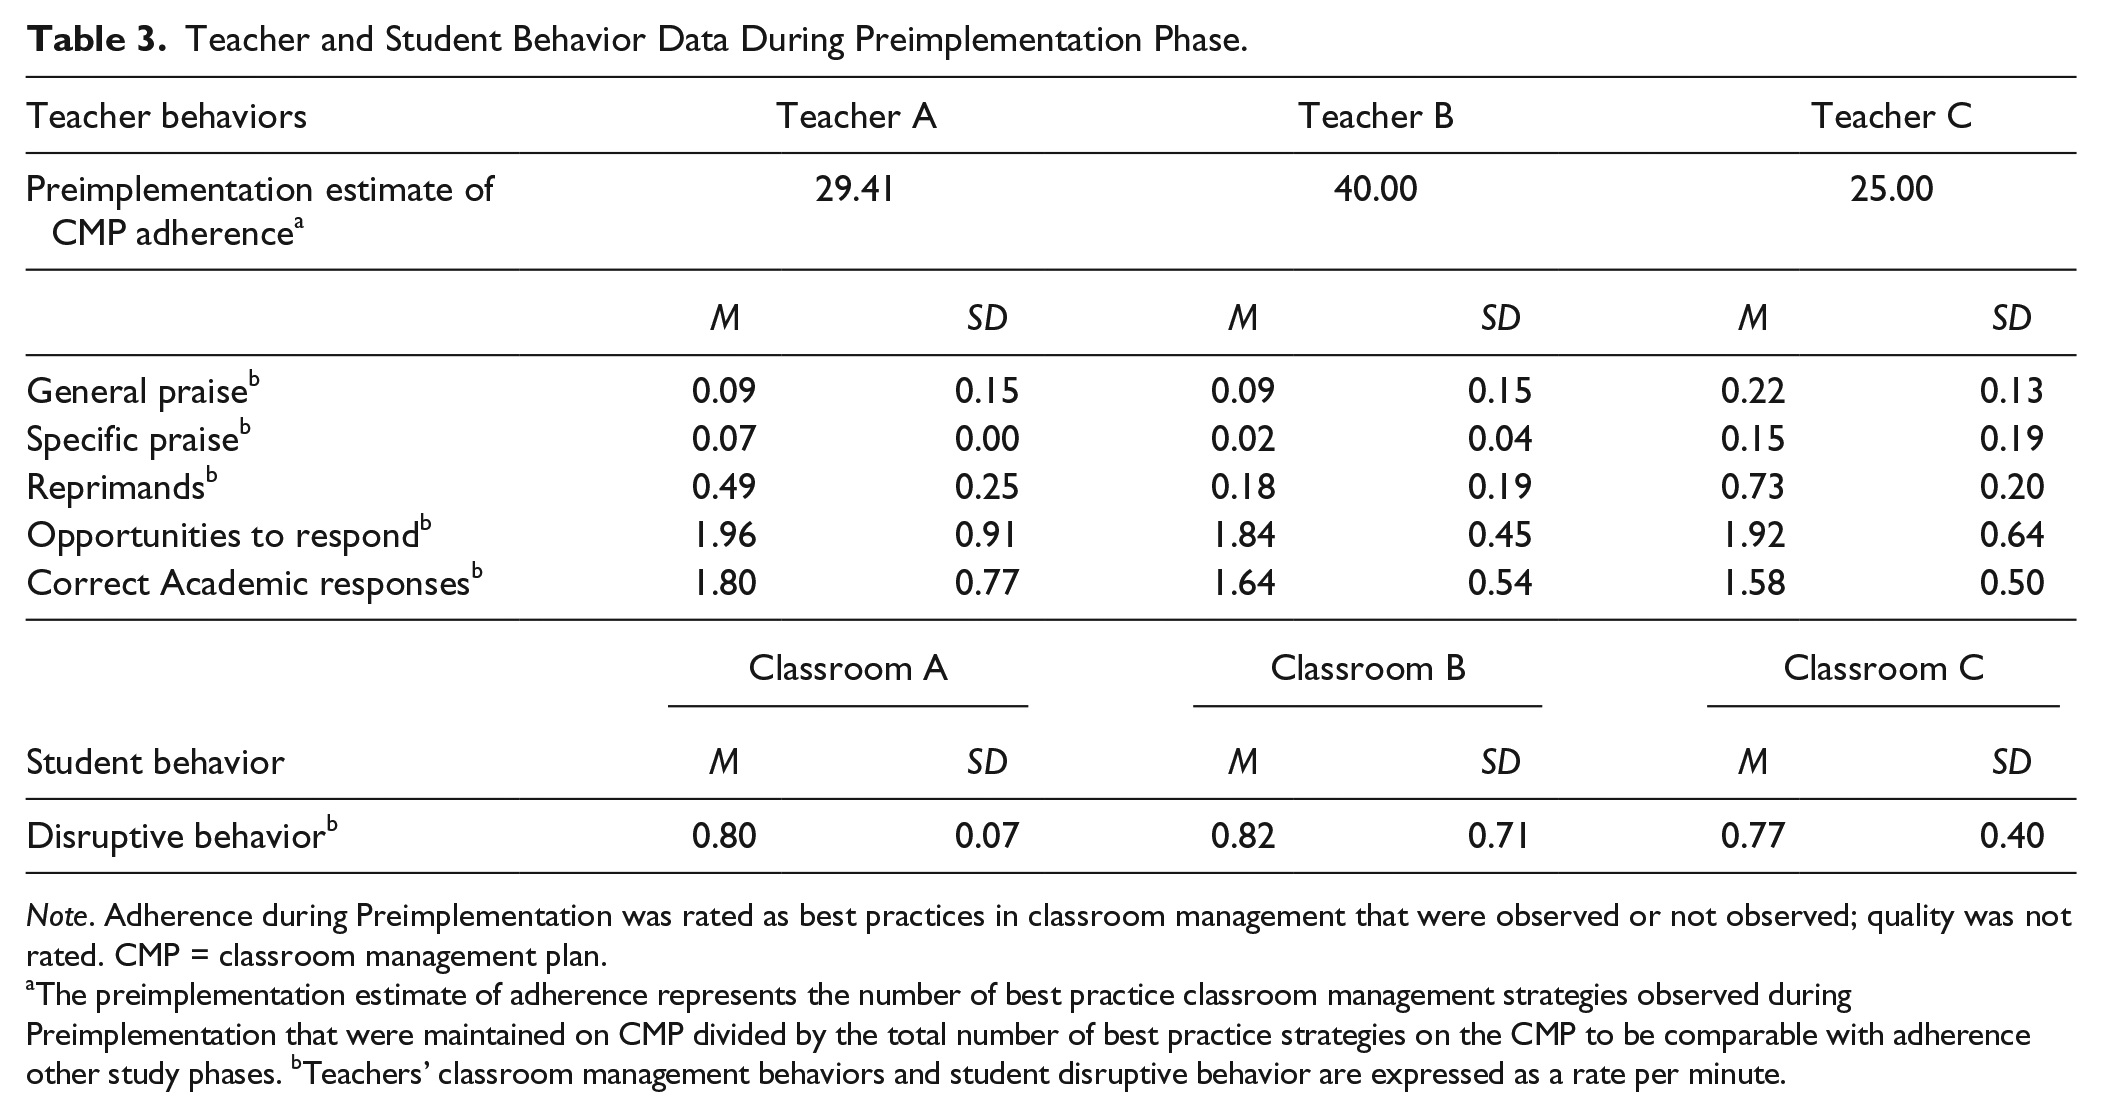
Note. Adherence during Preimplementation was rated as best practices in classroom management that were observed or not observed; quality was not rated. CMP = classroom management plan.
The preimplementation estimate of adherence represents the number of best practice classroom management strategies observed during Preimplementation that were maintained on CMP divided by the total number of best practice strategies on the CMP to be comparable with adherence other study phases. bTeachers’ classroom management behaviors and student disruptive behavior are expressed as a rate per minute.
CMP development
Consultants used the CAR to draft the CMP. The research team created a menu of evidence-based classroom management strategies, organized by the five areas of classroom management, and used it to link assessment data with CMP strategies. Each CMP addressed areas of existing strengths and areas in need of additional support across the five critical areas of classroom management.
Teacher A
Two areas of classroom management, (a) maximizing structure and predictability and (b) using a continuum of strategies to respond to inappropriate behavior, were identified as strengths; practices related to these areas were maintained. Three areas of classroom management in need of improvement were identified: (a) establishing and teaching expectations, (b) engaging students in observable ways, and (c) using a continuum of strategies to recognize appropriate behavior. Strategies in these areas were suggested in the CMP.
Teacher B
Two areas of classroom management, (a) maximizing structure and predictability and (b) engaging students in observable ways, were identified as strengths; practices in these areas were maintained. Three areas of classroom management in need of improvement were identified: (a) establishing and teaching expectations, (b) using a continuum of strategies to recognize appropriate behavior, and (c) using a continuum of strategies to respond to inappropriate behavior. Strategies in these areas were suggested in the CMP.
Teacher C
Three areas of classroom management, (a) maximizing structure and predictability, (b) establishing and teaching expectations, and (c) using a continuum of strategies to respond to inappropriate behavior, were identified as strengths; practices related to these areas were maintained. Two areas of classroom management in need of improvement were identified: (a) engaging students in observable ways and (b) using a continuum of strategies to respond to appropriate behavior. Strategies in these areas were suggested in the CMP.
Problem analysis interview (PAI)
When the CAR was written and CMP was drafted, the consultant and teacher met for a PAI. The consultant (a) reviewed the assessment results in the CAR, (b) collaborated with the teacher to reach consensus on the final CMP, (c) provided the teacher with all materials required for CMP implementation (e.g., folder for materials, written CMP, student progress charts, reward menus), and (d) provided direct training on the CMP.
Initial Consultation phase
After training, teachers were to implement the CMP daily. Similar to previous research on implementation supports (e.g., Sanetti & Collier-Meek, 2015), the Initial Consultation phase serves as the baseline for CMP implementation fidelity. Weekly, the consultant (a) observed student disruptive behavior and CMP implementation fidelity 2 to 3 times and (b) met with the teacher for 5 min to address any questions.
Implementation Planning phase
When CMP adherence declined, or maintained at a low level (i.e., below 80% on at least two consecutive days), the consultant met with the teacher to complete implementation planning. During this meeting, the consultant and teacher completed an action plan that entailed (a) reviewing each step of the CMP; (b) revising CMP steps to increase feasibility and compatibility with classroom routines, as needed; and (c) completing detailed logistical planning of CMP implementation. Then, with the consultant’s guidance, the teacher completed a coping plan, identifying up to four potential barriers to CMP implementation and developing strategies to address each barrier. Following the meeting, the consultant summarized the action and coping plans in a report for the teacher, and modified the CMP as indicated. On average, teachers made 4.67 (range: 4–5) changes to the CMP during action planning (e.g., altering methods for reward delivery, increasing visual prompts for CMP implementation). After implementation planning, teachers continued daily implementation of the CMPs and consultants continued weekly observations and check-in meetings.
Participant Modeling phase
Consultants met with teachers whose adherence was low (i.e., below 70%) following implementation planning and engaged in participant modeling. Participant modeling involved multiple components. First, the teacher met with the consultant who (a) reiterated the rationale for the CMP, (b) reviewed CMP steps, and (c) discussed CMP steps that observation data indicated needed to be practiced. Second, during an in vivo session, the consultant modeled each step with the teacher’s students before the teacher practiced the step, initially with consultant assistance and then independently. After the in vivo session, the consultant provided feedback to the teacher during a brief meeting. Teachers continued daily CMPs implementation and consultants continued weekly observations and check-in meetings.
Postintervention phase
Following ongoing CMP implementation, the consultant and teacher completed a Treatment Evaluation Interview (TEI) to determine if (a) the consultation goals were met or additional problem analysis or classroom management support was required. Following the TEI, all teachers completed social validity measures.
Follow-Up phases
One and 2 months after the TEI, the consultant conducted two to three observations of student disruptive behavior and CMP implementation fidelity within a week, as in previous phases, and checked-in with the teacher regarding CMP implementation.
Data Analysis
Visual analysis procedures were utilized to analyze the implementation fidelity data. Changes in the level, trend, and variability between baseline and intervention phases as well as immediacy of effect and overlap of baseline and intervention data paths were analyzed. These procedures are consistent with the current single-case design standards (Kratochwill et al., 2010). In addition, we applied Tau-U, a non-overlap index, following recent recommendations for single-case design (Parker et al., 2014) and interpretive guidelines from Parker and Vannest (2009; weak = 0–0.65, moderate = 0.66–0.92, large = 0.93–1.00).
Results
Our purposes were to evaluate (a) the effect of implementation planning on CMP adherence and quality for all teachers, (b) the effect of participant modeling on CMP adherence and quality for teachers needing additional implementation support, (c) changes in student disruptive behavior as implementation adherence and quality improve, and (d) teacher ratings of social validity. Our findings are presented to address each of these purposes.
Effect of Implementation Planning on Adherence and Quality
Adherence
All teachers demonstrated low-to-moderate levels of CMP adherence prior to implementation planning, with Teacher A demonstrating a decreasing trend, Teacher B showing significant variability, and Teacher C demonstrating both a decreasing trend and high degree of variability. After implementation planning, all three teachers demonstrated a distinct level change, with Teachers A and B implementing the CMP at a moderate level of adherence and Teacher C implementing at a stable, high level. Teacher B continued to demonstrate a high degree of variability. Tau-U indicated that the impact of implementation planning on adherence was moderate for Teacher A, weak for Teacher B, and large for Teacher C (see Table 4). Teacher C’s implementation decreased slightly from the Implementation Planning phase to the Follow-Up phase but may still be considered adequate (see Figure 1 and Table 4).
Mean, Standard Deviation, and Tau-U for CMP Adherence and Quality and Student Disruptive Behavior Data Across Teachers, Classrooms, and Study Phases.
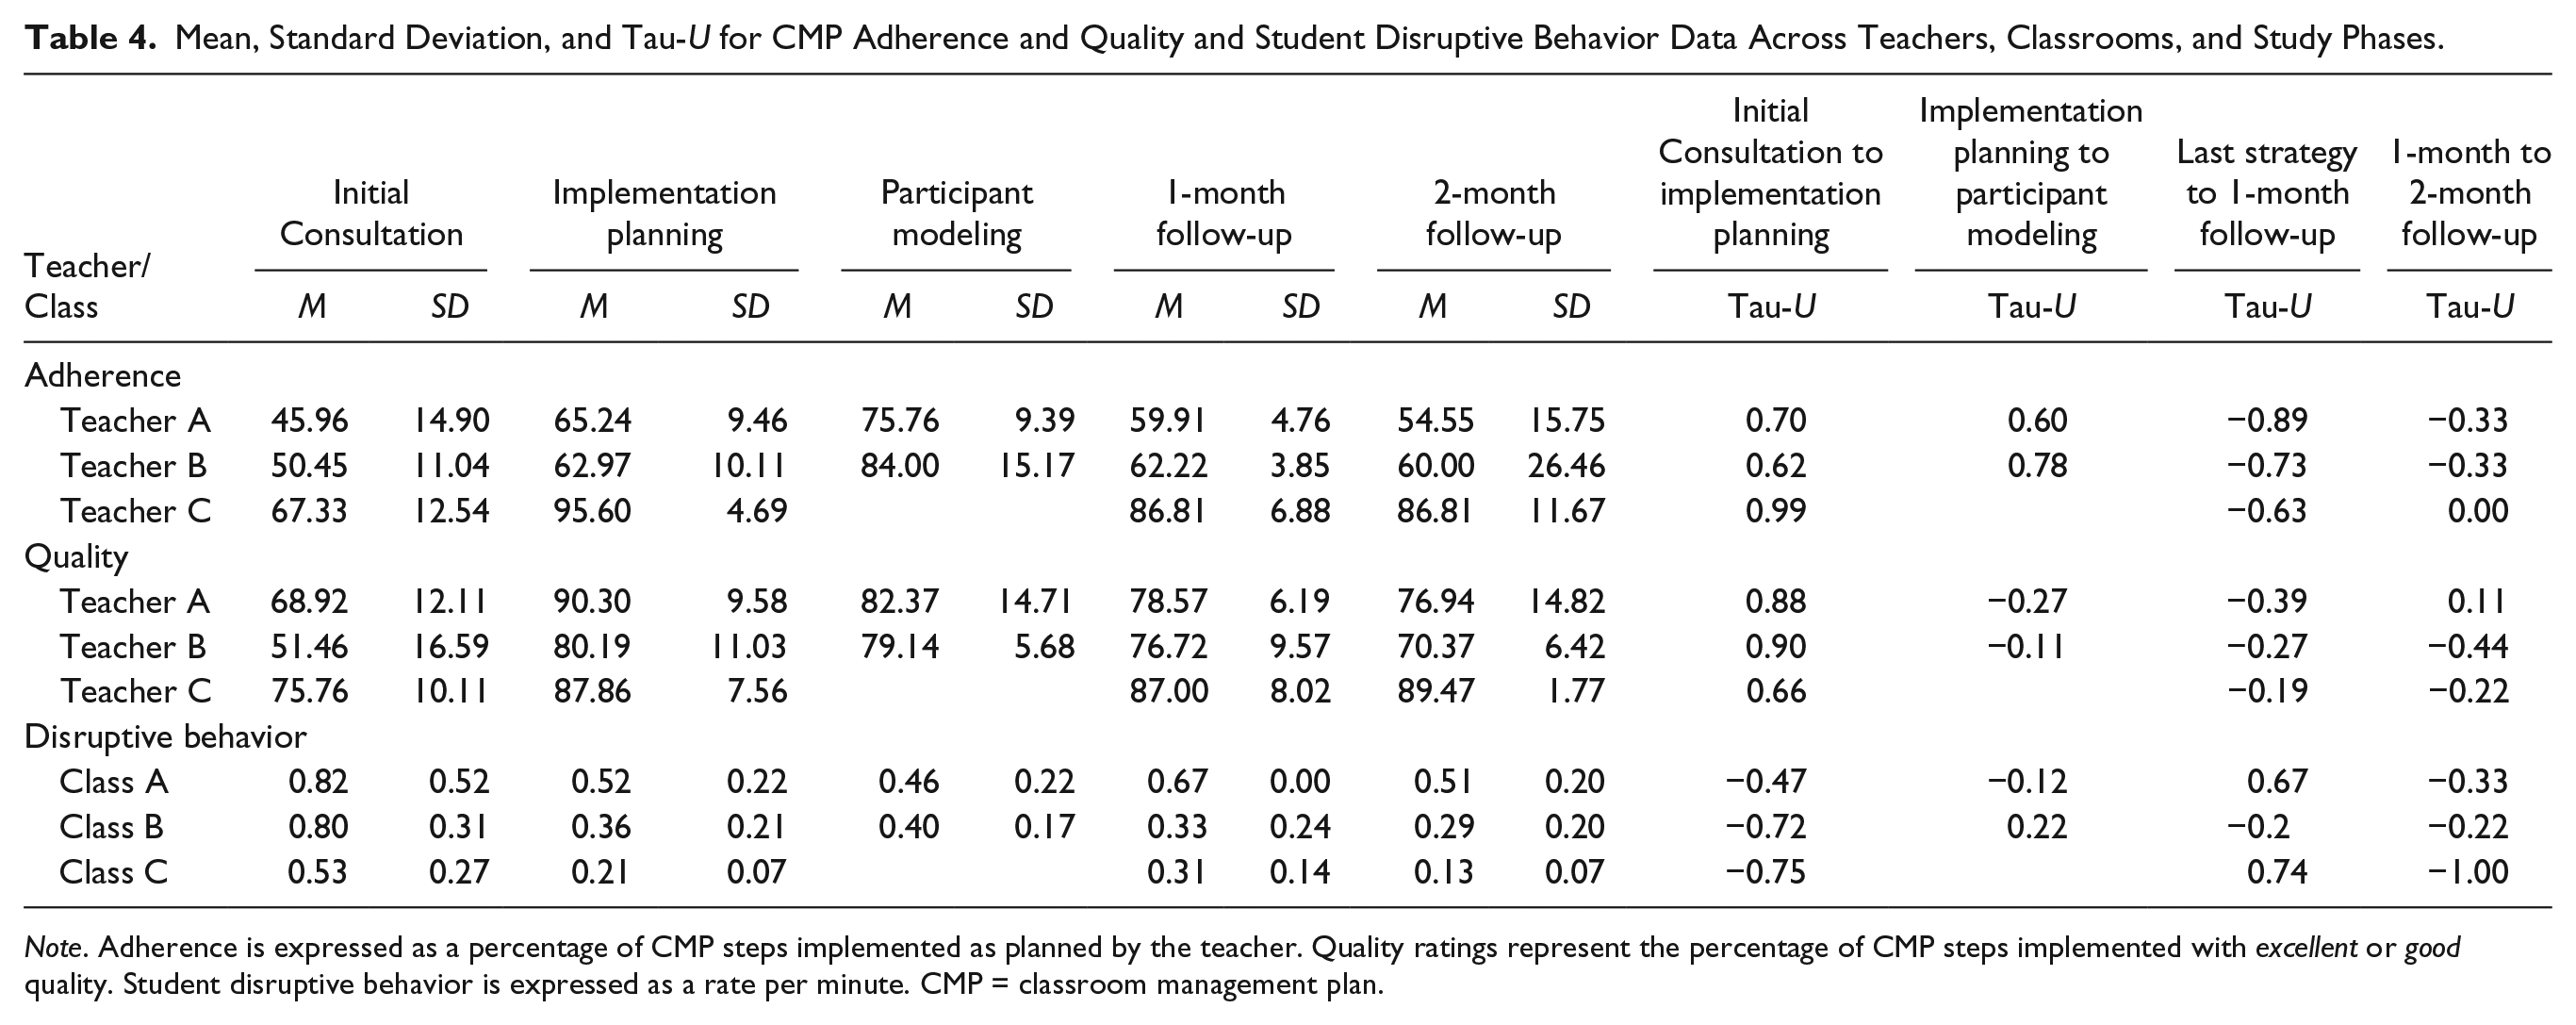
Note. Adherence is expressed as a percentage of CMP steps implemented as planned by the teacher. Quality ratings represent the percentage of CMP steps implemented with excellent or good quality. Student disruptive behavior is expressed as a rate per minute. CMP = classroom management plan.
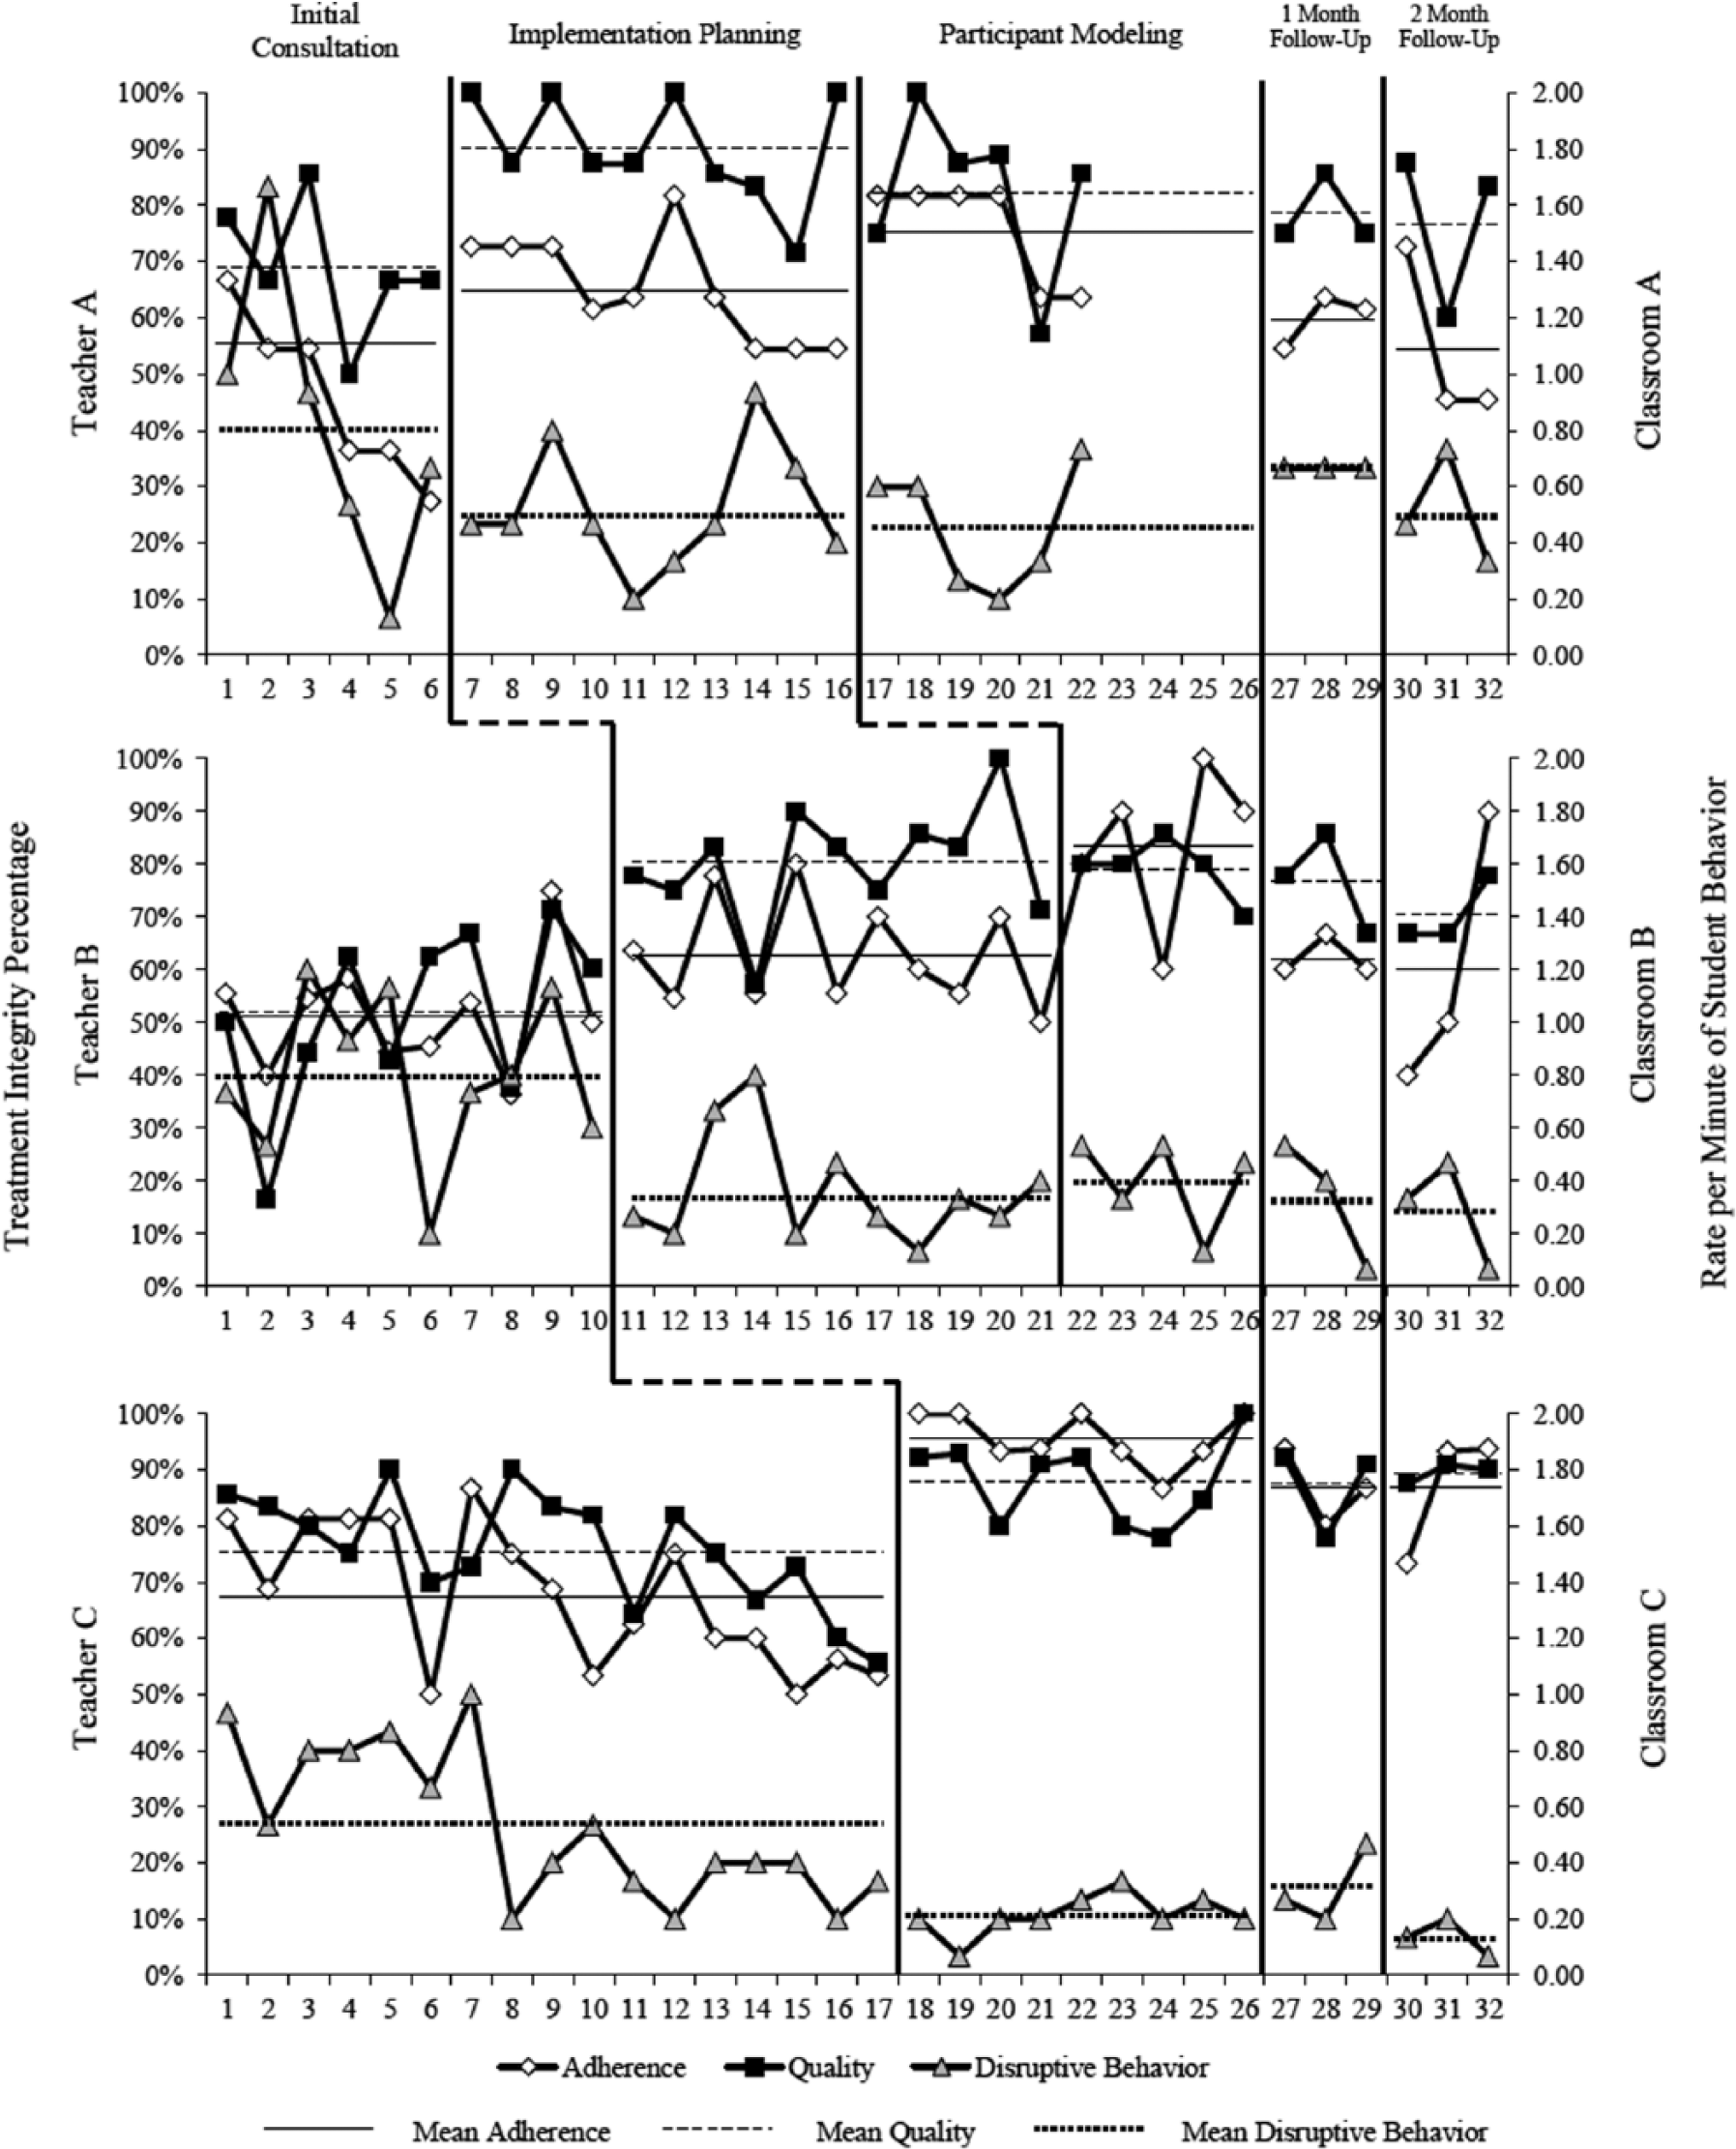
Percentage of CMP steps with adherence ratings of implemented as planned and quality ratings of excellent or good, and student disruptive behavior as rate per minute across sessions.
Quality
All teachers’ CMP implementation quality was variable prior to implementation planning; Teacher C’s quality was marked by a decreasing trend. After implementation planning, all teachers demonstrated a distinct and immediate level change, with high levels of quality and decreased variability. Per Tau-U, the impact on quality was moderate for Teachers A, B, and C (see Table 4). Teacher C’s high CMP implementation quality maintained to the Follow-Up phase (see Figure 1 and Table 4).
Effect of Participant Modeling on Implementation Adherence and Quality
Adherence
After participant modeling, Teachers A and B demonstrated moderate-to-high levels of adherence (Teacher C did not receive participant modeling). Per Tau-U, the impact of participant modeling on adherence was weak for Teacher A and moderate for Teacher B. Both teachers demonstrated decreased adherence during the 1- and 2-month Follow-Up phases but adherence remained higher than during the Initial Consultation phase, prior to implementation planning. Of note, the adherence levels of Teachers A and B decreased more substantially than those of Teacher C, whose adherence could still be considered adequate during the Follow-Up phase (see Figure 1 and Table 4).
Quality
After participant modeling, Teacher A’s quality decreased slightly and became more variable while Teacher B’s quality remained largely consistent and high. Per Tau-U, the impact of participant modeling on quality was weak for both teachers (see Table 4). CMP quality for both teachers remained high during the Follow-Up phase (see Figure 1 and Table 4).
Changes in Disruptive Behavior as Implementation Adherence and Quality Improve
During the Preimplementation phase, students in each classroom demonstrated high rates of disruptive behavior (see Table 3). During the Initial Consultation phase, when the CMPs were introduced and implemented with a moderate level of adherence, disruptive behavior remained at a high rate for Teachers A and B, but decreased for Teacher C. Following implementation planning, when all teachers’ CMP implementation increased, disruptive behavior decreased for all three teachers; per Tau-U, the impact on disruptive behavior was weak for Teacher A, and moderate for Teachers B and C (see Table 4).
The effect of participant modeling on disruptive behavior was less consistent as the disruptive behavior in Teacher A’s classroom decreased slightly and the disruptive behavior in Teacher B’s classroom increased slightly. Per Tau-U, the impact of participant modeling on disruptive behavior was weak for Teachers A and B. Low disruptive behavior rates were maintained during the Follow-Up phase for all teachers (see Figure 1 and Table 4).
Teacher Ratings of Social Validity
Overall, social validity data were highly positive (see Table 5). The URP-IR ratings indicate teachers found the CMP to be highly acceptable (M = 5.37, SD = 0.49), understandable (M = 5.22, SD = 0.44), feasible (M = 5.00, SD = 0.49), and compatible with their system’s climate (M = 5.20, SD = 0.41). Teachers’ ratings also indicate they could implement the CMP without additional system support (M = 2.89, SD = 1.76).
Social Validity Data Across Teachers.
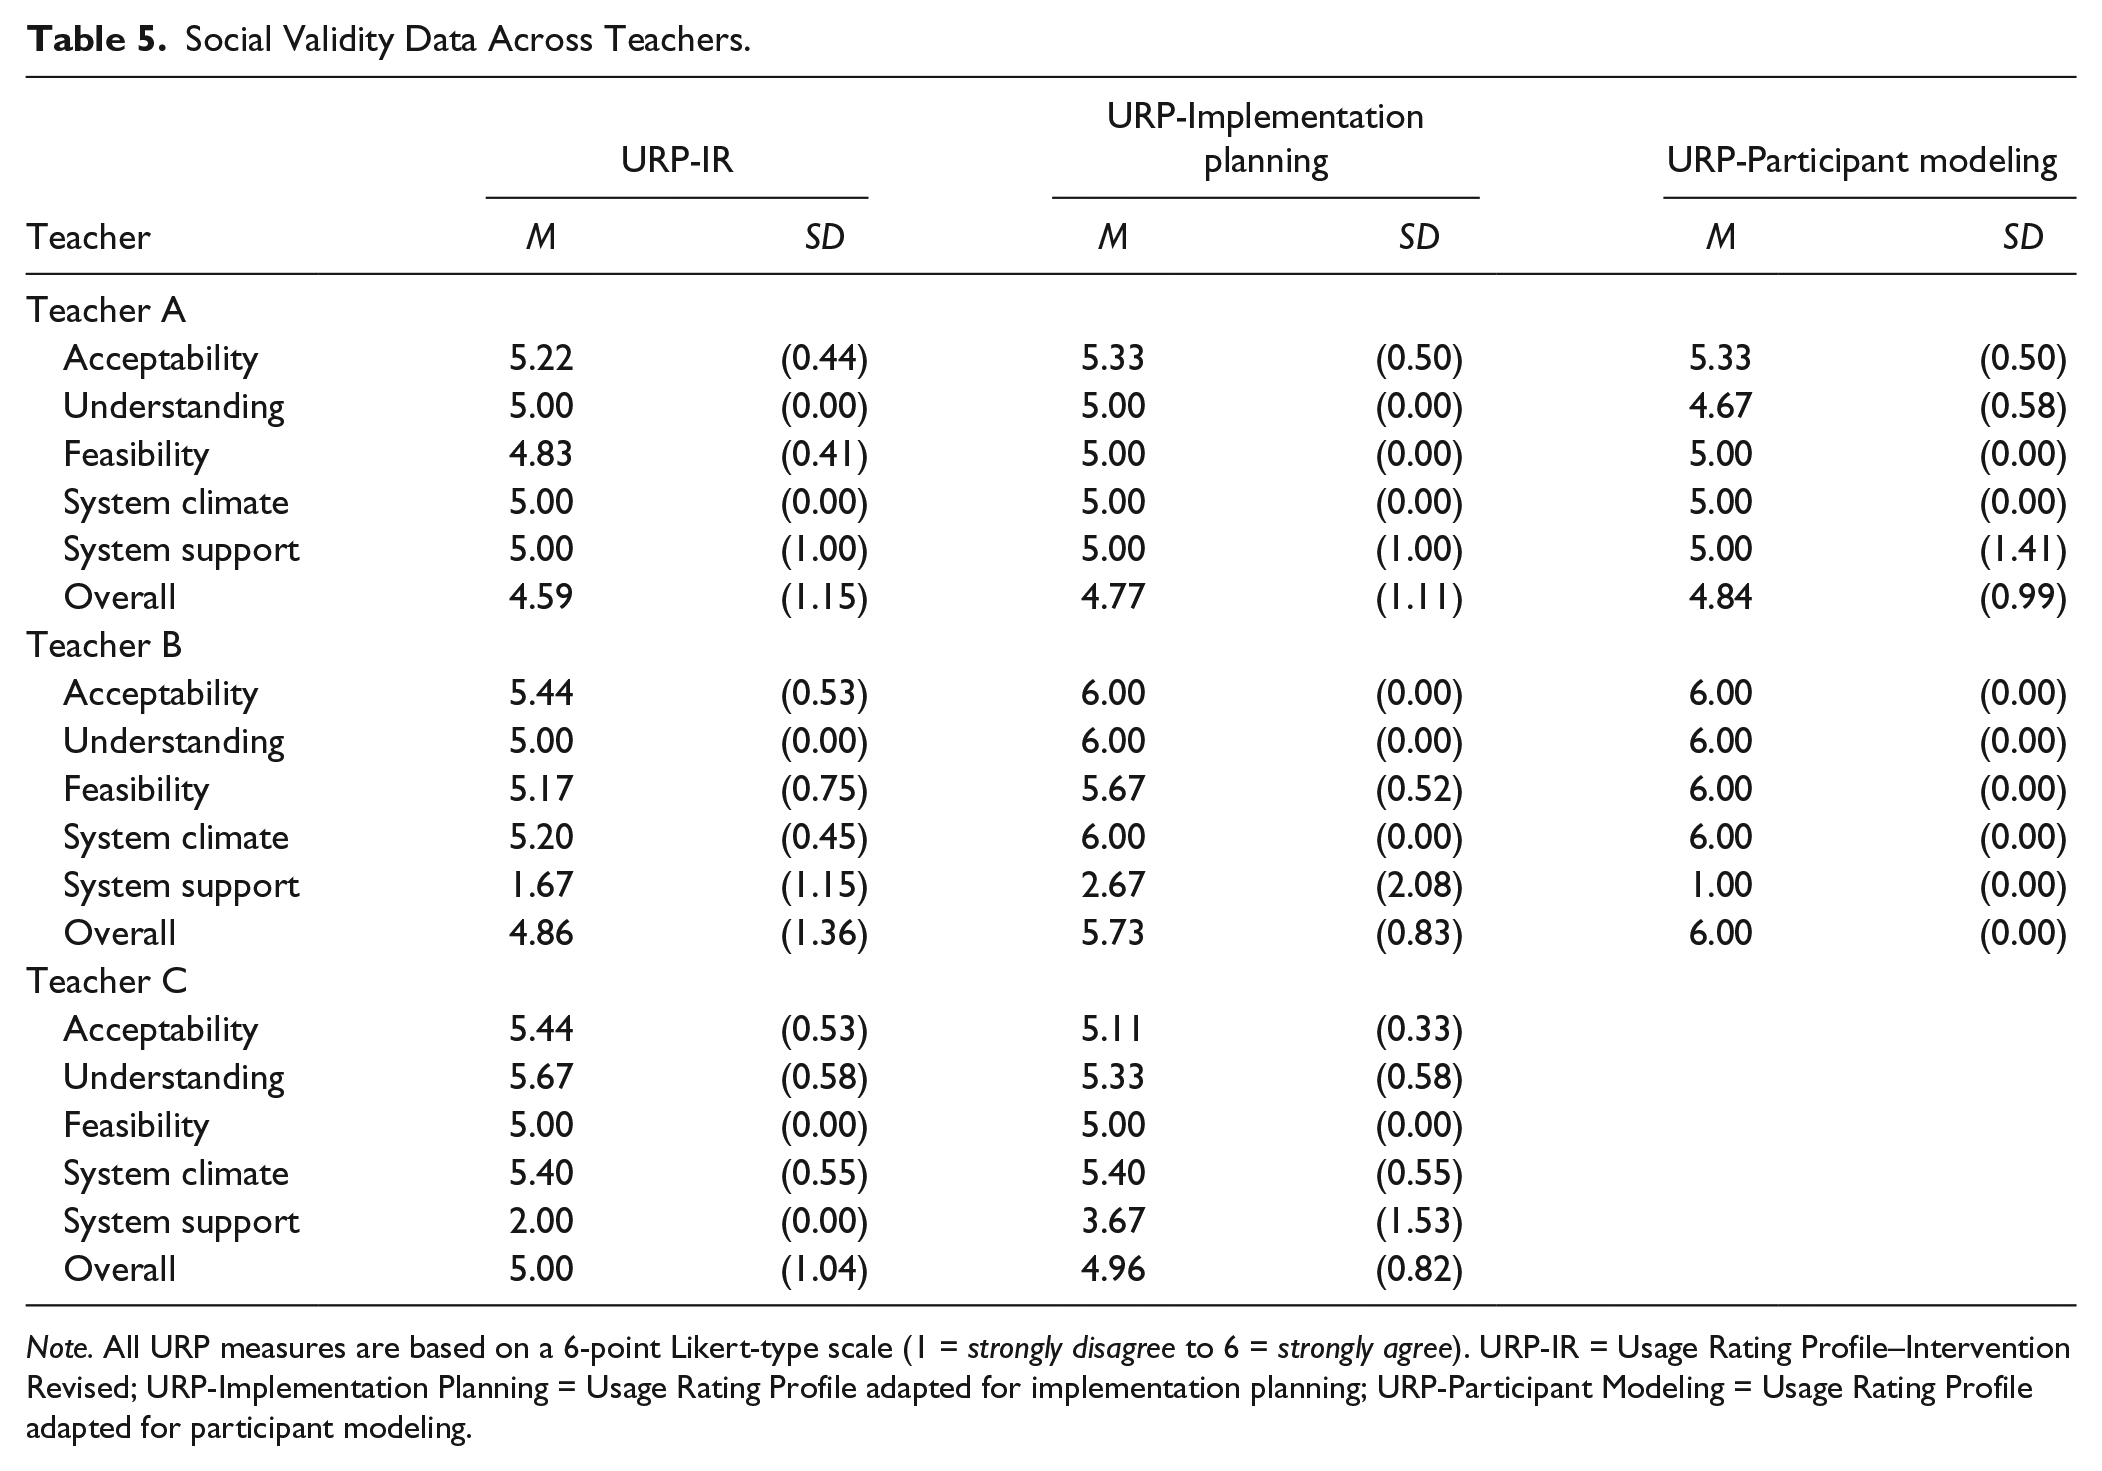
Note. All URP measures are based on a 6-point Likert-type scale (1 = strongly disagree to 6 = strongly agree). URP-IR = Usage Rating Profile–Intervention Revised; URP-Implementation Planning = Usage Rating Profile adapted for implementation planning; URP-Participant Modeling = Usage Rating Profile adapted for participant modeling.
The URP-Implementation Planning ratings indicate teachers found implementation planning to be highly acceptable (M = 5.48, SD = 0.51), understandable (M = 5.44, SD = 0.53), feasible (M = 5.22, SD = 0.43), and compatible with their system’s climate (M = 5.47, SD = 0.52). Teachers’ ratings also indicate they would require additional system support to carry out implementation planning activities (M = 3.78, SD = 1.72).
The URP-Participant Modeling ratings indicate teachers found participant modeling to be highly acceptable (M = 5.67, SD = 0.49), understandable (M = 5.33, SD = 0.82), feasible (M = 5.50, SD = 0.52), and compatible with their system’s climate (M = 5.50, SD = 0.53). Teachers’ ratings also indicate they would not require additional system support to engage in participant modeling (M = 3.00, SD = 2.45).
Discussion
The primary purpose of this study was to extend the literature on implementation planning and participant modeling delivered during behavioral consultation by evaluating their effectiveness to improve teachers’ implementation adherence and quality of evidence-based CMPs over time. Consistent with previous surveys, all teacher participants were implementing few best practices in classroom management and recognized classroom management as a challenge (Reinke, Stormont, et al., 2011). Also consistent with previous research (Sanetti & Collier-Meek, 2015), study results indicate that after assisting teachers to develop evidence-based CMPs, consultants need to provide teacher consultees implementation support to achieve adequate implementation adherence and quality. All teachers demonstrated low CMP adherence levels during the Initial Consultation phase, and improved adherence and quality immediately after implementation planning, similar to previous research (Sanetti & Collier-Meek, 2015; Sanetti, Collier-Meek, Long, Byron, & Kratochwill, 2015). Quality was high across teachers after implementation planning, consistent with previous research (Sanetti et al., 2015). Adherence levels improved, but were only moderate for Teachers A and B, supporting previous findings that teachers need different levels of implementation support (Sanetti & Collier-Meek, 2015).
Upon receiving participant modeling, a more intensive level of implementation support, Teachers A and B demonstrated increased adherence levels; however, their quality of implementation decreased. These results suggest that implementation may be conceptualized within the instructional hierarchy (Haring, Lovitt, Eaton, & Hansen, 1978). That is, teachers increased their implementation of CMP steps with which they were fluent following implementation planning, resulting in moderate adherence but high quality. After participant modeling, they implemented additional CMP steps that they were still acquiring, resulting in higher adherence, but lower quality ratings as they were still developing accuracy and fluency.
Just as teachers’ immediate response to implementation support was variable, so was their response over time. Teacher A’s and Teacher B’s implementation adherence and quality decreased to moderate levels without consultation support over 2 months, but were still above Initial Consultation phase levels. Teacher C’s implementation adherence and quality decreased slightly, but were maintained at high levels without consultation support over 2 months. These results are similar to previous research (Sanetti & Collier-Meek, 2015; Sanetti et al., 2015) and suggest teachers need different schedules of implementation support to maintain improvements.
Identifying the level of implementation support a teacher needs is essential to achieving the end goal of an intervention resulting in improved student outcomes. Data from this study provide initial evidence that we may not be able to identify the level of implementation support a teacher will need from baseline data alone. For example, prior to CMP development, Teacher C had the lowest percentage of classroom management strategies that were maintained in her CMP, which might lead one to think that she would need more intensive support than Teacher B, who had the highest percentage of strategies maintained in her CMP. Yet, Teacher C’s initial adherence to the comprehensive CMP was considerably higher than Teachers A or B. It is possible that Teacher C’s high rate of CMP adherence was influenced by (a) her only having new strategies in two areas of classroom management; (b) her generally higher preimplementation ratings of knowledge, implementation, and use of classroom management practices; (c) her dual certification in general education and special education; (d) her years of experience; or (e) a combination of the above. Additional research is needed to gain a better understanding of what measureable factors are predictive of short- and long-term implementation fidelity.
The goal of increasing teachers’ implementation of any intervention is to improve student outcomes. Replicating previous findings (Sanetti & Collier-Meek, 2015), student disruptive behavior improved from the Initial Consultation phase to the Implementation Planning phase, across all classrooms, with disruptive behavior rates reduced by more than half for Classrooms B and C. Average student disruptive behavior in Classroom A improved further after participant modeling, but there was a slight increase in average disruptive behavior in Classroom B. Perhaps as important as the average levels across phases, the variability in student disruptive behavior decreased in all classrooms following implementation planning, with the lowest average variability during the Follow-Up phase. Thus, results suggest student disruptive behavior decreases and is more stable as implementation of evidence-based classroom management strategies improves.
Regardless of their effectiveness, implementation supports are not likely to be utilized unless they are feasible and acceptable. Similar to previous research (Sanetti & Collier-Meek, 2015), current results suggest implementation planning and participant modeling are relatively time-efficient. Delivering implementation planning (M = 59 min; range: 50–65 min) and participant modeling (M = 28 min for didactic portion, range: 13–42 min; M = 53 min for in-class modeling, range: 45–60 min) requires a relatively minimal amount of time for the increased and maintained CMP implementation and decreased disruptive behavior. As important, overall, teachers rated the CMPs and both implementation strategies as acceptable, understandable, feasible, and aligned with their school climate. Teacher A indicated that the CMP and both implementation strategies would require additional system support. As this subscale is reverse-coded, it is unclear if her ratings reflect a belief that supports are required or careless responding.
Limitations and Future Directions for Research
There are several limitations to this study. First, the Initial Consultation phase always preceded implementation planning, which always preceded participant modeling, creating an order effect. Furthermore, it is unclear whether implementation planning alone would improve teachers’ implementation, or whether it must be delivered in the context of consultation. Likewise, it is unclear if participant modeling would improve teachers’ implementation if presented alone or prior to implementation planning. The rationale for standardizing the order of implementation supports was to keep the research contextualized within the usual scope of practice in behavioral consultation and recommendations related to data-based intensification of implementation supports (Sanetti & Collier-Meek, 2015). Future researchers should vary implementation support order within and outside of a consultation approach.
Second, teachers needed support in different numbers of classroom management areas, and there were differences in baseline knowledge, implementation, and use of classroom management practices. Future researchers could try to ensure exact equivalency of teachers’ implementation needs and stages of learning at baseline. This study’s methods, however, allowed evaluation of implementation planning and participant modeling effectiveness with (a) the natural variability in teacher knowledge and skills and (b) CMPs aligned with best practices. Third, as with many intervention studies, participating teachers volunteered to be involved in this study and, thus, may not represent the broader population of teachers who require classroom management support. More specifically, the teachers volunteered for the research and, therefore, may have been more “highly motivated” than those who did not volunteer. Thus, Initial Consultation phase adherence data are particularly concerning as we might hypothesize that less motivated teachers would have poorer outcomes. Fourth, detailed SW-PBIS implementation data were not collected; thus, it is unknown if the differential level of supports needed by teachers were related to SW-PBIS implementation levels. Fifth, research staff served as the consultants. Although typical for early studies, future researchers should evaluate the effectiveness and social validity of educators developing, evaluating, and supporting CMP implementation.
Implications for Practice
Current results emphasize the need for systematic implementation supports to ensure interventions are implemented consistently. Results also suggest teachers need different levels of support, and less time- and resource-intensive implementation supports are sufficient for some teachers. Given the prevalence of time as a barrier (Cochrane & Laux, 2008), delivering implementation supports based on fidelity data may allow practitioners to “work smarter, not harder.” To do so, practitioners may need training in how to deliver implementation supports; available resources allow for self-study (Sanetti & Collier-Meek, 2017). Results also highlight the evaluation utility of collecting both adherence and quality data. These data may be used together to provide more targeted, efficient implementation support. Finally, study results provide further support that for interventions to result in improved student outcomes, they must be adequately implemented. That said, data also suggest meaningful student outcomes may be achieved with what would typically be considered “inadequate” adherence. The lack of empirical guidance regarding the level of implementation necessary to obtain improved student outcomes combined with the current results highlights the importance of analyzing both student outcome and implementation data when making data-based decisions regarding intervention effectiveness.
Footnotes
Authors’ Note
The opinions expressed are those of the authors and do not represent views of the Institute or the U.S. Department of Education.
Declaration of Conflicting Interests
The author(s) declared no potential conflicts of interest with respect to the research, authorship, and/or publication of this article.
Funding
The author(s) disclosed receipt of the following financial support for the research, authorship, and/or publication of this article: Research reported here was supported by the Institute of Education Sciences, U.S. Department of Education, through Grant R324A10005 to the University of Connecticut.