



Abstract
To determine the impact of a longer-than-average compressed workweek on police officers’ sleep, cognitive abilities, health, quality of life, and work performance, two precincts of the Phoenix Police Department participated in a 9-month, repeated-measures study. The experimental precinct worked three consecutive 13-hr 20-min (13:20-hr) shifts per week for 6 months, while the control precinct worked four 10-hr shifts per week. Officers were assessed using the Pittsburgh Sleep Quality Index, Psychomotor Vigilance Test, STROOP Color-Word test, Quality of Life Inventory, and measures of salivary cortisol. The Phoenix Police Department provided data for Professional Standards Bureau complaints, shooting qualifications, vehicular accidents, self-initiated calls, adult bookings, field interrogations, overtime, and time off for the 6 months of the study period and the same 6 months of the previous year. Self-reported caffeine intake and shift preference were also collected. Officers working 13:20-hr shifts experienced significant (p < .05) decreases in hours of sleep, overall quality of sleep, concentration, cognitive processing, and quality of life (overall and in six of eight subareas). Significant (p < .05) increases were observed in fatigue, daytime dysfunction due to sleepiness, reaction time, anticipatory errors, and Professional Standards Bureau complaints. There were no significant differences in most indices of work performance or differences due to working day or night shifts. When officers working 13:20-hr shifts returned to 10-hr shifts, all variables returned to baseline (prestudy) levels. Officers from both precincts overwhelmingly preferred 10-hr shifts. This study indicates that there are no apparent advantages but considerable liabilities associated with 13:20-hr shifts for police officers.
Keywords
Introduction
Law enforcement officers perform essential, high-profile services that require the capacity for high-level functioning and sound decision making (Barger, Lockley, Rajaratnam, & Landrigan, 2009). Law enforcement administrators have sought creative ways to provide necessary, quality services to their communities in the most cost-effective manner. Toward that end, administrators have contemplated extending officer shift lengths from 8 hr to 10, 12, and even 13 hr (O'Neill & Cushing, 1991). However, studies from several professions such as health care (Josten, Ng-A-Tham, & Thierry, 2003; Lockley et al., 2007; Scott et al., 2007), power plant operators (Mitchell & Williamson, 2000), and long-haul pilots (Rosekind et al., 1994) show that with extended shift length come increased fatigue and safety concerns. Since the early 1990s, studies have investigated the effects of compressed workweeks (CWWs) on law enforcement officer's health, sleep, cognitive function, and work satisfaction. CWWs exist when fewer but longer days are worked during a week. The most common CWWs are four 10-hr days per week or three 12-hr days with an additional 4-hr shift at some point in the workweek. Amendola, Slipka, Hamilton, Soelberg, and Koval (2011a) reported that officers prefer the four 10-hr shifts per workweek and that there is a national trend away from traditional 8-hr shifts (Amendola, Weisburd, Hamilton, Jones, & Slipka, 2011c) toward extended 10-hr and 12-hr shifts. There is evidence (Amendola, Weisburd, Hamilton, Jones, & Slipka, 2011b, 2011d) that increasing the number of hours worked by police officers from 8-hr to 10-hr shifts has a positive outcome in regard to quality of work life and hours of sleep per night for officers. However, these benefits were not further increased when officers worked 12-hr shifts.
Some police departments work 13-hr shifts. However, the effects of working shifts longer than 12-hr have not been systematically studied in law enforcement officers. It is unclear whether working longer shifts and increasing the number of days off per week (e.g., 4 days off per week) would have a beneficial or detrimental effect on health, quality of life (QoL), and performance of officers.
The Phoenix Police Department (PPD; AZ) is the 14th largest police department (N = 3,388 sworn officers) in the nation (Reaves, 2008) in the sixth largest city (United States Census, 2010). Since 1981, officers in the PPD worked a CWW of four 10-hr consecutive shifts (10-hr shift; M. J. Nikolin, personal communication, Phoenix Police Museum, July 13, 2013). In response to union requests in 2011, the PPD initiated a study to investigate the effects of officers working three consecutive shifts of 13-hr 20-min per week (i.e., a 40-hr workweek divided into 3 workdays; 13:20-hr shift). A 6-month trial of the 13:20-hr CWW was instituted to study the effects (i.e., risks and benefits) of this novel shift on officer sleep, cognitive function, health, QoL, and performance.
Based on existing literature with police officers as well as other professions, it was hypothesized that working a CWW consisting of three consecutive 13-hr 20-min shifts per week would have a negative effect on sleep, alertness, cognitive processing, quality of work life, and work performance when compared with four 10-hr shifts per week in police officers.
Methods
The PPD has eight precincts. For the purposes of this study, a quasi-experimental, repeated-measures study design was developed. It was quasi-experimental in that of the eight precincts in the PPD, the participating precincts were not randomly selected. Rather, the participating precincts were selected because they were of similar size, had similar officer demographics and crime rates, and shared a common border.
Timetable for Data Collection From Police Officers Working 10-hr and 13:20-hr Shifts.
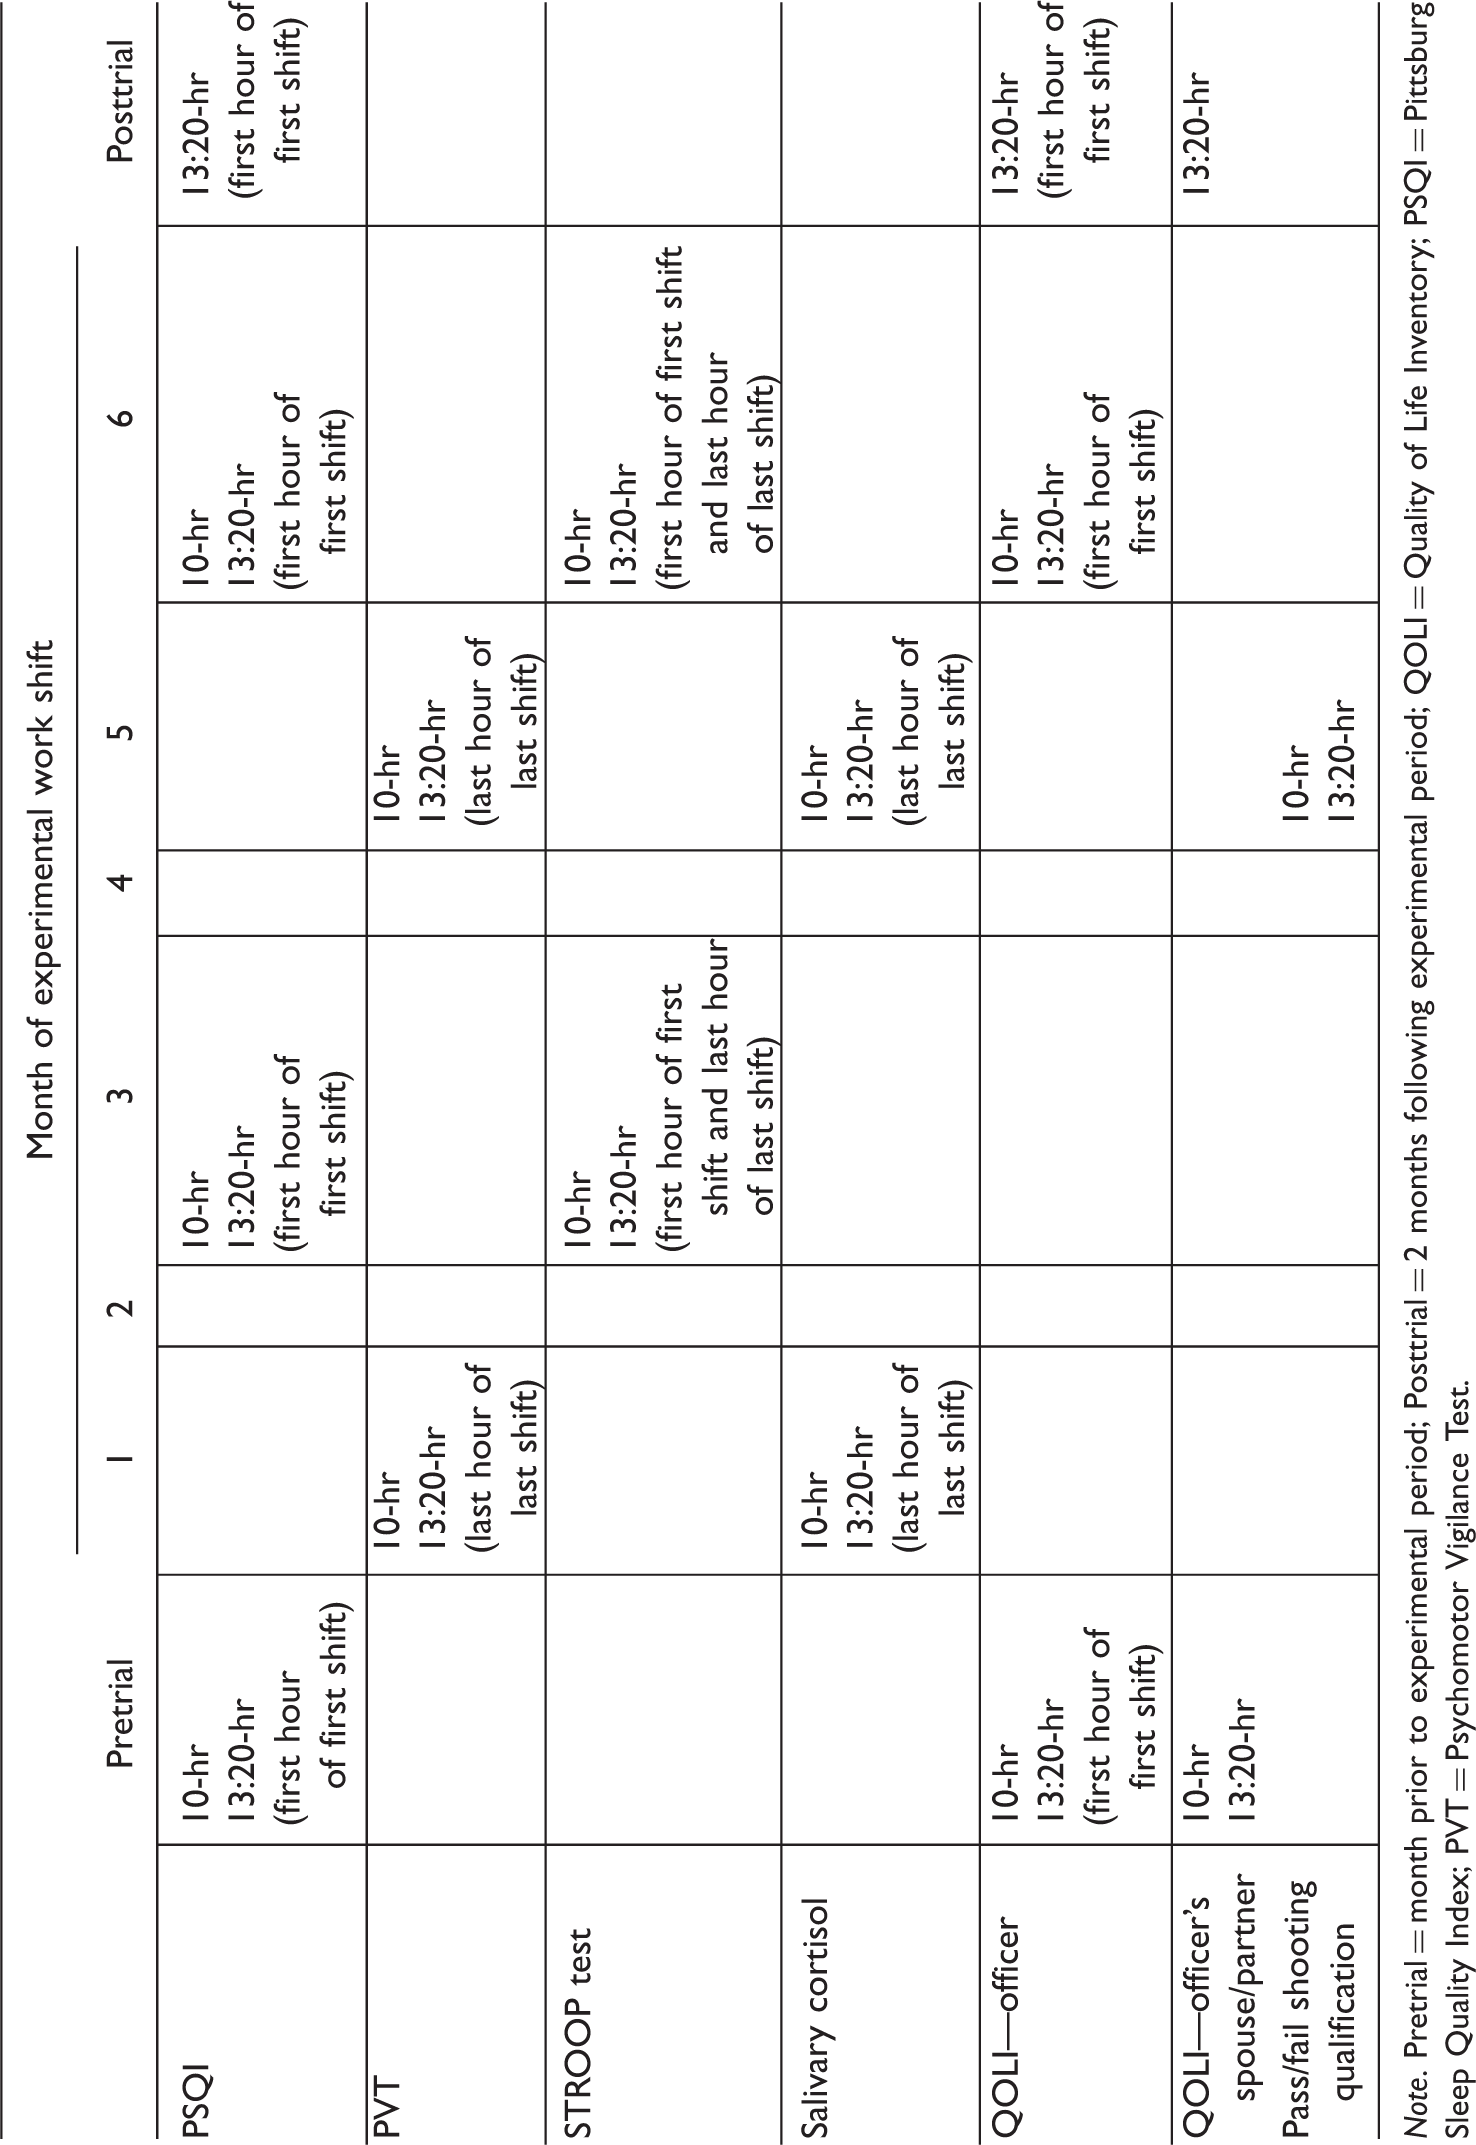
Note. Pretrial = month prior to experimental period; Posttrial = 2 months following experimental period; QOLI = Quality of Life Inventory; PSQI = Pittsburg Sleep Quality Index; PVT = Psychomotor Vigilance Test.
The following areas were assessed:
Sleep Quality and Daytime Dysfunction Due to Fatigue
Hours of sleep per night, time to get to sleep (i.e., sleep latency), subjective sleep quality (i.e., “very good,” “fairly good,” “fairly bad,” or “very bad”), habitual sleep efficiency (i.e., total time asleep/time spent in bed), sleep disturbances (i.e., having trouble sleeping due to waking in the middle of the night, having to use the bathroom, coughing, snoring or having difficulty breathing, feeling too hot or cold, having bad dreams, or being in pain), frequency of taking medications to fall asleep, and daytime dysfunction due to sleepiness (i.e., having trouble staying awake while driving, eating, or during social engagements or having enthusiasm to get things done) were measured using the Pittsburgh Sleep Quality Index (PSQI). The PSQI is an established, 19-item, self-report inventory of sleep quality (Buysse, Reynolds, Monk, Berma, & Kupfer, 1989). The 19 items are grouped into seven, equally weighted component scores that are summed to yield a global PSQI score between 0 and 21. The higher the global score, the worse the quality of sleep. Buysse et al. (1989) demonstrated that the PSQI has a high degree of internal reliability (Cronbach's alpha = .83) as well as sensitivity (89.6%) and specificity (86.5%) in distinguishing between clinically different groups. The PSQI reflects measures of sleep for the entire month prior to taking the inventory, thus eliminating short-term modulations in sleep (Buysse et al., 1989). Officers in the control, 10-hr precinct completed the survey in December (baseline prior to the 6-month trial) and in Months 3 and 6 of the 6-month trial. Officers in the experimental, 13:20-hr precinct completed the survey in December (baseline prior to the 6-month trial), in Months 3 and 6 of the 6-month trial period, and in August (posttrial, 2 months after returning to 10-hr shifts). All PSQI surveys were completed during the officer's briefing prior to the officer's first workday of the week. The survey took about 10 min to complete.
Attention and Reaction Time
Reaction time and attention/vigilance was determined using the computerized Psychomotor Vigilance Test (PVT; Dinges & Powell, 1985). The PVT objectively assesses fatigue-related changes in alertness associated with sleep loss, extended wakefulness, circadian misalignment, and time on tasks (Basner, Millicone, & Dinges, 2011; Loh, Lamond, Dorrian, Roach, & Dawson, 2004) with test-retest reliability above 80% (Dorrian, Rogers, Dinges, & Kushida, 2005). The PVT comes in 10-min and 3-min versions. The 3-min version was used in the present study to minimize interference with officer's work. Prior to taking the PVT, officers read instructions on a computer screen describing the test. They were instructed to focus on an empty rectangle in the middle of the computer screen. At random intervals, numbers appear in the rectangle. They were instructed that once the numbers appear, they were to hit the space bar as quickly as possible. The numbers count up in milliseconds. Hitting the spacebar stops the count and reveals the number of milliseconds it took to respond to the stimulus (i.e., reaction time). Anticipating the appearance of the numbers and hitting the spacebar before the numbers appear is considered an “anticipatory error.” Not responding within 500 ms to the stimulus is considered a lapse in concentration. Officers in both the 10-hr control and 13:20-hr experimental precincts completed the PVT in Months 1 and 5 of the 6-month trial. The 3-min long PVT was administered during the last hour of the officer's last shift of their workweek when they were expected to be the most tired (i.e., the last hour of the fourth shift for the 10-hr precinct and the last hour of the third shift for the 13:20-hr precinct). The PVT is not affected by practice effects (Dorrian et al., 2003).
Cognitive Processing, Concentration, Attention, and Fatigue
Cognitive performance and fatigue were measured using the STROOP Color-Word test (adult version; Golden & Freshwater, 2002). The test consists of three parts. During the first part, the subject reads from a “Word Page” that consists of words written in black ink. The words are colors: “BLUE,” “RED,” and “GREEN.” The second part (“Color Page”) consists of semantically meaningless symbols “XXXX” printed in colored ink (e.g., blue, red, and green ink). The third part (“Color-Word Page”) consists of the same words from the first page, but they are printed in ink colors that do not match the color of the printed word. The subject is instructed to indicate the color of the word, not the word itself. Franzen, Tishelman, Sharp, and Friedman (1987) showed that the STROOP Color-Word test has a high reliability coefficient for a single (.55–.92) and multiple (.67–.83) administrations with negligible practice effects. Each officer was given 45 s to read as many words (or colors) as possible from each page. Officers in both the 10-hr control and 13:20-hr experimental precincts completed the STROOP test in Months 3 and 6 of the 6-month trial. The STROOP test was administered during the first hour of the officer's first shift of the week and the last hour of the officer's last shift of their workweek when they were expected to be the most tired.
Physiological Stress Levels
Salivary cortisol levels accurately reflect the levels of unbound plasma cortisol (Kirschbaum & Hellhammer, 1989, 1994), show diurnal changes in cortisol (Wirth et al., 2011), and reflect changes in stress due to physiological and psychological stress (Kirschbaum & Hellhammer, 1994; Lippi et al., 2009). Physiological levels of stress in officers were measured by a determination of cortisol in their saliva during the last hour of the officer's last shift of their workweek in Months 1 and 5 of the 6-month trial. Officers were asked to avoid a major meal within 1 hr of the sampling period. Prior to collection, officers thoroughly rinsed their mouths with water. Officers placed a cotton swab under their tongues for at least 3 min while taking the computerized PVT. The saliva-soaked swab was put in a labeled plastic vial and placed on ice. Samples were stored in a −80℃ freezer within 2 hr of sampling and kept there until shipped on dry ice to Salimetrics (State College, PA) for analysis. Sensitivity of the cortisol assay is < .003 μg/dl (Salimetrics).
Caffeine Intake
The amount of caffeine consumed by officers during their workweek was measured using a brief survey administered in Month 6 of the 6-month trial period. Officers from both precincts were asked to self-report the average number of caffeinated beverages (coffee or tea, caffeinated soft drinks, or energy drinks) they consumed in an average workday during their 3- or 4-day workweek. Energy drinks were indicated as beverages with high caffeine content “such as “Red Bull,” “Monster,” “Rock Star,” “5-hour Energy,” etc.”
QoL Measures
The QoL in PPD officers was measured using the Quality of Life Inventory (QOLI; Frisch, Cornell, Villanueva, & Retzlaff, 1992; NCS Pearson, Inc., Minneapolis, MN). The self-report QOLI measures how important 16 areas of life are to the happiness of an individual and asks him or her to rate his or her personal satisfaction in each of those areas. The QOLI has 80% to 91% test-retest reliability (Frisch et al., 1992). For statistical purposes, eight of the 16 areas most relevant to police officers were chosen for analysis: health, work, play, helping, love, friends, children, and home. Officers in the 10-hr (control) precinct completed the survey in December (baseline) prior to the 6-month trial and in the 6th month of the trial. Officers in the 13:20-hr (experimental) precinct completed the survey in December (baseline), in the 6th month of the trial period, and in August (posttrial, 2 months after the trial period). All QOLI surveys were completed during the briefing prior to the officer's first shift of the week. The survey took 10 to15 min to complete.
Work Performance and Safety Measures
Decision making
During the last 3 months of the 6-month trial, officers from both the 10-hr control and 13:20-hr experimental precincts participated in their annual pass/fail shooting qualification. Summary pass/fail data from the qualifications for the test period were reported by the PPD to study investigators in aggregate form. Unfortunately, the investigators could not control when the shooting qualifications occurred (i.e., time of day or workday vs. day off). Therefore, it was not possible to compare day versus night shifts or correlate individual results to any other study variables. Aggregate data of shooting qualifications for the same two precincts were also provided for the same 6-month period as the trial for the previous year (when all officers were working 10-hr shifts) to allow year-to-year comparisons.
Professional Standards Bureau complaints
Citizen complaints to the PPD Professional Standards Bureau (PSB) for both precincts were compiled by the PPD for the period of January through June 2011 (year prior to the current study period) and the same calendar months in 2012 during the 6-month trial period. Results were presented to study investigators in aggregate form. Data included Category I (minor) complaints, Category II (major) complaints, and the number of officers involved in the complaints.
Officer-involved accidents
The number of reportable officer-involved vehicle accidents for the 6-month trial period was provided to study investigators in aggregate form by the PPD for both precincts. The number of vehicle accidents for the same 6-month period of the previous year was also provided for both precincts for year-to-year comparison.
Self-initiated calls, adult bookings, and field interrogations
The PPD requires all officers to report activity related to all stops. Therefore, as a measure of work performance, individual officer data were provided by the PPD for stops related to self-initiated calls, adult bookings, and field interrogations. Self-initiated calls included 511P calls (subject stops initiated by the officer), 511V calls (vehicle stops initiated by the officer), and “other” self-initiated calls (stops in response to unusual activities observed by officer or citizens who stop an officer). Field interrogations involve stops done by officers when no crime has been committed but documentation is meaningful. All data were reported for the 6 months of the study period (2012) for both precincts and for the same 6 calendar months of the prior year (2011) for year-to-year comparison.
Overtime and Time Off
Individual officer data were provided by the PPD for overtime, off-duty work, personal illness time, and vacation time. Overtime included “call out,” “legal witness,” “no code 7” (i.e., no lunch or dinner meal break), “other,” “off-duty meeting,” “pre-briefing,” “range,” “special event,” and “training” hours. In the PPD, officers must report the number of off-duty hours they work. Time off from work was logged as either personal illness time (sick time) or vacation time.
Officer Shift Preference
Officers in both precincts were surveyed for their preference in shift length prior to the 6-month trial period and in Months 3 and 6 of the 6-month trial period. Officers in the 13:20-hr experimental precinct were also surveyed 2 months after returning to four 10-hr shifts per week.
Spouse/Partner Survey of Officer QoL
Prior to the 6-month trial (pretrial) and in the 6th month of the trial period, officers in both precincts were given a postcard and asked to give it to their spouse or partner. The postcard directed the spouses/partners of officers to an online survey where they were asked questions regarding preference for 10-hr or 13:20-hr work shifts, sleep patterns, QoL, and relationships for themselves and their officer spouse/partner.
Informed Consent and Institutional Review Board
This study was approved by the Institutional Review Board of Midwestern University prior to any data collection. An informed consent was developed and presented to all officers in the 10-hr control and 13:20-hr experimental precincts prior to the study. Officers choosing not to participate in the study were exempted from the study. Officers had the freedom to cease involvement at any time during the study without penalty or justification. Informed consent for the spouses/partners of the officers was presented at the beginning of the online survey. Completing the online survey implied their consent to participate.
Analyses
Unpaired t test was used to compare age of the officers and their time on the force. Chi-square analysis was used to compare the 10-hr control and 13:20-hr experimental groups with regard to officer gender, number of children, number of children living in the home, age of youngest child living in the home, ethnicity, and medications used to get to sleep. The p values < .05 were considered to be significant.
Analysis of covariance was utilized to determine significant main effects between conditions with regard to the PSQI and QOLI, with baseline scores as the covariate, total scores and subscales as outcome variables, and shift length as the between-groups factor. STROOP, PVT, and salivary cortisol measures were assessed with between-groups analysis of variance (ANOVA) at each time point administered to determine differences between conditions. Data transformation was utilized to restore normality to skewed data when possible. Square root transformation was attempted first, followed by logarithmic transformation and finally inverse transformation if prior attempts to restore normality failed. Failing restoration through transformation in the PVT mean reaction time measure, five outliers were removed, which restored normality. In cases where transformation was ineffective, a Mann–Whitney U, nonparametric test was utilized. Categorical and frequency variables (e.g., number of accidents and PSB complaints) were assessed via chi-square goodness-of-fit tests.
Multivariate analysis of variance was utilized to determine significant main effects between conditions with regard to PSQI and QOLI, with baseline scores as the covariate, total scores and subscales as outcome variables, and the time of shift (i.e., day vs. night) as the between-group factors.
Effect size is indicated by η2. η2 values of .01 to .05 indicate a small outcome effect. Values between .06 and .13 indicate a medium effect, and values of .14 or larger indicate a large effect.
Results
Participants
Demographic Indices of Officers Participating in the Study.
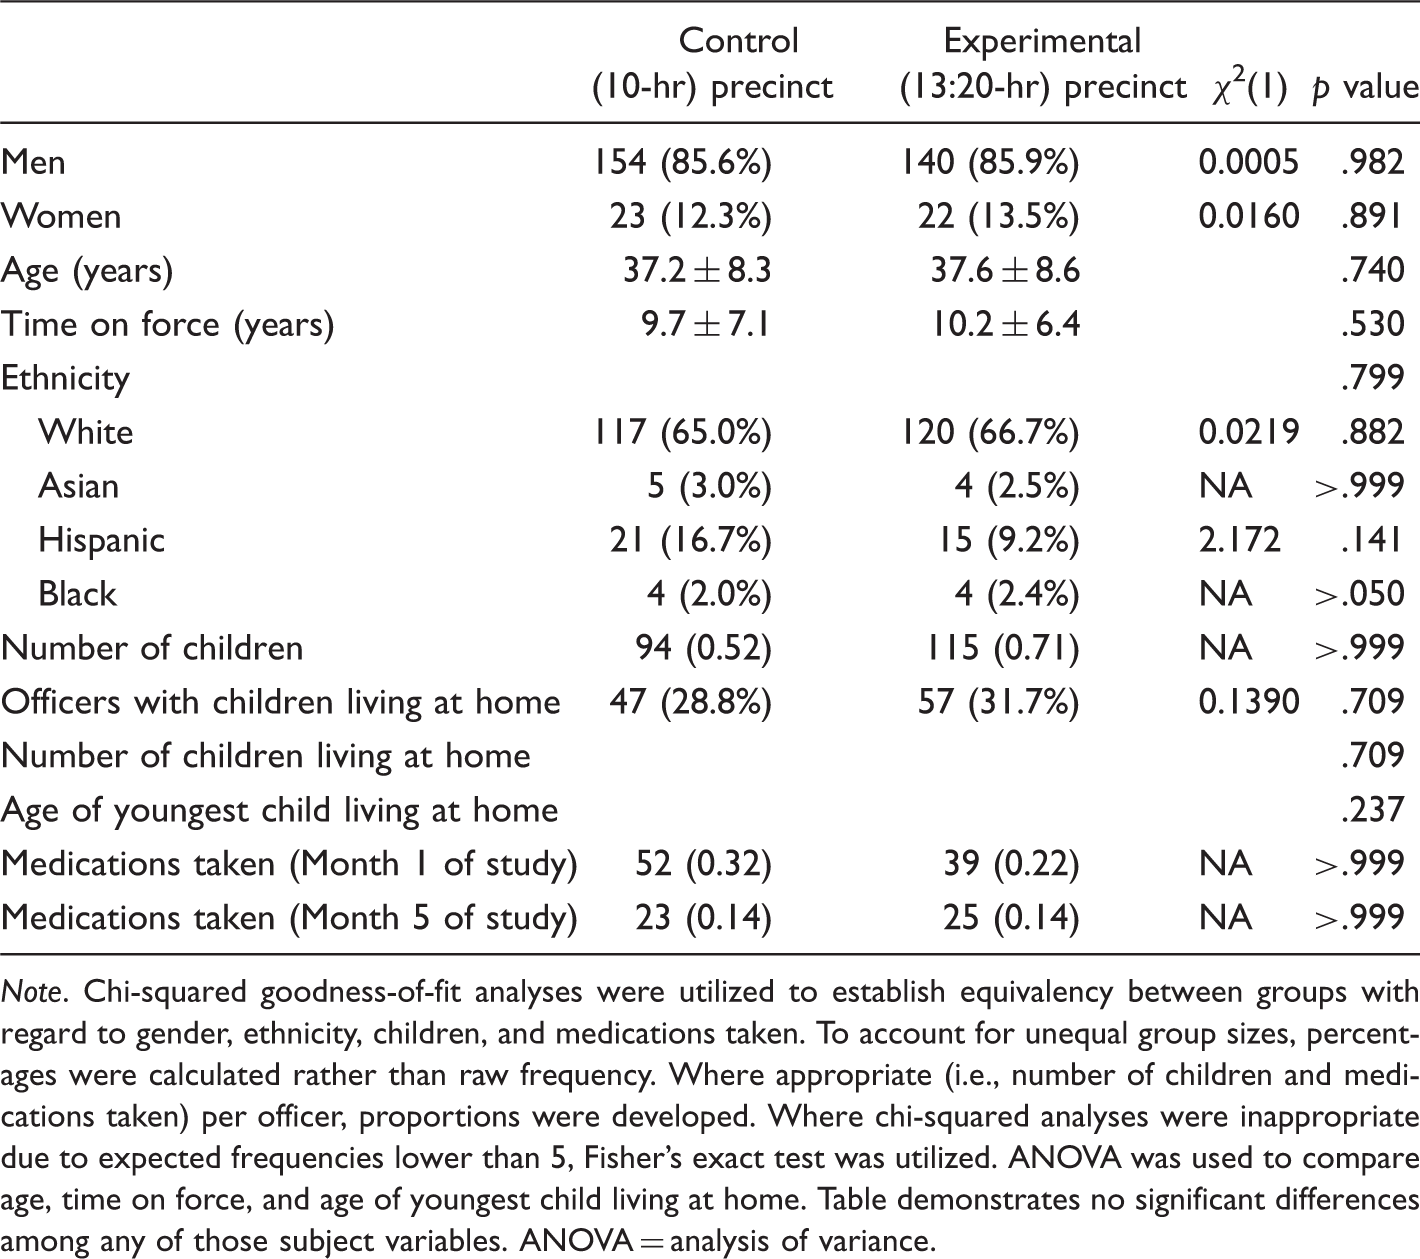
Note. Chi-squared goodness-of-fit analyses were utilized to establish equivalency between groups with regard to gender, ethnicity, children, and medications taken. To account for unequal group sizes, percentages were calculated rather than raw frequency. Where appropriate (i.e., number of children and medications taken) per officer, proportions were developed. Where chi-squared analyses were inappropriate due to expected frequencies lower than 5, Fisher's exact test was utilized. ANOVA was used to compare age, time on force, and age of youngest child living at home. Table demonstrates no significant differences among any of those subject variables. ANOVA = analysis of variance.
Sleep, Sleep Quality, and Daytime Dysfunction Due to Fatigue
Total number of hours slept, the amount of time it took to get to sleep (sleep latency), sleep quality, sleep efficiency, and daytime (awake) dysfunction due to sleepiness were determined using the PSQI. Three months into the 6-month trial period, officers working 13:20-hr shifts reported getting significantly less hours of sleep (5.842 ± 0.239 hr; p = .020) than officers working 10-hr shifts (6.165 ± 0.199 hr; F(1, 183) = 5.512, η2 = .029). Figure 1 shows that a similar pattern occurred in Month 6 of the trial; however, the differences were not statistically significant (p = .117, F(1, 148) = 2.491, η2 = .017). Officers working 13:20-hr shifts slept 5.833 ± 0.194 hr, whereas officers working 10-hr shifts slept 6.350 ± 0.205 hr.
Hours of sleep per night reported by officers in the 13:20-hr and 10-hr precincts in Months 3 and 6 of the 6-month trial period and 2 months after the 13:20-hr officers returned to 10-hr shifts (posttrial). Self-report data obtained from the Pittsburg Sleep Quality Index (PSQI). *13:20-hr group significantly different (p < .05) than the 10-hr group at Month 3.
When comparing daytime versus nighttime shifts, there was no significant difference in any of the PSQI scales (i.e., quality of sleep, duration of sleep, latency to sleep, sleep efficiency, medications used to sleep, daytime dysfunction due to sleepiness, or total PSQI score) for officers working first, second, or third shifts in the 10-hr control group shifts (p = .389, Λ = 0.240, F(52, 56) = 1.081, η2 = .510) or for officers working day versus night shifts in the 13:20-hr experimental group (p = .245, Pillai's Trace = .702, F(25, 15) = 1.415, η2 = .702). There was also no difference in any of the PSQI scales for officers in the first shift of the 10-hr group and officers working the day shift in the 13:20-hr group (p = .359, Pillai's Trace = .407, F(25, 41) = 1.127, η2 = .407) or for officers on the third shift in the 10-hr group and officers working the night shift in the 13:20-hr group (p = .859, Pillai's Trace = .915, F(25, 41) = 0.432, η2 = .060).
After officers working 13:20-hr shifts returned to working 10-hr shifts, the number of hours slept (7.490 ± 0.348) was significantly more (p = .032) than the number of hours slept before the study began (baseline, 6.750 ± 0.187; Figure 1).
Total PSQI sleep scores were significantly higher (p = .002) in officers working 13:20-hr shifts (12.40 ± 0.60) compared with officers working 10-hr shifts (10.17 ± 0.44; F(1, 112) = 11.788, η2 = .095) after only 3 months of the trial period. Higher scores indicate worse overall sleep. Figure 2 shows that the significant difference persisted into Month 6 of the 6-month trial (p = .001, F(1, 96) = 11.338, η2 = .106). Officers working 13:20-hr shift had overall sleep scores of 12.60 ± 0.50), whereas officers working 10-hr shifts scored 10.54 ± 0.50. Within 2 months after the 6-month trial, total PSQI scores (5.06 ± 0.40) were not different than baseline levels (6.08 ± 0.37; p = .068).
Overall sleep scores for officers in the 13:20-hr and 10-hr precincts in Months 3 and 6 of the 6-month trial period and 2 months after the 13:20-hr officers returned to 10-hr shifts (posttrial). Data obtained from the Pittsburg Sleep Quality Index (PSQI). *p < .01 at Month 3. **p = .001 at Month 6. Higher scores indicate worse overall sleep.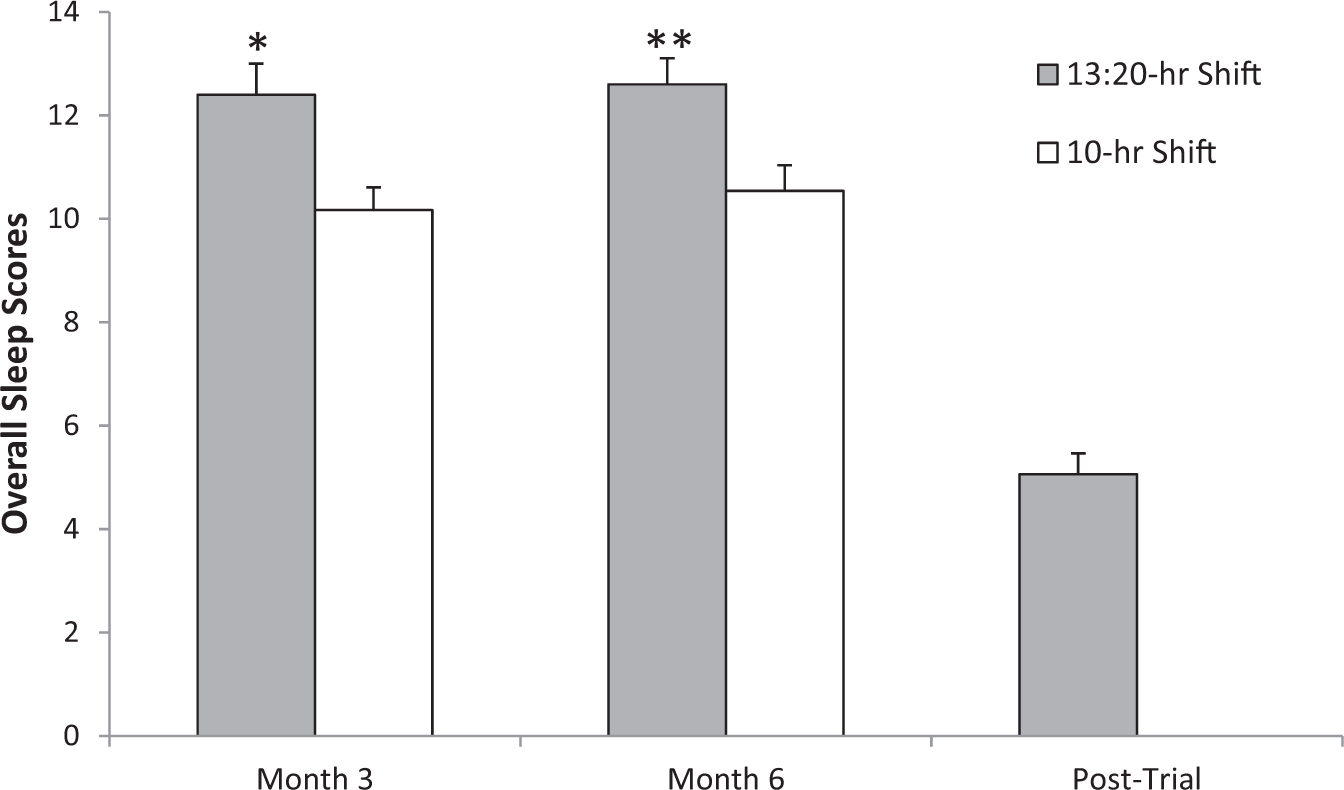
No significant differences (p = .430) were noted in terms of sleep latency (i.e., the time it takes to fall asleep) in Month 3 of the trial period (2.67 ± 0.09 for the 13:20-hr shift vs. 2.60 ± 0.08 in the 10-hr shift; arbitrary units F(1, 186) = 0.625, η2 = .003) or in Month 6 of the trial (2.67 ± 0.09 vs. 2.60 ± 0.08, respectively; p = 0.127, F(1, 148) = 2.358, η2 = .016). However, 2 months after the 13:20-hr officers returned to 10-hr shifts, their sleep latency increased significantly (p < .001; 2.47 ± 0.06 posttrial vs. 2.40 ± 0.06 pretrial), indicating they had a more difficult time falling asleep.
Significant differences in daytime (awake) dysfunction were clearly evident between precincts in both the 3rd and 6th months of the trial period (Figure 3). At Month 3, officers working 13:20-hr shifts had a score of 2.60 ± 0.09 and those working 10-hr shifts had a score of 2.29 ± 0.08 (p < .001, F(1, 117) = 17.002, η2 = .127). A higher score indicates increased dysfunction while awake due to sleepiness. In Month 6, officers working 13:20-hr shifts scored 2.73 ± 0.08, and officers working 10-hr shifts scored 2.34 ± 0.08 (p < .001, F(1, 103) = 14.383, η2 = .123). Two months after officers working 13:20-hr shifts returned to 10-hr shifts, daytime dysfunction scores were not different from baseline scores (1.89 ± 0.07 posttrial vs. 1.98 ± 0.06 baseline; p = .754).
Scores for daytime dysfunction due to sleepiness for officers working 13:20-hr and 10-hr shifts in Months 3 and 6 of the 6-month trial period and 2 months after the 13:20-hr officers returned to 10-hr shifts (posttrial). Data obtained from the Pittsburg Sleep Quality Index (PSQI). *p < .001 between groups.
There were no differences in overall sleep quality between precincts in Month 3 of the trial (p = .512, F(1, 348) = 0.431, η2 = .058). Officers working 13:20-hr shifts scored 1.67 ± 0.13, while officers working 10-hr shifts scored 1.11 ± 0.11. However, in Month 6 of the trial (Figure 4), there was a significant difference observed between the precincts (p = .001, F(1, 348) = 11.258, η2 = .031). Officers working 13:20-hr shifts scored 1.73 ± 0.11, whereas officers working 10-hr shifts scored 1.23 ± 0.12. A higher score indicates decreased overall sleep quality. Two months after officers working 13:20-hr shifts returned to 10-hr shifts, there was no difference relative to baseline sleep quality scores (0.99 ± 0.09 posttrial vs. 1.04 ± 0.06 baseline; p = .685).
Overall sleep quality scores for officers working 13:20-hr and 10-hr shifts in Months 3 and 6 of the 6-month trial period and 2 months after the 13:20-hr officers returned to 10-hr shifts (posttrial). Data obtained from the Pittsburg Sleep Quality Index (PSQI). *p = .001 between groups. Higher score indicates decreased overall sleep quality.
There were also no significant differences noted in sleep efficiency (i.e., total time asleep/time spent in bed) measured in Month 3 (p = .362) or 6 of the trial (p = .362). During Month 3, officers working 13:20-hr shifts scored 0.97 ± 0.21, and officers working 10-hr shifts scored 0.43 ± 0.15. In Month 6, officers working 13:20-hr shifts scored 0.97 ± 0.21, and officers working 10-hr shifts scored 0.43 ± 0.15. Posttrial sleep efficiency scores were also not different from baseline scores (p = .682) in the 13:20-hr precinct. Similarly, there was no difference between precincts regarding the use of medications used to go to sleep in Month 3 (p = .472) or 6 (p = .559) of the trial period, nor was there a difference between baseline and posttrial medication use (p = .837) in the 13:20-hr precinct.
Attention and Reaction Time
The PVT was used to measure reaction time, lapses in concentration, and anticipatory errors. After 1 month on the 13:20-hr shift, officers in the 13:20-hr experimental precinct demonstrated significantly slower reaction times (0.033 s) than officers in the 10-hr control precinct (Figure 5; 312.10 ± 12.14 ms vs. 279.25 ± 3.12 ms, respectively; p = .007). After 5 months, the slower reaction time (0.020 s) persisted (291.75 ± 5.27 ms vs. 272.01 ± 34.25 ms, respectively; p = .004).
Reaction time for officers working 13:20-hr and 10-hr shifts in Months 1 and 5 of the 6-month trial period. Data obtained from the Psychomotor Vigilance Test (PVT). *p < .01 between groups.
Officers in the 13:20-hr precinct demonstrated significantly more lapses in concentration (4.27 ± 0.44) than officers in the 10-hr precinct (2.67 ± 0.27) after 1 month (p = .002) and 5 months (4.23 ± 0.56 vs. 2.38 ± 0.33; p = .008) on the extended shifts (Figure 6(a)). However, officers in the 13:20-hr precinct made fewer anticipatory errors (0.96 ± 0.17) relative to those on 10-hr shifts (1.36 ± 0.15) after 1 month (p = .021; Figure 6(b)). After 5 months on the extended shift, there was no difference between the groups (0.86 ± 0.12 vs. 1.20 ± 0.18, respectively; p = .221).
Lapses in concentration (a) and anticipatory errors (b) for officers working 13:20-hr and 10-hr shifts in Months 1 and 5 of the 6-month trial period. Data obtained during a 3-min Psychomotor Vigilance Test (PVT). *p < .05 between groups.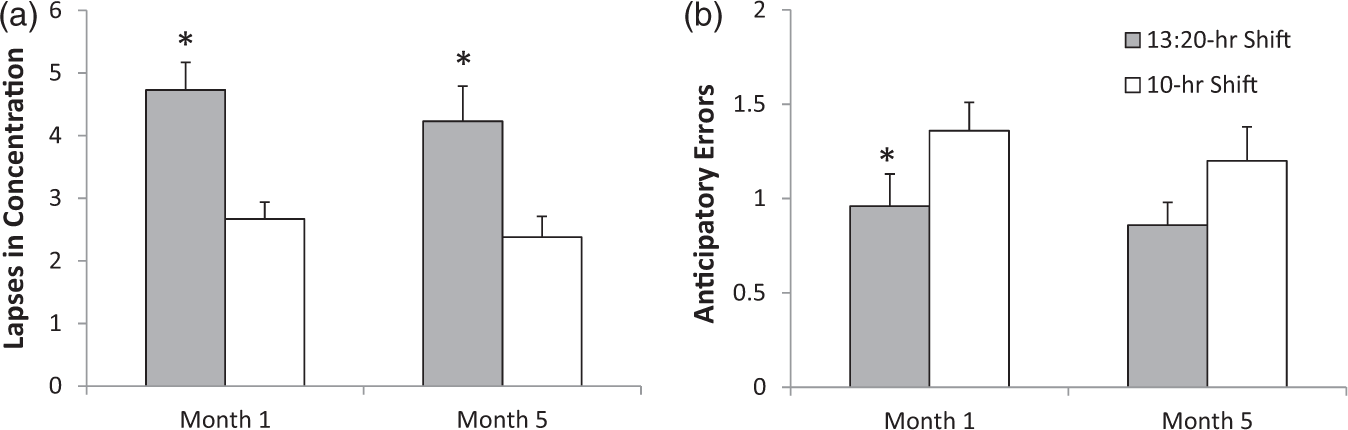
Cognitive Processing
The STROOP Color-Word test was used as an indicator of fatigue and concentration. “Word” scores can be interpreted as level of fatigue, “color-word” scores as a measure of concentration. After 3 months on the extended shifts, there were no significant differences in the word scores (p = .535) or color-word scores (p = .683) between officers in the 10-hr control and 13:20-hr experimental precincts when the test was given at the beginning of the first shift of the officer's workweek. Similarly, there were no significant differences in the word scores (p = .832) or color-word scores (p = .875) after 3 months when the test was administered during the last hour of the officer's last shift of the workweek.
In Month 6 of the trial period, no significant differences were noted between precincts at the beginning of the first shift of the workweek with regard to word scores (p = .841) or color-word scores (p = .881). However, during the last hour of the officer's workweek, officers in the 13:20-hr precinct had significantly lower word scores than officers in the 10-hr precinct (101.7 ± 2.1 vs. 109.0 ± 2.4 words read in 45 s; p = .022; Figure 7). Similarly, officers in the 13:20-hr precinct had significantly lower color-word scores than those in the 10-hr shift precinct during the last hour of their workweek (46.4 ± 1.4 vs. 51.6 ± 1.3 words, respectively per 45 s; p = .012).
Number of words printed in black text (word score) or color text (color-word score) read in a 45-s period of time by officers working 13:20-hr and 10-hr shifts. Data were collected during the last hour of the officer's workweek in Month 6 of the 6-month trial period using the STROOP Color-Word test. *p < .05 between groups.
Cortisol (Stress) Levels
When all officers in the control and experimental groups were compared, ANOVA indicated no significant differences with regard to salivary cortisol levels between the 13:20-hr precinct and the 10-hr precinct officers during Month 1 (0.140 ± 0.015 μg/dl vs. 0.170 ± 0.029 μg/dl, respectively; p = .809) or 5 of the 6-month trial period (0.161 ± 0.018 μg/dl vs. 0.156 ± 0.019 μg/dl, respectively; p = .704).
When officers were grouped by shifts, officers in the control 10-hr group working first shift (ending at 3:00–4:00 p.m.) in Month 5 had significantly higher cortisol levels (0.116 ± 0.007 μg/dl) than officers working the second shift (ending at 11:30 p.m. to 12:30 a.m.; 0.075 ± 0.007 μg/dl; p = .018). However, officers working the third shift (ending at 6:00–7:00 a.m.) had significantly higher cortisol levels (0.258 ± 0.035 μg/dl; p = .001) than both first- and second-shift officers. In the experimental 13:20-hr group, cortisol levels were significantly higher (p < .001) in officers working the night shift (ending at 6:19–7:19 a.m.; 0.221 ± 0.033 μg/dl) than officers working the day shift (ending at 6:19–7:19 p.m.) 0.083 ± 0.009 μg/dl) in Month 5. There was no difference in cortisol levels of 10-hr officers working the first shift and 13:20-hr officers working the day shift in Month 1 (p = .977) or Month 5 (p = .984). There was also no difference in cortisol levels of 10-hr officers working the third shift and 13:20-hr officers working the night shift in Month 1 (p = .598) or Month 5 (p = .219).
Caffeine Intake
ANOVA results indicate no significant differences (p = .171) with regard to total caffeine intake between the 13:20-hr precinct (2.19 ± 0.03 cups/day) and the 10-hr precinct (2.16 ± 0.01 cups/day). When the use of “energy drinks” were removed from the analysis, however, a significant effect was revealed in that officers in the 13:20-hr precinct had significantly more caffeine from coffee, tea, and soda (2.01 ± 0.13 cups/day) than those in the 10-hr precinct (1.45 ± 0.12 cups/day; p = .010).
Officer QOLI
At the end of the 6-month trial, officers in the 13:20-hr experimental precinct reported a lower overall QoL (Figure 8(a)) as well as lower subscores in the areas of free time activities (play), relationships with friends, relationships with children, health, work, and helping when compared with officers on the 10-hr shift (Figure 8(b)). However, there were no significant differences in the subscores for home (p = .134) and love (intimate relationships; p = .485).
Total quality of life (a) and quality of life subscores (b) for officers working 13:20-hr and 10-hr shifts in Month 6 of the 6-month trial. Data obtained from the Quality of Life Inventory (QOLI). *p < .05 between groups.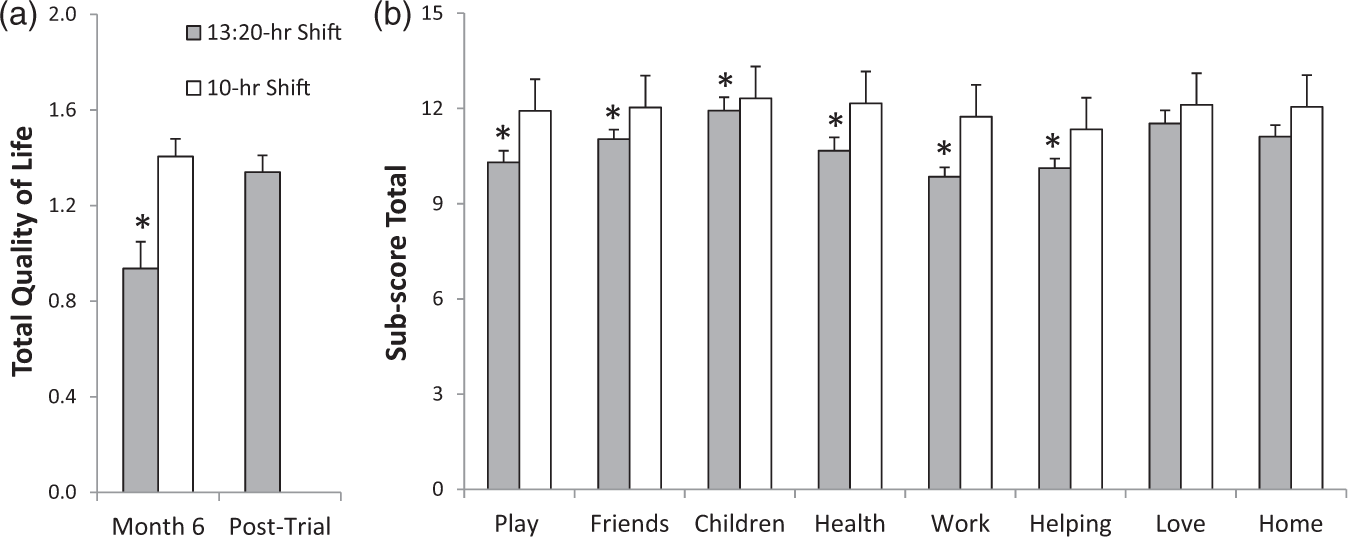
Two months after officers on the 13:20-hr shift returned to 10-hr shifts, the QOLI was repeated. When compared with the baseline QOLI scores, there were no significant differences in overall QoL scores (1.42 ± 0.04 vs. 1.34 ± 0.07; p = .239), or in the subscore areas of free time activities (18.94 ± 0.14 vs. 18.75 ± 0.24; p = .220), friends (18.98 ± 0.14 vs. 18.57 ± 0.20; p = .527), children (19.63 ± 0.15 vs. 19.57 ± 0.27; p = .354), health (19.17 ± 0.15 vs. 19.43 ± 0.24; p = .486), or helping (18.21 ± 0.14 vs. 18.15 ± 0.20; p = .849), indicating that these areas had returned to pretrial levels. However, the subscore for work satisfaction (18.92 ± 0.12 vs. 17.70 ± 0.25; p < .001) remained statistically lower than baseline scores.
When comparing QOLI scores of first, second, and third shifts of the 10-hr control group, multivariate analysis of variance results indicated no significant main effect (p = .351, Λ = 0.531, F(36, 108) = 1.096, η2 = .271). Similarly, there was no significant difference in QOLI scores between day and night shifts of the 13:20-hr experimental group (p = .370, Pillai's Trace = .532, F(27, 27) = 1.138, η2 = .532).
However, in Month 6 of the experimental period, officers working the first shift in the 10-hr group had significantly higher QOLI scores than officers working the day shift in the 13:20-hr group (p = .048, Λ = 0.712, F(18, 78) = 1.749, η2 = .288). Post hoc ANOVA analyses indicated significantly higher scores with regard to play (16.94 vs. 18.66; p = .003, F(1, 95) = 9.057, η2 = .087), work (16.52 vs. 18.32; p = .001, F(1, 95) = 12.444, η2 = .116), helping (16.92 vs. 17.91; p = .050, F(1, 95) = 3.932, η2 = .040), and total QOLI score (0.86 vs. 1.30; p = .022, F(1, 95) = 5.449, η2 = .054). There were no significant differences between officers working the third shift in the 10-hr group and officers working the night shift of the 13:20-hr group (p = .127, Λ = 0.512, F(18, 30) = 1.592, η2 = .488).
Work Performance and Safety Measures
Decision making (pass/fail shooting qualifications)
Decision-Making (Pass/Fail) Shooting Qualifications for the Year Prior to the Study Period (2011) and the 8 Months of the Study (2012).
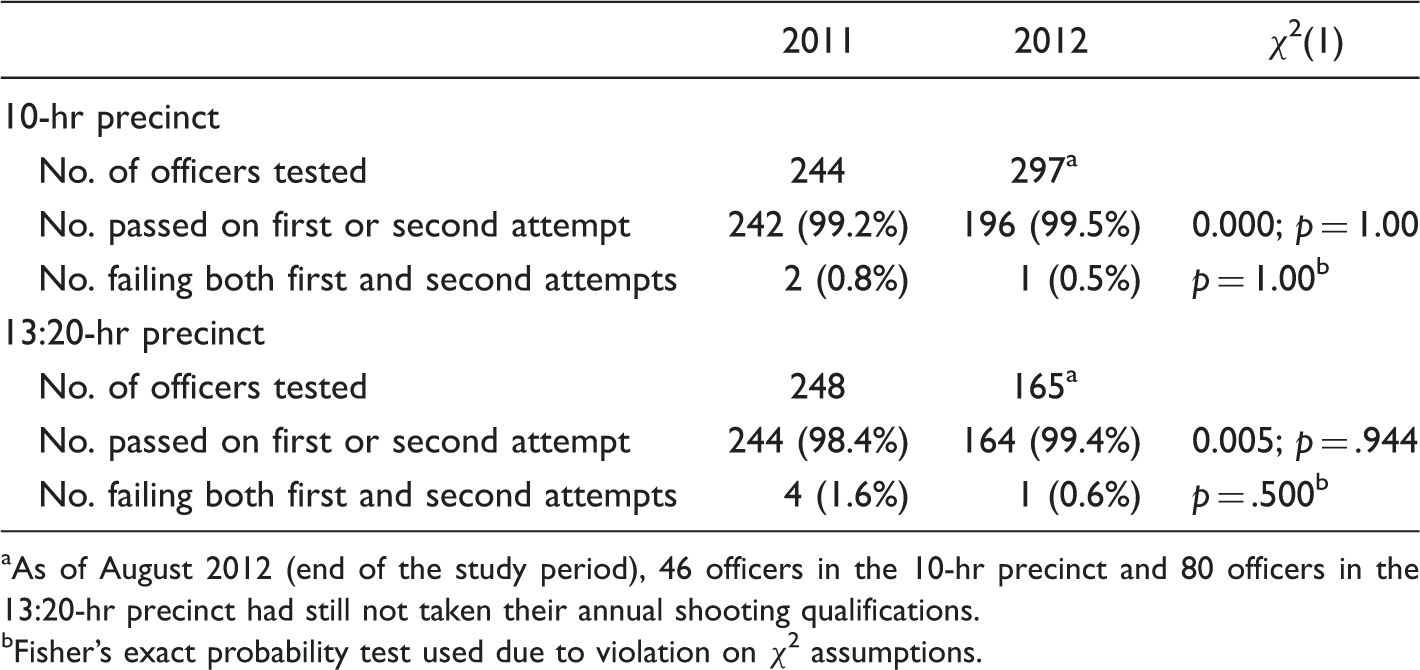
As of August 2012 (end of the study period), 46 officers in the 10-hr precinct and 80 officers in the 13:20-hr precinct had still not taken their annual shooting qualifications.
Fisher's exact probability test used due to violation on χ2 assumptions.
PSB Incidents
Total number of complaints
The total number of PSB incidents in the 13:20-hr precinct increased significantly (p = .047) year-over-year from 32 incidents in 2011 when officers were working 10-hr shifts to 50 incidents in 2012 when they were working 13:20-hr shifts. PSB incidents in the 10-hr precinct decreased from 42 incidents in 2011 to 30 in 2012. However, this change was not significant (p = .157).
Category 1 incidents
Category 1 incidents are designated as minor policy violations that may result in coaching or training. The proportion of the total number of Category 1 incidents year-over-year for officers in the 13:20-hr precinct did not change significantly (84% in 2011 to 64 % in 2012; p = .100). Similarly, the proportion of the total number of Category 1 incidents year-over-year for officers in the 10-hr precinct did not change significantly (86% in 2011 to 77% in 2012; p = .481).
Category 2 incidents
Category 2 incidents are more serious policy violations that may result in a written reprimand, suspension, demotion, or termination. The proportion of the total number of Category 2 incidents year-over-year for officers in the 13:20-hr precinct increased significantly (16% in 2011 to 36% in 2012; p = .005). However, the proportion of the total number of Category 2 incidents year-over-year for officers in the 10-hr precinct did not change significantly (14% in 2011 to 23% in 2012; p = .139).
Number of officers involved in PSB incidents
Each PSB incident may involve misconduct allegations for one or more officers. The year-over-year number of officers involved in PSB incidents from the 13:20-hr precinct increased significantly from 50 in 2011 to 76 in 2012 (p = .020), whereas the number of officers from the 10-hr precinct involved in PSB incidents decreased significantly (p = .014) from 60 in 2011 to 36 officers in 2012.
Officer-involved accidents
The number of accidents for the 13:20-hr precinct increased from 7 in 2011 to 12 in 2012, while the number of accidents in the 10-hr precinct decreased from 16 in 2011 to 11 in 2012. However, chi-squared analyses yielded no significant differences in either group (p = .336).
Self-initiated calls
Number of “Self-Initiated Calls” Reported by Type and Precinct During the 6-Month Trial Period of 2012 and the Same 6-Month Period of the Previous Year, 2011.
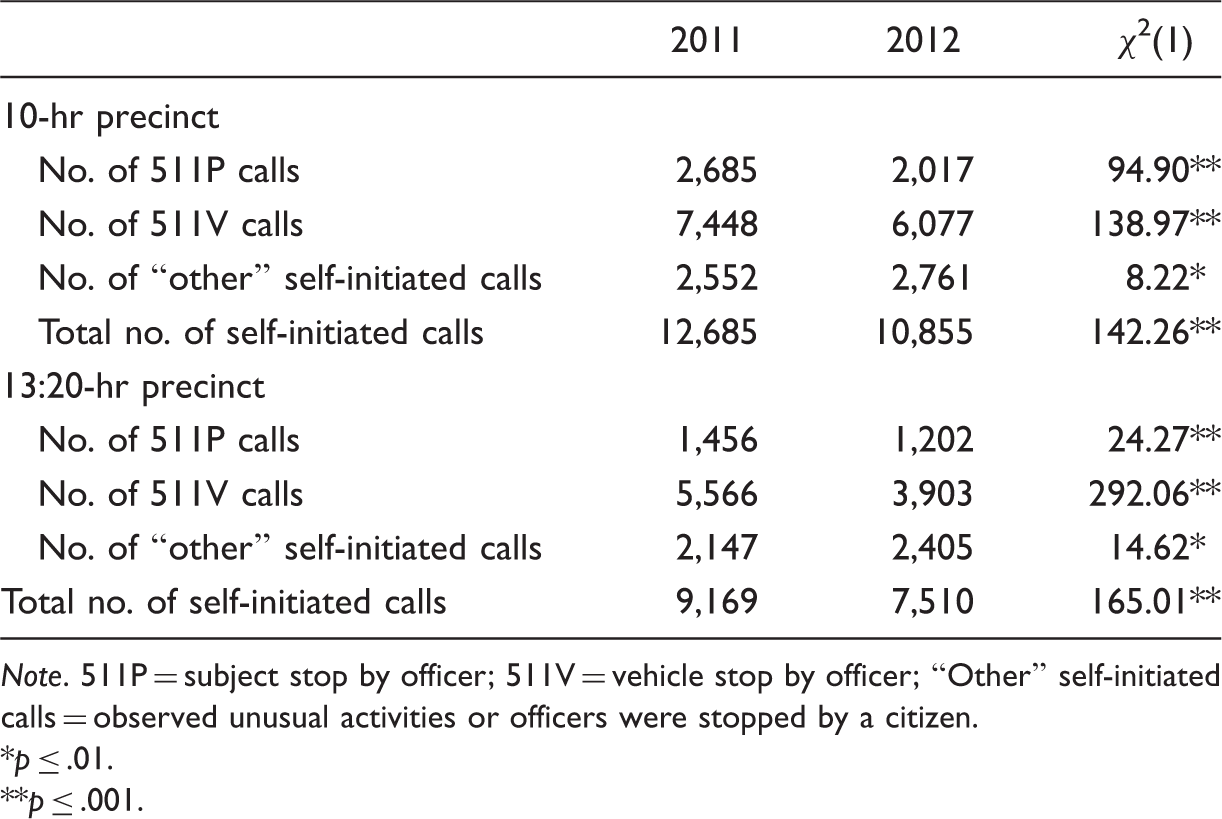
Note. 511P = subject stop by officer; 511V = vehicle stop by officer; “Other” self-initiated calls = observed unusual activities or officers were stopped by a citizen.
p ≤ .01.
p ≤ .001.
Adult bookings
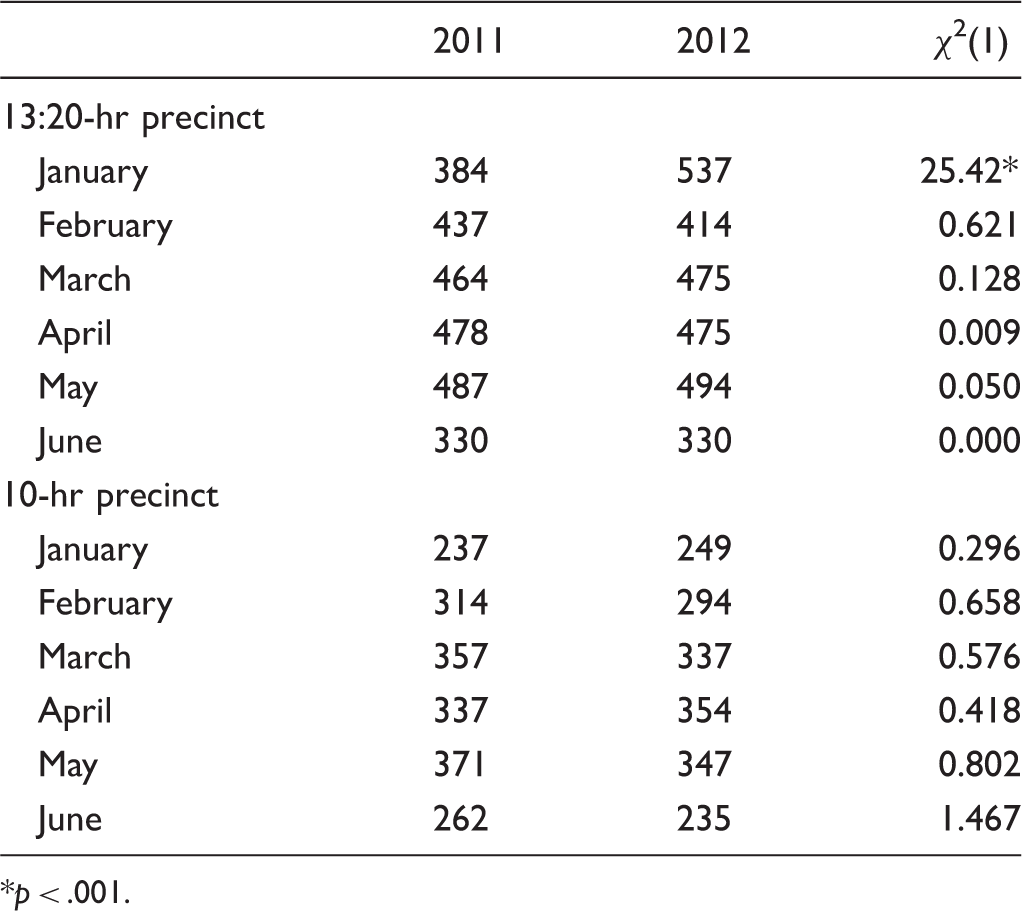
Adult Bookings by Precinct in 2011 and 2012.
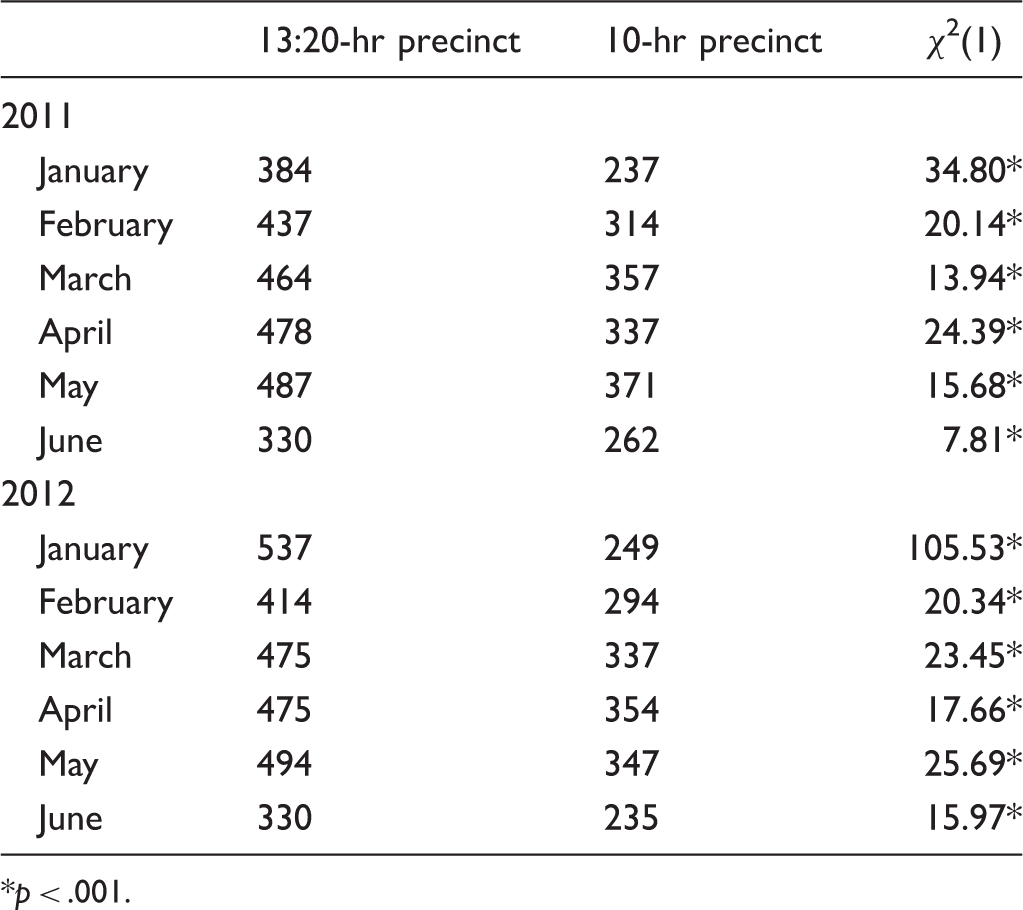
p < .001.
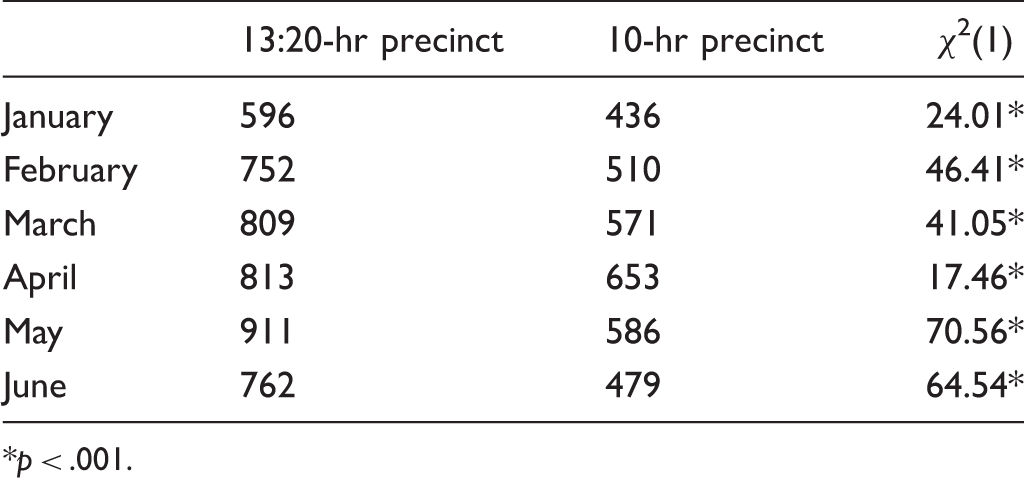
Adult Bookings by Year in 13:20-hr and 10-hr Precincts.
p < .001.
Field interrogations
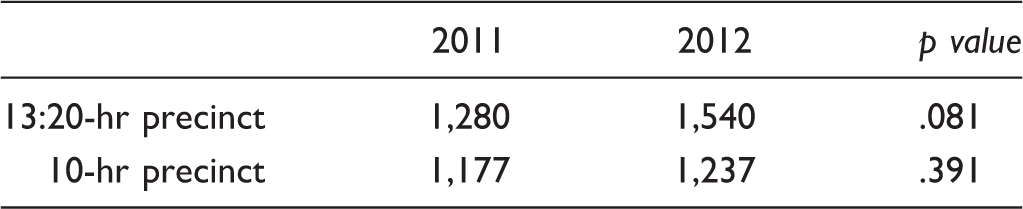
Total Number of Field Interrogations Conducted by Officers in the 13:20-hr and 10-hr Precincts During the 6-Month Trial Period.
p < .001.
Overtime and Time Off
Overtime
Number of Overtime Hours Worked During the 6-Month Trial Period of 2012 and the Same 6-Month Period of the Previous Year, 2011.
Off-duty work
Number of Off-Duty Work Hours Logged During the 6-Month Trial Period of 2012 and the Same 6-Month Period of the Previous Year, 2011.
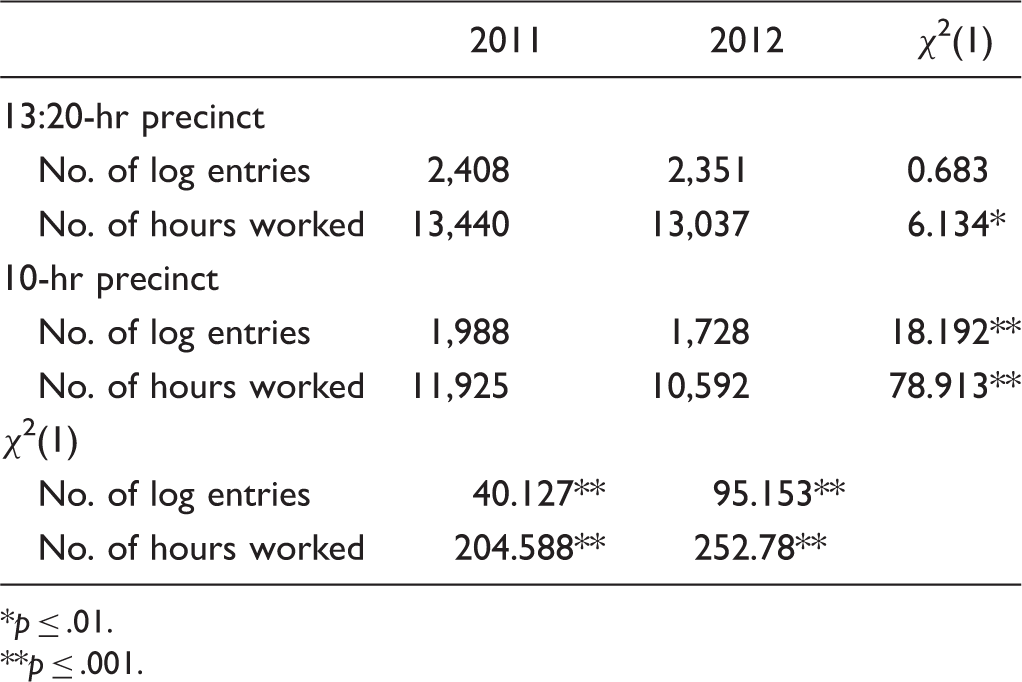
p ≤ .01.
p ≤ .001.
Personal illness and vacation time
Number of Personal Illness and Vacation Hours Reported During the 6-Month Trial of 2012 and the Same 6-Month Period of the Previous Year, 2011.

p ≤ .01 year-over-year within each precinct.
Officer Shift Preference
Figure 9 shows officer preference from both precincts for 13:20-hr shifts 1 month before the study trial began (pretrial; when officers knew what shift they would have during the study trial), and in Months 3 and 6 of the 6-month trial. Also shown is officer preference for the 13:20-hr shifts for officers in the experimental precinct 2 months after they returned to 10-hr shifts (posttrial). Officers from both control and experimental precincts reported greater preference for 10-hr shifts over 13:20-hr shifts before the study started, throughout the study trial, and 2 months after the study trial (p < .001 at all time points).
Percentage (numbers above each bar) of officers working 13:20-hr and 10-hr shifts that preferred the 13:20-hr shift before the trial began (pretrial), in Months 3 and 6 of the 6-month trial and 2 months after the 13:20-hr officers returned to 10-hr shifts (posttrial). *p < .001 between groups.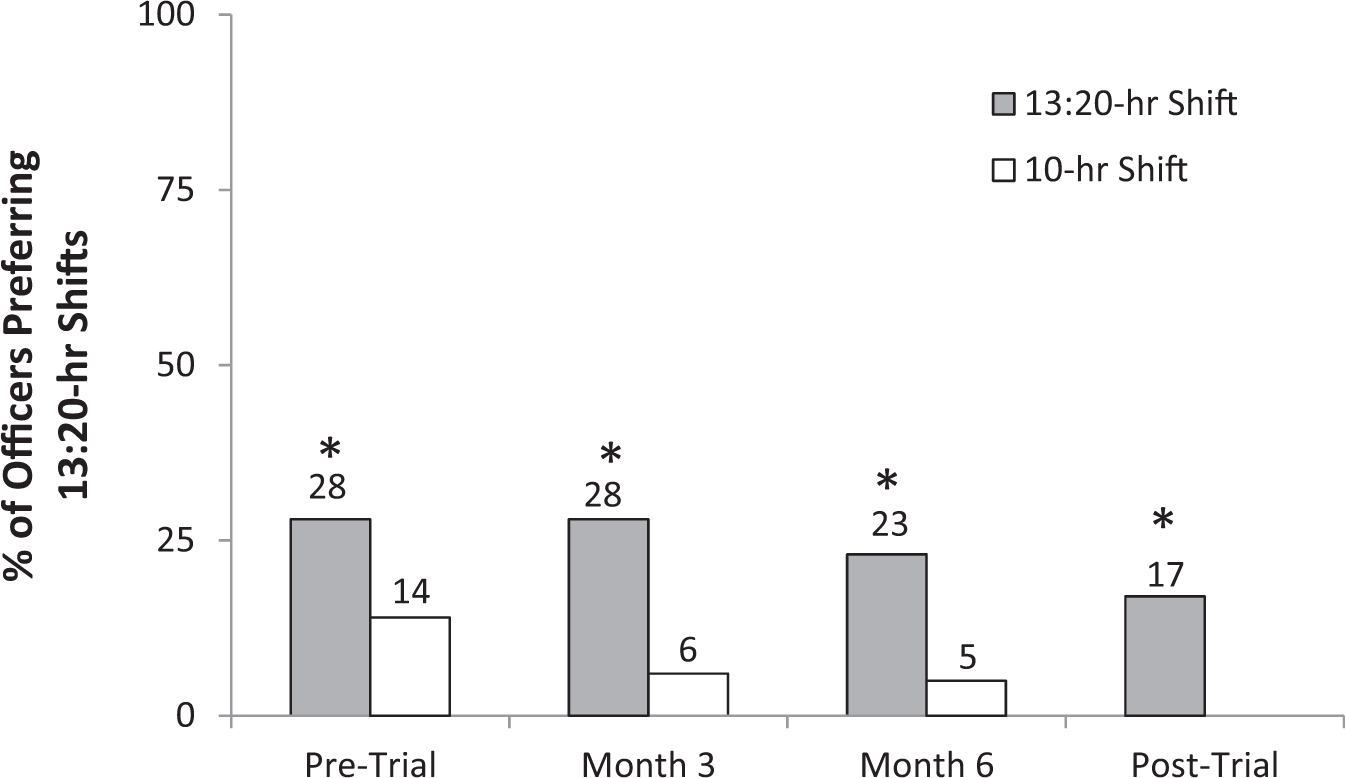
Spouse/Partner Survey of Officer QoL
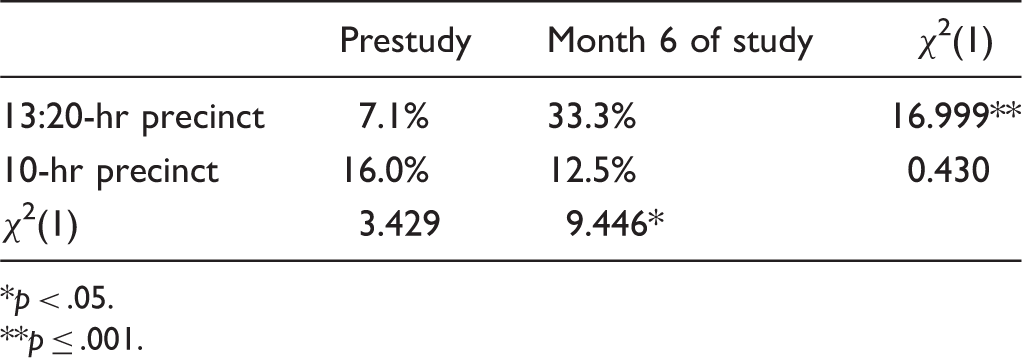
Spouse/Partner Preference for 13:20-hr Shifts.
p < .05.
p ≤ .001.
Spouses/partners also reported on their officer's sleep patterns, QoL, and the relationships between them and their officer spouse/partner. However, the number of responses from spouses/partners of officers was too few to be analyzed statistically.
Discussion
The effect of shift length has been studied extensively in a variety of professions, including truck drivers (Hamelin, 1987; Mitler, Miller, Lipsitz, Walsh, & Wylie, 2008), commercial pilots (Rosekind et al., 1994), nuclear plant operators (Mitchell & Williamson, 2000), and health care workers (Josten et al., 2003; Lockley et al., 2007; Scott et al., 2007). However, even though policing is a critical governmental service, research on the impacts of shift length and CWWs in policing is not as prevalent or rigorous as that of other professions (Amendola et al., 2011d). While there is limited research on the effects of shift length on police officers working 8, 10, and even 12-hr shifts, this is the first systematic, experimental study of police officers working more than 12-hr shifts (i.e., 13:20-hr shifts). The goal of this study was to compare the sleep, cognitive abilities, health, life satisfaction, and work performance of officers working 10-hr shifts to those working 13:20-hr shifts. We also investigated daytime versus nighttime shifts with regard to sleep (PSQI), QoL (QOLI), and salivary cortisol. Most aspects of the study were measured twice during the 6-month study to (a) determine if changes occurred over time during the 6 months and (b) eliminate any “honeymoon effects” that may have occurred (Amendola et al., 2011d).
In general, the results demonstrate that when compared with the control group (officers working 10-hr shifts), officers working 13:20-hr shifts got less sleep, had worse quality of sleep, experienced more fatigue and more daytime dysfunction due to sleepiness, had slower reaction times, experienced more lapses in concentration, and reported a worse QoL. There were no shift-dependent (i.e., daytime vs. nighttime) differences in sleep assessment or QoL within groups. However, officers working the third shift or night shift had higher cortisol levels than those working first shift or daytime shifts.
Sleep/Fatigue
Police officers are often expected to make demanding, complicated, split-second decisions with potentially grave results (Vila, 2006). However, officers working long and irregular hours experience inadequate or poor quality sleep (Chiu & Tsai, 2013; U.S. Congress, Office of Technology Assessment, 1991). Sleep deprivation and both acute and chronic fatigue are associated with an array of physiological and psychological detriments including increased stress and irritability, chronic disease, and car accidents, and decreased cognitive and neurobehavioral performance including alertness and quality decision making (Amendola et al., 2011b, 2011c; Barger et al., 2009; Vila, 2006; Wagstaff & Sigstad, 2011; Wirth et al., 2011). Vila (2006) suggests that all human performance is impaired by excessive work hours, disruption in circadian rhythms, and inadequate sleep. Barger et al. (2009) further suggest that sleep deprivation particularly affects performance in safety-sensitive, high-risk occupations.
In 2011, Amendola et al. (2011b, 2011c, 2011d) completed a comprehensive, multicity, 6-month study to examine the advantages and disadvantages of shift length on officer work performance, safety, health, QoL, sleep, fatigue, and off-duty employment. One of their key findings was that officers working 10-hr shifts got significantly more sleep (7.86 hr) than the 8-hr shift group (7.27 hr), but not more than the 12-hr shift group (7.63 hr). It is important to note that in the study by Amendola et al. (2011b, 2011c, 2011d), daytime naps were included in the sleep totals reported. In the present study, officers working 10-hr shifts reported getting less sleep (6.18–6.35 hr) between shifts than any of the shift groups reported on by Amendola et al. (2011c). Our results are consistent with those of Vila, Kenney, Morrison, and Reuland (2000) who found that officers working 8- to 12-hr shifts averaged 6.6 hr of sleep a day (6.4 hr for officers working 8-hr shifts and 6.7 hr for officers working 12-hr shifts). Vila (2006) reports that only 17% of the officers average 8 or more hr of sleep daily, while 53% report averaging less than 6.5 hr. This means that police officers are about half as likely to get enough sleep and twice as likely to get far too little (Vila, 2006). Similar results (average of 6.2 hr of sleep) are reported by Neylan et al. (2002) in officers working “stable day shifts.” Complicating the use of self-report regarding fatigue is that officers often underestimated their level of fatigue, even if testing indicated they were impaired (Vila, 2006).
Even more concerning is that the officers working 13:20-hr shifts in the present study averaged only 5.83 hr of sleep between shifts (Figure 1). This means that officers working 13:20-hr shifts routinely experienced sustained wakefulness of more than 18 hr during workdays. It is unclear whether officers in the present study or the studies by Amendola et al. (2011b, 2011c, 2011d) or Vila (2006) compensated for any sleep loss during workdays by sleeping more during their days off than 13:20-hr officers in the present study.
Dawson and Reid (1997) have equated the cognitive performance impairment of someone with 17 to 19 hr of sustained wakefulness to an individual with a blood alcohol concentration of 0.05%. After 24 hr of wakefulness, the impairment equals that of someone with a blood alcohol concentration of 0.10%. Several studies (Dawson & Reid, 1997; Hack, Choi, Vijayapalan, Davies, Stradling, 2001; Williamson & Feyer, 2000) indicate that the sleep deprivation condition has a greater impact than the alcohol condition with regard to driving, hand–eye coordination, and cognitive performance such as task accuracy and alertness.
Barger et al. (2009) suggest that chronic partial sleep deprivation, like that which occurred in the present study, results in a “sleep debt,” where the consequences are cumulative, negatively affecting health and performance, and decreases vigilance. These consequences emerged when subjects were restricted to 5 hr of sleep nightly for only seven nights. The loss of even 2 hr of sleep for 1 week caused decrements in performance comparable with those seen after 24 hr of continuous wakefulness. After 2 weeks, the lapses of attention were comparable with those observed after 48 hr of total sleep deprivation (Barger et al., 2009). The hours of sleep reported in the current study represent sleep during workdays. It is not known how much sleep officers got during days off or whether increased sleep on days off mitigates their sleep deprivation.
In addition to the effects of long shifts, other factors also play a potential role in sleep deprivation, including time spent waiting to testify in court, off-duty meetings, training, overtime assignments (voluntary or mandatory), and off-duty work. Lindsey (2007) suggests that these factors along with demands of dealing with the public, family responsibilities, and expectations by management of doing more with less increase the risk of both emotional and physical harm. Extending shift length to more than 12 hr is likely to exacerbate these factors even further.
The National Institute of Justice supported research regarding the prevalence and consequences of excess work-hour-related fatigue among patrol officers resulting in the Tired Cops study (Vila, 2000). Vila et al. (2000) collected data for 4- to 6-month periods from four medium-sized police departments across the United States. Officers were surveyed about sleep quality, attitudes about fatigue level, and how fatigue affected health, safety, performance, and family. Vila et al. (2000) used the PSQI as a standardized measure of sleep quality. Buysse et al. (1989) developed the PSQI as a sensitive and specific measure of good versus poor sleep. They showed that the general public averaged a total PSQI score of 2.67 and that scores above 5.00 were an indication of poor sleep. Using the PSQI, Vila et al. (2000) found that overall PSQI scores for patrol officers were twice as high (5.28) as that of the general public, indicating increased fatigue. In fact, 41% of officers in his study had overall PSQI scores above 5.0. Similar results (average PSQI scores of 6.2) are reported by Neylan et al. (2002) in active duty officers. When studying young police academy recruits, however, Neylan et al. (2010) reported total PSQI scores of 3.5. Officers working 10-hr shifts in our study had overall PSQI scores of 10.2 and 10.5 (in Months 3 and 6 of the study, respectively), while officers working 13:20-hr shifts had overall PSQI scores of 12.4 and 12.6 (in Months 3 and 6; Figure 2). These scores are 3.8 to 4.7 times those of the general public and 2 to 2.5 times the level that indicates sleep pathology. Buysse et al. (1989) describe PSQI scores in patient groups with two sleep pathologies as defined by the Association of Sleep Disorders Center (ASDC, 1979). The first are patients with a diagnosis of Disorders of Excessive Somnolence (DOES). DOES includes disorders that “produce excessive sleepiness, such as narcolepsy or obstructive sleep apnea syndrome” (ASDC, 1979, p. 64). DOES patients in the Buysse et al. (1989) study had overall PSQI scores of 6.53 ± 2.98. The second are patients diagnosed with Difficulty in Initiating and Maintaining Sleep (DIMS). DIMS patients include those who “have difficulty either in initiating sleep or maintaining sleep, including sleep onset insomnia, circadian rhythm sleep disorders, and delayed sleep phase syndrome” (ASDC, 1979, p. 64). These patients had overall PSQI scores of 10.38 ± 4.57.
In addition to the PQSI, we used a second method to measure fatigue in this study (STROOP Color-Word test; Figure 7). This test demonstrated increased fatigue in officers working 13:20-hr shifts in that they were able to read fewer words in a given time compared with officers working 10-hr shifts. This fatigue resulted in increased daytime (i.e., work) dysfunction due to sleepiness (Figure 3) after only 3 months on the 13:20-hr shifts. The dysfunction as well as decreasing sleep quality (Figure 4) continued throughout the 6-month study.
Taken together, the PSQI and STROOP data indicate that officers in the present study get far less sleep than needed, demonstrate fatigue and daytime dysfunction due to sleepiness, and have sleep scores similar to those with clinical sleep pathologies. However, 2 months after returning to 10-hr shifts, the daytime dysfunction due to sleepiness disappeared, and sleep quality returned to prestudy levels.
Shift work, increased shift length, and sleep deprivation negatively impact neurobehavioral performance and health (Durmer & Dinges, 2005; Tucker, Whitney, Belenky, Hinson, & Van Dongen, 2010; Vila, 2010). The consequences in neurobehavioral performance include decreased mood, cognitive performance, and motor functions, including impairment in memory, attention, and executive skills (organizing, planning, and cognitive efficiency). Durmer and Dinges (2005) discuss an array of neurocognitive consequences of sleep deprivation, finding a significant social, financial, and human cost. They report that “microsleeps” (i.e., lapses in attention, motor functioning, mood, and cognitive performance) are all negatively impacted by sleep deprivation.
Officer fatigue and sleep deprivation also occurs with other types of work shifts. The Philadelphia Police Shift Rescheduling Program (Vila, 2006) showed sleep deprivation when officers worked a 6-day, 8-hr schedule that rotated every 8 days in a counter-clockwise direction. Using the PSQI, the Buffalo Police Health Study (Charles et al., 2007) showed decreased quantity and quality of sleep in officers working night shift compared with day and evening shifts. Both of these studies demonstrated reduced performance and safety due to reduced sleep. Vila (2006) suggests that the performance and safety profiles were among the worst for shift workers nationwide (U.S. Congress, Office of Technology Assessment, 1991). In contrast, we saw no significant difference in sleep scales when comparing day versus night shifts, but we did see decreased quantity and quality of sleep in officers working 13:20-hr shifts when compared with officers working 10-hr shifts.
In 2000, Vila et al. reported that officers often include family factors, such as the presence and needs of young children in the home, as reasons for disruptions in their sleep. However, in the present study, there was no significant difference between officers working 10-hr and 13:20-hr shifts in regard to the number of children they have, number of children in the home, or the age of the youngest child in the home. Therefore, if family factors such as children in the home cause disruptions in sleep, it did not account for the differences seen between our control and experimental precincts.
Cognitive Abilities
A number of studies demonstrate that reduced sleep in controlled laboratory settings (Neylan et al., 2010) results in cumulative and dose-dependent decreases in “intrinsic alertness,” defined as “the ability to prepare and maintain a readiness to respond to stimuli in the absence of a warning signal.” Neylan et al. (2010; p.1494) conducted field studies in police academy recruits using a mobile PVT device to confirm the results of others. The PVT measures reaction time, an indicator of neurobehavioral alertness (i.e., fatigue), as well as anticipatory errors and vigilant attention (i.e., concentration; Basner et al., 2011). Neylan et al. (2010) found that decreasing hours of sleep correlates strongly to the number of lapses recorded during PVTs. Each hour of lost sleep increased the probability of having a lapse in concentration by 3.5%. Furthermore, Neylan et al. (2010) demonstrated that after 15 hr of wakefulness, the probability of having a lapse in concentration increased significantly.
The current study investigated cognitive dysfunction (i.e., intrinsic alertness) as it relates to work performance in officers working 13:20-hr shifts. Using the PVT, we demonstrate that officers working 13:20-hr shifts had twice as many lapses in concentration (when they had been awake for 15 or more hr; 4.27 ± 0.44) than officers working 10-hr shifts (2.67 ± 0.27; Figure 6(a)). This effect was present after only 1 month on the 13:20-hr shift and persisted through the 5th month. The number of concentration lapses for officers in our study taking a 3-min PVT was significantly higher than those reported by Neylan et al. (2010) for police academy recruits taking a 5-min test (0.89 ± 2.2 lapses). A significant decrease in concentration was also seen in officers working the 13:20-hr shift using the STROOP Color-Word test (color-word-score; Figure 7), but only after 6 months on the longer shift. However, officers working 13:20-hr shifts made half as many anticipatory errors (i.e., false starts) on the PVT (Figure 6(b)). This might suggest that while it was harder for them to concentrate, officers working the longer shifts knew they were fatigued and wanted to be sure not to make errors in judgment.
Physical reaction time/intrinsic alertness was also significantly reduced (by 0.033 s) in officers working 13:20-hr shifts compared with officers working 10-hr shifts after only 1 month (Figure 5). This result persisted through the 5th month of the study. Reaction time of officers working 10-hr shifts in our study (272 ± 34 ms) is similar to that reported by Neylan et al. (2010) in police academy recruits (270 ± 54 ms). While small, the observed difference in reaction time in officers working 13:20-hr shifts may mean the difference between life and death for a tired officer. Reaction times in officers working more than 12-hr shifts have not previously been reported.
The results from the present study are consistent with those reported by Rosekind et al. (1994) in long-haul pilots. Long-haul (i.e., trips > 8 hr) pilots showed longer reaction times (using the PVT) at the end of the flight compared with the beginning of the flight. However, if the pilots were allowed to rest (i.e., 40-min nap) during long-haul flights, there was no difference in reaction times when measured at the beginning and the end of the flight. Pilots making sequential long-haul flights generally slept two times during their 24.8 hr layover between long-haul flight legs. Each of the sleep periods averaged 5.7 hr. There was a cumulative effect over multiple days of long-haul flights in that reaction times got longer on the fourth long-haul flight (Rosekind et al., 1994).
Taken together, the decrease in the number of hours slept and longer reaction times and increased number of concentration lapses demonstrate a diminished ability of officers working 13:20-hr shifts to maintain attentiveness and respond to unanticipated stimuli compared with officers working 10-hr shifts. This is reinforced by the increased PSQI daytime (awake) dysfunction scores of officers working 13:20-hr shifts (Figure 3). This effect was evident in Month 3 of the study and persisted to the end of the study. However, when officers working extended shifts returned to 10-hr shifts, these negative impacts disappeared (i.e., returned to baseline).
Health
In addition to the quantity and quality of sleep reported earlier, the effects of extended shifts on other aspects of officer health were also studied. These include physiological stress, caffeine intake, and personal illness time.
One long-used, noninvasive measure of overall physiological stress is the level of cortisol in saliva (Kirschbaum & Hellhammer, 1989). Cortisol is a hormone secreted into the blood stream when the body activates the hypothalamic–pituitary–adrenal axis in response to waking or stress (Wirth et al., 2011). While cortisol levels found in saliva are significantly lower than the level of free, unbound cortisol found in the general circulation, changes in unbound plasma cortisol are highly correlated (r = .96) to and reflected in salivary cortisol (Kirschbaum & Hellhammer, 1994; Lippi et al., 2009). Salivary cortisol shows a circadian rhythm with levels peaking just after waking (∼8:00 a.m. 0.100–0.273 ug/dl) and decreases throughout the day with the lowest level (0.022–0.041 ug/dl) at the end of the day (∼10:00 p.m. Kirschbaum & Hellhammer, 1994; Laudat et al., 1988; Wirth et al., 2011). We measured salivary cortisol at the end of the officer's last shift on the last day of their workweek when they would be most fatigued. Officers working night shifts had significantly higher cortisol levels than officers working day shifts. However, because cortisol was measured at the end of the shift, measurements in night-shift officers occurred at 6:00 a.m. to 7:20 a.m. when cortisol is typically highest due to circadian rhythms. Similar “waking” cortisol levels (1.07 ug/dl) were observed by Neylan et al. (2005) in a control group of officers. Our day shift measurements were made at 3:00 p.m. to 4:00 p.m. for 10-hr officers working first shift and 6:20 p.m. to 12:30 a.m. for 13:20-hr officers working day shifts and 10-hr officers working second shift, respectively. The average cortisol levels measured in officers at the end of each shift fell within normal ranges as reported by Kirschbaum and Hellhammer (1989) and Laudat et al. (1988) for the corresponding hour of the day in control subjects. However, Chida and Steptoe (2009) found a robust positive correlation between job stress or general life stress and cortisol release, and a strong negative correlation between fatigue, burnout, or exhaustion and cortisol release. Therefore, it is difficult to interpret results from the present study. Police officers face potentially stressful situations throughout their shifts, suggesting that an increase in cortisol might be expected. However, all officers in this study regardless of shift length demonstrated much higher levels of fatigue than the general population. Because cortisol release is negatively correlated to fatigue, we might expect to see a decrease in salivary cortisol with increasing levels of fatigue. Perhaps the findings that salivary cortisol levels were similar to control subjects throughout the day suggests that the intense training police officers undergo to manage potentially stressful situations mitigated any change in cortisol levels. Wirth et al. (2011) studied time-of-day shifts in officers and found that officers working a full week of evening or night shifts showed a dysregulation of cortisol compared with officers working daytime shifts. Our results do not show a dysregulation of cortisol, but rather show that officers working different shifts have cortisol levels consistent with the normal circadian rhythm values for the time of day. This suggests that while dysregulation of cortisol may occur over shorter durations of shift changes (Wirth et al., 2011), accommodation to changes in work shifts occurred over the 1st month in the present study and persisted through the 5th month.
Caffeine Intake
Caffeine intake was measured a posteriori in Month 6 of the study based on anecdotal feedback of officers working 13:20-hr shifts. While it could not be determined if 13:20-hr officers consumed more caffeine at the end of the 6-month study period than at the beginning, we could compare caffeine intake between precincts at the end of the study. Based on a study in long-haul pilots (Rosekind et al., 1994), we hypothesized that officers working 13:20-hr shifts would consume more caffeine during a workday than officers working 10-hr shifts. Pilots consumed more caffeine on flying days (M = 3.4 servings) than on nonflying days (M = 1.9 servings) because they were more tired. Like long-haul pilots, 13:20-hr officers have to maintain a heightened sense of vigilance for a longer period of time than 10-hr officers. They were also more fatigued.
Officers in the present study were asked to self-report the number of cups of coffee or tea, caffeinated sodas, or “energy drinks” they consumed on an average workday in the 6th month of the trial period. The results indicate that officers working 13:20-hr shifts consumed more coffee, tea, and caffeinated sodas than those working 10-hr shifts. There was no difference in the number of caffeinated “energy drinks” consumed between groups. Rosekind et al. (1994) reported that long-haul pilots consumed more caffeinated beverages early in the mornings on flight days, which was associated with earlier wake-up and duty times. While we did not ask the officers to record the time they consumed the caffeinated beverages, we speculate that they consumed more caffeine toward the end of their shifts. As the shift nears its end and officers get tired, they may be concerned about consuming an “energy drink” whose effect lasts for several hours and may hinder their ability to fall asleep a few hours after their shift. Therefore, it is likely that a smaller amount of caffeine would be consumed (e.g., coffee or caffeinated soda) toward the end of their shift.
Life Satisfaction
Few studies have systematically evaluated the effect of shift length on the QoL in police officers. Amendola et al. (2011c, 2011d) examined quality of “work life” and quality of “personal life” using a validated 456-item Law Enforcement Officer Survey of Work Attitudes, Personal Characteristics, Health, Safety, and Quality of Life inventory. They found no significant difference in the quality of personal life for officers working 8-, 10-, or 12-hr shifts. However, Cunningham (1981) found that police officers going from 8-hr shifts to 10-hr shifts significantly increased time spent with family and children, handling household (home) problems and chores, and socializing with family and friends. Results from chemical plant control room workers also demonstrate improved QoL measures when plant operators went from 8-hr shifts to 12-hr shifts (Lowden, Kecklund, Axelsson, & Akerstedt, 1998). The improvement was due to more days off, fewer types of shifts (i.e., rotating day, evening, and night shifts), and fewer “quick changes” between shifts (i.e., shortened time off between rotating shifts). Alternatively, Amendola et al. (2011c, 2011d) did find that the officer's quality of work life was significantly higher for those working 10-hr shifts than those working 8- or 12-hr shifts.
Ours is the first study to use the validated QOLI instrument to compare the QoL of officers working 10-hr shifts with officers working shifts longer than 12 hr. The QOLI considers 16 specific aspects of a person's life. For statistical purposes, we measured overall QoL and eight specific areas of life that we felt were most important to police officers: play, friends, children, health, work, helping, love, and home. QoL was determined in Month 6 of the 6-month trial at a time when the various facets of the officer's life would have adapted to the 13:20-hr shift, thereby eliminating a potential “honeymoon effect” of the shift change (Amendola et al., 2011d).
We found that overall QoL significantly decreased in officers working the 13:20-hr shifts compared with those working 10-hr shifts. In addition, there was a significant decrease in various subcategories of the officer's QoL, including play (leisure time activities to relax or improve yourself), friends (people [not relatives] you know and care for), children (how you get along with [your] children), health (being physically fit, not ill), work life (work duties, the money you earn, the people you work with), and helping (helping others in need, making your community a better place, volunteer work). There was a trend for scores in the areas of love (close romantic relationships) and home (your physical dwelling; how it looks, how big it is) to decrease as well, but they were not significant. It is possible that of all the areas of life measured, the areas of love and home are the most dear and last to suffer disruption; but that given enough time on extended shifts, even these areas of life would show significant decreases. Amendola et al. (2011d) reported that officers working 10-hr shifts, but not 12-hr shifts, had higher QoL than officers working 8-hr shifts. While some CWWs are associated with improvements in home and personal life, including increase leisure, personal, and family time (Amendola et al., 2011d), this is the first study to report on work shifts over 12 hr.
Work Performance
Few studies have determined the relationship between shift length and various work performance parameters. The present study looked at shooting qualifications, self-initiated calls, field interrogations, the number of arrests made (adult bookings), car accidents, PSB incidents, overtime, time off, and off-duty work.
Shooting qualifications (decision making)
Our results show no difference between precincts regarding shooting qualification pass rates. This finding is consistent with that of Amendola et al. (2011c, 2011d) who showed no difference in shooting qualifications for officers working 8-, 10-, or 12-hr shifts. The PVT data from the present study show that officers working 13:20-hr shifts had more lapses in concentration. However, they made fewer anticipatory errors than those working 10-hr shifts. Taken together, this suggests that regardless of how tired an officer may be, the use of a firearm is a serious matter, and the decision of whether to use it is not impaired by working longer shifts. Alternatively, officers may have taken the shooting qualifications after several days off, and therefore, were not fatigued.
Self-initiated calls
“Self-initiated calls” is an outcome measure recorded by the PPD as one indicator of work performance. Self-initiated calls (i.e., not initiated by dispatch) include subject and vehicle stops initiated by the officer and “other” self-initiated calls (i.e., stops in response to unusual activities observed by officer or in response to a citizen who stops an officer). In the present study, we saw a significant decrease in the total number of self-initiated calls in both precincts year-over-year. During the study period, officers working 10-hr shifts made more self-initiated calls than officers working 13:20-hr shifts. However, a similar difference was seen during the year prior to the study. It is unclear why officers in the control precinct made more calls each year, but it does not appear to be related to shift length. This conclusion is consistent with that of Amendola et al. (2011c, 2011d) and Cunningham (1981) who also showed no effect of shift length on the total number of self-initiated calls when officers switched from 8-hr shifts to 10- or 12-hr shifts. Unlike other studies, we also investigated the various types of self-initiated calls and found that there was a significant decrease in both subject and vehicle stops year-over-year in both precincts, while “other self-initiated calls” increased significantly in both precincts. However, none of these differences appear to be related to shift length.
Arrests (adult bookings) and field interrogations
Arrests and field interrogations are two other outcome measures recorded by the PPD as indicators of work performance. Our data show that the experimental precinct had significantly more arrests than the control precinct each month, not only during the 6-month study, but also each month during the same 6-month period in the prior year (Table 5). It is unclear why this would be the case as the precincts were selected, in part, because they had similar crime rates. Additionally, there was no difference in arrests per month year-over-year in the experimental precinct (other than January) when they worked either 13:20-hr shifts or 10-hr shifts (Table 6). Therefore, there does not appear to be a shift length effect related to arrests.
However, officers working 13:20-hr shifts made significantly more field interrogations than officers working 10-hr shifts throughout the trial period. While there is no clear explanation for this finding, it is possible that officers working 13:20-hr shifts found field interrogations (i.e., getting out of their patrol cars to make field contacts) a helpful way to stay awake and occupied during their long shifts. This is the first study to report the effect of extended shift length on work performance related to adult bookings and field interrogations.
Car accidents
The positive correlation between shift work and long work shifts with car accidents is well documented in industries such as transportation and health care by Wagstaff and Sigstad (2011) who found that both shift work and long working hours present a substantial detrimental effect on safety. They found a cumulative risk of having a car accident when working longer shifts, such that individuals working 12-hr shifts are twice as likely to be involved in a car accident as those working 8-hr shifts. Additionally, working nights increases the risk of an accident. However, Wagstaff and Sigstad (2011) found that working only nights may reduce the chances of accidents due to resynchronization. There was no clear indication that age or gender increases susceptibility or protects against the effects of shift work or extended shifts.
In the present study, the number of vehicular accidents increased year-over-year in the 13:20-hr precinct and decreased in the 10-hr precinct. However, the difference was not significant. This result is similar to Amendola et al. (2011c, 2011d) who showed no difference in driving performance of officers working 8-, 10-, or 12-hr shifts. However, Knauth (2007) observed a 13% increased risk for car accidents when working 10-hr shifts compared with 8-hr shifts, and a 27% increase when working 12-hr shifts.
It might be postulated that the increased risk for accidents correlates to increased fatigue. However, while officers working 13:20-hr shifts in the present study were more fatigued than those working 10-hr shifts, there was no difference in the number of accidents. Vila et al. (2000) found that individual officers with PSQI scores above a 9.0 were “substantially more likely” to be involved in a car accident. We were not able to determine the relationship between individual PSQI scores and officers having car accidents in the present study because the accident data were provided in aggregate form by the PPD.
PSB incidents, Category 1 and 2
Police officers spend much of their time interacting with the public. Based on the results of this study, officers working 13:20-hr shifts are more tired, show decreased cognitive ability, and have slower reaction times. Several studies show that increased shift length and sleep deprivation negatively impact neurobehavioral performance (Durmer & Dinges, 2005; Tucker et al., 2010; Vila, 2010). The consequences in neurobehavioral performance include decreased mood, cognitive performance, and motor functions, and impairment in memory, attention, and executive skills (organizing, planning, and cognitive efficiency). Therefore, it could be postulated that the public might view officers working longer shifts as more short-tempered and reactive. Alternatively, because the officers know that they are tired, they may be more deliberate and conservative in their responses.
One measure of the public's perception of police officers work performance may be reflected in complaints to the PSB. We measured the total number of complaints, the number of minor (Category 1) and major (Category 2) complaints, and the total number of officers involved in those complaints. Indeed, there was a significant increase in the total number of PSB complaints in the experimental precinct year-over-year, but no difference in the total number of complaints for the control precinct. The increased number of complaints in the 13:20-hr precinct reflects a significant increase in major complaints, which may result in a written reprimand, suspension, demotion, or termination. However, because the reason for the citizen complaints are unknown, we could not determine if the increased number of complaints was in any way related to officer fatigue. Additionally, significantly more officers were involved in each incident in the 13:20-hr precinct than in the 10-hr precinct. This may indicate a “herding effect” in which more officers respond to a call in an effort to back up one another, perhaps because they are more tired and want the support.
Overtime and time off
Few studies have compared overtime as it relates to shift length in police officers. Amendola et al. (2011d) reported that officers working 8-hr shifts work up to 5 times more overtime in a 2-week period (5.75 hr) than officers working 10-hr shifts (0.97 hr) and 3 times more than officers working 12-hr shifts (1.89 hr). However, Cunningham (1981) reported that officers on 10-hr shifts worked more overtime than those working 8-hr shifts. In the present study, there was no difference in the amount of overtime worked between the 10-hr and 13:20-hr precincts as a whole.
Similarly, there was no difference between precincts in regard to personal time off or vacation time. This is consistent with results reported by Amendola et al. (2011d). However, Cunningham (1981) reported that absenteeism was 3 times lower in those working 10-hr shifts than those working 8-hr shifts.
Off-duty work
One of the benefits of working three consecutive 13:20-hr shifts per week might be that officers have four consecutive days off. It also reduces the time spent commuting to and from work. With this “extra” time, officers have the opportunity to work off-duty to increase their income. Therefore, it might be postulated that officers in the 13:20-hr precinct would report more off-duty work than officers in the 10-hr precinct. However, in the present study, there was no difference in off-duty work between precincts. This finding is similar to that of Amendola et al. (2011c, 2011d) who found no difference in off-duty work hours for officers working 8-, 10-, and 12-hr shifts.
Shift Preference
Several studies have reported overwhelming officer preference for 10-hr shifts compared with either 8-hr or 12-hr shifts (Amendola et al., 2011d; Cunningham, 1982; Peacock, Glube, Miller, & Clune, 1983). Our study extends these finding by demonstrating that officers prefer 10-hr shifts over 13:20-hr shifts. This was evident prior to the study period (when officers knew what work shift they would have for the next 6 months), during the 6-month trial, and after all officers returned to 10-hr shifts. Before the trial, officers scheduled to move to the 13:20-hr shifts preferred the 13:20-hr shifts twice as much as those maintaining 10-hr shifts (28% vs. 14%, respectively). However, the larger percentage of 13:20-hr officers preferring the longer shifts may be biased due to the fact that they knew they would be working them for 6 months. However, at no time did more than 28% of the officers in either precinct indicate a preference for the longer shifts. After the 6-month trial, only 17% of the officers who worked the 13:20-hr shifts preferred them.
Prior to the 6-month study, fewer spouses/partners of the officers preferred the 13:20-hr shifts (7.1%) to the 10-hr shifts (16%). However, in the 6th month of the trial, more spouses/partners of the officers preferred the 13:20-hr shifts (33.3%) than the 10-hr shifts.
Limitations of Study
Amendola et al. (2011d) suggest that most studies investigating CWWs in police officers have been less than rigorous, suffering from inadequate study design, a limited number of participants, insufficient or subjective assessment instruments, and field limitations. This study sought to overcome these issues by employing a quasi-experimental, repeated-measures study design with pre- and posttrial measurements using validated measurement instruments. Additionally, 343 officers participated in the study, which allowed for appropriate statistical analysis.
However, there are still limitations to the extent that our results may be generalized. One of the limitations is that our results are based on average data from entire precincts. While the control and experimental precincts were not statistically different from each other, each precinct included officers who varied in age, years on the force, gender, the number and age of children living in the home, etc. We did not parse out the effects of each of these characteristics to determine if any of them had a greater influence on our results than others because it is unlikely that law enforcement departments would use these characteristics to determine shift length for individual officers. For example, we did not determine if age of the officer correlated with daytime dysfunction, reaction time, or preference for longer shifts. However, these factors may be important to study in the future. Therefore, while individual officer demographics may be factors in interpreting our results, the results presented are likely generalizable to most police departments.
Second, the trial period for our study lasted only 6 months. Some results showed tendencies toward statistical significance by the end of the 6-month trial. It may be that a longer trial period would yield more statistical differences. Alternatively, a longer trial period might allow officers to acclimate to the longer shifts, thereby reducing or even eliminating any differences between study groups. It appears, however, that our results are an extension of those of Amendola et al. (2011d) who showed that any benefits of working 10-hr shifts over 8-hr shifts did not extend to 12-hr shifts.
Another limitation relates to the sleep data collected. We did not ask officers to report any naps they may have taken during their shifts or after their shifts in addition to their regular “nighttime sleep.” Rosekind et al. (1994) report that “microsleeps” or planned rest time (up to 40 min) during long-haul flights improved pilots' alertness, reduced fatigue, and improved reaction time when measured at the end of the long flight. Anecdotal evidence suggests that some 13:20-hr officers took short naps during their shifts; however, there was still a significant difference in reaction times between shift groups at the end of their shifts. Considering the data of Rosekind et al. (1994), if police departments are considering extended shift lengths, they may also want to consider planned “rest time” for officers to improve performance. Additionally, officers were instructed to consider only workdays when completing the PSQI inventory. It is not known if sleep patterns were drastically altered on days off. This may limit the interpretation of our results.
Finally, it is not known if the knowledge that some officers were being assigned to 13:20-hr shifts biased their responses on any of the assessments. Several of the assessments (e.g., PSQI and QOLI) were self-reports and, therefore, could have been influenced. However, other assessments (e.g., PVT, cortisol, work performance data, etc.) could not be influenced by officer bias.
Conclusions
This is the first systematic study to investigate the effects of working more than 12-hr shifts on police officer's sleep, cognitive abilities, health, QoL, and work performance. Officers working 13:20-hr shifts experienced significant decreases in hours of sleep, overall quality of sleep, concentration, cognitive processing, and QoL. Significant increases were observed in fatigue, daytime dysfunction due to sleepiness, reaction time, anticipatory errors, and PSB complaints. There was no difference in most indices of work performance. When officers working 13:20-hr shifts returned to 10-hr shifts, all variables returned to baseline (prestudy) levels. Officers overwhelmingly preferred 10-hr shifts to 13:20-hr shifts. This study indicates that there are no apparent advantages but considerable liabilities associated with 13:20-hr shifts for police officers. This study of extreme shift length for law enforcement officers may provide needed data to inform decisions of policy makers (i.e., chiefs, unions, administrators, etc.) regarding work-shift length.
Footnotes
Acknowledgments
The authors thank the administrative support provided by Kelly Turcotte (Phoenix Police Department) and Karianne Schukei-Munstedt, Assistant Dean, College of Health Science. Commanders Benny Pina and Glen Gardner and Assistant Chief Chuck Miiller, Phoenix Police Department, supported the project and allowed officers time to participate in the study. More than 20 graduate students from Midwestern University assisted in data collection. Brian Vila, PhD, graciously provided design support and encouragement.
Declaration of Conflicting Interests
The authors declared no potential conflicts of interest with respect to the research, authorship, and/or publication of this article.
Funding
The authors disclosed receipt of the following financial support for the research, authorship, and/or publication of this article: Funding provided by the Phoenix Police Department and Midwestern University, College of Health Sciences (CHS Research Facilitation Grant and the Biomedical Sciences Program). Stoelting Publishers generously allowed the use of the STROOP test for this project.