




Abstract
The force factor method has garnered much attention and application in police use-of-force research, but the reliability of the method has yet to be intensively studied. Using official reports from the Seattle Police Department during a two-and-a-quarter-year period (n = 1,240), officer–suspect interactions were coded from the content of report narratives. Static force factors compared the maximum force applied by the officer with the maximum level of suspect resistance. Dynamic force factors were also recorded, including up to 10 iterations of dyadic action/reaction coded using the same coding scheme. The coding of force factors was completed independently by two teams working at different institutions in a fully crossed design. Evidence on the interrater reliability and subsequent utility of force factors is presented and discussed. Results indicate acceptable levels of agreement across coding teams and support the use of force factors as a central tool for studying asymmetrical social encounters and the proportionality of force.
Perhaps the greatest challenge facing police administrators and academics at present is the apparent disconnect between police and public perceptions of police behavior. Although this disconnect spans many domains, such as racially biased policing, intelligence gathering related to homeland security, and the use of unmanned aerial vehicles or “drones,” nowhere is this problem more acute than with regard to police use of force. Police administrative data generally do not help the problem. For example, statistical reports of police administrative data tend to tell a benign story: Use of force is a statistically rare event; when it happens, levels of force are relatively low (Alpert & Dunham, 2004); suspect demeanor tends to outweigh any effect of race (Klinger, 1994; though see Terrill & Mastrofski, 2002); and citizen complaints about police use of force are not typically sustained (Hickman & Piquero, 2009). In sharp contrast to the story told by police administrative data, the public tends to have a very different view of police use of force: The police routinely use force (Weitzer, 1999); the level of force is often excessive (Worden, 1996); police target minority citizens (Decker & Wagner, 1985); and the police do an inadequate job of policing themselves when reviewing force incidents and citizen complaints (Maxson, Hennigan, & Sloane, 2003).
Part of the problem is that police administrative databases rarely, if ever, collect on a systematic basis the type of information necessary to understand the true nature of police–citizen interactions that involve the use of force by police (Lawrence, 2000). Notwithstanding, it may be possible for police administrators and academics to bridge the gap between perceptions and achieve some kind of shared consensus if the police can produce adequate data and competent analysts explore the complex dynamics of social encounters between police and the public.
Although social encounters between police and the public are frequent, they are often difficult to understand and interpret. More than 50 years ago, Erving Goffman (1956, 1961) provided a working description of social encounters and explained them as rules of conduct for individuals to interact with each other in ways that are generally accepted. Goffman (1956) dissected encounters and developed symmetrical and asymmetrical rules. Symmetrical rules refer to the common courtesy as a part of the social contract that manifests itself in the form of routine expectations and obligations, such as how one actor perceives procedural justice during and after an encounter, a natural consequence of these rules (Groves, 2013). Asymmetrical rules are those that lead an individual to treat and be treated by another differently from the way he or she is treated and treats the other. To understand Goffman’s model, consider a police officer who gives orders but does not expect to receive them. Given the position of police in society, their relationship with the vast majority of citizens is inherently asymmetrical.
In the real world, not all individuals accept their predetermined roles, expectations, and obligations. For example, when deference is not accepted or breaks down, encounters do not proceed as expected or predicted (Goffman, 1959). Transgressions against the symmetrical rule within the realm of the social contract can result in violence, which Collins (2009) suggests is often shaped by fear and tension. Using the example of police–citizen encounters, police are the order-givers and suspects the order-takers (Collins, 2005). Order-givers are in charge of the front-stage performance, taking the initiative to guide how the interaction plays out. Order-takers are expected to take cues from the order-givers and adhere to the script of the ritual. Given the coercive nature of the script, we anticipate the order-taker to respond with signs of fear and perhaps hatred toward the order-giver (Kemper, 2011). Unlike many other types of encounters, Collins (2005) explains that power rituals may operate on a microinteractional level, but results reach beyond the immediate actors and into the larger social environment. His point can be understood by looking at the impact of and community reaction to the beatings of Rodney King, Kelly Thomas, Amadou Diallo, and Abner Louima, and more recently, Walter Scott, Freddie Gray, and Mario Valencia.
These microlevel incidents have the potential to create predetermined negative dispositions from citizens when confronted by police. In any confrontation, especially police–citizen encounters, the actors interpret and decide how to respond to one another; these interpretations and responses are often shaped by demeanor (Sun & Payne, 2004; Terrill & Mastrofski, 2002). Underlying demeanor is the interaction ritual of emotional energy. Durkheim (1951) and Goffman (1961) explain the levels of emotions that exist during an encounter and focus on the ways they can explode in the face of drama, fear, terror, or anger, which can transform the interaction ritual (Collins, 2005). These quick changes in emotion may produce a “hero versus hero” scenario wherein neither party is invalidated in their emotional response, but neither is correct (Collins, 2009). When these emotions exist in an encounter, officers can resort to force or a suspect can physically resist the rational-legal authority when either actor deviates from the interaction ritual script. To apply the interaction ritual to a policing scenario, an officer must make decisions about controlling a suspect by following protocol, weighing options and outcomes, as well as making an objectively reasonable assessment about risk within the limitations of information available in a real-time encounter (Council of Canadian Academies and Canadian Academy of Health Sciences, 2013).
In this study, we examine a promising method of analyzing social encounters in the context of police use of force – the force factor method (Alpert & Dunham, 1997). While this method is promising in capturing the emotional energy that is produced during a use-of-force encounter, it needs to be subjected to rigorous study of methodological reliability. In the next section, we review briefly the literature on police use of force with an eye toward the theoretical work underpinning the study of situations that give rise to potentially violent interactions between citizens and the police. We review the force factor method and related research and argue that this method should be subjected to assessments of reliability to advance research and practice in this area. In subsequent sections, we present our data and methods, analyses, and conclusions.
Literature Review
Studies of police use of force are varied and use divergent methodologies, theoretical explanations, and statistical techniques. Although there is great variability among studies, all require an operational definition of police use of force and a conceptual framework concerning its use. Recent use-of-force studies acknowledge that disparities exist in measuring use of force (Bazley, Lersch, & Mieczkowski, 2007; Garner, Maxwell, & Heraux, 2002; Rojek, Alpert, & Smith, 2012), which has been measured in a wide variety of ways (Alpert & Smith,1999; Hickman, Piquero, & Garner, 2008). Use of force can be studied through observations (Worden & McLean, 2014), citizen complaints (Brandl, Stroshine, & Frank, 2001; Hickman & Piquero, 2009), self-reports (Garner & Maxwell, 1999), or official agency records (Alpert, Dunham, & MacDonald, 2004). Due to the operational and measurement differences, it is difficult to interpret the findings across studies and come to a consensus about the many nuances of police use of force, especially when a goal of this body of research is to create reliable, intersubjective agreement about the use of force (Adams, 1999).
Multiple theoretical approaches are used to explain police use of force, including organizational, psychological, and social interaction theories. Organizational theories use administrative characteristics and expectations (i.e., structure, culture, and policies) to explain departmental rates of force (Hickman & Piquero, 2009; Terrill & Paoline, 2013; Worden, 1996). The psychological perspective argues that officers with certain characteristics are inclined to use force more than other officers (Brandl & Stroshine, 2013; Walker, Alpert, & Kenney, 2001). Social interaction theories look at actions of officers and suspects to explain use-of-force incidents (Klinger, 1994; Wu, Sun, & Triplett, 2009; though see Terrill & Mastrofski, 2002).
Rituals of social interaction are critical mechanisms in explaining the process of conflict and domination (Collins, 2005). Durkheim (1951) argued that the social interaction rituals provide a basis for a situation that includes interpersonal exchanges. Within interpersonal exchanges, goals of conflict are formed by the pattern of the social ritual as well as the presence of symbols and the social sentiments that they embody (Collins, 2005). For example, a social interaction ritual can be constructed in a police–citizen encounter through an officer’s appearance, rational-legal authority, and the natural animus between the order-giving officer and order-taking citizen. The social interaction ritual has been used to explain deference in social interactions (Goffman, 1959), including police–citizen encounters. These encounters are driven by situational behaviors such as antagonism, disrespect, and hostility and if not managed properly, can lead to a physical response by an actor (Black, 1976; Engel, 2003; Turk, 1969; Wu et al., 2009).
Sykes and Clark’s (1975) theory of deference exchange aligns with Goffman’s understanding of encounters, arguing that in police–citizen encounters, there is an asymmetry based on the unequal status of the participants. The disparate relationship among the actors and the act of a citizen refusing to respect the officer’s authority may result in a suspect refusing to comply with an officer’s commands. It may be that a citizen neither recognizes nor accepts the legitimacy of a police officer, and their disrespect or resistance symbolizes their perceptions of injustice (Tyler, 1990). Sykes and Clark’s (1975) conceptual framework helps us understand deference in police and citizen interactions. Authority maintenance theory (Alpert & Dunham, 2004) focuses on not only deference but also other forms of behavior on the deference-resistance continuum.
Authority maintenance theory (Alpert & Dunham, 2004) reasons that social rituals are used to define day-to-day interactions through which one actor shows respect for another. Focusing specifically on routine police and citizen encounters, officers exercise authority and citizens submit to that authority. These encounters can be defined as rituals of authority maintenance. Within these rituals, one seeks to ensure that their self-concept remains intact and that the other actors are able to anticipate expectations or predict behavior during an encounter (Goffman, 1959). There is an expectation of reciprocity by those over whom the power is being exercised (Weber, 1946). As noted, deference is only one response to authority; authority maintenance theory accounts for other responses, such as physical resistance. For example, a suspect ignoring a police command is showing a lack of deference and exercising a mild form of resistance (Terrill, 2003). A suspect who draws a weapon on a police officer is exercising more than a lack of deference, and so too is the suspect using active resistance (Bazley et al., 2007). Thus, authority maintenance theory uses a broader range of behaviors to explain police and citizen interactions.
Regardless of the investigative technique, methodology, or the theoretical framework used to understand police use of force, it is an infrequent event. In fact, use-of-force incidents make up approximately 0.4% of all dispatched calls for service (Henriquez, 1999). In addition to being rare, a small number of officers use force disproportionately to other officers (Walker et al., 2001; Worden & Catlin, 2002). When use-of-force incidents occur, injuries are often minor, and suspects are more likely to be injured than officers (Paoline, Terrill, & Ingram, 2012; Taylor & Woods, 2010). Although these interaction rules are marked by maintenance of symmetrical and asymmetrical rules and make up the majority of police–citizen encounters, one is left to wonder: What about unusual encounters marked by broken deference and suspect rejection of asymmetrical rules that lead to the use of force? Collins (2009) suggests that there is a natural, confrontational tension that results in all situations of potential violence. This confrontational tension in an encounter is also marked by emotional energy, a dynamic concept that can escalate and de-escalate quickly and repeatedly (Collins, 2005). Thus, in a police–citizen encounter that involves physical force, we would expect to see levels of force and resistance to fluctuate based on the level of emotional energy at any given moment. It follows, then, that research on these unique encounters should take into consideration each iteration of action as defined by the confrontational tension and emotional energy at any given moment.
Many use-of-force continua account only for the officer’s actions, whereas the force factor accounts for the escalation and de-escalation of force and resistance during a use-of-force encounter for both officer and suspect. Using a method that allows the analyst to move up and down a scale when defining police and suspect interactions will tell a more intricate story about a use-of-force encounter, unlike a continuum that only goes up and looks exclusively at the highest level of force used, or only accounts for the officers’ actions.
Furthermore, this method should create a reliable and consistent measure of force when coding encounters within a department. Reliability is an important consideration when using multiple reviews and encounters and is also important when it comes to transparency (Bachman & Schutt, 2013). Because the labor of research is often divided among multiple personnel, it is a necessary and standard research practice to quantify the degree of agreement among those involved in coding data (i.e., interrater reliability) for purposes of establishing the reliability of measurement as well as subsequent conclusions about the internal validity of a study. This is absolutely critical when the measurements are unique or relatively new; however, it is also important that as a particular measurement scheme evolves and becomes more standardized, the literature reporting use of that particular technique creates a foundation for measurement decisions. As assessments of reliability accumulate, researchers gain greater confidence in the technique and begin to refer to the established literature on the reliability of the technique. Too often, reliability assessments (if even reported) are simply relegated to footnotes. This may be appropriate with well-established and more fully developed techniques, but with relatively new techniques, methodological concerns are substantively important.
In the present case, we believe the force factor method remains at an early stage in this development process. In particular, a fully crossed design in which all cases are coded by separate, independent coders speaks not only to the reliability of the technique within a particular study but also to the ability to replicate studies by others using the same raw materials. The force factor was developed, in part, to address the issue of consistency as well as to provide coders and officers alike a way to understand what level of force is “reasonably necessary” (Alpert & Smith, 1994). Thus, in light of the divergent methodologies used to evaluate the use of force, reliability is of great importance to draw the most accurate conclusions.
Some previous research has used the force factor and explained its promise, utility, and reliability. Wolf, Mesloh, and Henych (2008) noted the force factor could be easily incorporated by police managers to understand better the use-of-force incidents by using a consistent and reliable method. Terrill (2005) voiced similar positive sentiments, noting that appropriateness of force is well understood when viewed as a proportionate and incremental process through the force factor and demonstrated the benefits of this approach using observational data. Terrill, Alpert, Dunham, and Smith (2003) note that the force factor is helpful in determining “objectively reasonable” uses of force, which is a difficult task. Alpert and Smith (1994) were cognizant of this, arguing that “subjective objectivity” is the essence of the “reasonable person.” In addition and outside of the force factor method, Terrill (2001, 2003, 2005) has contributed to police use-of-force research measuring police use of force relative to suspect resistance. More directly to the quantitative aspects of reliability, Stewart (2013) recently examined the interrater reliability of force factors in a small study of police use-of-force incidents in Portland, Oregon (n = 182), and reported relatively strong reliabilities in iterative force factors.
The force factor has also been helpful in addressing gendered differences in explaining suspect resistance (Bazley et al., 2007) and as an Early Warning System tool in addressing officers who have been involved in excessive force incidents (Bazley, Mieczkowski, & Lersch, 2009). Particular to suspect resistance, MacDonald, Manz, Alpert, and Dunham (2003) found the relative amount of force exercised by the police was greatest in less threatening types of offenses. Terrill (2003) came to somewhat similar conclusions, in that suspects were unlikely to exercise resistance, but when multiple or high levels of resistance were exercised, force frequency increases substantially.
Given the promise of the force factor research in evaluating police use-of-force incidents, which tend to rely on the officers’ post hoc account of the encounter (Rojek et al., 2012), practitioners, such as the New Orleans Consent Decree Monitor, have adopted the force factor method. For both researchers and practitioners, the ability to reliably code police use of force would also make it easier to compare use-of-force patterns across departments. This is presently a difficult endeavor, given the lack of structure wherein police departments measure use of force (Hickman et al., 2008). Other research using methods analogous to the force factor have come to similar conclusions about the issue of suspect resistance relative to police use of force, as well as the importance of reliability in coding reports (Leinfelt, 2005; Lersch, Bazley, Mieczkowski, & Childs, 2008; Terrill, Leinfelt,& Kwak, 2008).
These studies have largely concluded that there is validity and reliability in applying the force factor to the department(s) under study. Furthermore, in light of the prior studies that have used the force factor or similar methods, additional benefits to agencies may include improved analysis on the use of force, consistency and reliability, a more structured debriefing process and improved risk assessment tools. Notwithstanding, while a number of these studies have used the force factor, the ability of multiple coders successfully analyzing police reports consistently has yet to have been rigorously tested, an important consideration for multiple practitioners attempting to analyze objectively an encounter. The force factor method may have additional benefits to the public as well, given the method seeks to reduce injuries to both police and suspects (Worrall & Schmalleger, 2015). Given the promise and utility of the force factor and the difficulties associated with the “reasonable person” and suspect resistance, the purpose of this study is to comprehensively evaluate a series of use-of-force incidents using the force factor method and to determine whether this method is reliable using two independent groups of analysts working independently to assess the same pool of cases.
Data and Methods
The data are drawn from official use-of-force reports of the Seattle Police Department (SPD). The researchers were provided with a series of PDF files containing scanned images of SPD use of force reporting forms and related documents covering a two-and-a-quarter-year period (January 1, 2009 through March 25, 2011), 1,240 records in all. These data were obtained for the purpose of attempting to replicate use-of-force findings reported in a recent “pattern or practice” investigation of the SPD (U.S. Department of Justice, Civil Rights Division, 2011) and for other research purposes (Hickman & Atherley, 2012). Data for this study were coded from the content of the official SPD use-of-force reports. Each report included officer identifier information, suspect demographic information, a categorization of the type of suspect resistance, and how force was applied as well as information about location, booking, injuries, and evidence of impairment or suspected impairment. The first four pages of these reports (more if supplemental forms are required) comprise entries and check boxes that were coded into a computer database using a numeric coding system. The remainder of the report packet varied depending on the presence of supplemental documentation, report narratives, photographs, Washington Crime Information Center reports, Labor and Industry claim forms, and Computer Aided Dispatch call logs as well as routing information and other administrative documentation. These data fields were entered as they appeared in the record.
Suspect Resistance and Officer Force Levels.

For each record in the dataset, a static force factor was calculated. This compares the maximum force applied by the officer to the maximum level of resistance (i.e., officer force level minus suspect resistance level) and takes on numeric values ranging from −5 to 5. For example, if the maximum level of suspect resistance was “Resistance 4,” and that was met with a comparable level of officer force (“Force 4”), this would result in a static force factor equal to 0, indicating a proportional response. If the officer used a higher level of force (e.g., Force 5), then the corresponding force factor would be equal to +1, indicating the officer used one level of force higher than the degree of suspect resistance; conversely, if the officer used a lower level of force (e.g., Force 3), the force factor would be equal to −1.
In addition to the static indicator of maximum force and resistance, dynamic force factors were also coded throughout the force incident. Researchers coded up to 10 iterations of dyadic action/reaction using the same coding scheme as was used to code the static force factor. This helps to assess how force incidents evolve from the perspective of the officer and provides a dynamic overview of the incident from start to finish. Where multiple officers or suspects were involved, their actions were represented as a composite.
Weapon draws are a problematic area in use-of-force research. Some parties contend that a weapon draw is a use of force (Worden, 1996), while others contend that it is at most a threat of force (see Collins v. Nagle, 1989), and still others argue either side depending on the circumstances (White & Ready, 2007) under which the officer drew her weapon and the motives of the officer with regard to safety. 2 From a legal perspective, courts have upheld the right of officers to protect themselves against unknown or potentially threatening situations by drawing and pointing a firearm when it is reasonable to do so. Civil rights organizations, such as the American Civil Liberties Union, contend that the drawing and the pointing of a firearm at a subject is an application of force in itself and should be reported whenever it occurs. As there is no definitive guidance on the reporting of firearms as “cover” or with the intention to discharge the weapon, agencies across the country employ different standards.
During the study period, SPD officers did not report weapon draws consistently and were not required to do so. In fact, one author of this study was on scene at one of the use-of-force incidents that occurred during the study period, as a ride-along observer on unrelated field research. In that incident, there was a weapon drawn and pointed at the suspect that went unreported in the subsequent use-of-force report. Sometimes, there are references in the reports to other officers providing “lethal cover,” or references are made to “felony stop” or “high-risk stop” procedures. Insofar as weapon draws were not consistently reported, we were faced with a substantial measurement problem. Ultimately, the decision was made not to record weapon draws because we could not be confident that we were capturing their true incidence and because SPD did not keep track of pointing guns.
Lethal force, for the purposes of this study, was coded only when the officer used an impact weapon on an area of the body with potential to cause lethal injury (such as a head strike), used a carotid artery hold/restraint, or discharged a firearm.
An additional limitation is that these official officer reports of incidents involving force could in theory include only those incidents that rose to a particular reporting threshold per policy at the time of study (Force level 3, see Table 1). Thus, we must acknowledge that an unknown number of incidents that rose only to lower levels may not be captured in the present data. In contrast, some incidents in which lower levels of force were used were in fact reported; this may have been for other reasons that could have triggered a report, such as citizen injury.
As previously mentioned, the primary purpose of this study is to determine if the force factor method as described earlier is reliable, using two independent groups of raters. While the question of reliability is important, equally important is determining the appropriate methods of assessing interrater reliability. In the present case, this is a fully crossed design (where all of the cases are rated by different coders, rather than subsets of cases rated by different coders). We will use descriptive statistics for the joint distributions of coding, appropriate correlation coefficients given the levels of measurement, as well as some graphical methods, but we will rely most heavily on two appropriate and common statistics, Cohen’s kappa, and the intraclass correlation (ICC).
Importantly, while Cohen’s kappa is focused on absolute agreement between coders, it does correct for the amount of interrater agreement that would be expected by chance. Structurally, kappa is the difference between the observed probability of agreement and the expected probability of agreement by chance (calculated from the marginals), divided by the expected probability of nonagreement. Thus, kappa essentially relates agreement between raters beyond chance expectations as a proportion of the expected nonagreement. Kappa can range from −1 to 1, where −1 indicates absolute disagreement, 0 indicates agreement at random, and 1 indicates absolute agreement. There are some guidelines available for common qualitative interpretations of the value of kappa (Landis & Koch, 1977).
The ICC is also appropriate for the type of data we are analyzing and may be the most appropriate measure of reliability in that it considers the magnitude of disagreement such that larger disagreements result in lower values of ICC than smaller disagreements (Hallgren, 2012). ICCs range from a value of 1 (perfect agreement), through zero (random agreement), into negative values (increasingly greater disagreement). There are some data considerations with ICCs, and in the present case, the two-way mixed, consistency, average-measures ICC is optimal (Hallgren, 2012). Like Cohen’s kappa, there are also some guidelines available for common qualitative interpretations of the value of the ICC (Cicchetti, 1994).
Analysis
The analysis will begin with an overview of use of force in Seattle, providing some general background on the incidence of force, as well as the nature of the underlying incidents, suspect characteristics, and officer characteristics. We will then present analyses of the force factors, as coded by both teams, to examine the reliability of the method. Our analytic methods will include basic descriptive statistical analysis as well as common measures of interrater reliability (e.g., Cohen’s Kappa), measures of association, t tests, and graphical methods.
Overview of Use of Force in Seattle
Arrest-Based Rates of Use of Force in Seattle During Study Period.
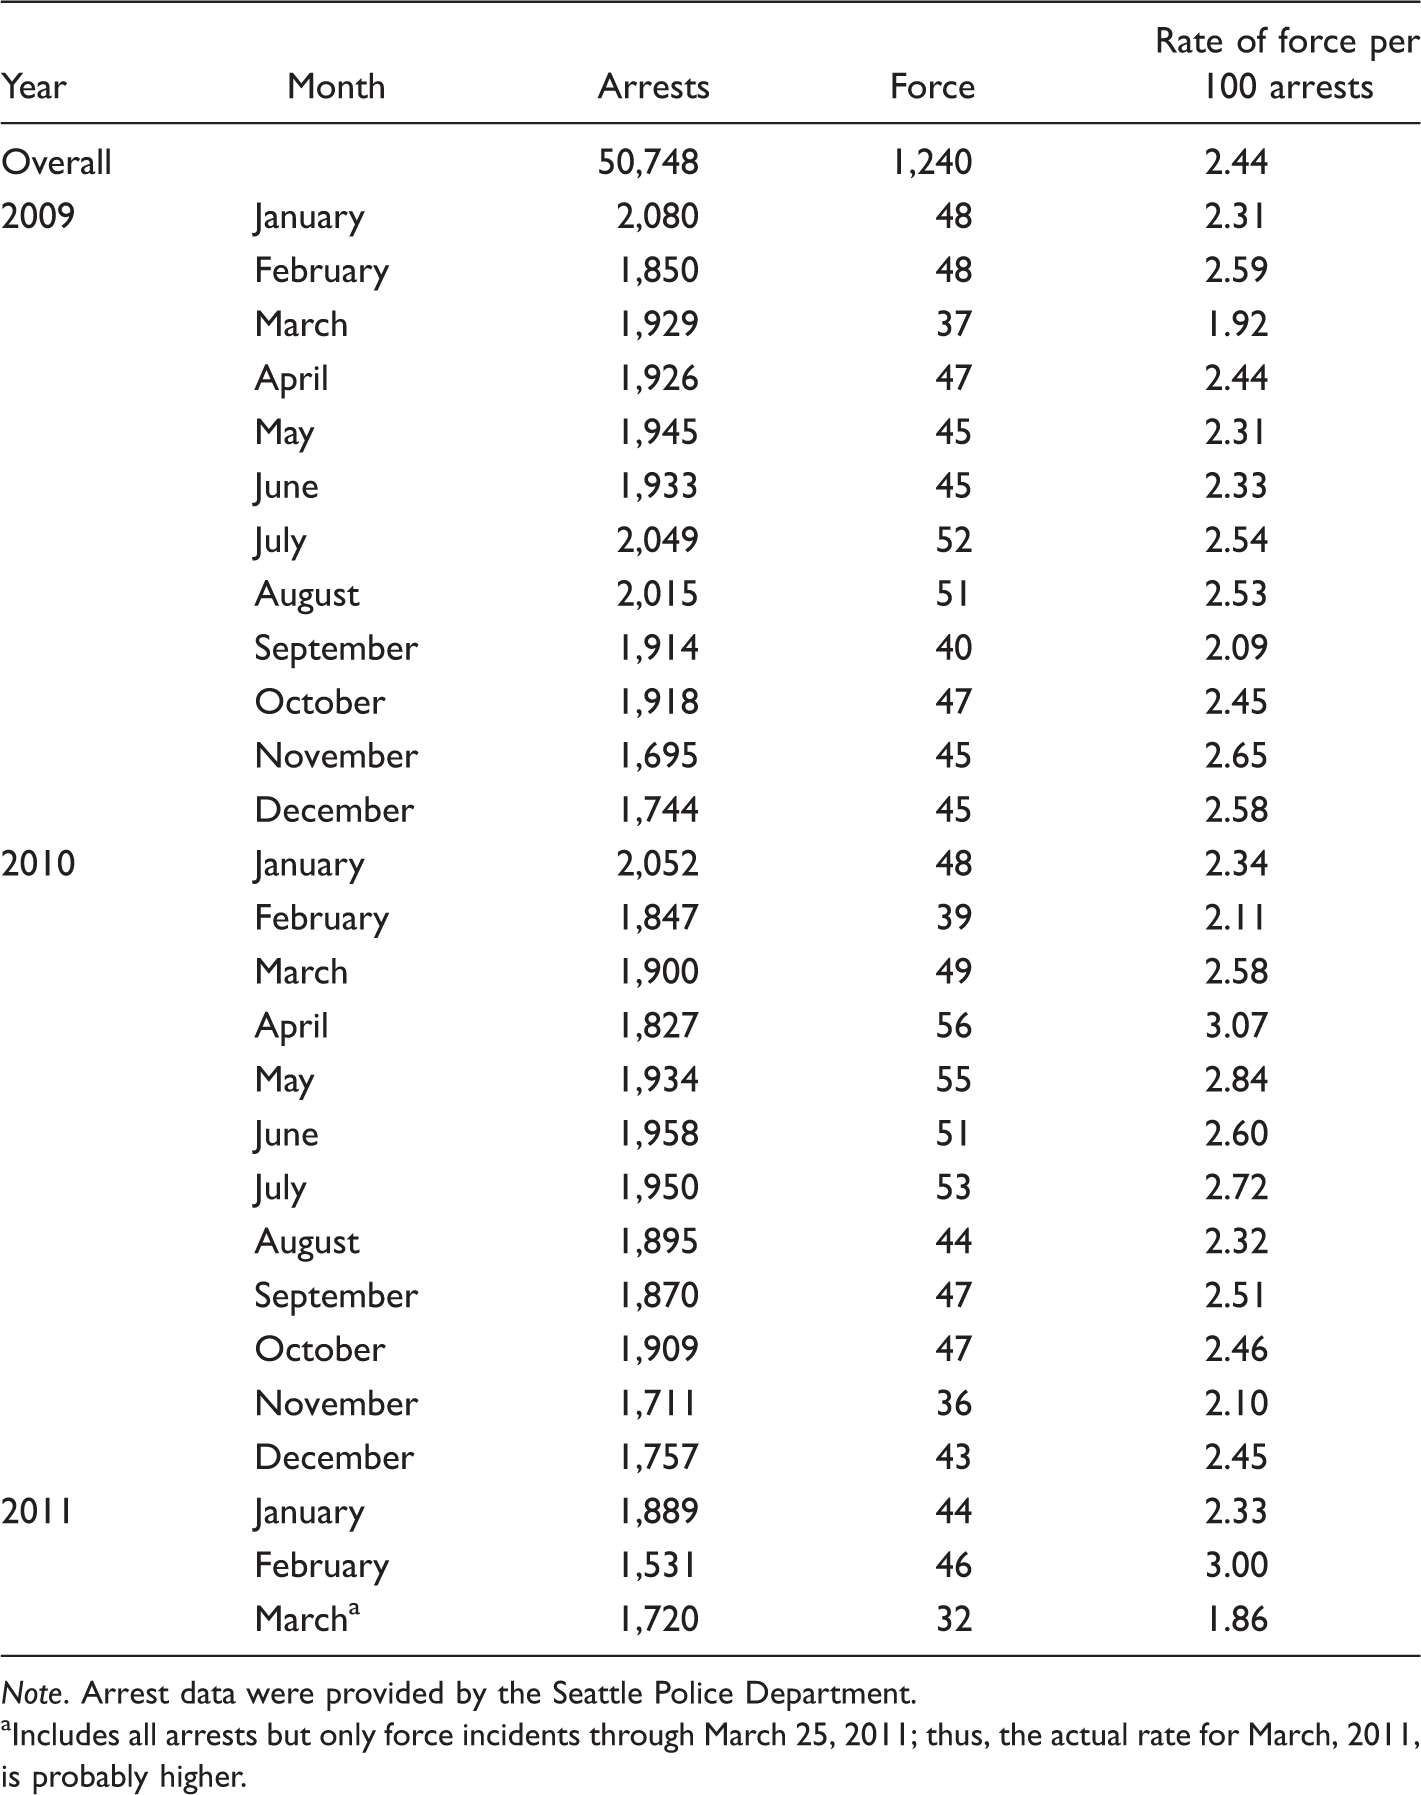
Note. Arrest data were provided by the Seattle Police Department.
Includes all arrests but only force incidents through March 25, 2011; thus, the actual rate for March, 2011, is probably higher.
Use of force is more frequent on weekends, and during the late evening/early morning hours. The SPD has five precincts, and the West Precinct (which covers the downtown core) has the largest share of use-of-force incidents, with about one in three uses of force reported in that precinct.
Nature of incident
Officers indicated the type of incident on the use of force reporting forms, describing the general nature of the dispatched call or on-view incident, as well as associated incident characteristics. Forty percent of the incidents were reported as involving some type of felony matter, and fights or disturbances were indicated in 30% of incidents. About one in five involved violent crimes or were drug related. Eighteen percent were characterized as involving mental/suicidal suspects. Domestic violence was indicated in 15% of use-of-force incidents.
Suspect characteristics
Most force incidents (94%) involved a single subject upon whom force was applied. The median age for all suspects was 29 years, they were most frequently male (87%), and most frequently White (45%) or Black (40%). The race distribution for suspects in use-of-force incidents was roughly equivalent to the race distribution for all arrestees during the study period. Half of suspects exhibited signs of intoxication (either drugs or alcohol), and nearly three in 10 exhibited signs of mental illness or were suicidal or delusional. Suspects fled from officers in about one quarter of incidents. Suspects complained of injury in about half (51%) of incidents.
Officer characteristics
About eight in 10 use-of-force incidents involved either one (48%) or two (33%) officers who used force on suspects. Overall, the 1,240 incidents involved 650 officers who used force, one third of whom were involved in a single use-of-force incident during the study period. Thirty-one officers (about 5% of all officers involved in use-of-force incidents) were involved in 10 or more incidents during the study period as either first responding officers or as backing officers, including three officers (about 0.5%) who were involved in 20 or more incidents. The most frequently reported tactics were hands, elbows, and arms (used in 80% of incidents), followed by feet, knees, and legs (28%), and Tasers (23%). Less frequently reported were OC spray (7%), batons (4%), and canines (3%).
Force Factors
Static force factors
Maximum Level of Officer Force, by Coding Team.
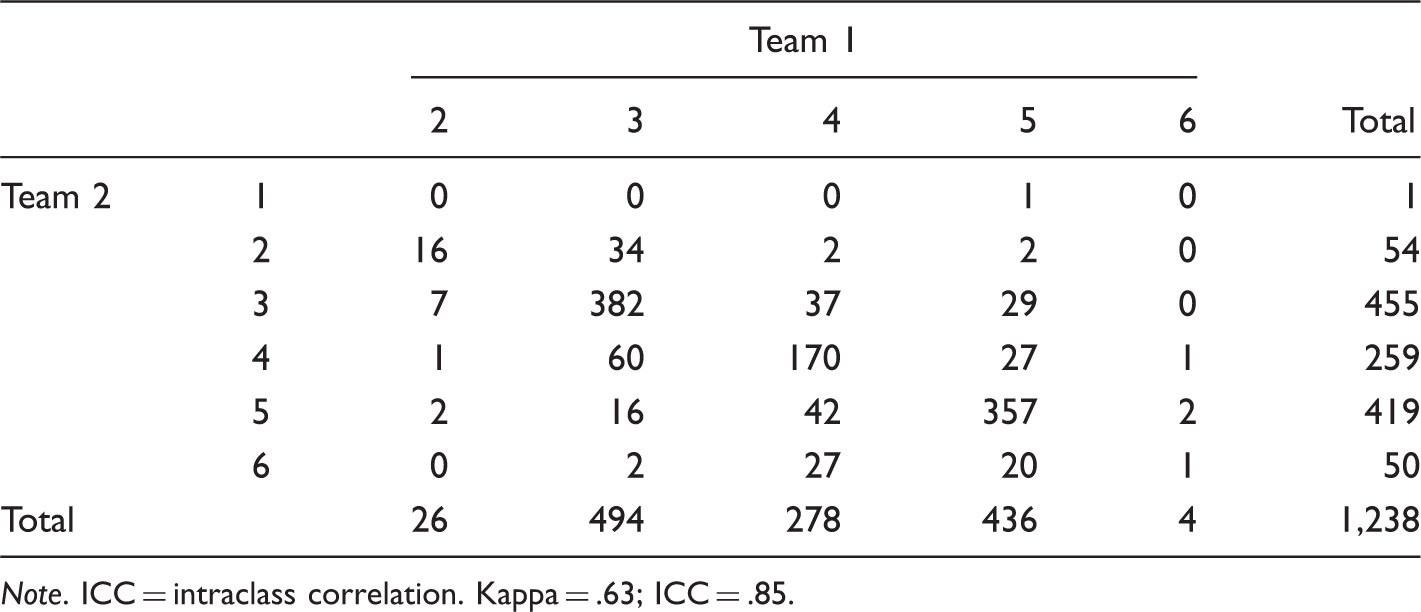
Note. ICC = intraclass correlation. Kappa = .63; ICC = .85.
Maximum Level of Suspect Resistance, by Coding Team.
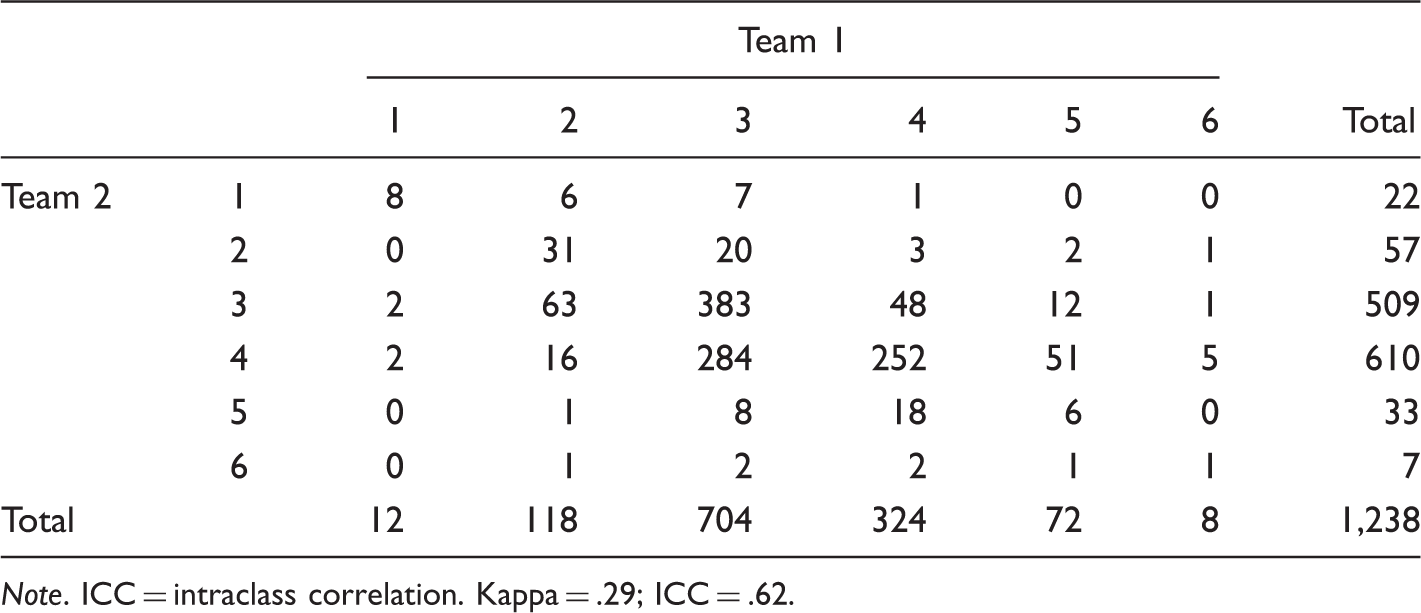
Note. ICC = intraclass correlation. Kappa = .29; ICC = .62.
Resulting Static Force Factors (Calculated), by Coding Team.
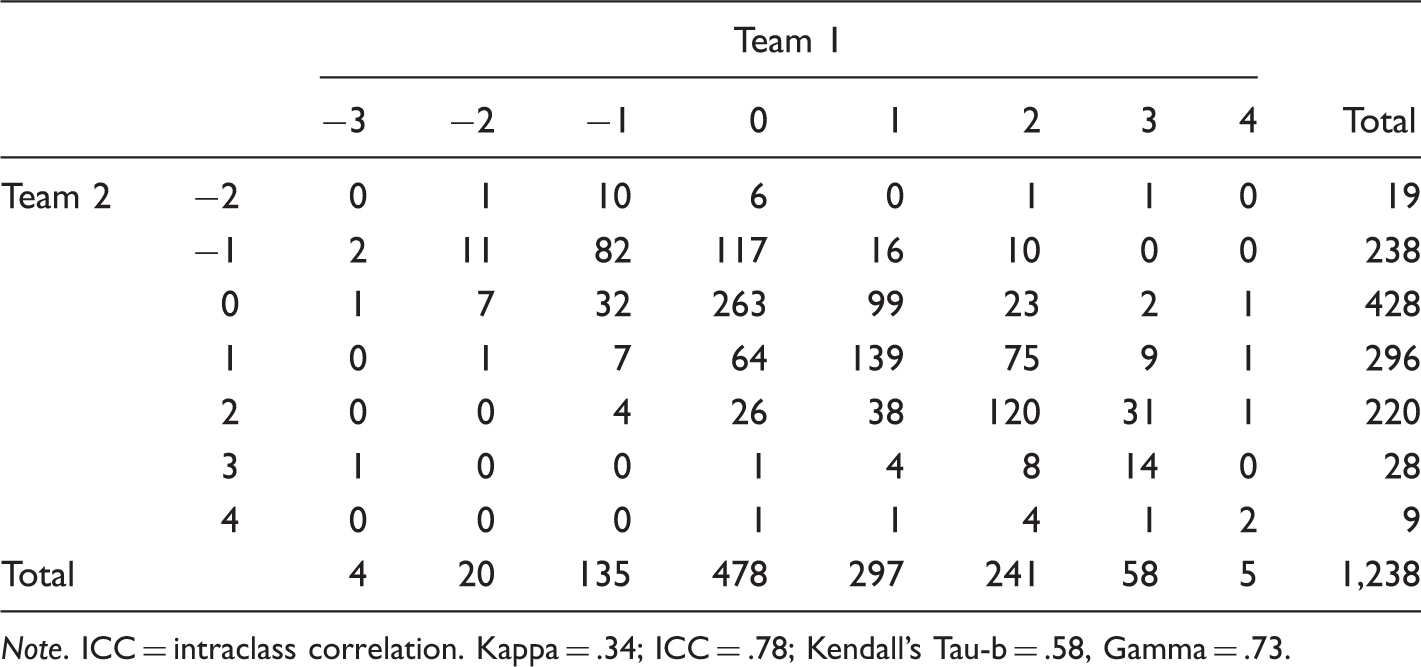
Note. ICC = intraclass correlation. Kappa = .34; ICC = .78; Kendall’s Tau-b = .58, Gamma = .73.
Dynamic force factors
As previously mentioned, dynamic force factors were also coded for up to 10 iterations of dyadic action/reaction using the same coding scheme that was used to code the static force factor. Overall, there was generally good agreement between the two coding teams in terms of the number of dyadic iterations. The distribution of use-of-force cases by the number of dyadic iterations is shown in Figure 1. Both teams found that the vast majority of cases terminate between iterations 3 and 5, where emotional energy is likely to influence an encounter and where levels of agreement are high. However, in encounters that involved six or more iterations of action, reliability between teams decreased. In the aggregate, it appears that the general form of the distribution is similar for both coding teams with most cases involving three or four iterations, and fewer than 50 cases (i.e., less than 4%) having eight or more iterations; however, Team 1’s distribution peaks earlier than Team 2’s. The average number of iterations in use-of-force incidents coded by Team 1 was equal to 3.9 (Mdn = 3), and for Team 2 was equal to 4.3 (Mdn = 4). A paired samples t test for the mean difference of 0.4 was significant (t = −6.1, p < .001), suggesting that, on average, Team 1 might be expected to code slightly fewer dyadic iterations per incident than Team 2. This could be a result of the smaller size of Team 1.
Force incidents by number of dyadic iterations.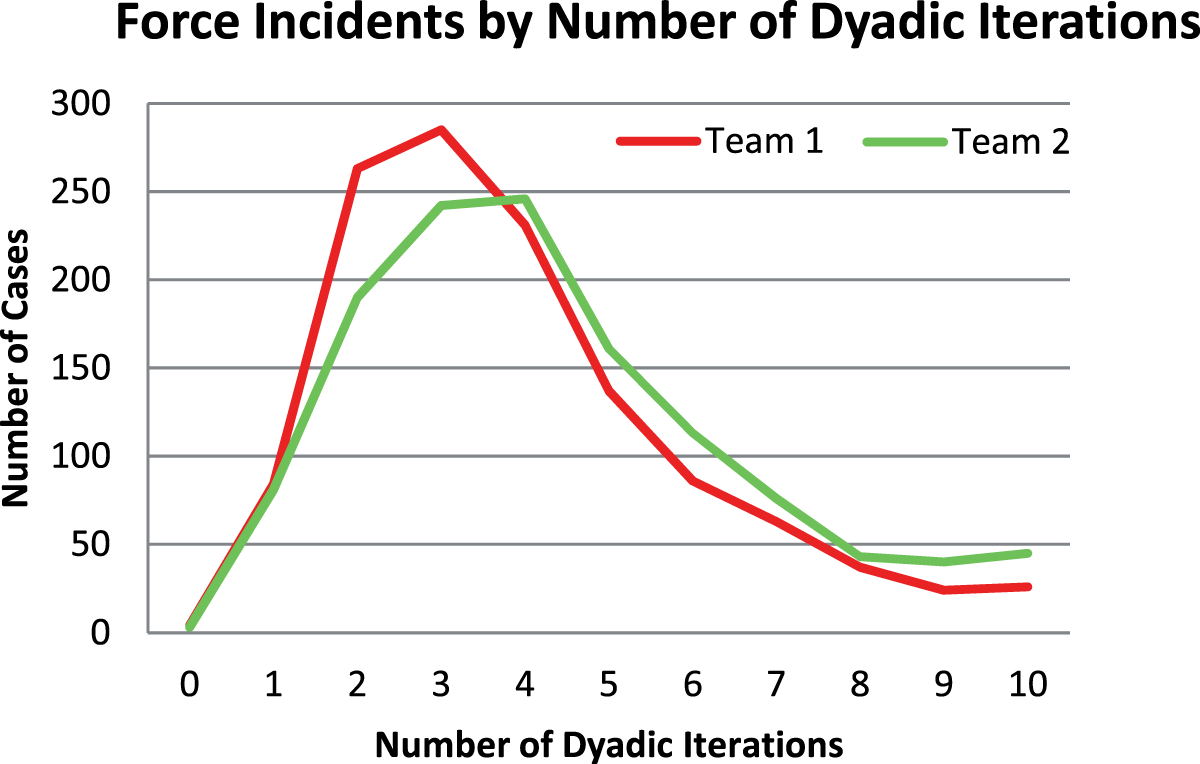
On a case-by-case basis, the distribution of differences between Team 1’s and Team 2’s coding of dyadic iterations is instructive. Figure 2 shows this distribution, where the value is equal to the number of iterations coded by Team 1 minus the number of iterations coded by Team 2 for a given case. There was perfect agreement in 16.8% of the cases, but almost half (45.3%) fell within the range of ±1 iteration. Expanding the range, there was agreement in about two thirds of cases (68.1%) at ±2 iterations, 83.1% at ±3 iterations, and 92.5% at ±4 iterations. Pearson’s r is equal to .33, suggesting a relatively modest correlation between the numbers of iterations in use-of-force cases, as coded by the two teams. It is important to also note the somewhat normal distribution of differences between coding teams.
Distribution of differences in number of dyadic iterations.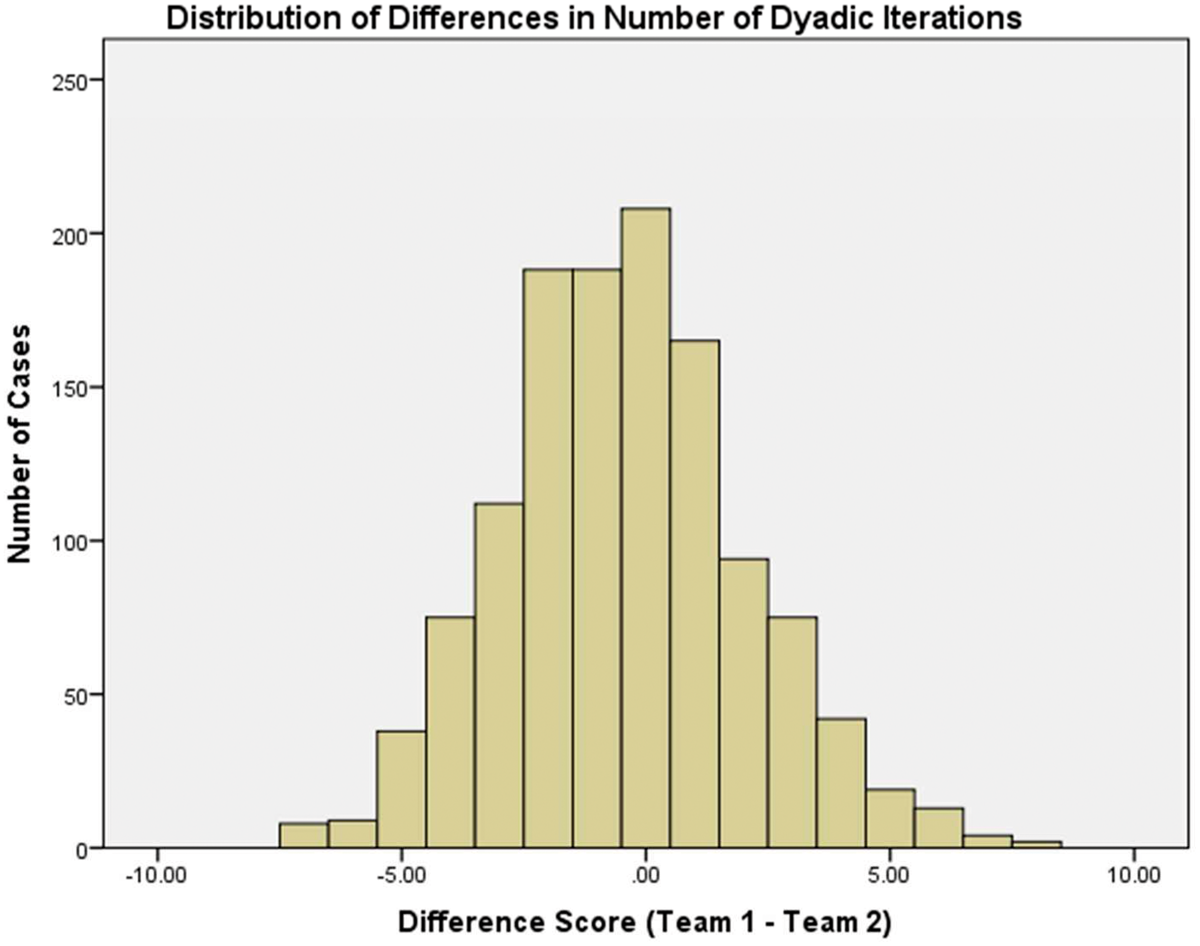
Due to the complexity of the data, we have opted to display the results of dynamic force factor analyses graphically rather than in table form (tabular data are available upon request). As can be seen in Figure 3(a), average officer force levels by iteration number appear to be quite similar across coding teams for the first three iterations, with an apparent divergence at iteration four and thereafter. Team 2’s average officer force level appears lower than Team 1’s although the overall pattern is similar. Paired t tests for the mean difference in officer force levels at each iteration indicate that Team 2’s force level was significantly lower than Team 1’s at iterations 1, 4, 5, 6, and 9 (note that case attrition increases with each iteration). The average kappa was equal to .16 (significant across the first five iterations), indicating “slight” agreement (Landis & Koch, 1977) although reliability was higher at the first iteration, and the average ICC was equal to .33 (significant across the first seven iterations), indicating “poor” agreement (Cicchetti, 1994).
Average force and resistance levels, by iteration and coding team.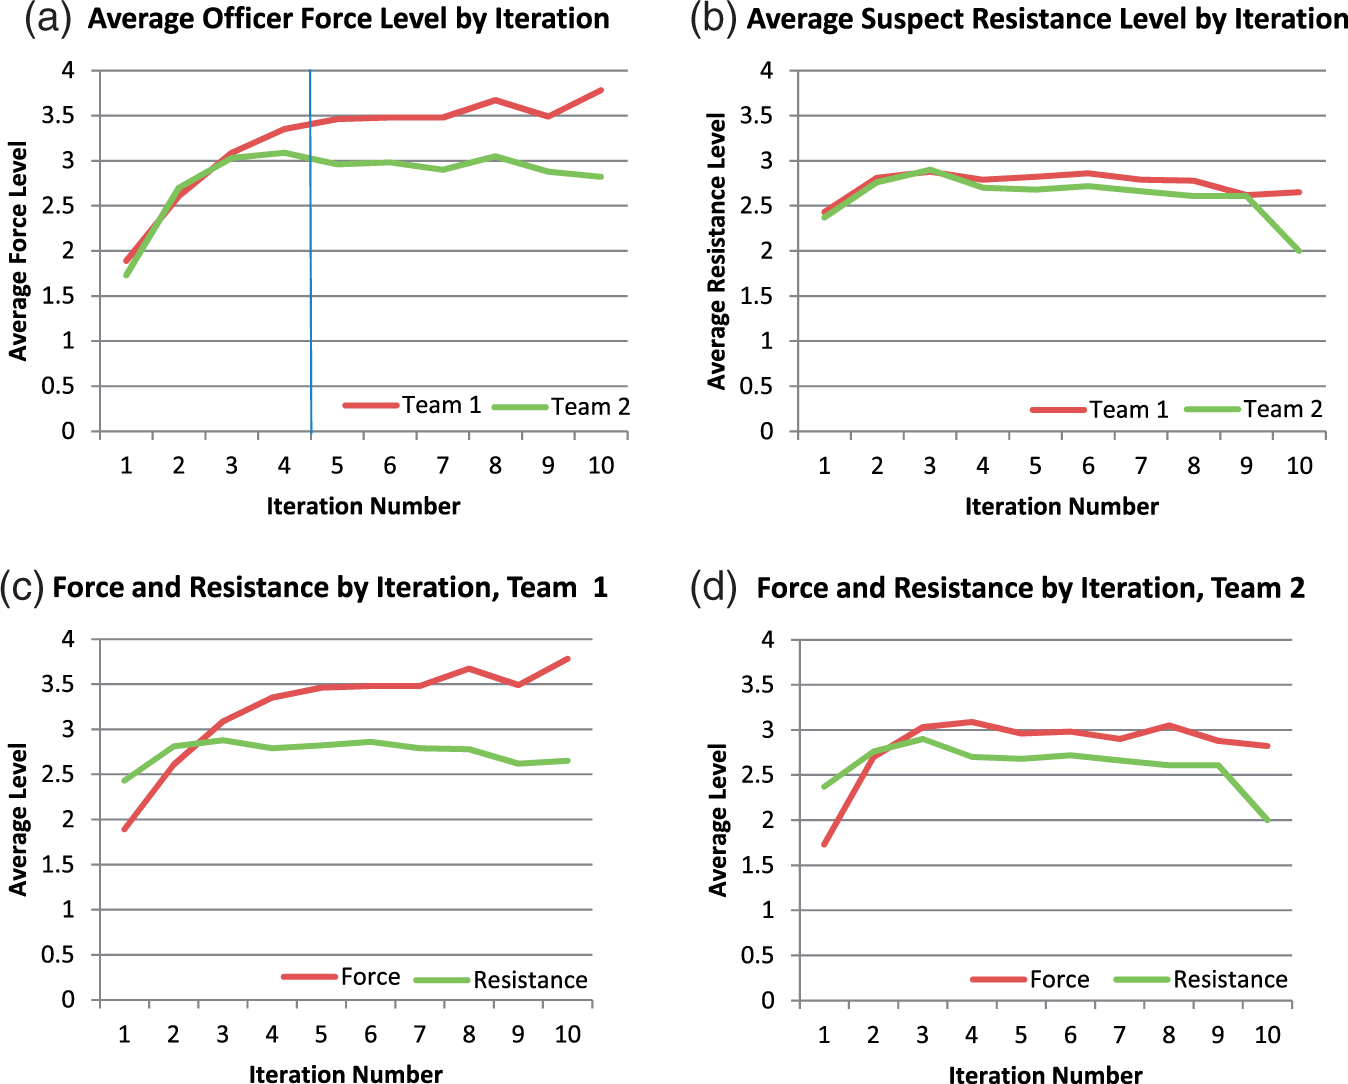
Looking at Figure 3(b), we again see an apparent divergence at iteration 4 with Team 2’s average suspect resistance levels slightly lower at that point and thereafter. Paired t tests for the mean difference in suspect resistance levels at each iteration indicate that Team 2’s resistance level was significantly lower than Team 1’s at iteration 1 and significantly higher at iteration 9. The average kappa was equal to .14 (significant across the first four iterations), indicating “slight” agreement (Landis & Koch, 1977), and the average ICC was equal to .36 (significant across the first seven iterations), indicating “poor” agreement (Cicchetti, 1994), although reliability was higher at the first iteration.
Figure 3(c) compares the dynamic force and resistance levels for Team 1 (as appear in Figure 3(a) and (b)). As can be seen, officers typically operate at a force deficit for the first couple of iterations, transitioning to a force surplus around the third iteration, and maintaining a higher level of force relative to suspect resistance thereafter, and until the encounter ends. Team 2’s results show a similar overall pattern (Figure 3(d)).
Average force factors are presented for both coding teams in Figure 4. As can be seen, the average force factor by iteration is similar for both coding teams through the fourth iteration, with a divergence at the fifth iteration, and thereafter Team 2’s average force factors appear lower than Team 1’s. Paired t tests for the mean difference in force factors at each iteration indicate that Team 2’s force factors were significantly lower than Team 1’s at iterations 1, 5, 6, 8, and 9 and significantly higher at iteration 2. The average kappa was equal to .13 (significant across the first three iterations), indicating “slight” agreement (Landis & Koch, 1977), and the average ICC was equal to .33 (significant across the first four iterations), indicating “poor” agreement (Cicchetti, 1994). Again, the reliabilities were higher at the first iteration and declined thereafter.
Average force factor, by iteration and coding team.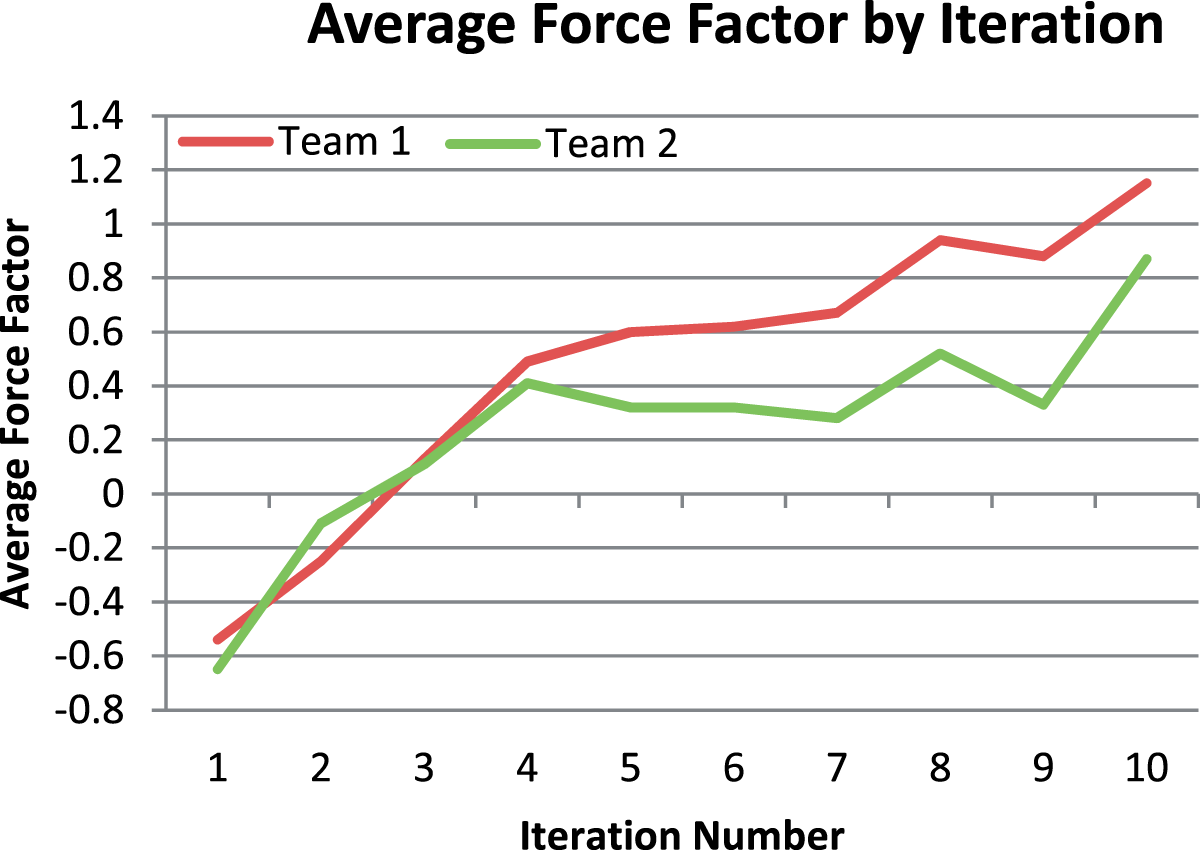
Discussion
The purpose of this research was to investigate the reliability of the force factor method, a widely regarded technique for analyzing police–citizen interactions that involve the use of force. The force factor results in data that explain complex police–citizen interactions and potentially help police administrators and academics to bridge the gap between police and public perceptions of police behavior. This study came on the heels of a U.S. Department of Justice, Civil Rights Division (2011) report finding that when officers in the SPD used force during the period of study, it was “excessive” 20% of the time. Using the force factor method, two independent coding teams came to comparable conclusions about the distribution of proportionality of force. This offers an alternative approach to sizing the pool of potentially excessive events.
On balance, the results indicate that static force factor analysis yields an acceptable degree of reliability. The ICCs indicates at least “good” agreement and probably “excellent” agreement between the two research teams (Cicchetti, 1994). Given the difficulties often found in use-of-force research, especially at higher levels of force and resistance, the consistency produced by the teams shows the value and importance of using the force factor.
As indicated by the patterns in Figure 3, the dyadic interaction between officer and subject shows average similar results between the coding teams. Interestingly, the levels of force used by an officer are agreed upon more frequently than the levels of suspect resistance. There may be a report writing bias as officers are conditioned to explain and justify their first-hand recollection of the levels and types of force they used compared with the second-hand stories they tell about the suspect’s levels and types of resistance. It may be that routine language used by officers explains the average strong agreement among coding teams as shown in Figure 3.
Suspect resistance is open to more varied interpretation as it is someone else’s behavior as reported by the officers. Researchers are likely to be more familiar with police tactics (levels and types of force) than the ways stories are told about the ways in which suspects resisted and needed to be controlled, which could be addressed in improved training for coders. For example, an officer may describe a subject’s resistance to being handcuffed as passive resistance (“Resistance 3”), or perhaps as attempting to reach for a weapon, active resistance (“Resistance 4”). The written information on a report is more comprehensive to justify the officer’s actions than the explanatory scheme describing the actions of the suspect. While researchers are provided with better data concerning the officer’s behavior, it requires more coder judgment and interpretation to determine the actions of the suspect. In other words, one team could defer to the stated reasons provided by the officer, while the other team could infer contextual clues from the subject’s actions, which could explain the different results. Of course, this may also be a consequence of the coding scheme, as some categories collapse different types of resistance and may create problematic overlap for coders (whereas the force categories are more clearly delineated).
However, the first three iterations between the two teams were of high agreement and as seen in Figure 3, there are not wild divergences in either teams’ average force or resistance at any iteration. Given the lack of divergences in force or resistance, the great level of agreement in the first three iterations and the fact that more than 65% of the encounters ended by iteration four, it may be concluded that within team reliability is acceptable, as is reliability between teams.3 Figure 4 indicates a similar story: Although there is slight disagreement in the exact levels of force, the encounter seems to escalate and de-escalate at the same time and rate, indicating acceptable between team and within team reliability.
Differences in first- and second-hand reporting, a lack of emphasis on the suspects’ narrative, and the emphasis on the initial contacts between officer and suspect may also explain the apparent decline in reliability that occurs after iteration three of the encounter. This breakdown can be further understood by the compelling arguments made by Durkheim (1951), Goffman (1961), and Collins (2005) involving encounters, interaction rituals, and emotional energy. Within an encounter involving force and heightened levels of emotional energy, there occurs a rapid increase and decrease of force and resistance, making it difficult for two or more parties to agree accurately on the details and particulars of an encounter with many iterations of action/reaction. Given that most encounters end by iteration four, and in our analysis the inconsistencies in interpretation occur after the third iteration, the emphasis on initial contacts and not second-hand accounts produced results that made agreement difficult to capture, given the heightened levels of emotional energy. As the encounter intensifies and the amount of time spent in an interaction ritual increases, it is possible that recalling autobiographical information accurately may be a difficult task.
As the force incident evolves, the actions of the officer become less deliberate and more reactionary in an attempt to overcome resistance and control the suspect. This reactionary response may be explained by the authority maintenance theory and the theory of deference exchange, as the assumption of asymmetry and acceptance of authority is not met as the suspect continues to resist, which leads to another iteration of force by the officer.
The general utility of these theories is demonstrated by our results. On average, resistance interpreted by both teams was at the highest level of agreement during the first three iterations. Reliabilities dropped in later iterations, although the overall pattern demonstrates that both teams agreed generally with the level of suspect resistance at each iteration. As the encounter progressed, as a whole, both teams noted a decline in the amount of resistance exercised by the suspect. However, this accounts only for one actor in the interaction ritual. Much like the interpretation of suspect resistance, both teams had a high level of agreement during the first three iterations. After the third iteration, there was a mild disconnect in interpretation of force exercised. Perhaps these results may be explained by further exploring the encounter and authority maintenance theory; the officers maintain authority with higher relative force, making it difficult for two teams to agree upon the level of force exercised. As it relates to suspects, he or she begins to comply with the officer as the encounter progresses, and the officer goes to greater levels of force to maintain their authority and neutralize the threat.
Finally, the average force factor scores between the two data sets is worth mentioning. As the force factor score increases, a disagreement is noticeable between the two teams at iteration 4. While both teams agree about the static nature of the force factor, the data in Figure 4 indicate that one team found lower force factors at later iterations compared with the other. This finding shows the difficulty of agreement as force/resistance increases but can be explained as a breakdown in deference and rejection of asymmetrical rules, as suggested by the authority maintenance ritual. As a suspect continues to reject authority, and refuses to be deferent, the officer continues to perform authority maintenance tactics by using increased levels of force.
The utility of the force factor approach for police departments may include descriptive reporting purposes, such as external reporting to the public (reporting the annual distribution of force factors is arguably an improvement in transparency, as compared with annual statistical summaries about the number of use-of-force incidents), but also improved internal administrative or supervisory review of force incidents. A method for screening use-of-force cases using administrative data, termed Graham Factor Filtering, was recently articulated by Atherley and Hickman (2014), who demonstrated that by recording force factors as well as relevant Graham factors from the content of administrative records, a simple “pointer system” for identifying incidents where the use of force is potentially excessive is possible. Detailed review of a pool of cases identified by this approach yielded many false positives, but this is to be expected as the identification of a case merely suggests additional review may be necessary and is not determinative. It would be possible to incorporate force factors and other critical data elements as “drop-downs” in an automated data entry process used by supervisors or administrative personnel. Stewart (2013) suggested a similar approach, termed Constitutional Force Analysis, using force factors, variables pertaining to information available to the officer prior to arrival on-scene, information available on-scene and up to the use of force, and other administrative variables. The potential benefits of the approach included improved analysis of use of force, improved quality control, and an improved debriefing process (Stewart, 2013).
Conclusion
Including measures of officer force relative to suspect resistance rather than a measure of one or the other has gained popularity in the academic and professional literature (Bazley et al., 2007, 2009; Jefferis, Butcher, & Hanley, 2011; Wolf et al., 2008). The use of the force factor can show escalation and de-escalation in officer force as well as suspect resistance as an event unfolds. Examining each iteration of an encounter provides researchers and police managers a better understanding of a single use-of-force incident as well as overall trends and practices. Establishing the reliability of methods for studying the use of force is an important task, particularly as applied to administrative records. The analysis of administrative records has its strengths and weaknesses but will likely be more predominant due to the lower resource costs as compared with, for example, observational methods.
The force factor is an important method that can increase our understanding of police use of force. The present study looks at agency-wide data, while future analyses should consider using variables to understand more completely the contours of an encounter. For example, relative force can be broken down by officer and suspect age, race, gender, and other demographic variables of interest, officer calls for service, place, contextual factors, hot spots, and perceived levels of threat, among others. In that way, the use of force can be considered generally and by personal, situational, and organizational factors that may affect an encounter.
Although the force factor provides a good understanding of the use of force from beginning to end of an interaction, it may be difficult to capture perceptual differences in an encounter prior to the force incident, including a suspect’s general perceptions of police or how a particular officer responds to different influences, including suspect race or areas of high crime. Future research should consider how microsocial orders, patterns of interaction or exchange produced by networks of characterized individuals in an encounter (Lawler, Thye, & Yoon, 2008), affect symmetrical rules, asymmetrical rules, and deference as it relates to encounters involving the use of force.
Finally, researchers should emphasize the data needs and data quality issues that are important to this area of research. While the U.S. Department of Justice is legally required to “acquire data about the use of excessive force by law enforcement officers” and to “publish an annual summary of the data acquired under this section” (Violent Crime Control and Law Enforcement Act, 1994), a long series of Attorneys General over the past 20 years since the law was enacted have failed to act in a meaningful way on this requirement. Yet, the same Act that requires the Attorney General to acquire data about the use of excessive force by the police also provides the Department of Justice with their routinely exercised authority to pursue civil litigation against police departments that display a “pattern or practice” of use of excessive force (Violent Crime Control and Law Enforcement Act, 1994). This is an important and powerful mechanism and a necessary check on police behavior that helps to ensure that the police are held accountable to the public. But there is no clear context for these investigations, and it remains unclear what constitutes a pattern or practice of use of excessive force.
Perhaps the intent of this pair of statutes (42 U.S.C. § 14141, § 14142) was to enable the rational investigation of police use of force. It makes little sense to exercise the pattern or practice authority when we cannot claim to truly understand the nature and scope of police use of force. The data collected under Section 14142 could provide a rational basis for investigations carried out under Section 14141. To be clear, this is not a simple task; government and academic researchers have struggled for years to define, measure, and collect data on police use of force, much less the use of excessive force, but that does not mean we should not try. Police use-of-force research will only be as good as the information available to or developed by the research community.
We have identified the utility of the force factor for both academic and administrative use and cited an emergent and foreseeably ongoing need to monitor and control use of force, generally, and use of excessive force, specifically. What are the next steps from here? The process begins and ends with “good” data. Police departments must modernize their use-of-force policies and training, update their records management systems and even consider implementing purpose built software products for the handling of use-of-force data. Finally, the academic community must continue to work on this problem. Too much public policy is driven by too little evidence. With better data and an evolving understanding of force, public policy can appropriately and proactively address unintended outcomes rather than responding to precedent setting outliers.
Footnotes
Notes
Declaration of Conflicting Interests
The authors declared no potential conflicts of interest with respect to the research, authorship, and/or publication of this article.
Funding
The authors received no financial support for the research, authorship, and/or publication of this article.