



Abstract
The present research investigates the productivity and performance of a large sample of police officers, beginning in the police academy and through their first 10 years of policing. Using longitudinal data and latent class growth analyses, we examine measures of productivity and performance over this time. Findings indicate that officers’ academy performance did not influence officer trajectories, but selected demographic variables were significantly related to performance across the career course. Among these, female and non-White officers were consistently rated lower in their performance evaluations. Overall, results suggest that factors predicting productivity and performance are dynamic, and there is no single combination of characteristics that predicts who will be a “good” officer.
Introduction
Hiring is one of the most consequential activities undertaken by police departments, and many police agencies are facing staffing issues due to a number of related factors. Retirements, turnover, problems recruiting qualified applicants, the evolving demands of police work, and fiscal issues have all combined to limit the number of available officers in many jurisdictions (Wilson, 2012; Wilson & Heinonen, 2012; Wilson & Weiss, 2009). In addition, it is important for agencies to retain quality officers, as success—or “good” policing—is believed to be a function of experience and sound decision-making (e.g., Orrick, 2002; Wilson, 2012). Further, there are high costs associated with selecting and training new officers (Switzer, 2006). In an effort to improve the selection and retention process, there is a need to identify and assess those selection and hiring criteria that are most related to police officer productivity.
Given the complexity, demands, evolving nature of the police role, and the importance of police work, identifying applicants and recruits who will ultimately be successful as police officers is a high priority for police administrators and other policy makers. Although researchers have investigated this issue (e.g., Forero, Gallardo-Pujol, Maydeu-Olivares, & Andrés-Pueyo, 2009; Henson, Reyns, Klahm, & Frank, 2010; Reaves & Hickman, 2004; Sanders, 2008; Sarchione, Cuttler, Muchinsky, & Nelson-Gray, 1998; White, 2008), there is still no firm answer to the hiring question. In part, this is because it is difficult to measure officer success objectively, empirical data useful to this purpose are generally not available to criminal justice scholars, prior methodologies have inhibited a full understanding of the phenomenon, and the studies that have been published use cross-sectional research designs or provide a limited/short-term view of officer careers (Sanders, 2008; White, 2008). In short, more research is needed to better understand the factors associated with officer productivity and performance—particularly in the long-term. The present study represents an effort to address this question in a developmental way by using latent growth analyses.
The purpose of the present study, then, is to use latent class growth analysis (LCGA) to assess how groupings of officers may differ in their development over time (e.g., McGloin, Sullivan, Piquero, & Bacon, 2008; Piquero, 2010; Weisburd, Bushway, Lum, & Yang, 2004). In particular, these growth analyses allow us to consider the career course of recent police academy graduates as they begin their careers as patrol officers. To this end, officer performance and productivity are operationalized in four ways. That is, the analyses provide latent class growth trajectories for misdemeanor and felony arrests—two dimensions of productivity—as well as a latent growth curve model for performance evaluations and citizen complaints. Further, we identify factors that are associated with these productivity and performance outcomes. Therefore, the primary research questions guiding this study are (a) are there distinct trajectories for officers during the first 10 years of law enforcement related to productivity and performance? and if so, (b) what factors are related to membership in these groups? Of particular interest is the effect of police academy performance on later performance as an officer.
Police Hiring, Training, and Officer Performance
Hiring and training are not taken lightly by police agencies, as these early stages in the police career course impact not only the path on which officers begin a career in law enforcement but also the success of the agency and the vitality of the community. In the United States, there are thousands of law enforcement agencies engaged in hiring and training of new officers every day, with no uniform standards for how to do so. Despite differences in candidate selection and training practices across these agencies, the typical approach to selecting a candidate who can be trained and ultimately become a productive officer with a successful career has been to screen out unqualified candidates (Alpert, 1991; Gaines & Falkenberg, 1998; Malouff & Schutte, 1986; Metchik, 1999). Often, there are multiple hurdles that candidates must clear in this process before a positive hiring decision is made, including meeting given standards for physical, psychological, and mental readiness for the job (Metchik, 1999; Reaves & Hickman, 2004).
The inherent difficulty in this process is that making a hiring decision based on whether a candidate meets a baseline qualification standard does not guarantee that the candidate will be a quality officer throughout his or her career, especially when the training is not closely related to what officers will experience in the field (Bayley & Bittner, 1984; Burkhart, 1980; White, 2008). To overcome the weaknesses in hiring approaches that “screen out” the unqualified rather than “screen in” the best-qualified, law enforcement agencies send their new recruits through training academies that teach officers the essentials of the law (e.g., state laws, liability), practical police skills (e.g., firearms, driving), criminal investigations, patrol work, and more. Following this, field training with a senior officer further prepares new officers for the rigors of police work. However, a lingering question for practitioners, policy makers, and researchers is whether these processes ultimately produce productive police officers who are positively evaluated by the organization and community.
An answer to these questions remains elusive because defining police officer productivity and success is complicated. Prior academic research that has addressed this issue has used counts of arrests and citations as metrics for officer productivity (Alpert & Moore, 1993; Bayley & Bittner, 1984; Fielding & Innes, 2006; Fyfe, 1999; Henson et al., 2010; Skolnick & Fyfe, 1993; White, 2008). Yet it is important to point out that law enforcement productivity (i.e., number of arrests or citations) is influenced by the location of the officer’s assignment (e.g., shift time, neighborhood, beat, high crime, high call area) and type of assignment (i.e., unit assignment) dictating opportunities to make arrests or issue citations (Kane, 2003; Klinger, 1997; Skolnick & Fyfe, 1993; Smith, 1986; Weitzer, 1999; Worden, 1989). Another approach to measuring officer performance has been to study its inverse—that is, to study bad behavior as an indicator of an unsuccessful officer. Here, research has examined the predictors and patterns of complaints against officers for excessive use of force, corruption, or disciplinary action (e.g., Brandl, Stroshine, & Frank, 2001; Cohen & Chaiken, 1972; Harris, 2010; Lersch & Mieczkowski, 1996; Sanders, 2008; Sarchione et al., 1998; Terrill & McCluskey, 2002).
There are a limited number of studies that have investigated the relationship between academy performance or training and productivity and success on the job, but these studies provide a valuable foundation for the present research. In one such study, and using data from a midsized and Midwestern training academy and police department, Henson et al. (2010) examined both academy success and street-level success of recruits/officers. They argued that demographic and professional experience should affect academy and active service performance and that overall academy performance would predict active service performance. Their results generally suggested that demographic characteristics (e.g., male, White) and professional experience (e.g., military, civil service exam, prior law enforcement) are related to different measures of academy success and, later, street-level performance (i.e., evaluations, complaints, commendations).
Greene, Piquero, Hickman, and Lawton (2004) similarly analyzed data collected from background files, academy data, and behavioral and experiential information from 2,000 officers in the City of Philadelphia. They considered a number of demographic, background, and academy factors as potential explanations of negative police performance outcomes, such as complaints, departmental discipline, and internal investigations, among others. Among the outcomes most similar to those in the present research were official complaints—both physical abuse complaints and verbal complaints. They identified younger officers (i.e., less than 26 years old at the time of application), males, and those with military experience (who had also been the subject of military disciplinary action) as more likely to generate physical abuse complaints. However, those scoring lower on sections of their academy training were less likely to receive these complaints. Similar effects were reported for military experience/discipline and academy performance in relation to verbal complaints.
The present study operationalizes officer performance by building on prior research and taking a long-term view of officer careers. First, internal organizational perceptions of performance are examined using annual police agency evaluation scores. Second, behavioral assessments of performance are examined using complaints over time. The presumption is that a quality officer will receive good evaluations and have few complaints made against them by citizens, colleagues, and the organization. 1 Third, officer law enforcement productivity is considered in light of arrests made over the years, both for misdemeanors and felonies, with an officer that makes more arrests presumably being more productive. Admittedly, the role and tasks of police have expanded over the past 40 years, and police work is recognized as involving more than just crime fighting (Davis, Ortiz, Euler, & Kuykendall, 2015; Fielding & Innes, 2006; Gorby, 2013; Skolnick & Fyfe, 1993). Still, arrests remain important to the accomplishment of law enforcement agency objectives, and while they are not the only important criteria on which to evaluate officer efforts, they remain a critical measure of officer activity (Toch, 1995). Further, the number of arrests by officers represent data regularly recorded that provide agencies with objective evidence of officer activity.
Predicting Officer Productivity and Performance Over the Career Course
A great deal of criminal justice research has focused on the predictors of police officer productivity and performance, often identifying officer, citizen, community, or situational factors that impact officer decision-making regarding arrest, search, citation, or use of force decisions (e.g., Greene et al., 2004; Klahm & Tillyer, 2015; Kochel, Wilson, & Mastrofski, 2011; Novak, Frank, Smith, & Engel, 2002; Terrill & Mastrofski, 2002; Terrill & Reisig, 2003; Tillyer, 2014; Worden, 1989). Fewer studies have explored these outcomes within the various stages of the career course (e.g., early career, midcareer, late career; Forero et al., 2009; Henson et al., 2010; White, 2008), and no research to date has used longitudinal data to examine productivity and performance in a dynamic way using LCGA. Still, there are several longitudinal studies of officer use of force (Kane & White, 2009) and misconduct over their career (Greene et al., 2004; Harris, 2009; Stinson, Liederbach, & Freiburger, 2010). In general, these studies find that rates of criminal behavior (Stinson et al., 2010) and rates of complaints for improper police behavior (Harris, 2009) rise early in the officer’s career and then peak after a short time, from 4 to 5 years.
Most of the quantitative research suggesting that arrest trends may follow a similar pattern uses cross-sectional data and then infers that officers are likely to be high arrest producers during the early years of their career and then reduce the quantity of their arrests over time. Typically, studies find that younger officers with less time on the force are more active (Brandl et al., 2001; Crank, 1993; Friedrich, 1980) than older officers and that early in their career they “stretch” their law enforcement legs, while later on they become less active and more selective as far as intervening in encounters with citizens and making arrests. This results in not only fewer arrests but also reduced opportunities to use force, be the recipient of citizen complaints, or become parties in illegal behavior.
There are also qualitative studies of officer work routines that suggest both similar patterns of behavior and also individual differences among officers as to the trajectory of career paths. For instance, Van Maanen (1974) suggested that officers journey through various stages during their admittance into policing that influence their street behavior and attitudes about real police work. Barker (1999) catalogues the five stages of an officer’s career course as they journey from initial employment to retirement from the profession (see also, Meredith, 1984).
Each officer study emphasizes that officers are taught that crime fighting and officer productivity are the means to create a positive reputation among peers, are the hallmarks of real police work, and are rewarded by police administrators (see also, Harris, 2016; Toch, 1995) while also highlighting that over time most officers learn to minimize activity and reduce interactions with citizens that can cause problems for the officer. In addition, Muir (1977) and Brown (1988) determined that officers adopt policing styles that influence how officers behave on the street. These styles suggest that some officers rely on aggressively intervening in situations and make a lot of arrests, while others rely less on formal arrests to control citizen behaviors. Together, these studies suggest different officer trajectories with arrest productivity and citizen complaints decreasing over time.
From a theoretical perspective, police scholarship continues to take a long-term view of factors impacting these, and similar, outcomes. To illustrate, Harris (2016) has argued for the adoption of a career view of police misconduct that is grounded in the principles of life course criminology. Officers, such as criminal offenders, may essentially have a career trajectory, with transitional moments, and different influences on their onset and desistance from misconduct over the career course. In the same way, a career course view of officer productivity and performance is also possible. Harris (2016) explained that … work going forward will require access to longitudinal data on police officers regarding variables which are sensitive in nature (e.g., complaints, uses of force), and so will require the cooperation of forward-thinking police administrators to allow researchers access to such information. (p. 227)
Thus far, data capable of providing an examination of a career course point of view have generally not been available to criminal justice scholars. However, using original data, the present study is able to offer a unique look at the trends in productivity (i.e., arrests) and performance (i.e., evaluations, [lack] of complaints) of a large sample of officers for their first 10 years of their law enforcement careers. In addition to exploring officer class trajectories according to productivity and performance, the present study also is able to identify factors influencing membership in these classes over time.
Method
Study Setting and Sample
The setting is a Midwestern urban city, with almost 300,000 citizens, spread over 60+ square miles (U.S. Census Bureau, 2016). The local police department has more than 1,000 sworn officers and is broken into distinct police districts, in addition to the central business district. According to the Bureau of Justice’s annual police personnel report, police departments that serve similarly situated cities are comprised of approximately 85% male and 67% White sworn officers (Reaves, 2015). The current sample has proportionally more females (21%) and slightly more non-White officers (37%) than the national average for similarly situated cities.
Data were collected by a research team for all officers entering the city’s police academy and, eventually, police department between 1996 and 2006 (n = 486; Henson et al., 2010). In 2017, the research team collected updated officer performance and evaluation information for all members of the cohort sample. In other words, annual performance scores, misdemeanor and felony arrest totals, and complaint information were collected for the original sample of officers. In addition, demographic information was updated. A number of officers had separated from the police department between the original and updated data collection periods. Despite the earlier recruit classes serving well over 10 years, we used the first 10 years of service to avoid systematic missing data for later recruit classes. Table 1 displays the length of service for year of the recruit classes, where the cells represent the number of officers within each class that served the respective years. For example, there were 46 officers in 1996 recruit class, and 41 of them had 19 years of service by the time researchers collected data. There were 27 officers in the most recent recruit class (2006), but time constraints related to time of data collection resulted in only 9 full years of data for active officers in this recruit class. With the exception of the class of 2006, all classes had at least 10 years of service.
Number of Officers by Length of Service and Recruit Class.

Note. The numbers in each cell represent the number of officers in that respective class with that respective length of service. Length of service was calculated by subtracting the year of separation from the first year of active service (year after hire). For those officers who separated during data collection, the year of collection (2016) was used.
Henson et al. (2010) reported a sample of 486 officers, which included officers that were not ultimately hired and had missing demographic or academy measures. Our statistical methods handle missing data differently. Because our methodology involves two main steps (LCGA and multinomial regression models), the number of valid cases varies depending on the analysis being conducted. The first step, assigning class trajectories, did not require officer demographic data, only the dependent variables. LCGA, unlike inferential statistics, assigns membership to the group with the highest match probability using the data it has. Therefore, we removed officers with fewer than 5 years of active service (n = 24), leaving us with 462 total officers. The second step, predicting class membership, does not impute data and removes cases with incomplete data. While some officer information was gathered in the second data collection period, there were 58 officers with missing demographic or academy measures. This left 404 officers in the second step of the analysis.
Measures
Study variables can be broadly categorized as demographic/experience, academy performance, and productivity and performance outcomes. Figure 1 illustrates the current approach to measuring these variables—in addition to assessing their relationship with the outcomes. Table 2 describes the years in which time-varying data were available.

Measures and logic model of assessing growth of performance outcomes and the effects of covariates.
Year in Which Time-Varying Measures Were Available.

Note. Due to changes in the department’s records management system, arrest and complaint data were not available for years in the study period.
Dependent Variables
Law enforcement productivity: misdemeanor arrests over time
Annual counts of misdemeanor arrests were created for each officer in cases where they were the arresting officer, meaning it does not include secondary roles in an arrest. Due to changes in the department’s records management system, we obtained only arrest counts between 2000 and 2015. 2 This resulted in missing values for officers hired before 2000 (N = 205). 3 Misdemeanor classifications are dictated by offense type and whether the suspect was a juvenile or adult. They tended to include Part II offenses, such as less serious theft or disorderly offenses. The distribution of misdemeanor arrests among officers was skewed. For our sample, the average number of misdemeanor arrests per year was 34, but raw counts ranged from zero to 293 misdemeanor arrests in a single year.
Law enforcement productivity: felony arrests over time
The number of felony arrests where the respective officer was the arresting officer was summed to create annual counts of felony arrests. Due to the aforementioned changes in the department’s records management system, we were only able to obtain arrest counts between 2000 and 2015 resulting in missing data for recruits hired before 2000.1,2 Felony classifications are dictated by offense type and whether the suspect was a juvenile or adult. These tended to include Part I offenses, particularly violent and more serious larceny offenses. Felony arrest counts ranged from 0 to 128 for a single year, but officers only averaged about 10 felony arrests per year in their careers.
Behavioral assessments: complaints over time
Citizen and organizational complaint count data were obtained for each officer between 2002 and 2015. This resulted in missing data, but the proposed method managed missing data.1,2 At any time, citizens or employees of the department can make a complaint against one or more officers, which remain in an officer’s file regardless of the outcome of the complaint. Complaints ranged from violation of procedures to more serious allegations of criminal conduct. The most common complaint for our sample was improper procedure (42.0%), which related primarily to missing court or improper searches. This was followed by complaints of excessive force (28.5%). Most officers (88%) had at least one complaint but ranged from 0 to 34 in their careers.
Internal perceptions of performance: performance evaluations
Every year, officers were evaluated by their acting supervisor. Between 1996 and 2006, supervisors used a numeric scale between 0 and 25; however, our sample’s evaluations ranged only between 8 and 25. 4 After 2007, the department switched to an 8-point qualitative scale, which ranged from Unacceptable to Exceptional. 5 To account for changes in the scales, we standardized scores using the total range of scores from each tool. Higher values represented better performance evaluations.
Control Variables
As seen in Figure 1, age, race, sex, prior law enforcement experience, military experience, and officers’ overall academy score were used as control variables in the models. Officer age was calculated at the time of recruitment and is measured as a continuous variable. In the sample, age varied from 17 to 54 with an average age of 29. The sample was primarily comprised of Black and White officers, with less than 1% of the sample being Asian or Hispanic. For that reason, we coded race dichotomously; White officers (63.1%) were coded as 0, and non-White officers (36.9%) were coded as 1. Officer sex is also included in the analyses and coded dichotomously; male officers (78.9%) were coded as 0, and female officers (21.1%) were coded as 1. We also include prior law enforcement experience in our models, which represents as a dichotomous variable, where officers with experience were coded as 1. Ninety-three officers (23%) had prior experience, ranging from 1 year to 8 years. Nearly one third of the sample (31.2%) also had military experience. Those without military experience were coded as 0 and those with as 1. Overall academy score was also included in the analyses. Upon graduation from the police academy, each officer was given a final score based on State Peace Officer Training Academy (SPOTA) criteria. 6 These scores are summaries of multiple attributes, including reading, writing, verbal, and interpersonal skills, as well as knowledge of relevant constitutional and case law. SPOTA final scores ranged from 68.5 to 99.0 and averaged 86.8, where higher scores represent better performance in the police academy.
Analytic Strategy
Theory and qualitative research suggest that (a) officers change over time and (b) there are different typologies of officers (e.g., Beutler, Nussbaum, & Meredith, 1988); however, there is little consistent empirical data on these trends (see (Snipes and Mastrofski, 1990)). To address these two points, we used a longitudinal growth technique—LCGA—which identifies significantly different trajectory groups. When diagnostics did not identify group differences, latent growth curve analysis (LGCA) was used. Both longitudinal techniques produce similar growth characteristics, including an intercept (launching point) and slopes (change over time), but LCGA produces different sets of intercepts and slopes for each class rather than one for the full sample. Table 3 describes the general characteristics of the analytic plans for each performance measure. Fewer predictors were used if there were problems with convergence due to small class size; this is explained in each respective measure’s section.
Analytic Plan Overview.

Note. LCGA = latent class growth analysis; LGCA = latent growth curve analysis.
Our general process involved four steps. First, we assessed LCGA model fit for each unconditional model of performance and productivity outcomes. This process determined whether the longitudinal data naturally split into different trajectories, and if they did, how many classes provided the best fit. The second step involved estimating the intercept and slopes for each trajectory class (where identified) or the full sample (if data did not fit distinct groups). The third step, which was relevant only for those with two or more distinct trajectories, assigned officers to the unique trajectories determined to best fit the data from the first step. Officers are assigned to the trajectory with the highest probability of matching the others within it. If the data did not fit into distinct groups (as we found with performance evaluations), we skipped to step four. The fourth and final step is to assess the multivariate correlates with the outcomes.
To assess what factors are associated with the outcomes, LCGA and LGCA use slightly different methodologies. When the data were grouped into different trajectories, it was most appropriate to assess the different compositions of the groups, which is done by predicting group membership instead of the raw values. LCGA assumes there is an underlying factor causing different changes over time (Nagin, 2010 , p. 59), thus directly predicting the slopes is inappropriate.Rather, this process identifies group differences, which hint at the unmeasured and underlying factors/processes, such as different socialization patterns or personality factors (as described in Muir, 1977 or Van Maanen, 1974). When the data were not grouped—meaning the full sample followed a similar trajectory—the intercept and slopes were regressed on the demographic and experiential covariates. We included the trajectory class memberships as dichotomous variables to assess whether arrest or complaint growth over time affected overall performance evaluations.
Results
Model Selection for All Outcomes
The first step—assessing model fit for unconditional models—relied on a number of empirical model fit indices. Model fit statistics began by defining the number of potential groups, starting with one single class and then sequentially adding another class until model fit statistics stopped improving. We used four fit indices to assess the appropriate number of classes: adjusted Bayesian information criterion, entropy, Lo–Mendell–Rubin test (Lo et al., 2001), and classification probabilities. In addition, we visually inspected the characteristics of the classes and changes in classes from each step. In areas where model fit statistics conflicted, more complex models were chosen only if meaningful information was gained.
Neither law enforcement productivity outcome—felony and misdemeanor arrests—had a clear number of suggested classes; model indices varied dramatically. Depending on the model fit statistic, arrest trajectories were best fit into three, four, or five classes. After inspecting class compositions, adding an extra class resulted in splitting the least voluminous class without adding significantly better model fit. Essentially, the more complex trajectory classes simply identified outlier groups that were harder to generalize about. Therefore, both arrest measures resulted in three-class solutions.
Results from the model fit statistics were mixed when determining the appropriate number of classes for citizen complaints. In the end, we chose the four-class model because it broke the complaint data into groups with unique trajectory patterns while preserving Lo–Mendell–Rubin results and had the lowest adjusted Bayesian information criterion level. We found that no new information was gained by adding another class, while the four-class solution identified an interesting outlier group without dramatically compromising model fit indices.
As mentioned earlier, model fit statistics for the performance evaluations suggested that our officers did not vary enough to identify separate trajectory classes. After sequentially adding more classes, none of the model fit indices improved over those for the one-class model, and only classes with small volume (five or fewer officers) were added. For the next steps, LGCA was used for assessing the development of performance evaluations.
Assessing Trajectories and Officer Membership
In this section, we present the unconditional trajectory figures and size of each class. The classes are labeled based on their volume of the outcome (i.e., average number of complaints) at the intercept and change throughout their years of service, similar to that of Weisburd et al. (2004). This allows the reader to understand the basic temporal pattern without having to refer back to the figure. For example, a “High-Decreasing” class indicates a high volume of the outcome at the beginning but low volume at the end of the career.
Beginning with the productivity measures, Figures 2 and 3 show the growth of three classes among misdemeanor and felony arrests throughout the first 10 years of officers’ careers. The felony and misdemeanor arrest trajectories share similar class sizes and their respective amount of arrests. For example, both have a class with less than 2% of the sample that were relatively unstable and accounted for most arrests per year. The officers in these classes averaged more arrests (misdemeanor and felony) and more complaints per year in the first 10 years of service than moderate and low classes. In addition, the remaining two classes were both stable over time, one (“Low Stable”) having consistently lower number of misdemeanor or felony arrests than the second (“Moderate Stable”). For both arrest measures, the most voluminous group (about 90% of the sample in each outcome) accounted for the fewest arrests and remained so over time.
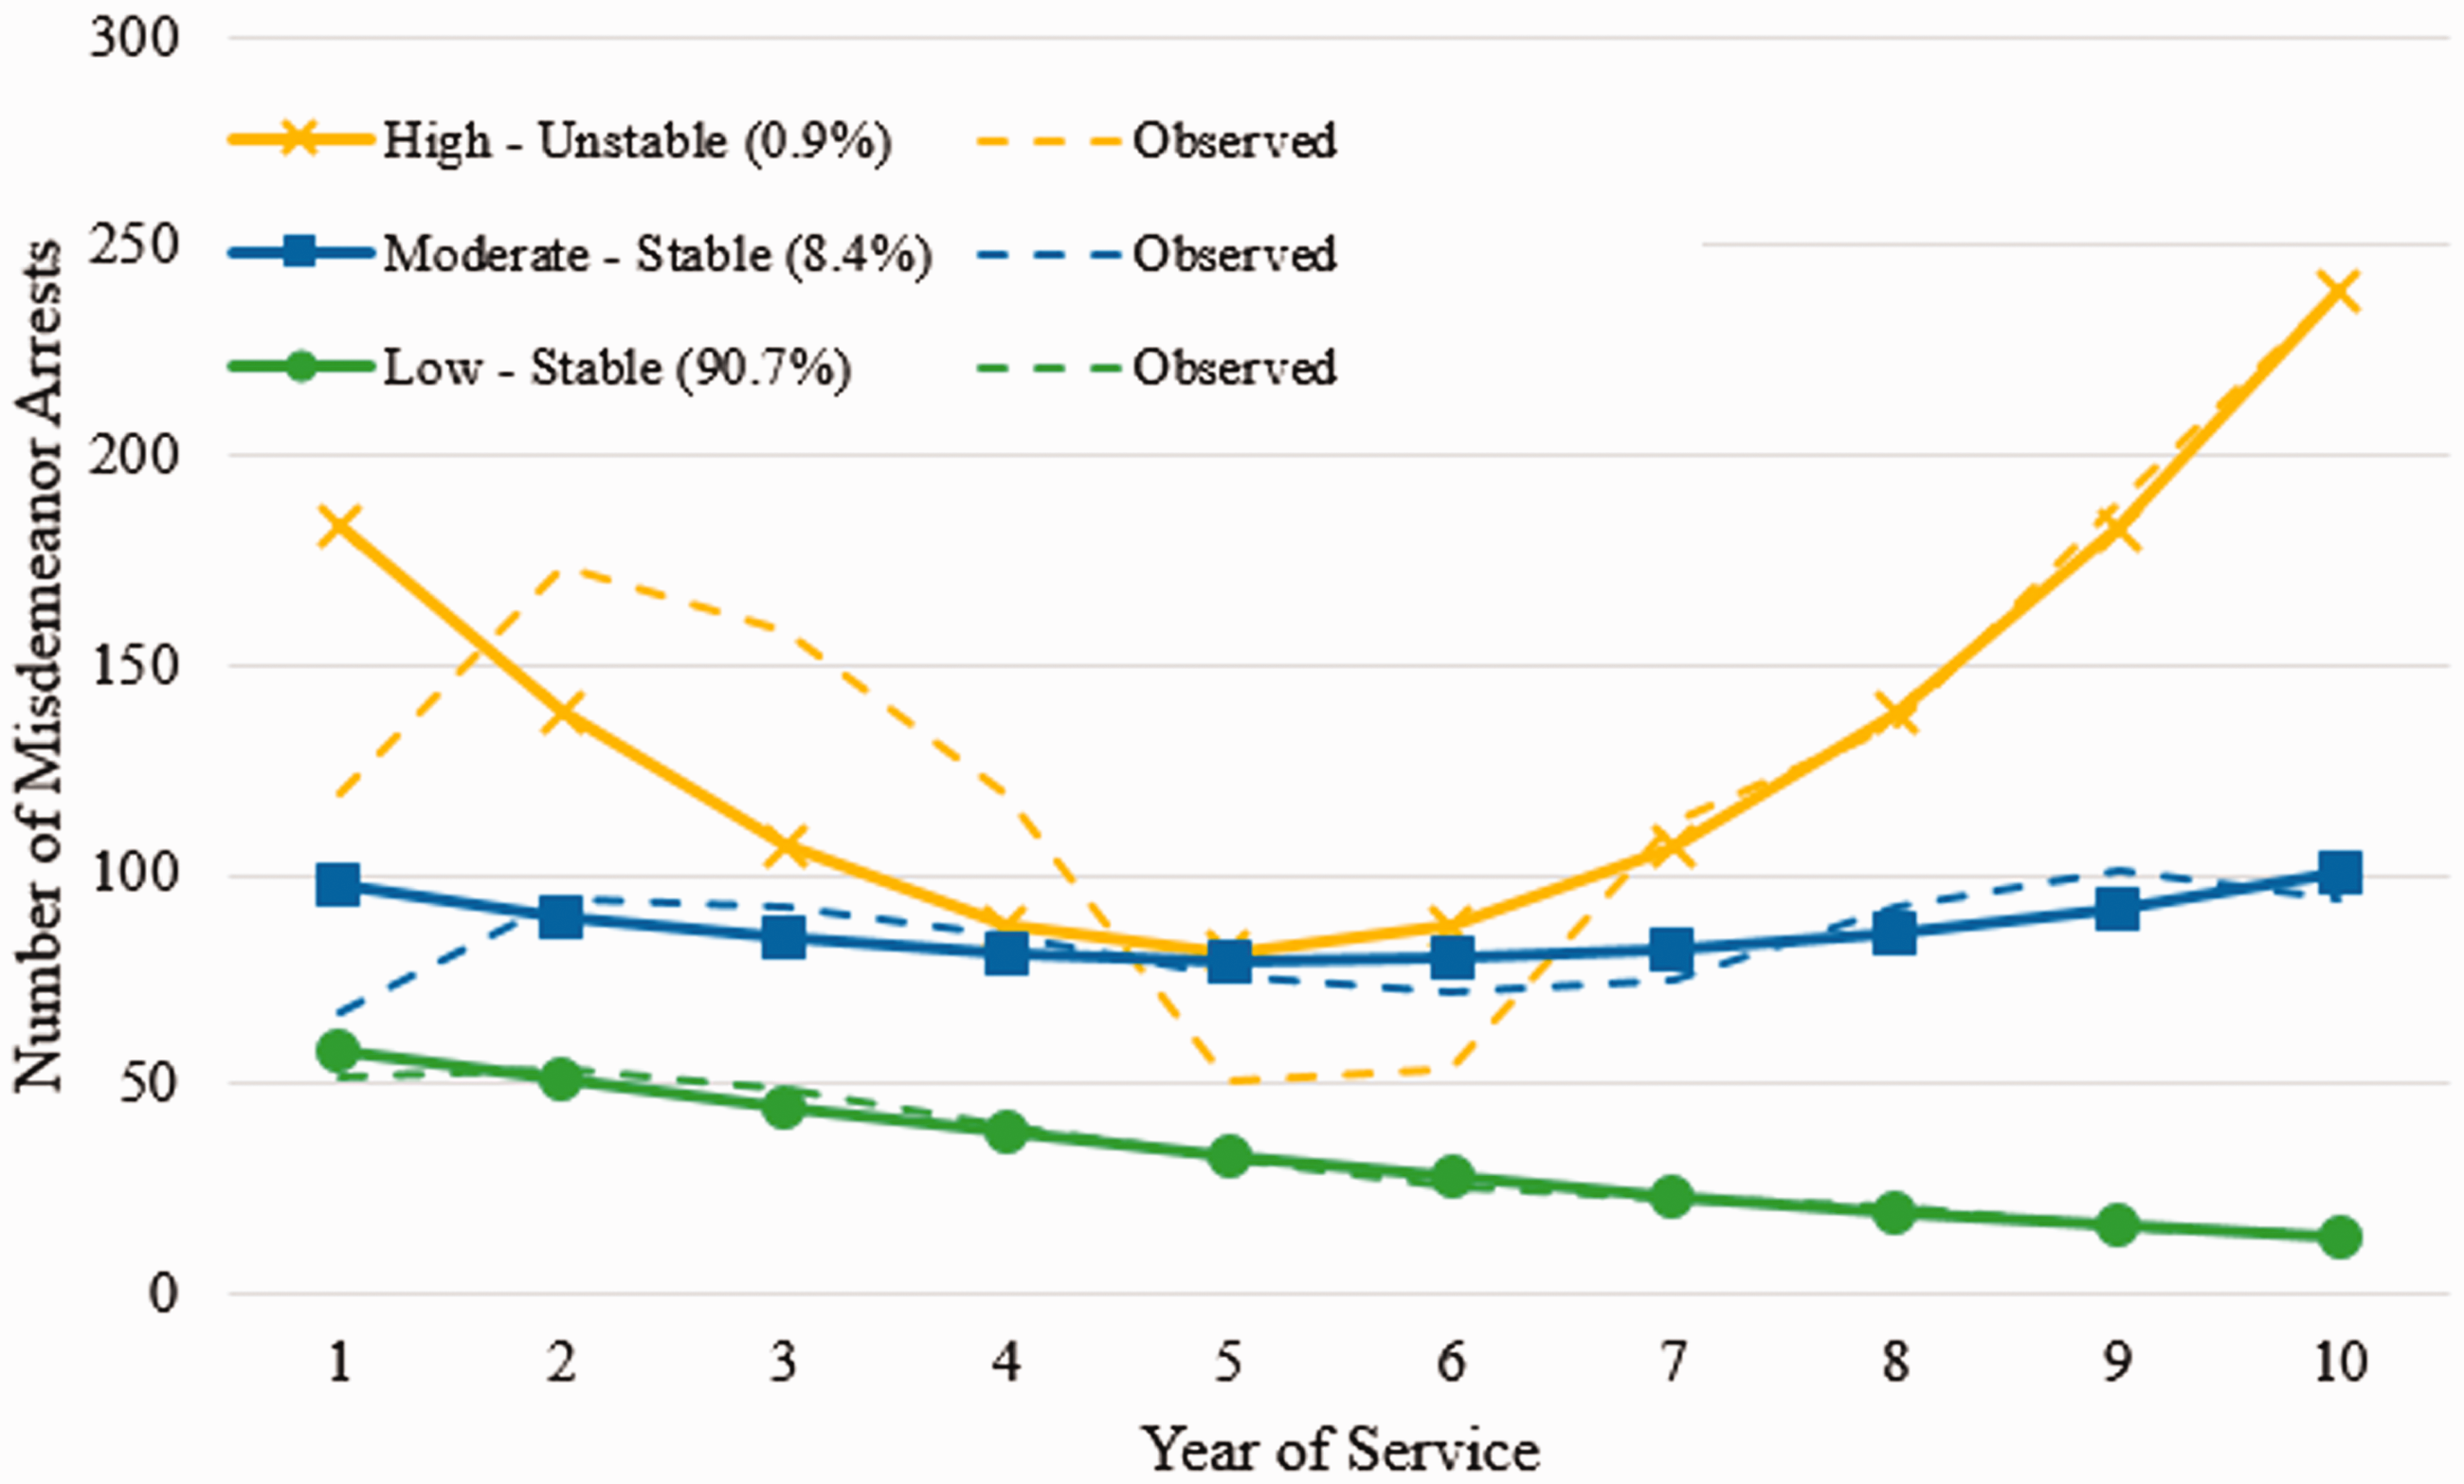
Misdemeanor arrest trajectories, first 10 years of service: LCGA three-class solution.

Felony arrest trajectories, first 10 years of service: LCGA three-class solution.
While the class proportions were similar, there were a number of differences between the misdemeanor and felony trajectories. The misdemeanor models (Figure 4) had much higher launching points than those of felony arrest classes, because low-level arrests are more common for young officers than serious felony arrests. In addition, high-producing classes (Low Increasing and High Unstable) for each arrest measure developed over time differently, despite having higher annual counts than the other groups. The Low-Increasing class in felony models gradually increased the number of felony arrests over time, while the High-Unstable group in misdeamenor models decreased in the first 6 years but eventually surpassed first-year arrest counts. While this may be the result of the low number of officers in each class, this could be the result of the nature of felony and misdemeanor arrest, with younger officers being less likely to be the arresting officer in a more serious offense.

Complaint officer trajectories, first 10 years of service: LCGA four-class solution.
Figure 4 displays the four citizen complaint growth curves for each of the extracted classes. Overall, most classes show reductions in annual complaint counts over their career, despite varying degrees of reduction. About 75% of the sample was fit into the Low-Stable or Moderate-Stable group. Similar to the arrest modeling, these two groups remained stable over the officers’ 10 years of service, one with a consistently lower number of complaints per year. The two less prevalent groups (High-Stable and High-Decreasing) accounted for 13% and 12% of the sample, respectively. Officers in these two groups averaged over double the number of misdemeanor and felony arrests per year than Low-Stable and Moderate-Stable classes. If the sample officers were averaged across the 10 years, rather than modeling them using LCGA, officers in High-Stable complaint class averaged 12.5 complaints per year, while those who fit into the High-Decreasing class averaged 6.3 complaints per year. The high-producing classes appear to be more productive generally, with more complaints and arrests per year.
Because there were no unique growth curves for internal organizational performance evaluations, there are no trajectories; however, we present the unconditional model for the one-class solution. This allowed us to visualize how evaluations varied over time on average. Figure 5 depicts the change over time for the sample of officers. The curve shows officers have relatively low performance evaluations in the first year, followed by steady growth until about the 7th year of service. The last 3 years of service, Year 8 to Year 10, are marked by a slight reduction. The performance trajectory shows that officer performance steadily improves as they gain more experience on the job, but there may be a point later in their career they begin to regress.
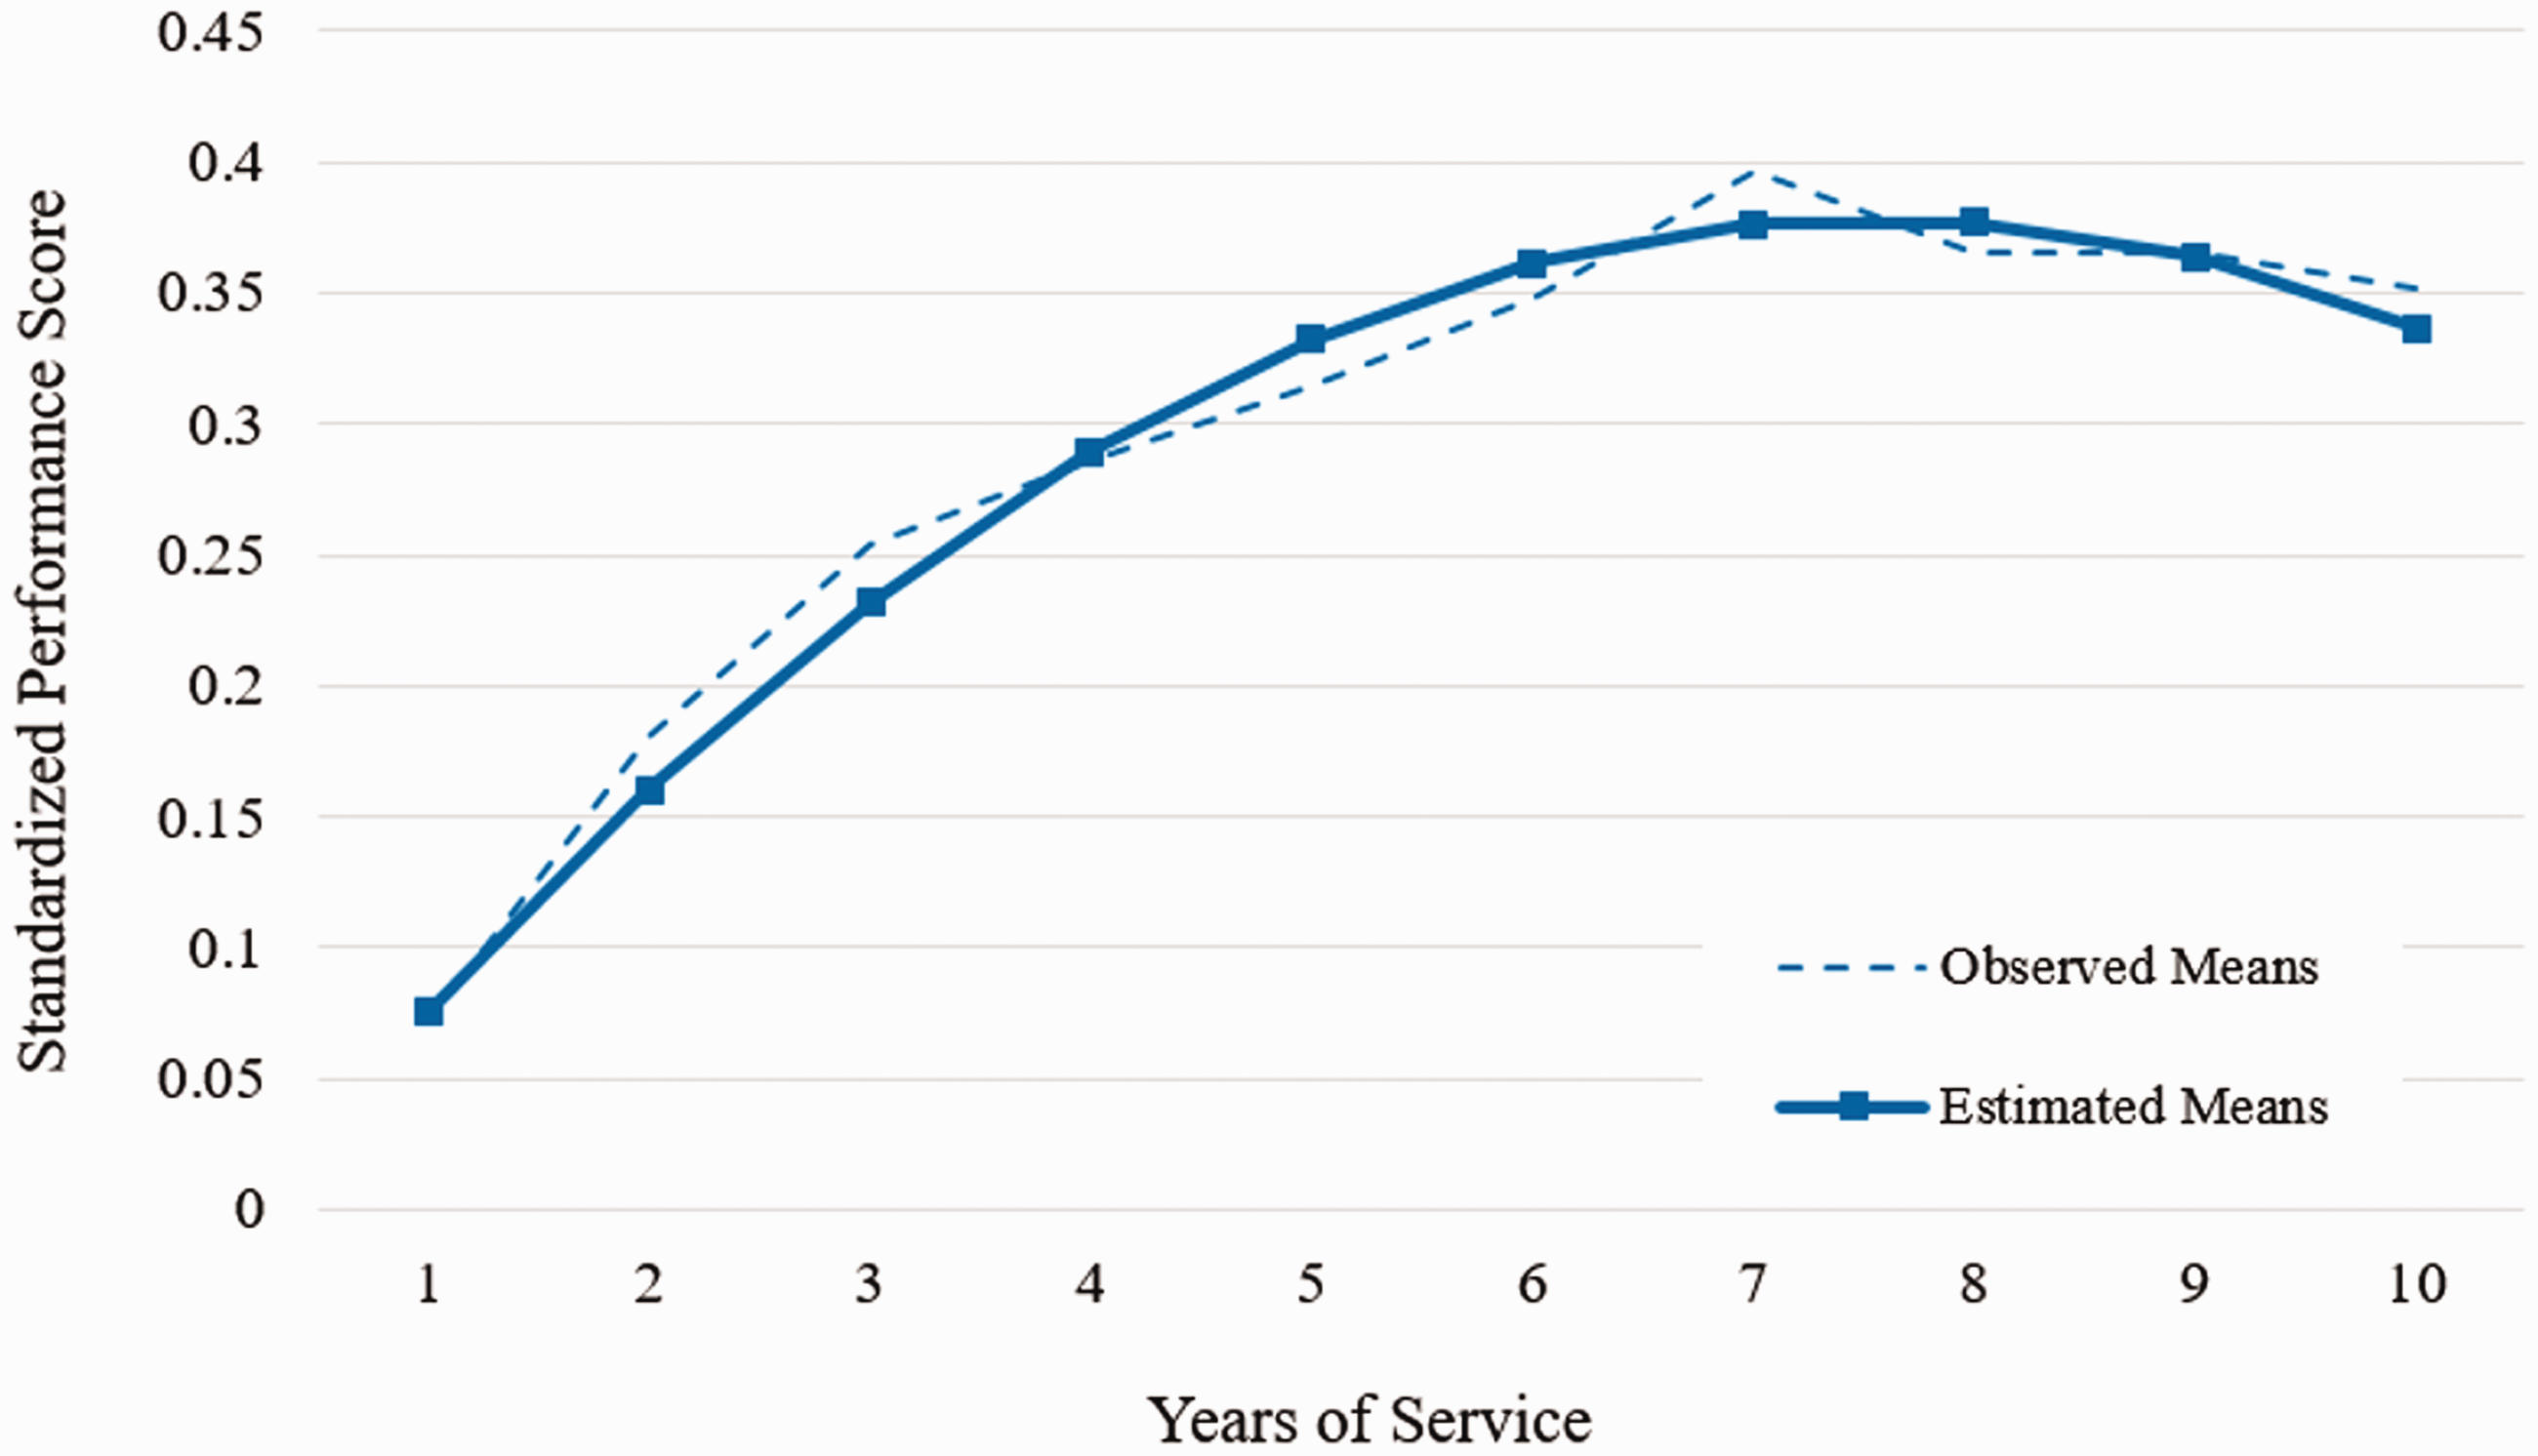
Average performance evaluation, first 10 years of service: LGCA one-class solution.
Table 4 describes the average number of arrests and complaints if we simply averaged across the first 10 years of service rather than modeling the growth using LCGA. It supplements the three major trends. First, most officers have low or moderate number of arrests and complaints per year and remain stable over their first 10 years of service. These groups tend to make up at least three quarters of the sample but tend to account for a smaller proportion of the total number of arrests and complaints for the full sample. Instead, a small number of officers fit into more productive classes. Despite making up a small portion of the sample, these officers average higher numbers of misdemeanor and felony arrests and more overall complaints per year. Last, officers who were fit into the high-producing trajectory classes tended to have more arrests (misdeamenor and felony) and complaints per year than the low and moderate group. For example, the High-Stable complaint class averaged more misdeamenor arrests and nearly doubled the average number of felony arrests than all other classes.
Average Officers’ Arrest and Complaint Counts Across 10-Year Period.

Effect of Covariates on Productivity and Success Outcomes
In the following, we present the last step in assessing the productivity and performance of officers over time. Trajectory intercepts and slopes may have changed slightly after being conditioned by the other covariates. For example, after controlling for factors, the intercept of the High-Stable misdeameanor arrest class matched that of the Moderate-Stable class. Because this step in our analysis is largely exploratory, the individual coefficients should be read with care; instead, attention should be paid to the differences in control variables between classes. Class sample sizes may be altered slightly due to missing data in one or more of the independent variables and the refinement of class membership after adding extra predictors. Effect sizes may be absent for the small classes (such as the High Unstable felony arrest class).
Starting with arrest and complaint models, we regressed class membership on control and experiential covariates, making it a series of multinomial regression models, which was incorporated in the trajectory prediction model to avoid conflicts with error (see Nagin, 1999). It should be noted these models simply shed light on what might be leading to differences in groups. The estimates produced in the multinomial regression results are all in reference to the most prevalent class. To better assess internal performance evaluations, we regressed the intercept and slopes on control, experiential covariates, and the other trajectory classes. This process allowed us to consider whether the various trajectory classes were more likely to receive better performance evaluations over time. We examined models with and without trajectory classes to assess the sensitivity of the findings, and there were no discrepancies in variable significance or direction/magnitude of effect sizes.
Law Enforcement Productivity: Misdemeanor and Felony Arrests
Tables 5 and 6 display the multinomial logistic results when regressing arrest class membership on the covariates. Recall, the small class size precluded us from including prior military and law enforcement experience as experiential variables. As stated earlier, the intercepts, slopes, and class sizes have changed slightly. While this is normal, it also shows the sensitivity the arrest models have because of the small, highly productive classes. Generally, we see each of the classes decreased (to some degree) in their first 5 years, followed with varying degrees of growth in the latter 5 years. The High-Stable class in misdemeanor models and the Low-Increasing group in the felony arrest models both should significantly steeper growth than the other groups.
Conditional Model Presenting Multinomial Regression Results With Misdemeanor Arrest Class Membership Regressed on Control Variables.

Note. SPOTA = State Peace Officer Training Academy.
As results of a multinomial regression, a reference category was assigned in each model. The class with the most officers was designated as the reference category because it was most typical class. All estimates are in reference to this category.
Due to the small class size, no coefficients were produced.
†p < .1. **p < .01. ***p < .001.
Conditional Model Presenting Multinomial Regression Results With Felony Arrest Class Membership Regressed on Control Variables.

Note. SPOTA = State Peace Officer Training Academy.
As a result of a multinomial regression, a reference category was assigned in each model. The class with the most officers was designated as the reference category because it was the most typical class. All estimates are in reference to this category.
Due to the small class size, no coefficients were produced.
***p < .001.
The most populous class for both arrest types were those with a low volume of arrests, both making up nearly 90% of the sample and assigned as the reference category in each. Only two variables were significantly linked to arrest among the arrest models. When examining the composition differences among misdemeanor trajectories, only SPOTA academy score was significant. Officer matched into the High-Stable and Moderate-Stable classes had higher academy performance scores that the Low-Stable class. When examining composition differences among felony arrest trajectories, only officer age was significant. Officers fitting into the Moderate-Stable class were younger, on average, than those in the Low-Stable class. This suggests younger officers and those performing better in the academy are more likely to be slightly more productive in term of arrest counts in the first 10 years of service.
Behavior Assessments: Citizen Complaints
Table 7 shows the multinomial logistic results when regressing complaint class membership on officer characteristics. As stated earlier, the intercepts and slopes have been conditioned by the covariates, but generally show the different “launching” points of each trajectory and slope, or growth over time. As expected, the High-Stable and High-Decreasing groups have higher Year 1 complaint counts. In addition, the lack of significant slopes suggests all groups, with the exception of the High-Decreasing, followed similar growth over time. The High-Decreasing group slowly increased in the first 5 years, followed by a steep decrease in the latter 5 years. 7
Conditional Model Presenting Multinomial Regression Results With Complaint Class Membership Regressed on Control Covariates.

Note. SPOTA = State Peace Officer Training Academy.
As results of a multinomial regression, a reference category was assigned in each model. The class with the most officers was designated as the reference category because it was most typical class. All estimates are in reference to this category.
Due to small class sizes, there were no female in this class. Therefore, this coefficient could not be estimated.
†p < .1. *p < .05. **p < .01. ***p < .001.
Using the Low-Stable group as the reference category, there were only two significant differences in the composition of the trajectory groups. First, the Moderate-Stable class and High-Stable classes were less likely to contain women (there was little variation in the High-Stable class, failing to present an estimate) than the Low-Stable class. Women were 2 times more likely to be in the Low-Stable than the Moderate-Stable class, suggesting women in this sample tended to receive fewer complaints over time. In addition, younger officers were significantly more likely to be matched into the High-Decreasing or Moderate-Stable class than the Low Stable class. Rather, officers who entered the force at an older age were less likely to receive many complaints over time. There were no other significant predictors of class membership, including academy performance.
Internal Organizational Performance Evaluations
Table 8 presents the results from the LGCA, regressing intercept, and slopes on the covariates and officer trajectory classes. Rather than simply assessing demographic differences, we included dummy variables for each of the trajectory classes, where the most populous group (the Low Stable groups) was the reference category. We also assessed the models separately and jointly to check for sensitivity of findings. These models allow covariates to assess the intercept (“launching point”), and each slope (Slope 1 representing the early portion of the career and Slope 2 representing the latter portion of their career).
Conditional Model Presenting Random Latent Growth Results of Performance Evaluations.

Note. Unlike the growth analysis, missing data were treated with list-wise deletion. This resulted in 60 cases with missing data and reduced the sample to 418 cases; all but two cases were caused by incomplete training academy data (specifically SPOTA scores). All trajectory classes are dummy-coded, with the Low-Stable class as the reference category. SPOTA = State Peace Officer Training Academy, LE = Law Enforcement.
p < .1. *p < .05. **p < .01. ***p < .001.
In assessing the intercepts, only two demographic or control variables were significant. Both women and non-White officers had significantly lower performance evaluations in the first year. These findings remained consistent throughout sensitivity checks. On average, female officers and non-White officers have initial performance evaluations that were nearly 4 times and 3.8 times lower than that of males and White officers, respectively. Interestingly, experiential factors that we thought would increase officers’ performance scores (military or prior law enforcement experience) were not significantly related to the intercept nor was an officer’s successful performance in the police academy.
In addition, only one trajectory class (High-Decreasing Complaint class) had significantly lower “launching point,” with nearly 2 times more complaints than those that were not in the respective class. Interestingly, this class was not significantly related to either slope, suggesting their volume of complaints may have affected either their future behavior or assignment which dictated their future assignment. Either way, it appeared officers in the High-Decreasing complaint class were graded more harshly in their performance evaluations than their counterparts.
When examining the slopes of officers’ careers, there were only two demographic or experiential variables that predicted better performance evaluations. First, age significantly predicted growth throughout the first 5 years, suggesting younger officers grew at a higher rate than officers who entered the force at an older age. This effect was reversed in the second half of the sample’s career, suggesting older officers “caught up” to the younger officers who benefitted in the early stage of their career. In addition, those with prior law enforcement experience also improved their performance evaluations faster than their counterparts. As with age, the opposite was true in predicting the second slope. This suggested a “catching up” effect for officers without prior law enforcement experience. The nonsignificant findings, among gender, race, and age, suggest the all groups develop over time similarly. Unfortunately, that also means the performance scores of female and non-White officers remain lower than their counterparts and never “catchup” from their lower intercept points.
There were two trajectory groups, however, that were linked to a worsening or reduction in evaluation scores over time. The High-Stable misdemeanor class and the High-Stable complaint class both had reductions in the performance evaluations in the early stages of officers’ careers. The positive significant association with these classes in the latter portion suggests officers in these classes eventually caught up with their counterparts.
Overall, these models suggest there are very few demographic or experiential factors that we included that can predict officers’ performance over time. There were a handful of demographic or experiential factors that differentiated trajectory classes, but none were consistently associated with better or worse performance. For example, officers who performed better in the academy were more likely to be in the High-Stable or Moderate-Stable misdemeanor arrest class, but academy performance was not significantly associated with any other measure. Using the latent growth analysis, we were able to show officers generally developed similarly over time. Even when differences were found in the growth, they eventually “caught up” or corrected to match their counterparts. This is true with two exceptions; minority and female recruits never caught up to their White or male counterparts after receiving significantly lower initial evaluations. Neither sex nor race significantly predicted either slope.
Discussion
Police departments are increasingly expected to use data to hire “ideal” officers and even identify “problematic” officers before their career history is established. These are often done through early warning systems, recruit screenings, or setting employment criteria that have been linked to performance (e.g., requiring college degrees). The primary purpose of the present study was to examine the productivity and performance of a sample of police officers during the first 10 years of their law enforcement careers and to increase our understanding of the possible relationship between selection and hiring criteria and officer career performance. To understand development over time, we used a number of metrics police departments regularly collect during the selection and hiring process. Law enforcement productivity was defined in terms of misdemeanor and felony arrests, while officer internal agency assessment of quality was operationalized using performance evaluations and behavioral assessments indicated by citizen complaints. Based on these metrics and the results of our analyses, at least three broad conclusions are warranted.
First, in terms of complaints, misdemeanor arrests, and felony arrests, distinct career course trajectories were identified. In particular, there was a small class that accounted for the most volume of the outcome and the most populous class accounting for the least volume of the outcome. Consistent with literature suggesting developmental typologies (e.g., Muir, 1977; Van Maanen, 1974), these findings support the notion we cannot expect all officers to perform similarly (Harris, 2016). That is, they may be given different units or assignments, face different hardships on the streets, or fall into workgroups that socialize differently than others. Interestingly, we found only one instance (misdemeanor arrests) where academy predictors (i.e., SPOTA score) were significant, meaning an officer’s performance in the academy, using this metric, did not influence most of our career performance measures. Further, there were a number of trajectory classes (based on arrest or complaint data) that were associated with worse performance evaluations than their counterparts. Thus, academy performance generally does not predict career success.
Second, there were no group-based trajectory differences in terms of performance evaluations in the first 10 years of officer careers. In other words, there was not a group of officers that began and remained “good” officers throughout their careers. Conversely, there was not a group of officers that consistently received poor performance evaluations over time. Instead, generally most officers started their careers with below-average evaluations, improving within the first 5 years, and slowly decreasing in the last years of service as they became less active. This is perhaps unsurprising because research suggests that supervisors often rate even problematic officers positively on most performance indicators (e.g., Toch, 1995)—resulting, in this case, in only one group trajectory for performance evaluations. Yet, our findings also support and refine those of Henson et al. (2010), who found that female and minority officers are assessed and perform differently than male and White officers. Both female and non-White officers had significantly lower starting performance evaluations, which never “caught up” to their peers. Furthermore, female officers fit into classes with the lowest complaints and arrest counts.
Third, while there is debate about the usefulness of latent class trajectory analyses, the extant research would suggest different typologies of officer development do exist, and furthermore, that small outlier groups exist at the high and low end of a police department, which would be reflected in performance evaluations (e.g., Barker, 1999; Brown, 1988; Muir, 1977; Toch, 1995; Van Maanen, 1974). However, our analysis of performance evaluations did not support that particular notion. Breaking the sample into different groupings did not improve model fit statistics, leaving us to consider three possibilities. First, there is, in fact, no group of officers that are inherently “better” at police work than others. In this case, it is important to understand what factors influence performance over time. Second, the performance evaluation tool and definitions of what makes a “better” officer likely varies among supervisors who differ in their beliefs about the overall importance of certain forms of behavior when assessing officer quality. Remember, the Christopher Commission found that many “problem officers” received very positive evaluations (Toch, 1995). Third, there are norms shared among supervisory officers that dictate standardized scores for differing experience or tenure—and possibly for female and non-White officers.
To shed light on these possibilities, we examined what factors influenced performance evaluations and then followed the same process to understand different components of police productivity and performance (citizen complaints and arrest productivity). Our intent was to examine, where possible, the relationship between traditionally valued selection and hiring characteristics (i.e., prior military or law enforcement experience, academy test scores) and officer behavior during their career. We did not find definitive evidence to suggest we know much about the predictors of performance evaluations over time. It appears that female and non-White officers were judged lower than their male and White peers on average and that they remained lower throughout their careers. While not presented in the text, we also found some evidence to suggest arrests and complaints are factored into performance evaluations but were valued differently at different times in officers’ careers. We did find that officers with prior law enforcement experience—a selection criteria—start their careers with higher performance evaluation scores than younger officers, though younger officer scores tend to increase over time and are similar to older officer evaluations later in their career.
We concede that arrest activity and citizen complaints are nowhere near exhaustive components of police performance, but we examined how these measures changed throughout officers’ careers and what factors influenced them. Unlike performance evaluations, groups of officers developed differently than others in terms of citizen complaints, misdemeanor arrests, and felony arrests. In each instance, most officers fit into a low-volume trajectory, with few complaints and arrests over time. In addition, a small number of officers fit into a single trajectory group that had a large volume of complaints or arrests, which is generally consistent with prior research (e.g., Brandl et al., 2001; Crank, 1993; Friedrich, 1980; Harris, 2009). Often you learn more about populations when you compare the most populous group with the most active group. Except for age, there were no consistently significant factors. The low-volume complaint group was more likely to include experienced and older officers, where the others, particularly the high-volume groups, tended to be younger (see also, Greene et al., 2004; Henson et al., 2010). Finally, officers with higher police academy scores generated a higher volume of misdemeanor arrests.
Considerations for Future Research
What makes a “good” officer? Generally, we expect the police to effectively control and prevent crime while respecting the rights and privacy of citizens. Since the advent of community and problem-oriented policing, the role of police has expanded beyond traditional crime fighting (Wilson, 2012). Indeed, the modern policing mandate expects officers to engage in community processes and activities, provide victimization services, and work with community service agencies, in addition to more traditional crime fighting activities (Alpert & Moore, 1993). Wilson (2012), in his review of the challenges to staffing, noted that the police role now includes, in addition to community-based activities, tasks associated with maintaining homeland security and investigating emerging crimes. Davis et al. (2015) noted that the job has become increasingly complex requiring officers to engage in behaviors focused on procedural justice and fair treatment, community partnerships, and handling mentally impaired citizens—all of these behaviors are unaccounted for in traditional performance measures. In addition, how do we account for officers who effectively deescalate a situation that may have resulted in a citizen complaint or a violent encounter—a behavior that rarely leaves a paper trail?
All of the aforementioned factors highlight the difficulty measuring officer performance, but identifying influences on officer productivity and performance over their careers is also a methodological challenge. More specifically, officer assignment to specific units or neighborhoods is likely to influence arrest activity especially involving felony arrests. Officer vigor in high-crime areas may be directed at the presence of more serious crimes (Klinger, 1997), while officers assigned to wealthy, low-crime communities may have less opportunity to make these arrests. Officer assignments to certain beats, districts, and units may vary during a year and throughout the officer’s career, making them difficult to model in a longitudinal analysis. As to citizen complaints, they can be driven by factors beyond an officer’s control and may also be the result of assignment to a specific unit or neighborhood. At the same time, our data suggest that officer complaints were likely the result of either improper or abrasive officer behavior during an interaction.
Perhaps instrumental measures cannot serve as appropriate proxies to officer behavior, and researchers must use systematic observations. Fielding and Innes (2006), for example, contended there is a need for both qualitative and quantitative data to evaluate police performance. Police agency data collection, however, rarely if ever, includes more than limited qualitative data contained in a formal report, and most of it is not easily accessible. Regardless, simply because it is difficult to measure these factors with data regularly collected by agencies does not mean that we should not use the data that are available—even if they possess limitations. Supervisory performance evaluations are designed to capture the quality of policing, wherein supervisors are presented with a number of qualities to consider and consolidate the scores into a single numeric value that describes how favorably the officer is performing. At some level, these evaluations should tap into the multiple dimensions of the police role, and supervisors may also account for the challenges to successfully performing in those roles.
Limitations
Like most social science research, the current study is not without limitations, and our findings should be considered in this light. In brief, these issues surround measurement and the analytic technique. Regarding measurement, while our data were expansive, they did not include personality measures, workgroup or organizational factors, assignment, or other factors discussed in the police decision-making literature (e.g., Van Maanen, 1974). For example, we cannot capture how measures change with reassignment to new geographic areas or units, which can affect exposure to different opportunities. These measures are both logistically and theoretically hard to collect for policing studies. While this is a limitation, our findings suggest researchers and police departments likely need to better understand and collect these data to accurately model and predict officer behavior.
In addition, the nature of the analytic process necessitates that the researcher make decisions that can affect study results (Nagin & Tremblay, 2005). For instance, we have direct control over how many different groups exist and thus the shape of the trajectories. Relatedly, if we allow classes with a very small number of cases, we greatly restrict our generalizability. We can identify the small number of officers who may be operating at upper and lower bounds of productivity and success, but we have to be careful in making claims of what types of officers fall into those classes. We attempted to discuss findings in a comparative manner, rather than a predictive future-looking way, which is often a natural, yet misleading, way of looking at the results of class growth models. Throughout the analytic process, we conducted a number of sensitivity checks, modeled trajectories using different coding schemas and covariates. This process allowed us to assess whether the same general findings found under different conditions, and that we were confident there were no anomalies or unstable findings.
Conclusion
As police departments are increasingly expected to predict the future behavior of potential recruits and hires, the results of the current study suggest that this is a lofty and likely unachievable goal—at least with the data that are currently available. This study used a robust dataset, with nearly 500 officers and 10 years of data points, but in some respects, we are still left without context for the numbers and trends. Our findings suggest even recruits’ performance in the training academy, a process used to identify and address strengths and weaknesses, was often insufficient in predicting officer’s behavior over time.
We aimed to understand how officers grow and change throughout their careers, with the expectation they learn and grow in ways that make them better officers over the career course. In doing so, we included multiple outcome variables to understand officer performance over time. It is clear that there is distinct group trajectory growth for citizen complaints and arrest counts. However, we were unable to consistently identify predictors of growth over time. Further, despite the presence of distinct group trajectory growth for citizen complaints and arrest counts, there was a lack of variation in performance evaluation growth among officers over the course of 10 years on the police force, or consistently significant predictors of that performance.
Thus, qualitative interviews and observations of police in the field would provide added depth of understanding to the quantitative analyses. Qualitative studies should be directed at understanding officers from their perspective; first and foremost, we should identify what traits officers associate with “good” officers, and how we can capture that sentiment in operational measurements. Second, we should seek to understand the process of evaluating officers, in hopes to more reliably and uniformly assess the qualities of productive and active officers.
Overall, this article highlights four important considerations for police administrators and researchers. First, researchers and police departments can benefit from collecting currently unmeasured officer or organizational factors, which may be key to predicting officer behavior before they have develop a work history. Second, as noted in prior research, the relationship between complaints and arrest activity must be considered. Agencies probably need to be willing to accept some level of complaints if they emphasize aggressive policing. Third, factors associated with the hiring process need to be revaluated to assess whether they are achieving their objectives, and if not, others may need to be developed. Finally, there is a need to examine in detail the finding that females and minority officers tend to be evaluated at lower levels than males and White officers.
Footnotes
Declaration of Conflicting Interests
The authors declared no potential conflicts of interest with respect to the research, authorship, and/or publication of this article.
Funding
The authors received no financial support for the research, authorship, and/or publication of this article.
