
Abstract
Objectives
Soft tissue sarcomas (STSs) are rare, heterogeneous cancers with over 70 subtypes, often diagnosed late due to diagnostic complexity, leading to poor outcomes. We aimed to identify and validate novel transcriptomic biomarkers for the diagnosis and prognosis of STS using an integrative machine learning and bioinformatics framework applied to publicly available cohorts.
Methods
RNA-seq and clinical data from 261 STS samples were obtained from The Cancer Genome Atlas (TCGA). A multi-step analytical pipeline was implemented, including differential expression analysis, functional enrichment, protein-protein interaction network construction, and clinical correlation assessment. Machine learning algorithms were employed for feature selection and model development. Diagnostic performance was evaluated using receiver operating characteristic curve analysis, and prognostic value was assessed using Kaplan-Meier survival analysis.
Results
We identified a 26-gene prognostic signature significantly associated with overall survival (15 upregulated and 11 downregulated genes). For diagnosis, A1CF alone showed an AUC of 0.70, while the combinations A1CF-ATP6V0D2 and A1CF-LECT2 achieved AUCs of 0.743 and 0.796, respectively. External validation confirmed dysregulation of A1CF in tumor tissues compared with controls.
Conclusions
This study identifies a novel 26-gene prognostic signature and A1CF-based diagnostic panels for STS using computational methods. These biomarkers represent exploratory candidates for future investigation in STS diagnosis and prognosis; however, experimental and prospective clinical validation are required before their potential use in early detection, risk stratification, or personalized management.
Keywords
1. Introduction
Soft tissue sarcomas (STSs) are rare and heterogeneous group of malignancies originating from mesenchymal tissue, such as muscle, fat, bone, and vascular structures, accounting for approximately 1% of adult and 15% of pediatric cancers.1-3 The World Health Organization recognizes over 70 distinct histological subtypes of STS, reflecting their considerable pathological diversity. 3 This pronounced heterogeneity presents significant challenges in diagnosis and clinical management, often leading to delayed detection and advanced disease at presentation.1,4 Therefore, the prognosis for STS patients remains suboptimal; approximately 50% of patients develop metastatic disease, and while the overall five-year survival rate is nearly 65%, it reduces to 10-16% for patients with high-grade tumors or distant metastases.1,5,6
The pathogenesis of cancer, including sarcoma, involves complex molecular alterations that enable uncontrolled cellular proliferation, evasion of apoptosis, and sustained angiogenesis. Modern high-throughput technologies, such as RNA sequencing (RNA-seq), allow for the comprehensive exploration of these processes at the transcriptomic level, providing unprecedented insights into tumor biology, intratumoral heterogeneity, and dysregulated signaling pathways.7-10 Concurrently, bioinformatics has become indispensable for interpreting these vast datasets, revealing critical genetic and transcriptional differences that underlie various malignancies.
In this context, machine learning (ML), a branch of artificial intelligence (AI), offers a powerful paradigm for identifying subtle, clinically relevant patterns within complex biological data.11-13 The integration of ML with bioinformatics holds exceptional promise for discovering novel molecular biomarkers, which are crucial for early diagnosis, accurate prognosis, and personalized treatment strategies.5,14 Such biomarkers can provide objective data for distinguishing malignancy subtypes and predicting tumor behavior.5,15 Pioneering efforts, such as the French Sarcoma Group’s CINSARC signature a 67-gene classifier identified through differential expression and ML demonstrate the potential of this approach to predict metastatic risk in sarcomas.16,17
Publicly available genomic repositories, such as The Cancer Genome Atlas (TCGA), provide a critical resource for such investigations by offering comprehensive, well-annotated molecular and clinical data across numerous cancer types, including STS.17-19 Leveraging this resource, the present study employs an integrative bioinformatics and ML framework to analyze a large cohort of STS samples. Our objectives are to identify robust differentially expressed genes (DEGs) and to validate novel diagnostic and prognostic biomarkers, thereby addressing a critical gap in the current management of STS.
2. Materials and Methods
2.1. Data Acquisition
We obtained RNA-seq expression data and corresponding clinical metadata for soft tissue sarcoma samples from The Cancer Genome Atlas Sarcoma cohort (TCGA-SARC) (https://tcga-data.nci.nih.gov/tcga/). The TCGA-SARC dataset included 261 tumor samples, comprising 51 metastatic, 121 primary, and 89 recurrent tumor samples. Because the main objective of this study was to identify prognostic biomarkers in STS, the TCGA-SARC cohort was used as the primary discovery dataset for tumor-based prognostic and survival-related analyses. Specifically, primary and metastatic tumor samples were included in the main TCGA-based analysis. For external validation, independent STS tumor and normal tissue samples were retrieved from GEO datasets GSE144190 and GSE21122. Because the objective of this study was to identify broadly relevant candidate biomarkers across the TCGA-SARC cohort, analyses were performed using a pan-STS approach. Subtype-stratified modeling was not performed because several histological subtypes had limited sample sizes, which could reduce statistical power and increase the risk of unstable estimates.
2.2. Data Preprocessing and Identification of Differentially Expressed Genes (DEGs)
The Top DEGs of TCGA Were Ranked by Deep Learning
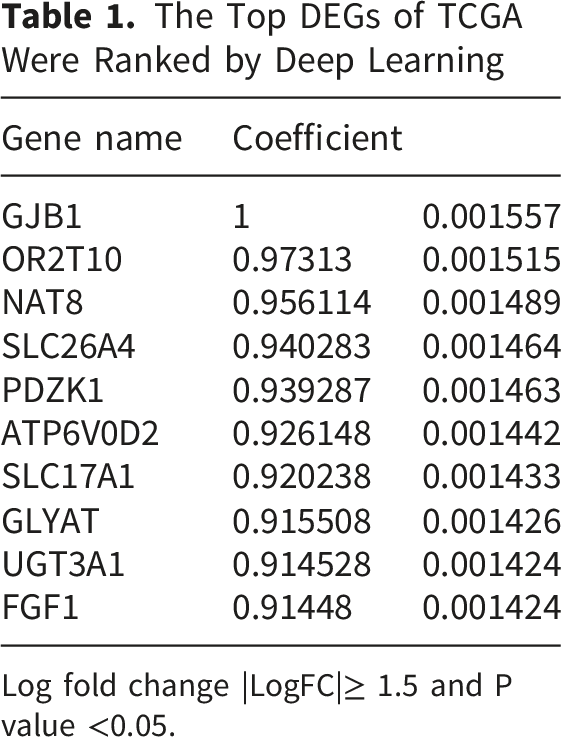
Log fold change |LogFC|≥ 1.5 and P value <0.05.
2.3. Identification of Prognostic Markers
To identify diagnostic and prognostic biomarkers, we performed a bioinformatic analysis integrating differential expression screening with ML. Multiple algorithms, including Random Forest (RF), Support Vector Machine (SVM), Logistic Regression, Decision Trees (DTs), and k-Nearest Neighbors (KNN), were employed for feature selection and classification.
2.4. Machine Learning Algorithms
In this study, deep learning (DL) was applied as part of the computational biomarker-discovery workflow to prioritize candidate genes from the filtered DEG set and to evaluate their predictive relevance for STS classification. After differential expression analysis and correlation-based feature filtering, selected gene-expression features were used as input variables for model development.
2.5. Computational Workflow
The DL model was configured with a learning rate of 0.01 and the Rectified Linear Unit (ReLU) activation function, and was trained for 20 epochs. The following standardized workflow was employed for model development, evaluation, and optimization.
2.5.1. Data Splitting
To enable an independent evaluation of model performance, the source dataset was partitioned into distinct training and test subsets. The training set was used for model optimization, while the held-out test set provided an unbiased assessment of its predictive capability.
2.5.2. Model Training and Validation
A 70/30 split was used to allocate data to the training and test sets, respectively. For each model, the fixed set of optimal hyperparameters was used to retrain the model on a randomly sampled training dataset, with final performance evaluated on the unused test data to estimate predictive generalization.
2.5.3. Model Evaluation
Machine Learning Algorithm

2.6. Implementation and Evaluation
All machine learning analyses were implemented in Python (version 3.7) utilizing key libraries including Pandas, NumPy, Matplotlib, and Scikit-learn. Models were trained on the training data and their performance was independently evaluated on the held-out test set.
To determine the optimal data partitioning strategy, various train/test splits (ranging from 40/60 to 95/5) were evaluated and compared. A 70/30 ratio was ultimately selected for all subsequent ML models, as it provided the best balance between training data volume and reliable testing, and was consistent with the partitioning used for the PPI network analysis.
Model performance was assessed using five distinct metrics to evaluate different aspects of predictive ability: accuracy, R2 Score, MSE, RMSE, and the AUC. The AUC quantifies the model’s overall ability to discriminate between classes across all classification thresholds. A higher AUC indicates superior discriminative performance.
Accuracy metric represents the proportion of total correct predictions (both true positives and true negatives) among the total number of cases examined, providing a general measure of classification correctness.
The R2 score was used to evaluate the performance of regression-based analyses within the feature selection process, indicating the proportion of variance in the response variable explained by the model.20-22
The MSE and RMSE were used to quantify prediction inaccuracy. The RMSE, in particular, is a widely adopted standard for assessing model performance. As it preserves the units of the response variable, it offers an interpretable estimate of the average prediction error magnitude and is a robust metric when errors are normally distributed.23,24
2.7. Functional and Pathway Enrichment Analysis
Functional enrichment analysis of the DEG signature was performed using the clusterProfiler package in R. Significantly enriched pathways and terms were identified with an adjusted p-value threshold of < 0.05. The selected prognostic genes were further annotated and visualized based on the Kyoto Encyclopedia of Genes and Genomes (KEGG) and Gene Ontology (GO) databases.
2.8. Protein–Protein Interaction (PPI) Network Analysis
The PPI network for the DEGs was constructed using the STRING database (https://string-db.org/). 25 An interaction score threshold of > 0.4 was applied to define statistically significant interactions. This network provides a framework for interpreting functional genomics and elucidating relevant cellular pathways.
2.9. Correlation Between DEGs and Clinical Characteristics
After identification of the 5204 DEGs, Spearman rank correlation analysis was performed to assess the relationships among DEG expression features and relevant clinical characteristics. Correlation coefficients were calculated in R using the cor function with the Spearman method, and the resulting correlation matrix was visualized using the ggcorrplot package. In addition, correlation-based filtering was applied after DEG identification and before machine-learning model construction to reduce feature redundancy. Features were filtered using the prespecified correlation coefficient threshold of Spearman’s ρ > 0.5.
2.10. Identification of Prognostic Markers
Prognostic potential was assessed for the top DEGs by generating Kaplan-Meier survival curves using the GDCRNATools and ggplot2 R packages. Genes were screened based on a hazard ratio (HR)> 1 and p-value< 0.05. This analysis identified 26 candidate prognostic genes, comprising 15 up-regulated and 11 down-regulated genes.
2.11. Combined Receiver Operating Characteristic (ROC) Curve
To assess the diagnostic efficacy of the biomarkers, we employed a generalized linear model (GLM) followed by a combined ROC curve analysis. This process was executed using the combioROC package in R. The discrimination ability of individual and paired biomarkers was quantified by determining the AUC, sensitivity, specificity, optimal cut-off value, positive predictive value (PPV), and negative predictive value (NPV).
2.12. Validation of Biomarker Gene Expression
The expression levels of the potential biomarker genes were validated using independent datasets from the GEO and TCGA via the Broad Institute’s Global Data Assembly Center (GDAC) firehose (https://gdac.broadinstitute.org/). Data from these repositories were obtained and pre-processed to analyze gene expression in independent STS patient cohorts.
3. Results
3.1. Patient Demographics
The Clinicopathological Characteristics of STS Patients

3.2. Identification of DEGs
Based on the predefined differential expression criteria, a total of 5,204 DEGs were identified in the exploratory tumor–reference comparison. These DEGs were considered the initial gene-level feature set for downstream analyses, including functional annotation, survival analysis, diagnostic evaluation, and machine-learning-based prioritization. The expression patterns of the identified DEGs are shown in the heatmap presented in Supplementary 1.
To reduce feature redundancy before machine-learning model development, a correlation-based filtering step was applied after DEG identification and before ML-based feature selection/model training. Specifically, Spearman rank correlation analysis was performed on the DEG expression matrix, and features were filtered using the prespecified correlation coefficient threshold (Spearman’s ρ > 0.5). The resulting reduced feature set was then used as input for machine-learning model construction and evaluation.
The machine-learning and deep-learning models were evaluated using five performance metrics: accuracy, R2 score, mean squared error, root mean squared error, and area under the receiver operating characteristic curve. Through this integrated DEG filtering and ML-based prioritization strategy, 26 key genes were selected for further prognostic and functional investigation. Among these, 15 genes were identified as upregulated in STS tumors, including HIST1H1E, C20orf152, CARTPT, ST7OT4, MAGEA8, HIST1H4E, RPA4, PRPS1L1, ZNF732, TAS2R10, ANGPTL3, UGT1A6, AQP2, KL, and CLCNKB. . Conversely, 11 genes were downregulated, including ADAM21P1, C6orf163, GDF7, DSCR9, LECT2, NCRNA00169, SNORD1C, TTC9B, PBLD, APOM, and PIPOX. These 26 key genes were selected for further prognostic and functional investigation.
3.3. GO, Functional Annotation, and Pathway Enrichment Analyses
To elucidate the functional implications of the key DEGs, GO functional annotation and KEGG/pathway enrichment analyses were performed. Enrichment results were considered statistically significant at an adjusted p-value threshold of p.adjust < 0.05. Pathway enrichment analysis revealed significant enrichment of several biologically relevant pathways, including Transmission across Chemical Synapses, GABA receptor activation, Potassium Channels, GPCR ligand binding/GPCR downstream signaling, Collagen formation, Collagen degradation, Extracellular matrix organization, and Drug ADME/Biological oxidations, all of which met the predefined adjusted significance threshold of p.adjust < 0.05 (Figure 1a). These enriched pathways suggest that the identified DEGs are involved in neurotransmission-related signaling, ion-channel regulation, extracellular matrix remodeling, GPCR-mediated signaling, and metabolic/xenobiotic-related processes. Functional enrichment analysis of differentially expressed genes in soft tissue sarcoma. (A) Pathway enrichment network of DEGs identified in the TCGA-SARC cohort, showing important enriched pathways including synaptic transmission, GABA receptor activation, potassium-channel activity, GPCR signaling, collagen formation/degradation, extracellular matrix organization, biological oxidation, and drug ADME-related pathways. Node size represents the number of genes, and node color indicates the adjusted p-value. (B) Functional annotation network of enriched biological processes, highlighting extracellular matrix remodeling, cell-junction organization, ion-channel transport, small-molecule transport, collagen biosynthesis, muscle contraction, and receptor-mediated signaling. DEGs, differentially expressed genes; STS, soft tissue sarcoma; GPCR, G-protein-coupled receptor; ADME, absorption, distribution, metabolism, and excretion
GO/functional enrichment analysis further supported the involvement of the DEG set in cellular communication, matrix organization, ion transport, and signaling-related biological processes. The most relevant significantly enriched functional terms included Extracellular matrix organization, Cell junction organization, Ion channel transport, Transport of small molecules, Collagen biosynthesis and modifying enzymes, Muscle contraction/striated muscle contraction, Neuronal system/neurotransmitter receptor-related signaling, and Regulation of gene expression in beta cells. All listed GO/functional terms met the adjusted significance threshold of p.adjust < 0.05 (Figure 1b). Collectively, these results indicate that the DEGs are primarily associated with extracellular matrix remodeling, cell-cell communication, membrane transport, ion-channel activity, receptor-mediated signaling, and tissue-structural organization.
3.4. Correlation Between Clinical/Demographic Data and DEGs
Correlation analysis of clinicopathological and demographic variables showed a moderate positive correlation between race and ethnicity (r = 0.30, p = 0.000056). Gender showed a weak but statistically significant correlation with race (r = 0.20, p = 0.006) and between metastatic diagnosis and neoplasm cancer status (r = 0.10, p = 0.011). No strong correlations were identified among the evaluated variables. The correlation matrix is shown in Figure 2. Correlation matrix of clinical and demographic variables in the TCGA-SARC cohort. Blue and red circles indicate positive and negative correlations, respectively. Circle size and color intensity are associated with the magnitude of the correlation coefficients. Crosses indicate non-significant correlations. The strongest observed association was between race and ethnicity, while other significant correlations were weak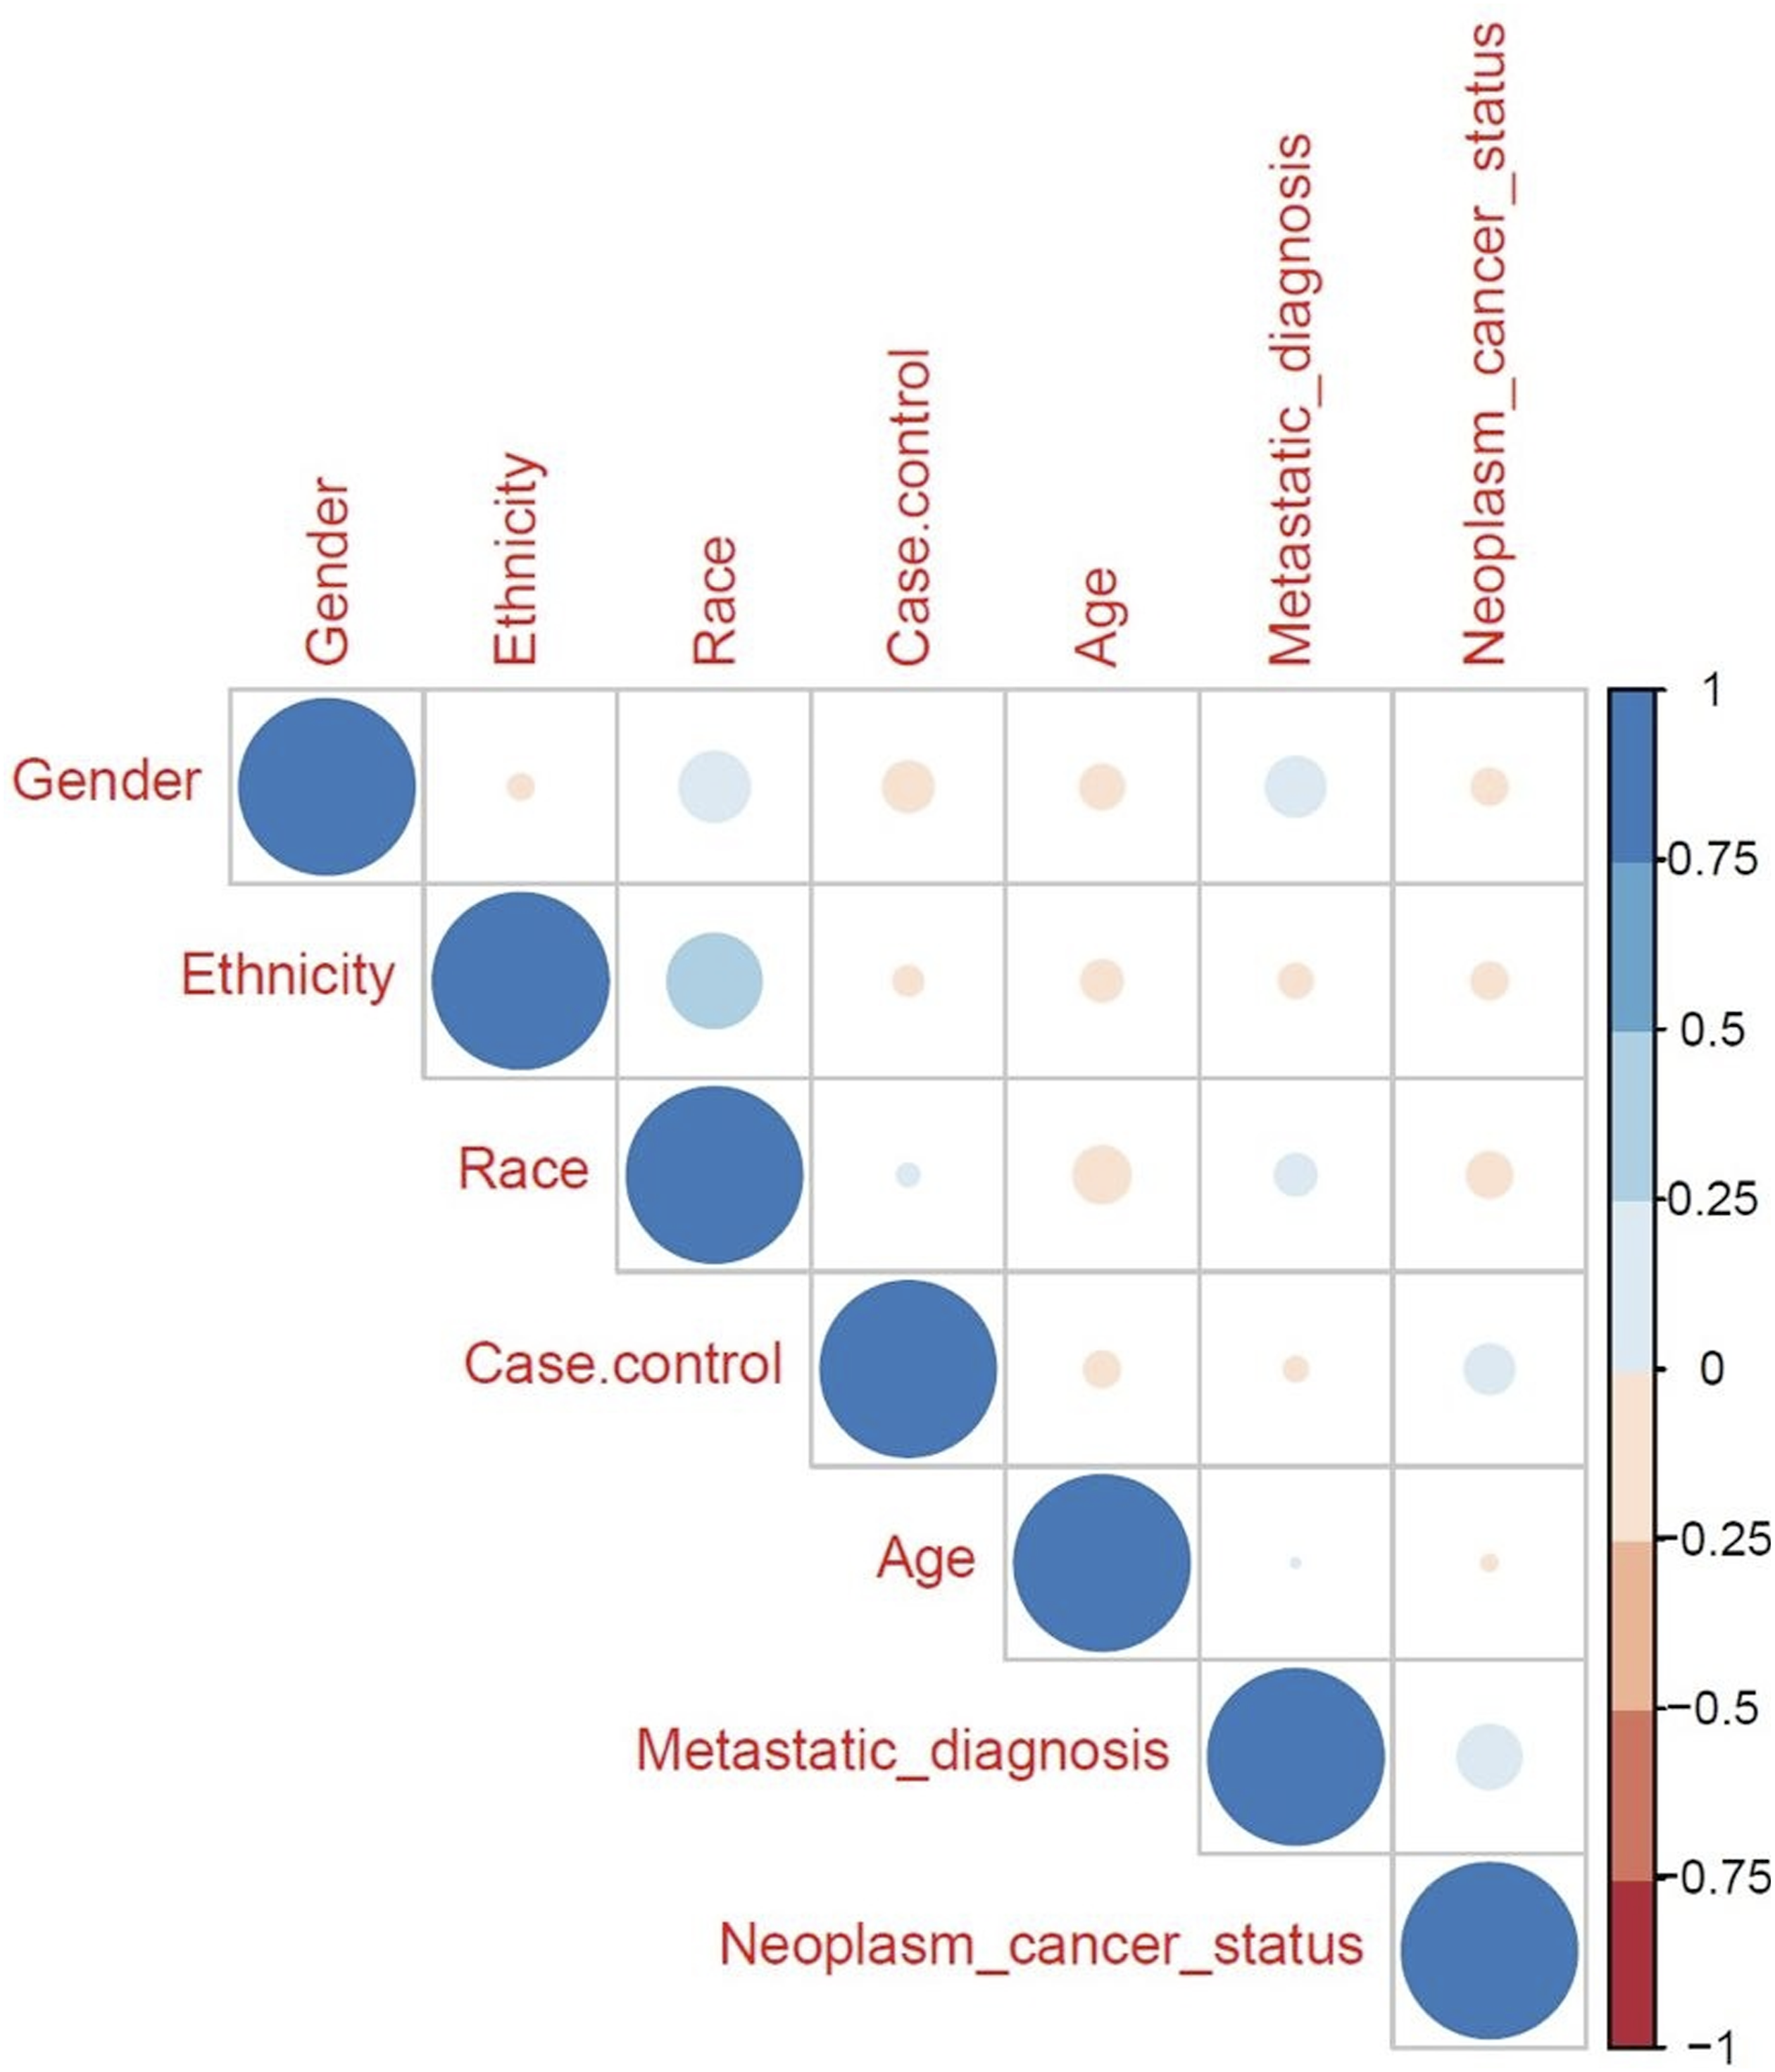
3.5. PPI Network Construction
To identify functional protein modules, a PPI network was generated by submitting the DEGs to the STRING database, applying an interaction score threshold of 0.4. Network analysis highlighted several substantial interactions, including PDZK1-SLC17A1 and H1-4-H4C6 (Figure 3A–C). These interactions were identified from the STRING-based computational PPI network; therefore, they should be interpreted as candidate functional associations rather than experimentally validated sarcoma-specific interactions. Protein–protein interaction network of candidate DEGs in soft tissue sarcoma. (A) STRING-based PPI network constructed from candidate DEGs using an interaction score threshold of 0.4. Nodes represent proteins, and edges represent predicted or known functional associations. (B) PPI network of top DEGs, highlighting key interactions including the PDZK1–SLC17A1 transporter/scaffold-related module. (C) PPI network of the 26 prognostic candidate genes, including the H1-4–H4C6 chromatin-associated interaction. These STRING-derived interactions should be interpreted as candidate functional associations requiring experimental validation. (PPI: protein–protein interaction; DEG: differentially expressed gene)
3.6. Identification of Prognostic DEGs
Kaplan–Meier survival analysis was employed to evaluate the prognostic significance of key gene signatures in STS. High expression of fifteen genes (HIST1H1E, C20orf152, CARTPT, ST7OT4, MAGEA8, HIST1H4E, RPA4, PRPS1L1, ZNF732, TAS2R10, ANGPTL3, UGT1A6, AQP2, KL, and CLCNKB) was significantly associated with reduced overall survival. Conversely, lower expression of eleven genes (ADAM21P1, C6orf163, GDF7, DSCR9, LECT2, NCRNA00169, SNORD1C, TTC9B, PBLD, APOM, and PIPOX) was correlated with a poorer prognosis and decreased survival. All analyses were performed using SPSS version 20, with a statistical significance level of p< 0.05.
3.7. ROC Curve Analysis for Diagnostic Biomarker
ROC curve analysis was performed to evaluate the diagnostic potential of individual genes and gene combinations for distinguishing STS tumor samples from reference/non-tumor samples. The diagnostic analysis was reported using a STARD-informed framework, including the diagnostic cut-off, AUC with 95% confidence interval, sensitivity with 95% confidence interval, specificity with 95% confidence interval, PPV, NPV, reference standard, and sample composition. STARD 2015 emphasizes transparent reporting of diagnostic accuracy studies because incomplete reporting can limit the assessment of bias, applicability, and clinical interpretability.
Among individual genes, A1CF showed the highest diagnostic performance, with an AUC of 0.70. In combined biomarker models, A1CF-ATP6V0D2 and A1CF-LECT2 demonstrated improved diagnostic performance, with AUC values of 0.743 and 0.796, respectively (Figure 4). These A1CF-based diagnostic models reflect tumor-associated expression differences between STS tumor samples and normal/reference samples in the analyzed datasets. At the selected diagnostic cut-off, the models achieved a sensitivity of 1.0 and a specificity of 0.5. Therefore, although these markers showed high sensitivity, their specificity was modest, indicating a substantial false-positive rate among reference/non-tumor samples. Receiver operating characteristic (ROC) curve analysis of A1CF and A1CF-based combinations as exploratory diagnostic biomarker candidates for STS. The curves represent A1CF alone and the following combinations: Combination 1, A1CF–ATP6V0D2; Combination 2, A1CF–C20orf152; Combination 3, A1CF–LECT2; Combination 4, A1CF–MAGEA8; Combination 5, A1CF–PRPS1L1; Combination 6, A1CF–ST7OT4; Combination 7, A1CF–TAS2R10
GLM Analysis for Detection of More Valuable Combination
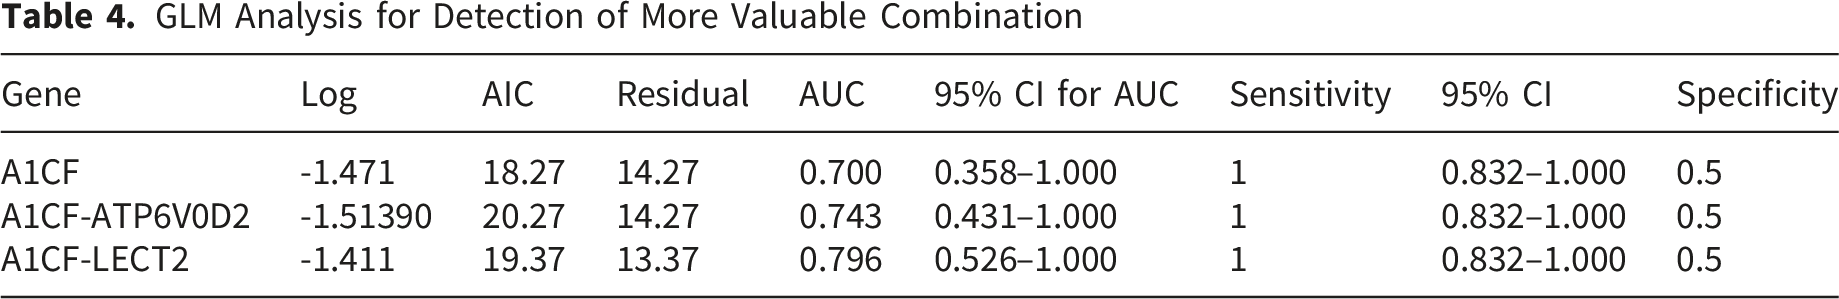
A generalized linear model was further fitted to assess the contribution of A1CF-based biomarker panels to diagnostic classification. The model coefficients for A1CF, A1CF-ATP6V0D2, and A1CF-LECT2 are presented in Table 4, supporting their contributions to the diagnostic model. However, given the modest specificity, these findings should be interpreted as preliminary and require validation in larger, independent cohorts before clinical application.
3.8. Validation
External validation was performed to assess A1CF dysregulation across independent datasets. In addition to the GDAC Firehose validation analysis, two independent external datasets were included to further evaluate the expression pattern of A1CF in STS tumor tissues compared with normal/reference controls. Detailed information regarding the validation datasets, including dataset source, sample size, sample composition, platform, and validation results, is provided in Supplementary Table 1.
To further evaluate the relationship between A1CF dysregulation and available clinicopathological variables, Spearman rank correlation analysis was performed. A1CF expression showed no statistically significant correlation with sex, age, or tumor size. Specifically, weak and non-significant correlations were observed for sex (Spearman’s ρ = 0.0789, p = 0.2596), age (Spearman’s ρ = 0.0800, p = 0.2810), and tumor size (Spearman’s ρ = −0.1100, p = 0.1270). These findings indicate that A1CF expression was not significantly associated with the evaluated clinicopathological parameters in the available cohort. These validation analyses were based on transcriptomic datasets and therefore support external expression-level validation rather than experimental biological validation.
4. Discussion
Using public transcriptomic data from the TCGA-SARC cohort, we identified a candidate gene set associated with sarcoma. Subsequent ML analysis revealed novel biomarker candidates for STS detection and prognosis. The top-performing biomarkers, A1CF and the combinatorial panels A1CF-ATP6V0D2 and A1CF-LECT2, were subsequently confirmed in an independent validation dataset from the GDAC. These results nominate exploratory molecular signatures for STS diagnosis and prognosis and provide a basis for further clinical validation. Because STS comprises multiple histological and molecular subtypes, the findings of this study should be interpreted within the context of a pan-STS analysis. The present study was designed to identify broad candidate biomarkers across the available TCGA-SARC cohort rather than to develop subtype-specific diagnostic or prognostic classifiers. Although this approach may identify biomarkers with potential relevance across STS, it may also obscure subtype-specific molecular patterns. Therefore, the identified A1CF-based diagnostic panels and prognostic gene signature should be regarded as exploratory pan-STS candidates rather than subtype-specific biomarkers. Cancer develops from dysregulated cell growth at different phases of the cell cycle. 26 Accurate and precise diagnosis is essential for ensuring the best possible treatment strategies for improving patient outcomes. Currently, diagnosis and classification approaches mostly rely on subjective assessment by physicians, which is susceptible to human error. 27 Despite advancements and new treatment strategies, metastatic sarcoma survival remains poor. This might imply that administering strong chemotherapy to all patients with metastatic sarcoma without prognosis classification is not the best strategy to enhance results. 28 STS subtypes may appear similar but vary greatly in prognosis and often lack specific treatments. Pathologists face challenges diagnosing STS due to overlapping morphologies. 17 Even with advancements in diagnostic methods, STS frequently presents with recurrences or metastasis. Its diverse histological subtypes complicate diagnosis. 29 Molecular diagnostic techniques can provide highly accurate and reliable approaches for tumor classification, thereby enabling personalized therapeutic strategies. However, they are not yet routinely used in clinical management. 27
TCGA has provided one of the most comprehensive STS sequencing studies. 17 Omics data can enhance oncogenesis understanding, improving diagnosis accuracy and targeted therapy development. 30 Some computational techniques have been developed to extract the markers from the complex multi-omics datasets, such as ML and DL algorithms. 31 The integration of ML and bioinformatics provides the potential for cancer diagnosis, subtyping, histology, therapeutic targeting, and prognosis. 32 The French Sarcoma Group used ML on a large STS cohort to validate a 67-gene set (CINSARC) for predicting metastatic prognosis. 16 In fact, ML algorithms are effective tools for understanding rare tumors. They enable deeper insight into STS biology through advanced data analysis. 17 Advances in proteomics, metabolomics, transcriptomics, and genomics now enable the realization of precision medicine. Combining ML techniques with multi-omics data aims to provide a comprehensive understanding of the underlying pathophysiology. In particular, the assessment of clinical omics datasets has facilitated the development of diagnostic and prognostic models for various disorders. Bioinformatics utilizes omics data to predict disease outcomes, thereby enhancing our capacity for early detection and personalized therapy. 33 Big data and complex algorithms are used in AI-driven medical research to increase the precision of tumor prognosis. Scientists can investigate the intrinsic regulatory mechanisms underlying carcinogenesis and disease progression more effectively due to advancements in bioinformatics. 34 The combination of bioinformatics and statistical techniques facilitates more accurate identification of potential molecular biomarkers, while also providing a cost-effective and time-efficient alternative to traditional wet-lab experimental procedures. 35
One of the most popular methods for molecular analysis of diseases is transcriptomics, through applying high-throughput techniques (RNA-seq). Transcriptomics has been utilized to identify prognostic and diagnostic biomarkers, as well to comprehend the pathophysiology of illnesses and treatment targets. 33 Bioinformatics advances allow complex exploration of gene expression, cancer prognosis, and treatment responses. 32
Gene expression signatures can serve as molecular correlates of clinical characteristics of malignancies, with DEGs. 27 Variations in gene transcript levels can affect critical processes such as invasion, metastasis, immune evasion and tumor growth, thereby contributing to disease progression and affecting host tissue integrity through indirect pathogenic mechanisms. 36 Understanding these gene expression patterns facilitates the identification of biomarkers that can serve as diagnostic and prognostic biomarkers. Functional enrichment analysis suggested that the identified DEGs are involved in extracellular matrix remodeling, collagen organization, cell–cell communication, ion-channel regulation, GPCR-mediated signaling, molecular transport, and metabolic/xenobiotic-related processes. These pathways are biologically relevant to tumor invasion, stromal remodeling, and the sarcoma microenvironment; however, they do not establish causal mechanisms or subtype specificity and require experimental validation.
The PPI network analysis highlighted PDZK1–SLC17A1 and H1-4–H4C6 as prominent computationally prioritized interactions. Because these interactions were derived from a STRING-based PPI network, they should be considered as candidate functional associations rather than validated sarcoma-specific protein–protein interactions. 25 The PDZK1–SLC17A1 interaction may reflect transporter related and scaffold related regulation. PDZK1 is a multi-PDZ-domain scaffold protein involved in organizing membrane-associated transporter complexes, while SLC17A1/NPT1 is a solute carrier transporter involved in renal phosphate and urate transport.37,38 PDZK1 has been reported to influence the processes of cancer, including proliferation, migration, invasion, apoptosis, and cell-cycle regulation, and clinical outcome in renal cell carcinoma and hepatocellular carcinoma.39,40 However, direct evidence supporting a sarcoma-specific role for the PDZK1–SLC17A1 interaction is currently limited. Therefore, this interaction should be considered a candidate transporter/scaffold-related module requiring further experimental validation.
The H1-4–H4C6 interaction likely reflects chromatin and nucleosome associated regulation. H1-4 is a linker histone, whereas H4C6 encodes a core histone H4 protein. Linker and core histones regulate chromatin organization, transcriptional control, DNA replication, DNA repair, and genome stability, all of which are frequently dysregulated in cancer.41,42 Thus, the H1-4–H4C6 interaction may suggest chromatin-level dysregulation within the STS transcriptomic profile. Nevertheless, because direct evidence of these in sarcoma is lacking, this finding should be interpreted as a chromatin-associated signal.
As diagnosis of STS is challenging, which is critical for timely initiation of appropriate treatment and can significantly influence patient outcomes and survival rates, we obtained the data of STS patients available in the TCGA database,43,44 and it enabled molecular analyses through RNA-seq and ML algorithms to study sarcoma patients. 45
Biomarkers have revolutionized cancer care, improving outcomes. They may be predictive, prognostic, or diagnostic. 29 They can reduce the impact of histological variability. 46 Determining prognosis remains a major challenge in cancer management, and accurate diagnosis is essential for selecting proper treatment strategies. 27 Prognostic biomarkers can help with risk stratification and treatment planning, indicating favorable or poor outcomes. 46 The best approach involves a combination of molecular biomarkers with conventional clinical and pathological prognostic variables. Achievement of favorable outcomes in cancer research requires the application of several methodologies and comprehensive data analysis approaches. 27 Identification of new biomarkers for early diagnosis and appropriate treatment is critically important, as early detection leads to lower mortality rates and improved prognosis. 47 Early detection biomarkers are key factors to prevent poor prognosis. 48
Several studies have examined biomarkers expressed in sarcomas that are relevant to treatment, including CD3, CD4, CD8, FOXP3, and CD20. However, most involved small samples due to the rarity of sarcomas. More research is needed, especially on specific subtypes and biomarkers. 46 Reliable molecular markers are needed to differentiate subtypes and identify new targets. 49
A1CF (Apobec-1 Complementation Factor) is an RNA-binding protein and a component of the APOBEC complex, where the C-to-U conversion happens during apolipoprotein-B (ApoB) mRNA editing. ApoB100 has multiple functions in the regulation of metabolism. A1CF increases the RNA-modifying capacity of APOBEC1. The domains of A1CF determine the protein substrate specificity by identifying an 11nt docking region on modified transcripts. 50 In this study, we investigated A1CF as an independent diagnostic factor for sarcoma patients.
The function of A1CF in sarcoma remains unclear, and no previous study has directly defined its mechanistic role in STS. However, evidence from other solid tumors suggests that A1CF may influence tumor-associated phenotypes through post-transcriptional RNA regulation. In glioma, A1CF was reported to participate in the A1CF–FAM224A–miR-590-3p–ZNF143 regulatory loop, which promoted malignant biological behaviors of glioma cells. 51 In renal cell carcinoma, A1CF facilitated cell migration by promoting nuclear translocation of SMAD3. 52 In breast cancer cells, A1CF regulated migration and apoptosis through effects on the 3′ untranslated region of DKK1, 53 while in Wilms tumor-derived cells, the A1CF–Axin2 axis influenced apoptosis and migration through the Wnt/β-catenin pathway. 54 A recent review also summarized emerging evidence linking A1CF to several malignancies, including hepatocellular carcinoma, renal cell carcinoma, breast cancer, endometrial cancer, lung cancer, and glioma. 55 Based on these findings, we hypothesize that downregulation of A1CF in STS may contribute to sarcoma pathogenesis by altering RNA-binding-dependent regulation of transcripts involved in proliferation, survival, migration, inflammatory signaling, and extracellular-matrix remodeling. Nevertheless, this interpretation remains exploratory, and functional studies in sarcoma-specific models are required to determine whether A1CF has a causal role in STS initiation, progression, or metastatic behavior.
Dysregulation of most of these prognostic biomarkers, such as GPR160, ST7, MAGEA8, HIST1H4E, TAS2R10, ANGPTL, UGT1A, and AQP2, is associated with different malignancies.56-63 RPA4, PRPS, and ZNF are involved in DNA synthesis or regulation.64-66
The implementation of medical data in ML systems has made significant advances in resolving clinical challenges such as accurate diagnosis and management of debilitating diseases, especially cancers.33,45 RNA sequence analysis is accepted as a standard method for transcriptomic studies. 33 Our data suggest the exploratory diagnostic relevance of the A1CF and A1CF-ATP6V0D2 and A1CF-LECT2 combinations in STS. In addition, the results of survival analysis showed that overexpression of 15 genes and lower expression of 11 genes were associated with poorer survival outcomes in STS. These genes may have potential relevance for future biomarker development in STS diagnosis and prognosis, but their clinical utility requires validation in larger independent and prospective cohorts. Our findings are consistent with prior research in the field of malignancies. However, validating the clinical usage of these genes in diagnosis, prognosis, and personalized treatment necessitates further clinical investigations involving larger patient cohorts. Personalized management and patient education are interdependent components of modern, high-quality cancer care. 67 These candidate biomarkers may provide crucial insights into STS diagnosis and prognosis, particularly when evaluated in combination; however, their clinical and therapeutic relevance remains to be established.
5. Limitations and Future Directions
While big data analytics present considerable benefits for enhancing healthcare quality and operational efficiency, their implementation is accompanied by notable limitations. A primary impediment lies in the decentralized and often heterogeneous architecture of clinical data repositories, which complicates comprehensive integration. Furthermore, the absence of prospective clinical validation underscores a broader translational gap inherent in purely computational investigations. Methodological inconsistencies, particularly in extraction protocols, sample acquisition, and the use of reference controls further undermine cross-study comparability. This underscores the necessity for standardized workflows to ensure reproducible quantification of these biomarkers. A further limitation is the modest specificity of the A1CF-based diagnostic panels. Although high sensitivity may be useful in an exploratory screening or triage setting, the specificity of 0.5 limits their clinical utility as standalone diagnostic tests. Larger independent studies with appropriate reference controls and subtype-level annotation are required to determine whether specificity can be improved and whether these markers have reproducible clinical value.
As a follow-up translational step, we plan to validate A1CF and selected genes from the prognostic signature in an independent cohort of patients with soft tissue sarcoma from our referral center. Transcript-level validation may be performed using quantitative real-time PCR, and protein-level validation may be assessed by immunohistochemistry when suitable tissue specimens and validated antibodies are available. These analyses will also aim to evaluate associations between biomarker expression and clinicopathological features, including histological subtype, tumor grade, metastatic status, recurrence, treatment response, and survival outcomes. Furthermore, given the marked histological and molecular heterogeneity of STS, this pan-STS approach may obscure subtype-specific transcriptomic patterns. Because several TCGA-SARC subtypes have limited sample sizes, subtype-stratified machine-learning, diagnostic, and survival analyses were not performed. Therefore, the identified biomarkers should be interpreted as exploratory pan-STS candidates, and future studies should validate them in larger subtype-annotated cohorts.
6. Conclusion
In conclusion, our analysis identified that dysregulation of 26 genes, as well as A1CF and its combinations (A1CF-ATP6V0D2 and A1CF-LECT2) might be novel prognostic and diagnostic biomarkers for STS, through bioinformatics and ML frameworks applied to TCGA-SARC data. This research supports the application of bioinformatics and ML as discovery tools for generating testable biomarker hypotheses in rare cancers using public datasets. The discovery of these biomarkers provides exploratory evidence for potential diagnostic and prognostic relevance in STS, but their clinical utility remains to be established through experimental validation and prospective evaluation in independent patient cohorts. Subsequent clinical validation will be crucial to translating these findings into improved patient care.
Supplemental Material
Supplemental Material - Translating Data Into Clinical Tools: An Integrative Strategy for Precision Biomarker Identification in Soft Tissue Sarcoma Diagnosis and Prognosis
Supplemental Material for Translating Data Into Clinical Tools: An Integrative Strategy for Precision Biomarker Identification in Soft Tissue Sarcoma Diagnosis and Prognosis by Masoume Avateffazeli, Rahem Rahmati, Abdolreza Mohammadnia, Maryam Hajimoradi, Elham Nazari, Shadi Shafaghi in Cancer Informatics
Footnotes
Acknowledgements
In the composition of this work, artificial intelligence was utilized as an editorial tool to critique prose, suggest structural improvements, and ensure formal academic style, while all original research, analysis, and intellectual contributions remain our own.
Ethical Considerations
The data analyzed in this study were obtained from publicly available, de-identified transcriptomic and clinical datasets, including The Cancer Genome Atlas Sarcoma cohort (TCGA-SARC) and Gene Expression Omnibus (GEO) datasets. All patient-related ethical approvals and consent procedures for data collection and public data sharing were managed by the original data-generating institutions and repositories in accordance with their respective ethical guidelines.
This study was approved by the Ethics Committee of Masih Daneshvari Hospital, Shahid Beheshti University of Medical Sciences, Tehran, Iran. The ethical approval number is IR.SBMU.NRITLD.REC.1403.050.
Consent to Participate
No new human participants were recruited, and no identifiable patient, guardian, or participant information was accessed in this study. Therefore, additional patient/guardian/participant informed consent was not required for the present secondary analysis of publicly available de-identified data.
Author Contributions
Funding
The authors received no financial support for the research, authorship, and/or publication of this article.
Declaration of Conflicting Interests
The authors declared no potential conflicts of interest with respect to the research, authorship, and/or publication of this article.
Data Availability Statement
Supplemental Material
Supplemental material for this article is available online.
Appendix
References
Supplementary Material
Please find the following supplemental material available below.
For Open Access articles published under a Creative Commons License, all supplemental material carries the same license as the article it is associated with.
For non-Open Access articles published, all supplemental material carries a non-exclusive license, and permission requests for re-use of supplemental material or any part of supplemental material shall be sent directly to the copyright owner as specified in the copyright notice associated with the article.