
Abstract
Background
Head and neck squamous cell carcinoma (HNSCC) has a poor prognosis, and the extracellular matrix (ECM) plays a key role in tumor progression, emerging as a potential biomarker for prognosis and therapy.
Objectives
To develop and validate an ECM-related prognostic signature (ECMS) and assess its association with immune features and therapeutic response in HNSCC.
Design
Retrospective, multi-cohort bioinformatics and experimental study integrating transcriptomic analysis, machine learning, and molecular biology validation.
Methods
ECM-related genes were identified from transcriptome data. An ECMS was constructed using 10 machine learning algorithms with 101 algorithm combinations and evaluated across training, internal, and external validation cohorts. An integrated nomogram combining ECMS with clinical variables was developed for prognosis prediction. Immune infiltration and treatment responses were analyzed. qRT-PCR validated gene expression in 15 paired HNSCC and adjacent normal tissues, and molecular experiments confirmed key gene functions.
Results
Twenty-three ECM genes were significantly associated with prognosis. The ECMS demonstrated moderate and consistent predictive performance across datasets. The nomogram provided a potential tool for clinical outcome prediction. Significant differences in immune cell infiltration and immune checkpoint gene expression were observed between high- and low-risk groups. qRT-PCR confirmed elevated expression of key ECM genes, including WNT7A, in tumor tissues, and functional assays showed that WNT7A promotes HNSCC cell proliferation, migration, and invasion.
Conclusion
This study developed an ECMS with potential prognostic value, which may complement existing clinical variables for outcome prediction in HNSCC.
Keywords
Introduction
Head and neck squamous cell carcinoma (HNSCC), emerging from the mucosal epithelium in the oral cavity, pharynx, and larynx, is a diverse malignant cancer pathology and is one of the principal factors contributing to global morbidity and mortality. 1 Approximately 900,000 new cases were reported in 2020. 2 Surgical excision, radiotherapy, chemotherapy, or combination therapies are commonly employed for HNSCC treatment.3,4 While approximately 30% to 40% of early-diagnosed HNSCC patients reach a 5-year survival rate ranging from 70% to 90% following treatment, many HNSCC patients are diagnosed at later stages. Given the unique location of head and neck tumors, adjacent to critical structures such as the brain, facial aesthetics and functional organs, chewing and the digestive tract, extensive resection significantly impacts patients’ quality of life and survival rates. Targeted therapy is an emerging non-invasive treatment approach; however, due to the lack of effective targets and drugs, it has yet to be widely adopted in clinical practice. To optimize treatment strategies and achieve the goal of precision medicine, discovering new therapeutic targets through database retrieval and biomarker screening is essential.
The extracellular matrix (ECM) is characterized as the non-cellular constituent of tissues, offering the biochemical and biophysical foundation for cellular activities. 5 Besides supporting and connecting functions, the ECM also governs numerous critical cellular behaviors, encompassing proliferation, migration, differentiation, and apoptosis. 6 The primary constituents of the ECM comprise collagens, glycoproteins, proteoglycans, and other molecules, such as hyaluronan and galectin. The ECM also serves as a vital component of solid tumors, undergoing alterations over time and space to establish a microenvironment conducive to tumorigenesis and development.7-9 An increasing body of evidence indicates the involvement of the ECM in the malignant development of multiple cancers, such as breast carcinoma, 10 urothelial bladder cancer, 11 and liver cancer. 12
While the ECM plays a significant role in oncogenesis and may serve as an effective marker of survival, there have been no comprehensive efforts to investigate the prognostic function of ECM-related genes (ECMRGs) in HNSCC. Hence, the study intended to investigate the prognostic significance of ECMRGs in HNSCC and to devise a categorization system utilizing the expression levels of ECMRGs to prognosticate the outcome of the individuals with HNSCC.
Methods
Data Collection
Transcriptomic data and clinical information for HNSCC were downloaded from The Cancer Genome Atlas (TCGA). Additionally, gene expression profiles from dataset GSE41613 available in the Gene Expression Omnibus (GEO) database and the ORCA-IN cohort from International Cancer Genome Consortium (ICGC) dataset were also obtained. ECMRGs were identified through a comprehensive literature review. 13
Differential Analysis and Identification of Tumor-Associated ECM Genes
The differential analysis was conducted to identify genes associated with the ECM that are implicated in tumorigenesis. Using the R package ‘DESeq2′ to analyze TCGA-HNSC count data, obtain differentially expressed genes (DEGs) among tumor and adjacent non-tumor tissues. The threshold is fixed at |log2FC| > 1.5 with an adjusted P-value< 0.05. Subsequently, intersect the DEGs with genes related to the ECM, the resulting genes are considered to be closely associated with tumorigenesis.
Construct a Prognostic Signature Using Machine Learning Methods
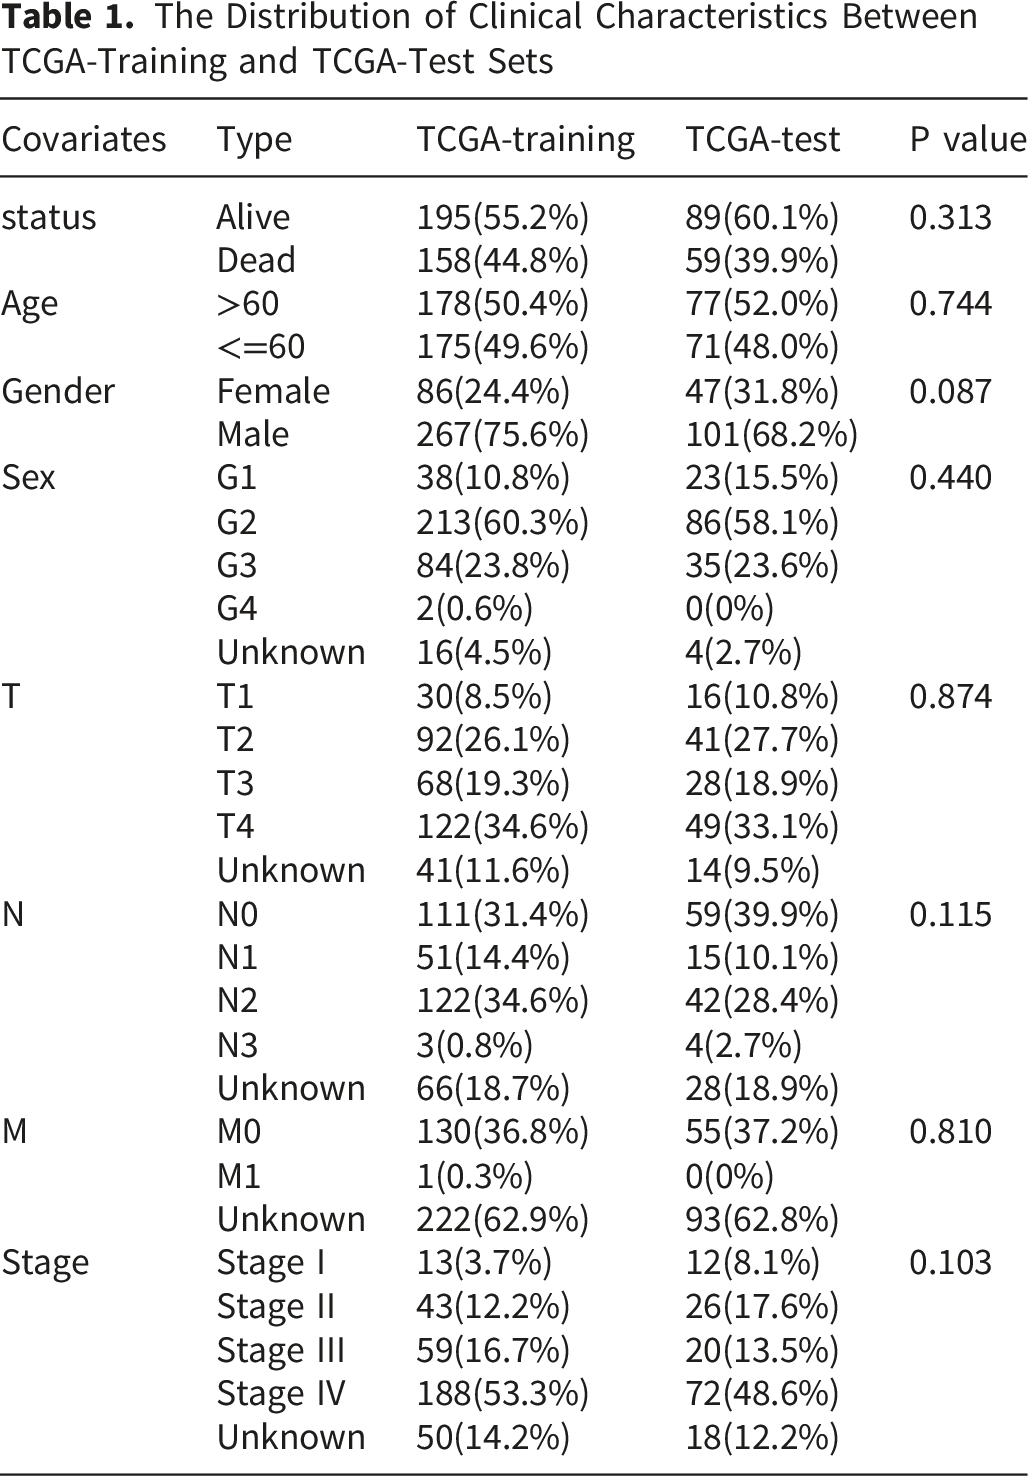
The Distribution of Clinical Characteristics Between TCGA-Training and TCGA-Test Sets
Furthermore, to address the challenge of black-box predictions in machine learning models, we employed the SHapley Additive exPlanations (SHAP) interpretability framework to analyze outputs from our ensemble model. This approach provided valuable insights into the algorithm’s decision-making process by quantifying feature contributions.
Construction and Validation of a Prognostic Nomogram
Univariate and multivariate analyses were employed to investigate the impact of Age, Sex, Grade, Stage, and ECMS on prognosis. Subsequently, ECMS and relevant clinical-pathological variables were integrated to establish a nomogram, improving the prognosis prediction for HNSCC patients. Calibration curve was plotted, and the AUC value and C-index were computed to assess the precision of the nomogram. Decision curve was utilized for further assessing the clinical benefit of the nomogram.
Single-Cell RNA-Seq Analysis
To characterize the cellular composition of the HNSCC tumor microenvironment, we retrieved three publicly available single-cell RNA sequencing datasets from the Sparkle website (https://grswsci.top/): GSE103322, GSE150321, and GSE172577. All datasets were uniformly preprocessed, including quality control, normalization, principal component analysis (PCA), UMAP dimensionality reduction, and cell-type annotation based on canonical lineage markers. For each dataset, UMAP embeddings were generated to visualize the spatial distribution of annotated cell types. Additionally, feature plots were generated for target genes, overlaying gene expression on the UMAP, with color intensity representing relative expression in individual cells.
Tumor Immune Infiltration Analysis
To further explore the relationship between the tumor immune environment and ECMS, we employed seven algorithms (XCELL, TIMER, QUANTISEQ, MCP-Counter, EPIC, CIBERSORT-ABS, and CIBERSORT) known for their efficacy in analyzing immune cell infiltration patterns. Consensus estimates for each immune cell type were calculated by averaging the predicted abundances across all seven algorithms to improve stability and reduce method-specific bias. Spearman correlation analysis was then performed between each sample’s ECMS score and the estimated abundance of each immune cell type to assess their associations. Additionally, the Wilcoxon rank-sum test was utilized to compare differences in immune cell content between distinct groups. P values were adjusted using the Benjamini-Hochberg method to control the false discovery rate (FDR), and an adjusted P value (FDR) < 0.05 was considered statistically significant.
Therapy Sensitivity Analysis
To assess drug treatment responses among patients in different risk groups, we utilized the R package “pRRophetic” to evaluate the maximum half-inhibitory concentration (IC50) of common chemotherapy drugs for each patient with HNSCC. The Tumor Immune Dysfunction and Exclusion (TIDE) score was widely employed to predict clinical responses to immune checkpoint inhibitors. 15 The TIDE scores for HNSCC patients were computed using the TIDE algorithm. Furthermore, to investigate the association between immune checkpoint genes expression levels and ECMS, we performed comparative analysis of immune checkpoint gene expression between the two groups using the Wilcoxon rank-sum test. These findings can provide more effective guidance for physicians when selecting various drug treatments for patients.
KEGG and GO Enrichment Analysis
Differentially expressed genes (DEGs) between the low- and high-risk groups were identified using the DESeq2 package based on predefined thresholds. Gene Ontology (GO) and Kyoto Encyclopedia of Genes and Genomes (KEGG) pathway enrichment analyses were conducted using the clusterProfiler R package. To account for multiple comparisons, P values were adjusted using the Benjamini–Hochberg method, and the false discovery rate (FDR) was controlled. Pathways with an adjusted P value (FDR) < 0.05 were considered significantly enriched. Visualization was performed using the ggplot2 package.
Clinical Tissue Collection and qRT-PCR
Primer Sequences of the qRT-PCR
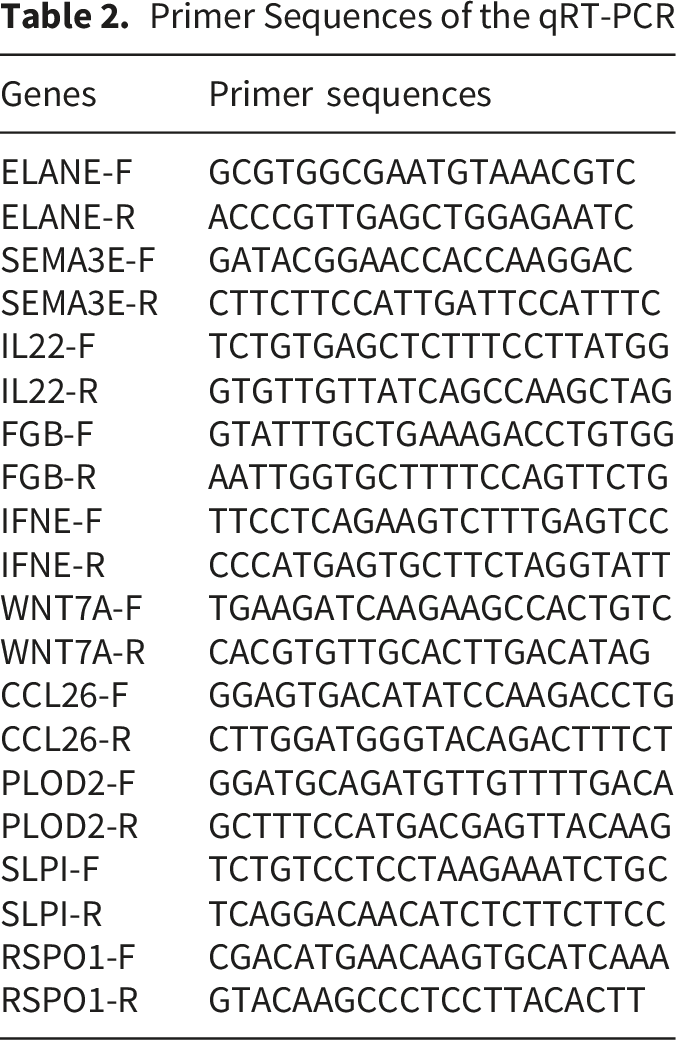
Cell Culture and Transfection
The human HNSCC FaDu cell line was obtained from ATCC, cultured according to their guidelines. The short hairpin RNAs (shRNA) targeting WNT7A were constructed and synthesized by GenePharma using the lentivirus vector LV2N (U6/Puro) with the following sequences: shSC, 5′-TTCTCCGAACGTGTCACGT-3′;shWNT7A-1, 5′-CCTGGACGAGTGTCAGTTT-3′;shWNT7A-2, 5′-GGAGAACATGAAGCTGGAA-3′. Lentivirus infection efficiency was confirmed by Western blot and qRT-PCR.
Isolation of Fibroblasts
Cancer-associated fibroblasts (CAFs) were obtained from HNSCC patients undergoing surgical resection. The detailed procedure was as follows: Tissue specimens were minced into small fragments and incubated in DMEM medium without FBS, containing type I collagenase (Sigma) and hyaluronidase (Sigma), at 37°C for enzymatic digestion. Undigested tissue was removed by filtration, and the stromal cell fraction was collected by centrifugation at 1000 rpm for 5 minutes.
Western Blot Analysis
Total protein was extracted using RIPA lysate (Beyotime). Proteins were separated by NuPAGE 4-12% Bis-Tris gel and transferred to a PVDF membrane (Millipore). The membrane was blocked with 5% nonfat milk for 1 hour, incubated with primary antibodies (1:1000 dilution) at 4°C overnight, and detected using chemiluminescence after secondary antibody incubation.
In Vitro Functional Assays
The in vitro roles of WNT7A were evaluated using CCK-8, colony formation, wound healing, and transwell assays. For CCK-8, 1,000 cells per well were plated in 96-well plates, treated as indicated, and after adding 10 μL of CCK-8 reagent and 2-hour incubation, absorbance at 450 nm was measured. In colony formation assays, 1,500 treated cells were plated in 60 mm dishes, fixed with 4% paraformaldehyde, stained with crystal violet, and colonies with over 50 cells were counted after 10 days. For wound healing, a 200-μL pipette tip created a gap in the cell monolayer, with migration assessed at 18 and 24 hours. In transwell assays, 2 × 10⁴ cells in 1% FBS medium were placed in the upper chamber, and the lower chamber contained 10% FBS medium. After 24 hours of incubation at 37°C with 5% CO2, cells on the upper filter surface were removed, and those on the lower surface were fixed, stained with crystal violet, and counted in 10 random fields (200×).
Statistical Analysis
All statistical analyses were performed applying R version 4.3.1 and Graphpad Prism 9.0.0. The correlation was determined using the Spearman analysis. The comparison of clinical information was carried out using the Wilcoxon test and t-test. Cox regression analysis was employed to assess survival status. The proportional hazards assumption for all Cox regression analyses was assessed using Schoenfeld residuals implemented in the survival R package. OS was generated using the KM method. P-value< 0.05 was considered statistically significant.
Results
Prognostic ECMRGs in HNSCC
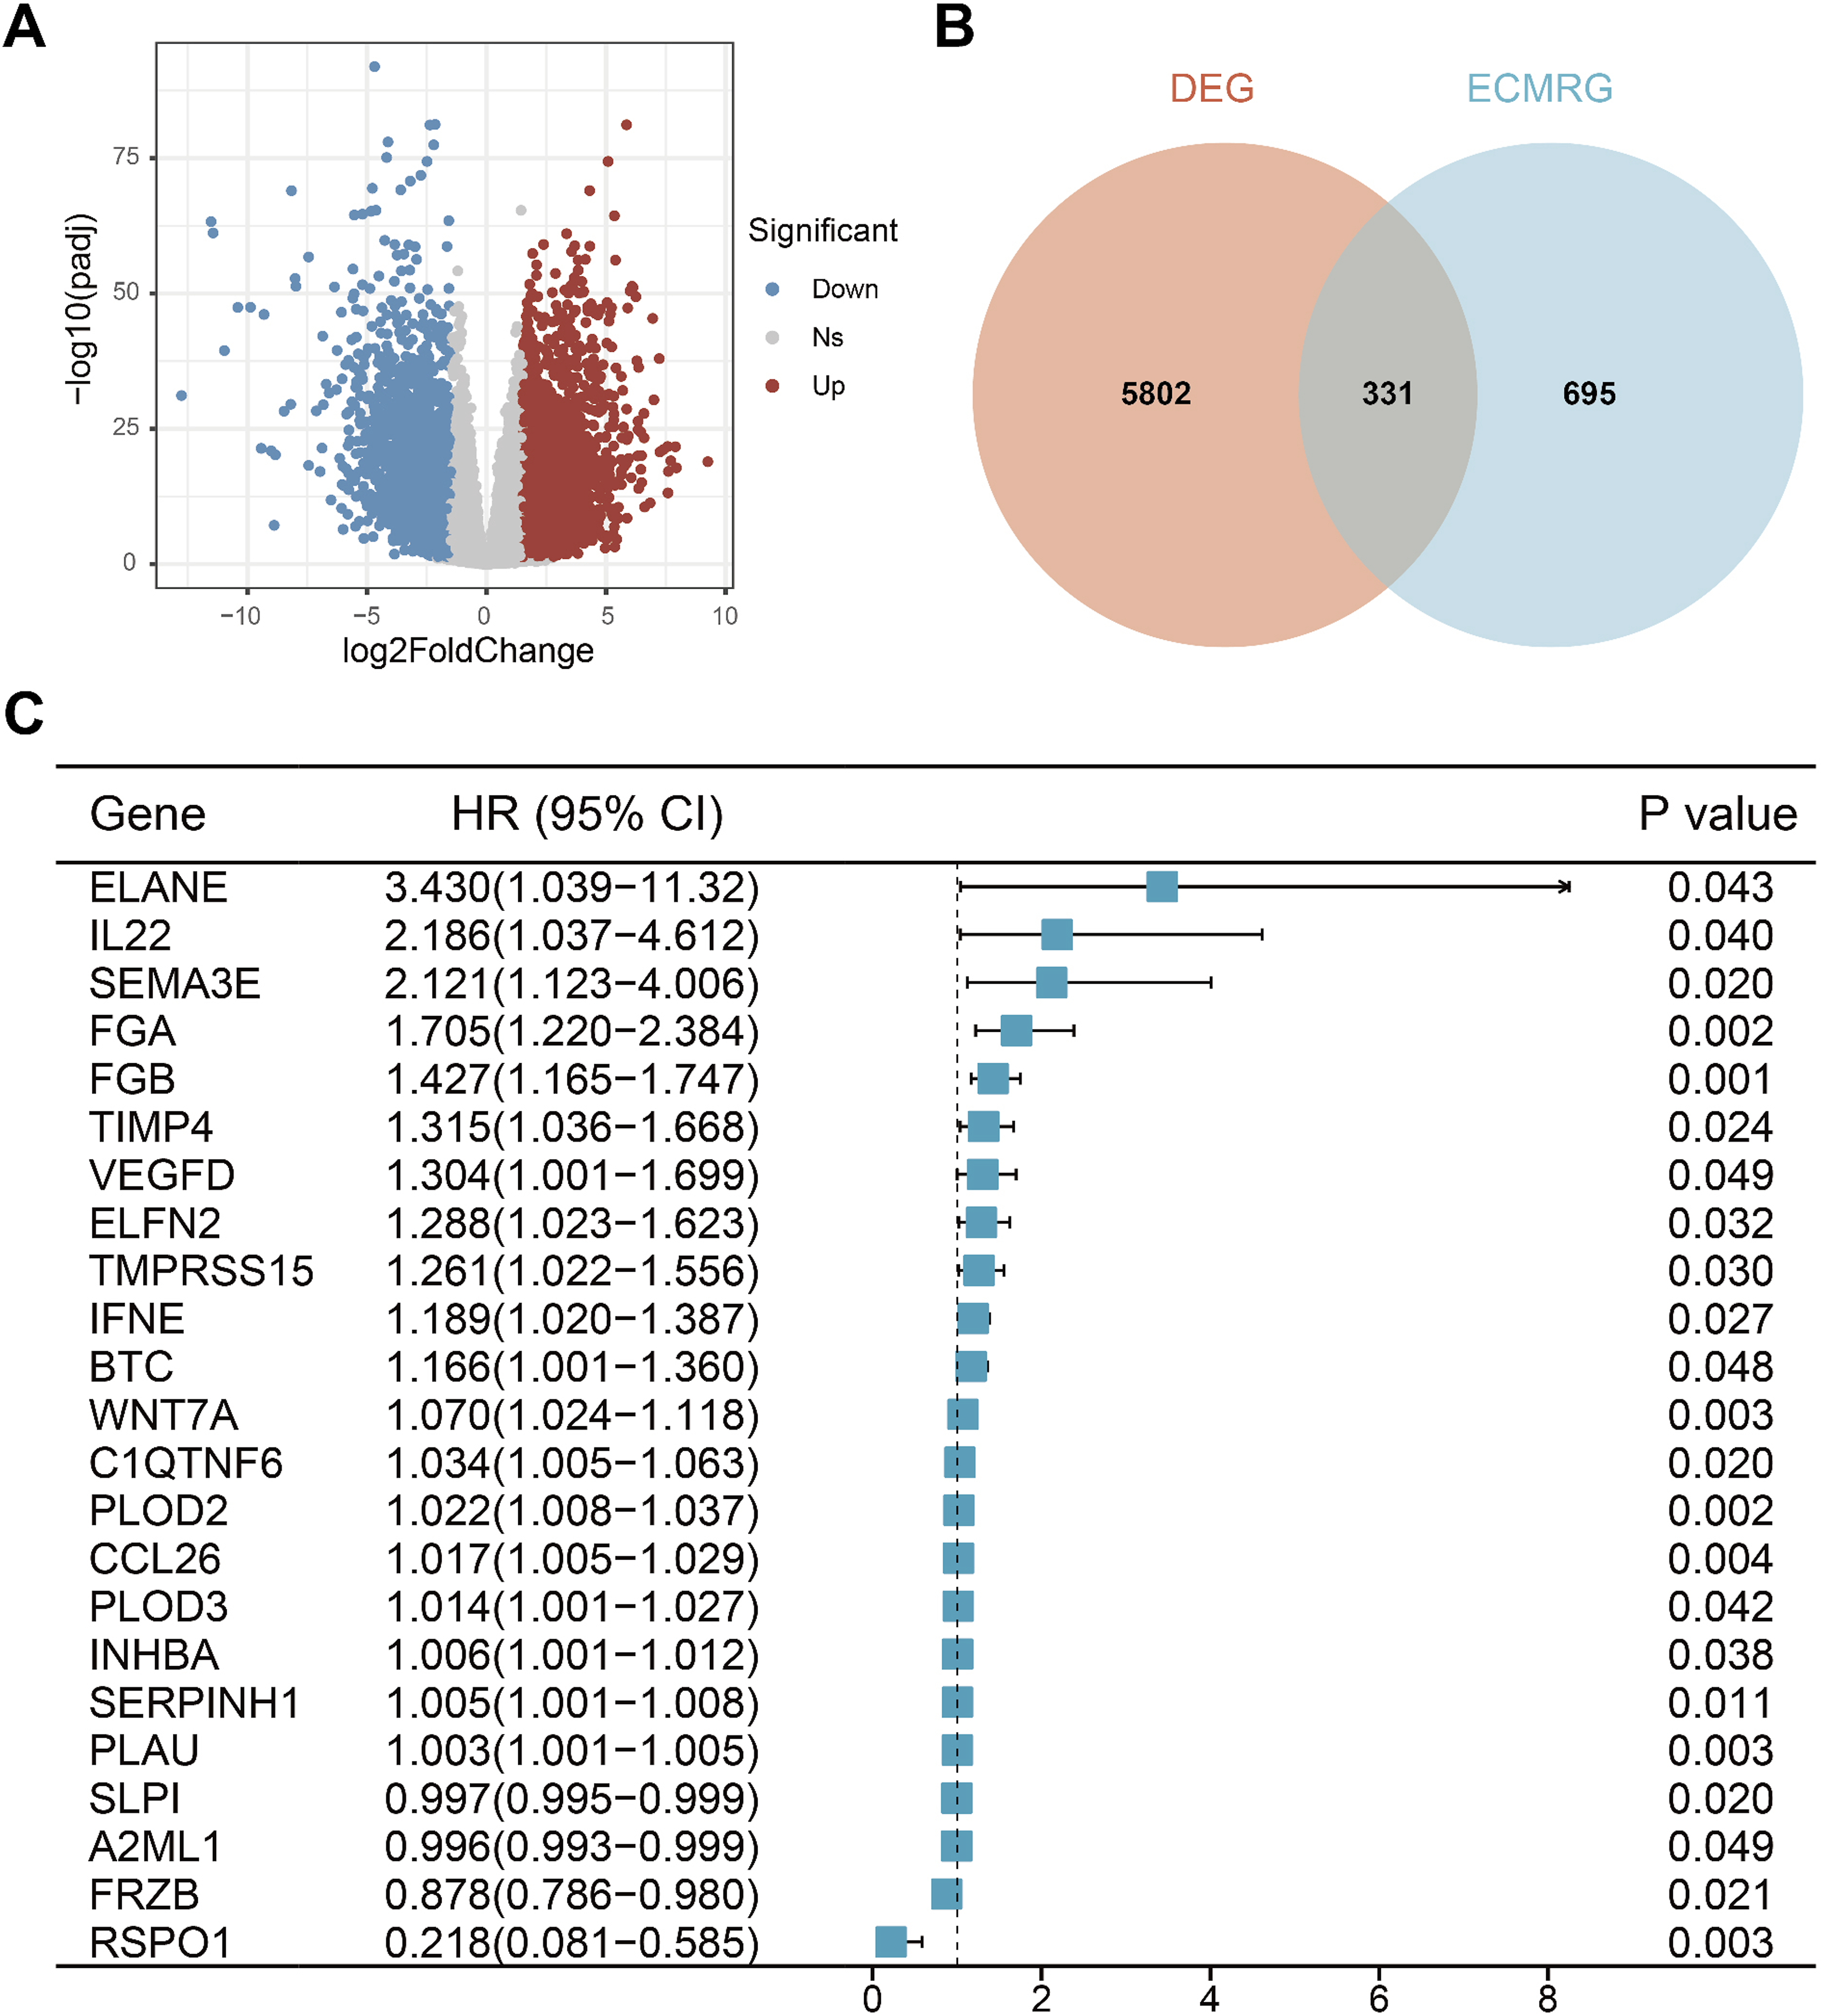
Figure 1 illustrates the overall study workflow. Analyzing TCGA-HNSC transcriptome data, including 502 tumor tissues and 44 normal tissue, the results revealed 3,649 upregulated genes and 2,484 downregulated genes in tumor tissues (Figure 2A). After intersecting with ECMRGs, 331 differential genes were obtained (Figure 2B). Subsequent univariate Cox analysis results indicated that 23 genes exhibit potential prognostic significance in HNSCC patients (Figure 2C). Flowchart of this study Identifcation of prognostic extracellular matrix-related genes. (A) Volcano map of differential genes, the red nodes represent upregulated genes while the blue nodes represent downregulated genes. (B) Venn plot showing the intersecting genes between DEGs in RNA-seq and ECMRGs. (C) Results of univariate Cox regression analysis of ECMRGs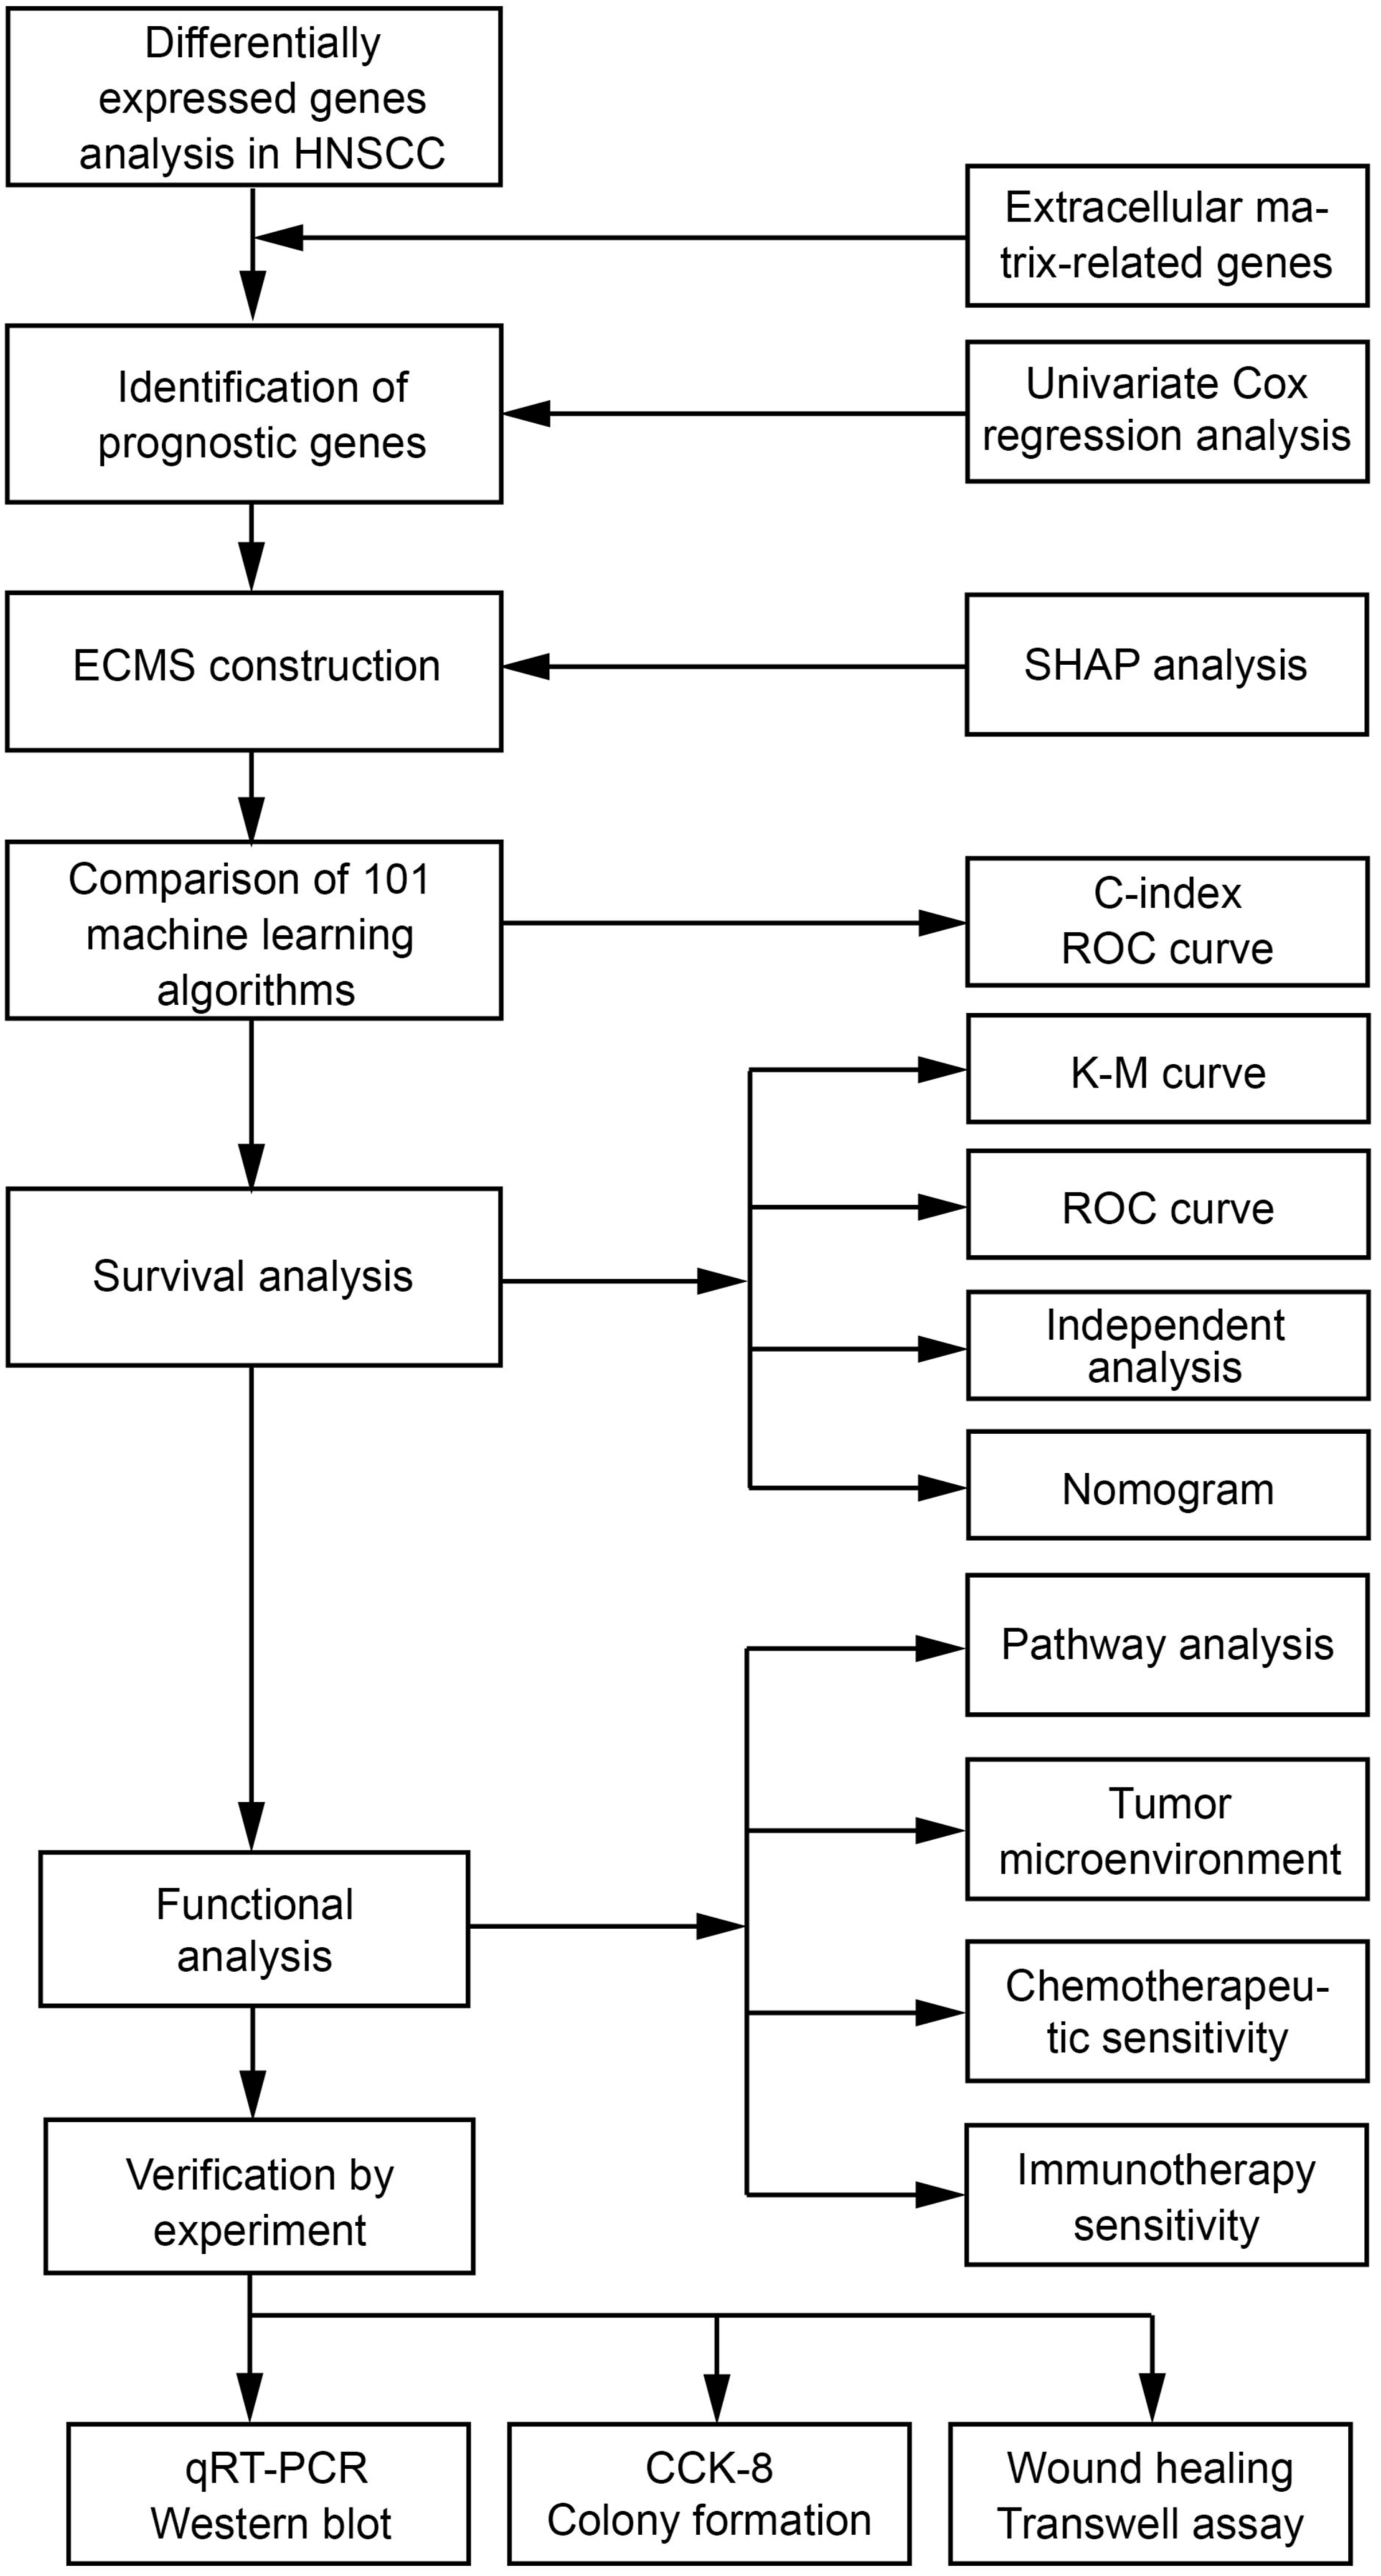
Construction of Prognostic Signature Based on Machine Learning
Based on the expression profiles of the 23 genes, we employed machine learning algorithms to fit a total of 101 predictive models and calculated the C-index for all training and validation sets. The results shown in Figure 3A, the StepCox [both] + Lasso models exhibit the best predictive performance. Using stepwise Cox proportional hazards regression analysis (both), 10 genes were identified (Figure 3B). Then, we investigated the expression patterns of 10 genes in different cell types in HNSCC tissues at the single-cell transcriptome level (Figure S1). The results showed that these genes were predominantly expressed in non-malignant stromal and immune cells, which directly links the ECM signature to cellular composition of the tumor immune microenvironment and supports our subsequent immune infiltration analyses. A ECMS was developed via the machine learning-based integrative program. (A) A total of 101 kinds of prediction models via a 10-fold cross-validation framework and further calculated the C index of each model across all validation datasets. (B) 10 genes obtained in stepwise Cox regression. (C) Coefficient profiles of the 10 genes via Lasso regression analysis. (D) Tuning parameter (λ) selection cross. Validation error curve, the optimal log λ value is the left dotted line in the plot. (E) The coefficient values of 10 genes. (F) Beeswarm summary plot of feature importance from SHAP analysis. (G)The force plots show how the model arrived at its decision. The plot reveals the identification of a “low-risk” case that was correctly predicted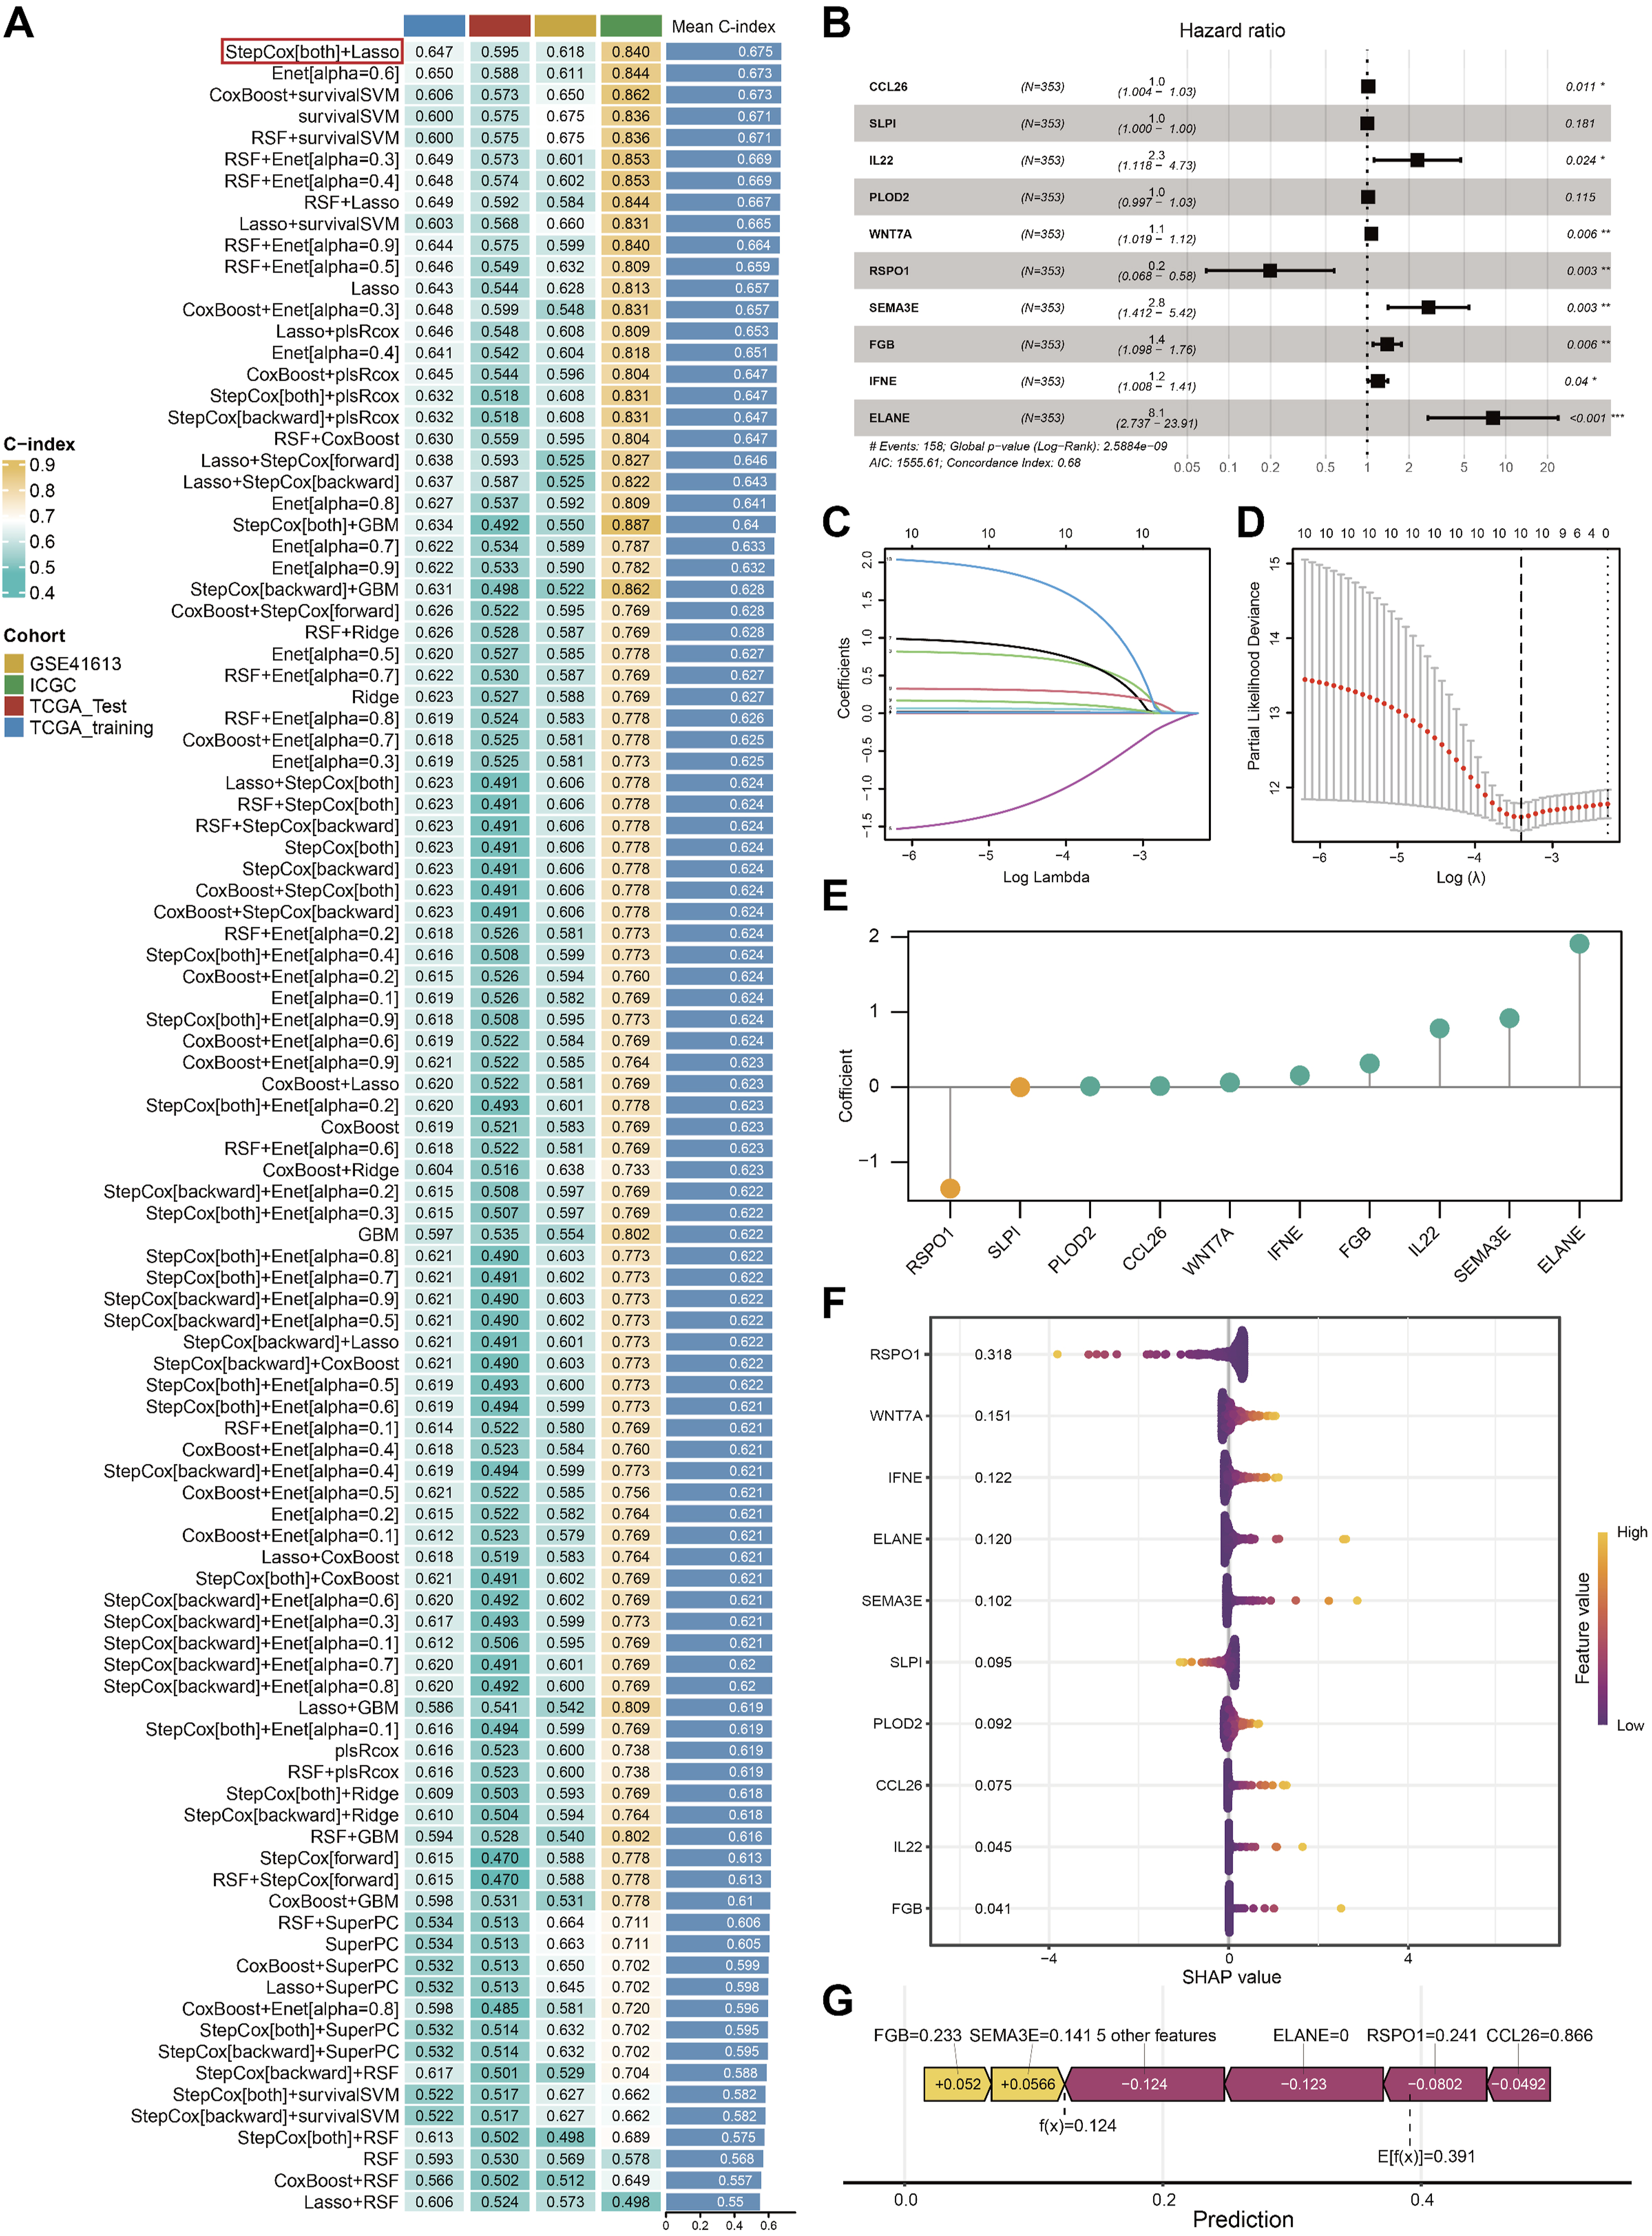
Subsequently, the optimal λ value for LASSO analysis was determined through 10-fold cross-validation (Figure 3C and D), and the coefficients for each gene were calculated (Figure 3E). Risk scores for all patients were computed in accordance with gene mRNA levels and the corresponding LASSO coefficients, and two ECMS subgroups were identified. Then, we performed SHAP analysis to evaluate the relative importance and contribution of model genes. The genes were ranked in descending order of their SHAP value, revealing RSPO1 as the most influential predictive gene (Figure 3F). We subsequently generated SHAP force plots to visualize the risk stratification process. As demonstrated in Figure 3G, the SHAP interpretation for a representative HNSCC patient showed: a baseline mean prediction score of 0.391 and an individualized calculated score of 0.124, resulting in classification into the low-risk group.
Following risk stratification, we conducted comparative survival analysis between the two patient groups. The results demonstrated that in the TCGA-Training, TCGA-Test, GSE41613, and ICGC sets, patients in the high-risk group displayed significantly poorer OS (P < 0.05, Figure 4A–D). Kaplan-Meier curves of OS according to the ECMS in the TCGA-Training(A), TCGA-Test(B), GSE41613(C), and ICGC cohorts(D)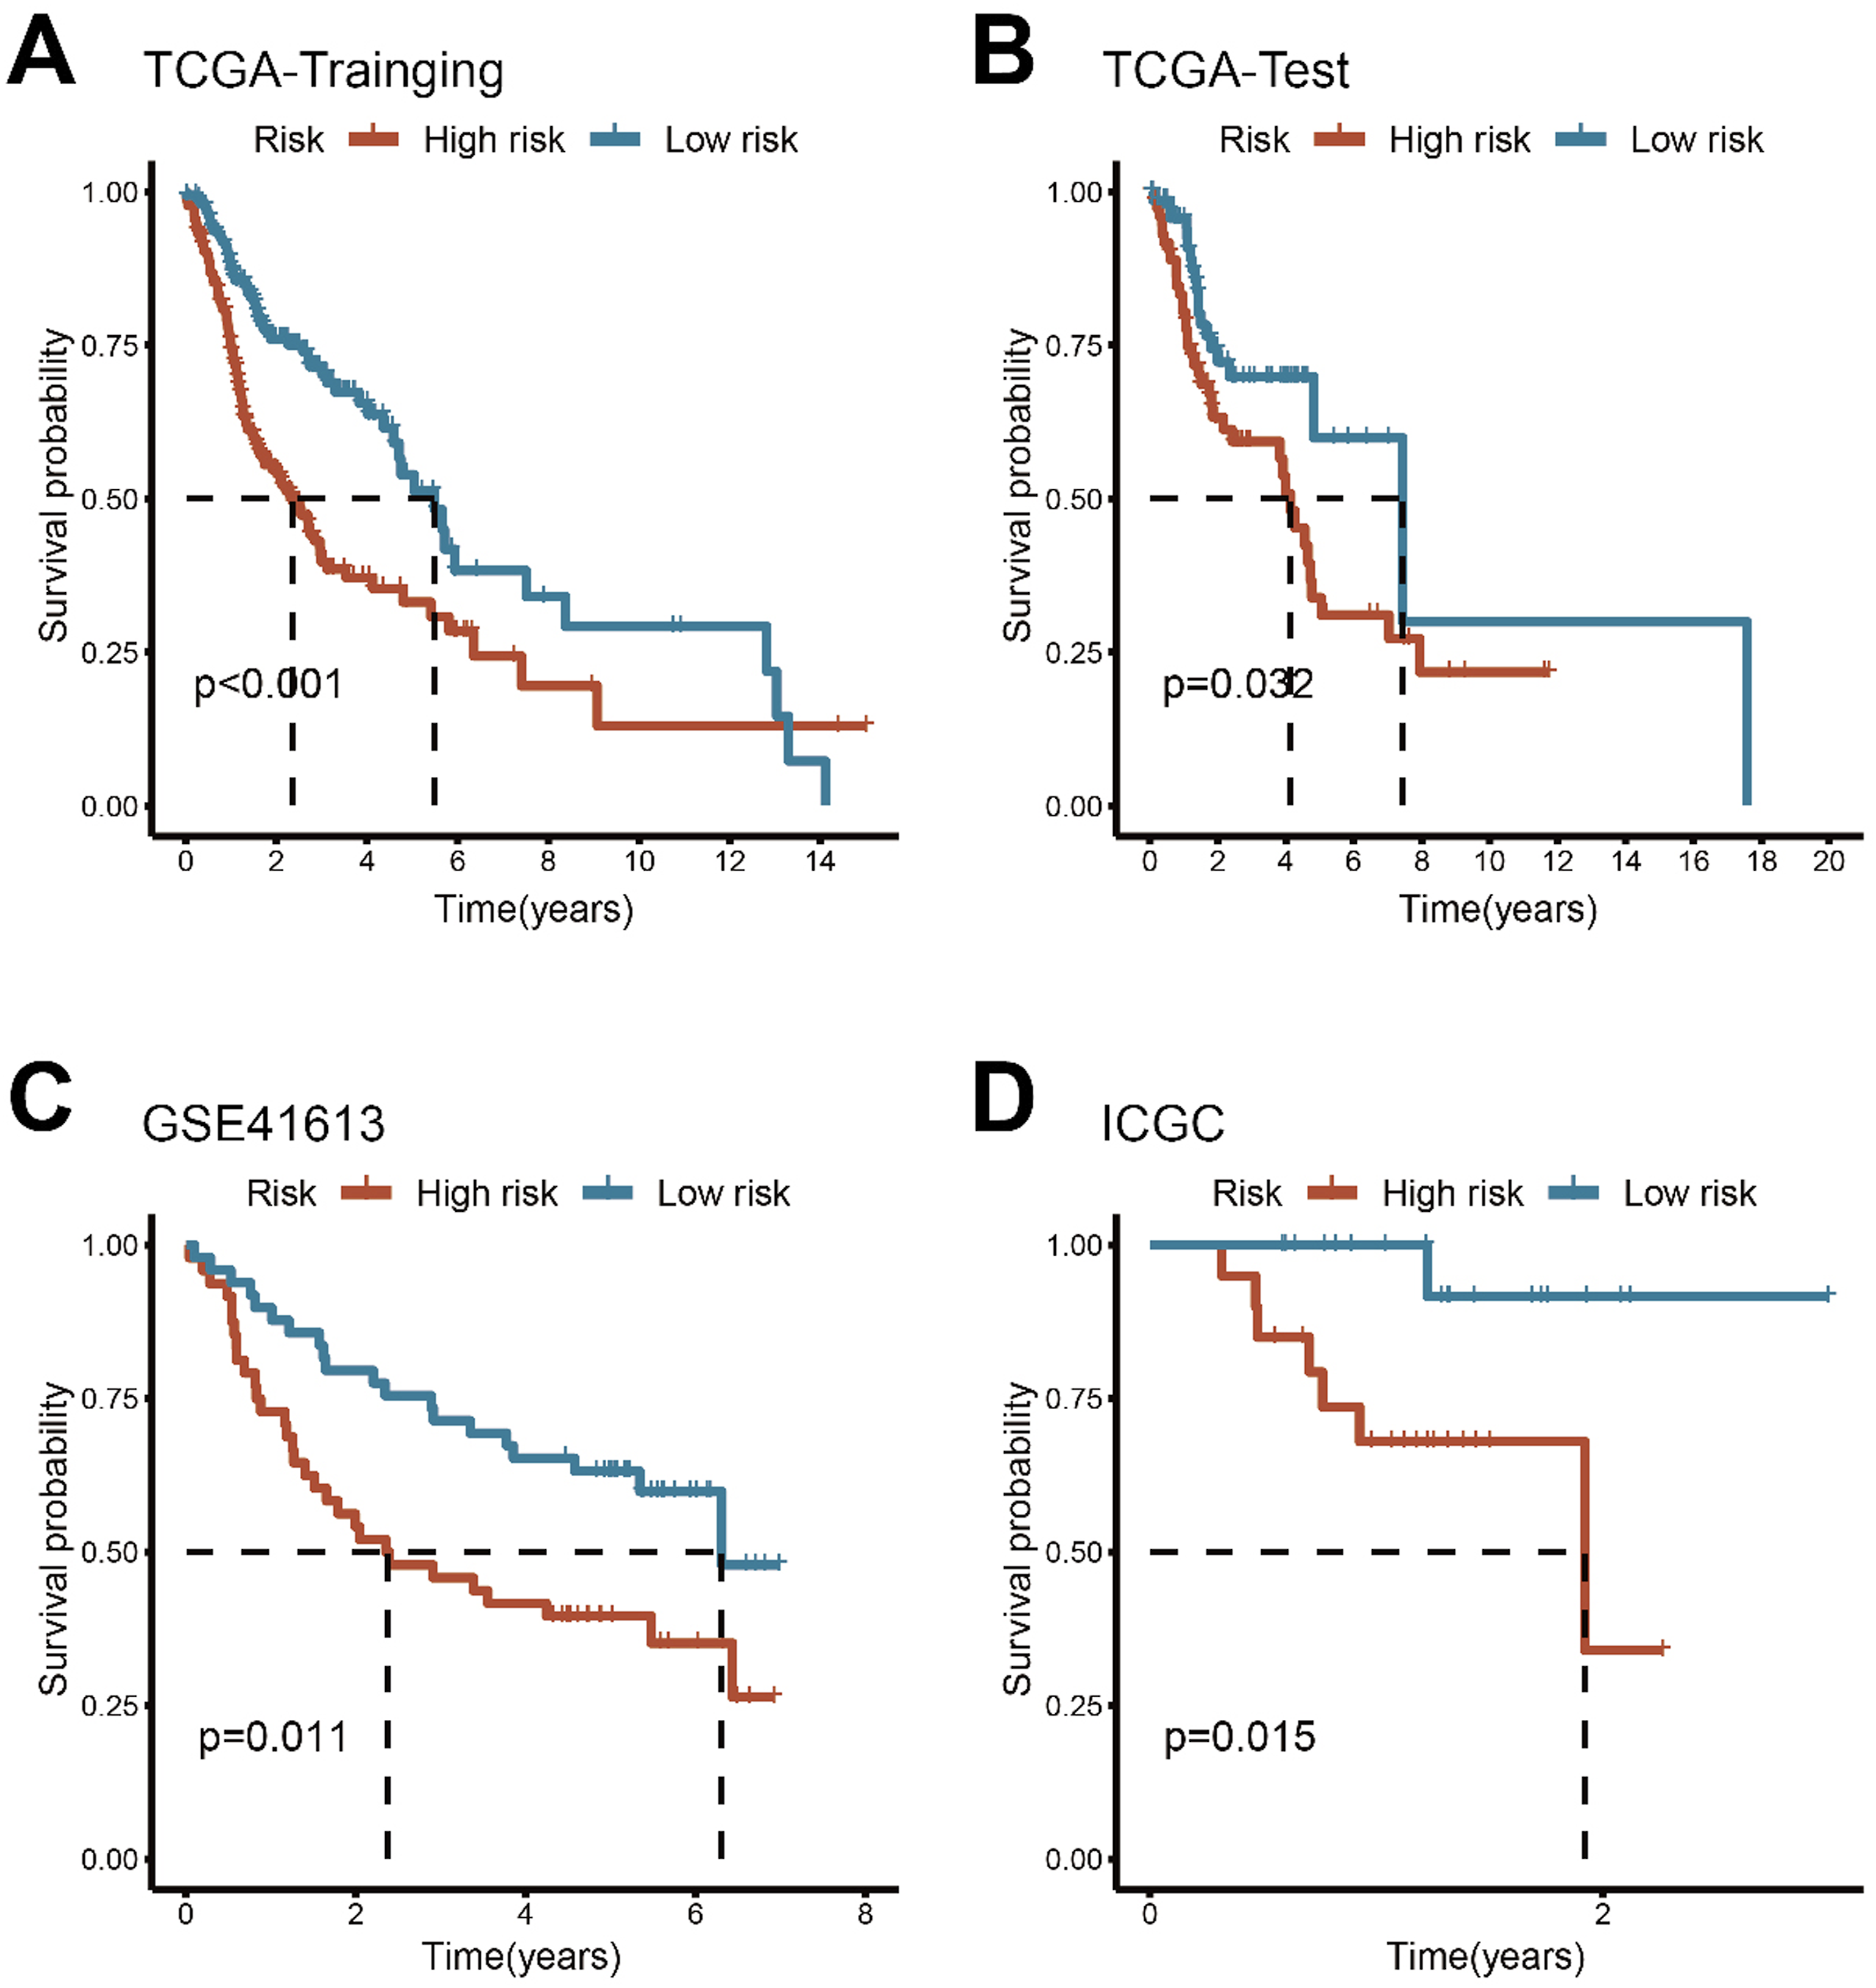
Evaluation of the ECMS
ROC curves quantified the discrimination of ECMS, with 1-, 3-, and 5-year AUCs of 0.699, 0.727, and 0.684 in TCGA-Training; 0.663, 0.600, and 0.595 in TCGA-Test; 0.660, 0.615, and 0.690 in GSE41613, respectively (Figure 5A–C). At 1 and 2-years, the AUCs of the ICGC set were 0.932 and 0.750 (Figure 5D). Previous studies have reported that clinical features, such as AJCC stage, can be used for prognosis in HNSCC. Therefore, we evaluated the predictive capability of ECMS with other clinical parameters in the TCGA cohort by calculating the C-index. As shown in Figure 5E, the accuracy of ECMS is significantly higher than other parameters, including age, sex, grade, T stage, N stage, and AJCC stage. Additionally, we compared ECMS with 10 previously published predictive signatures for HNSCC, related to multiple biological processes like stemness, HPV, autophagy, apoptosis, metabolism, etc., and ECMS showed relatively better performance compared with previously reported signatures (Figure 5F–I).16-25 Based on our findings, the ECMS demonstrates potential clinical relevance as a prognostic predictor in HNSCC. Though its AUC value remains suboptimal, it outperforms existing gene-based prognostic signatures, warranting further investigation given its comparative advantages in clinical stratification. Evaluation of ECMS. Time-dependent ROC analysis for predicting OS in TCGA-Training (A), TCGA-Test (B), GSE41613 (C), and ICGC cohorts (D). (E) The performance of ECMS was compared with other clinical variables in predicting prognosis in TCGA. (F) C-index Comparison of gene expression-based prognostic signatures in HNSCC in TCGA. ROC curve analysis of prognostic signatures at 1 (G), 3 (H) and 5 years (I)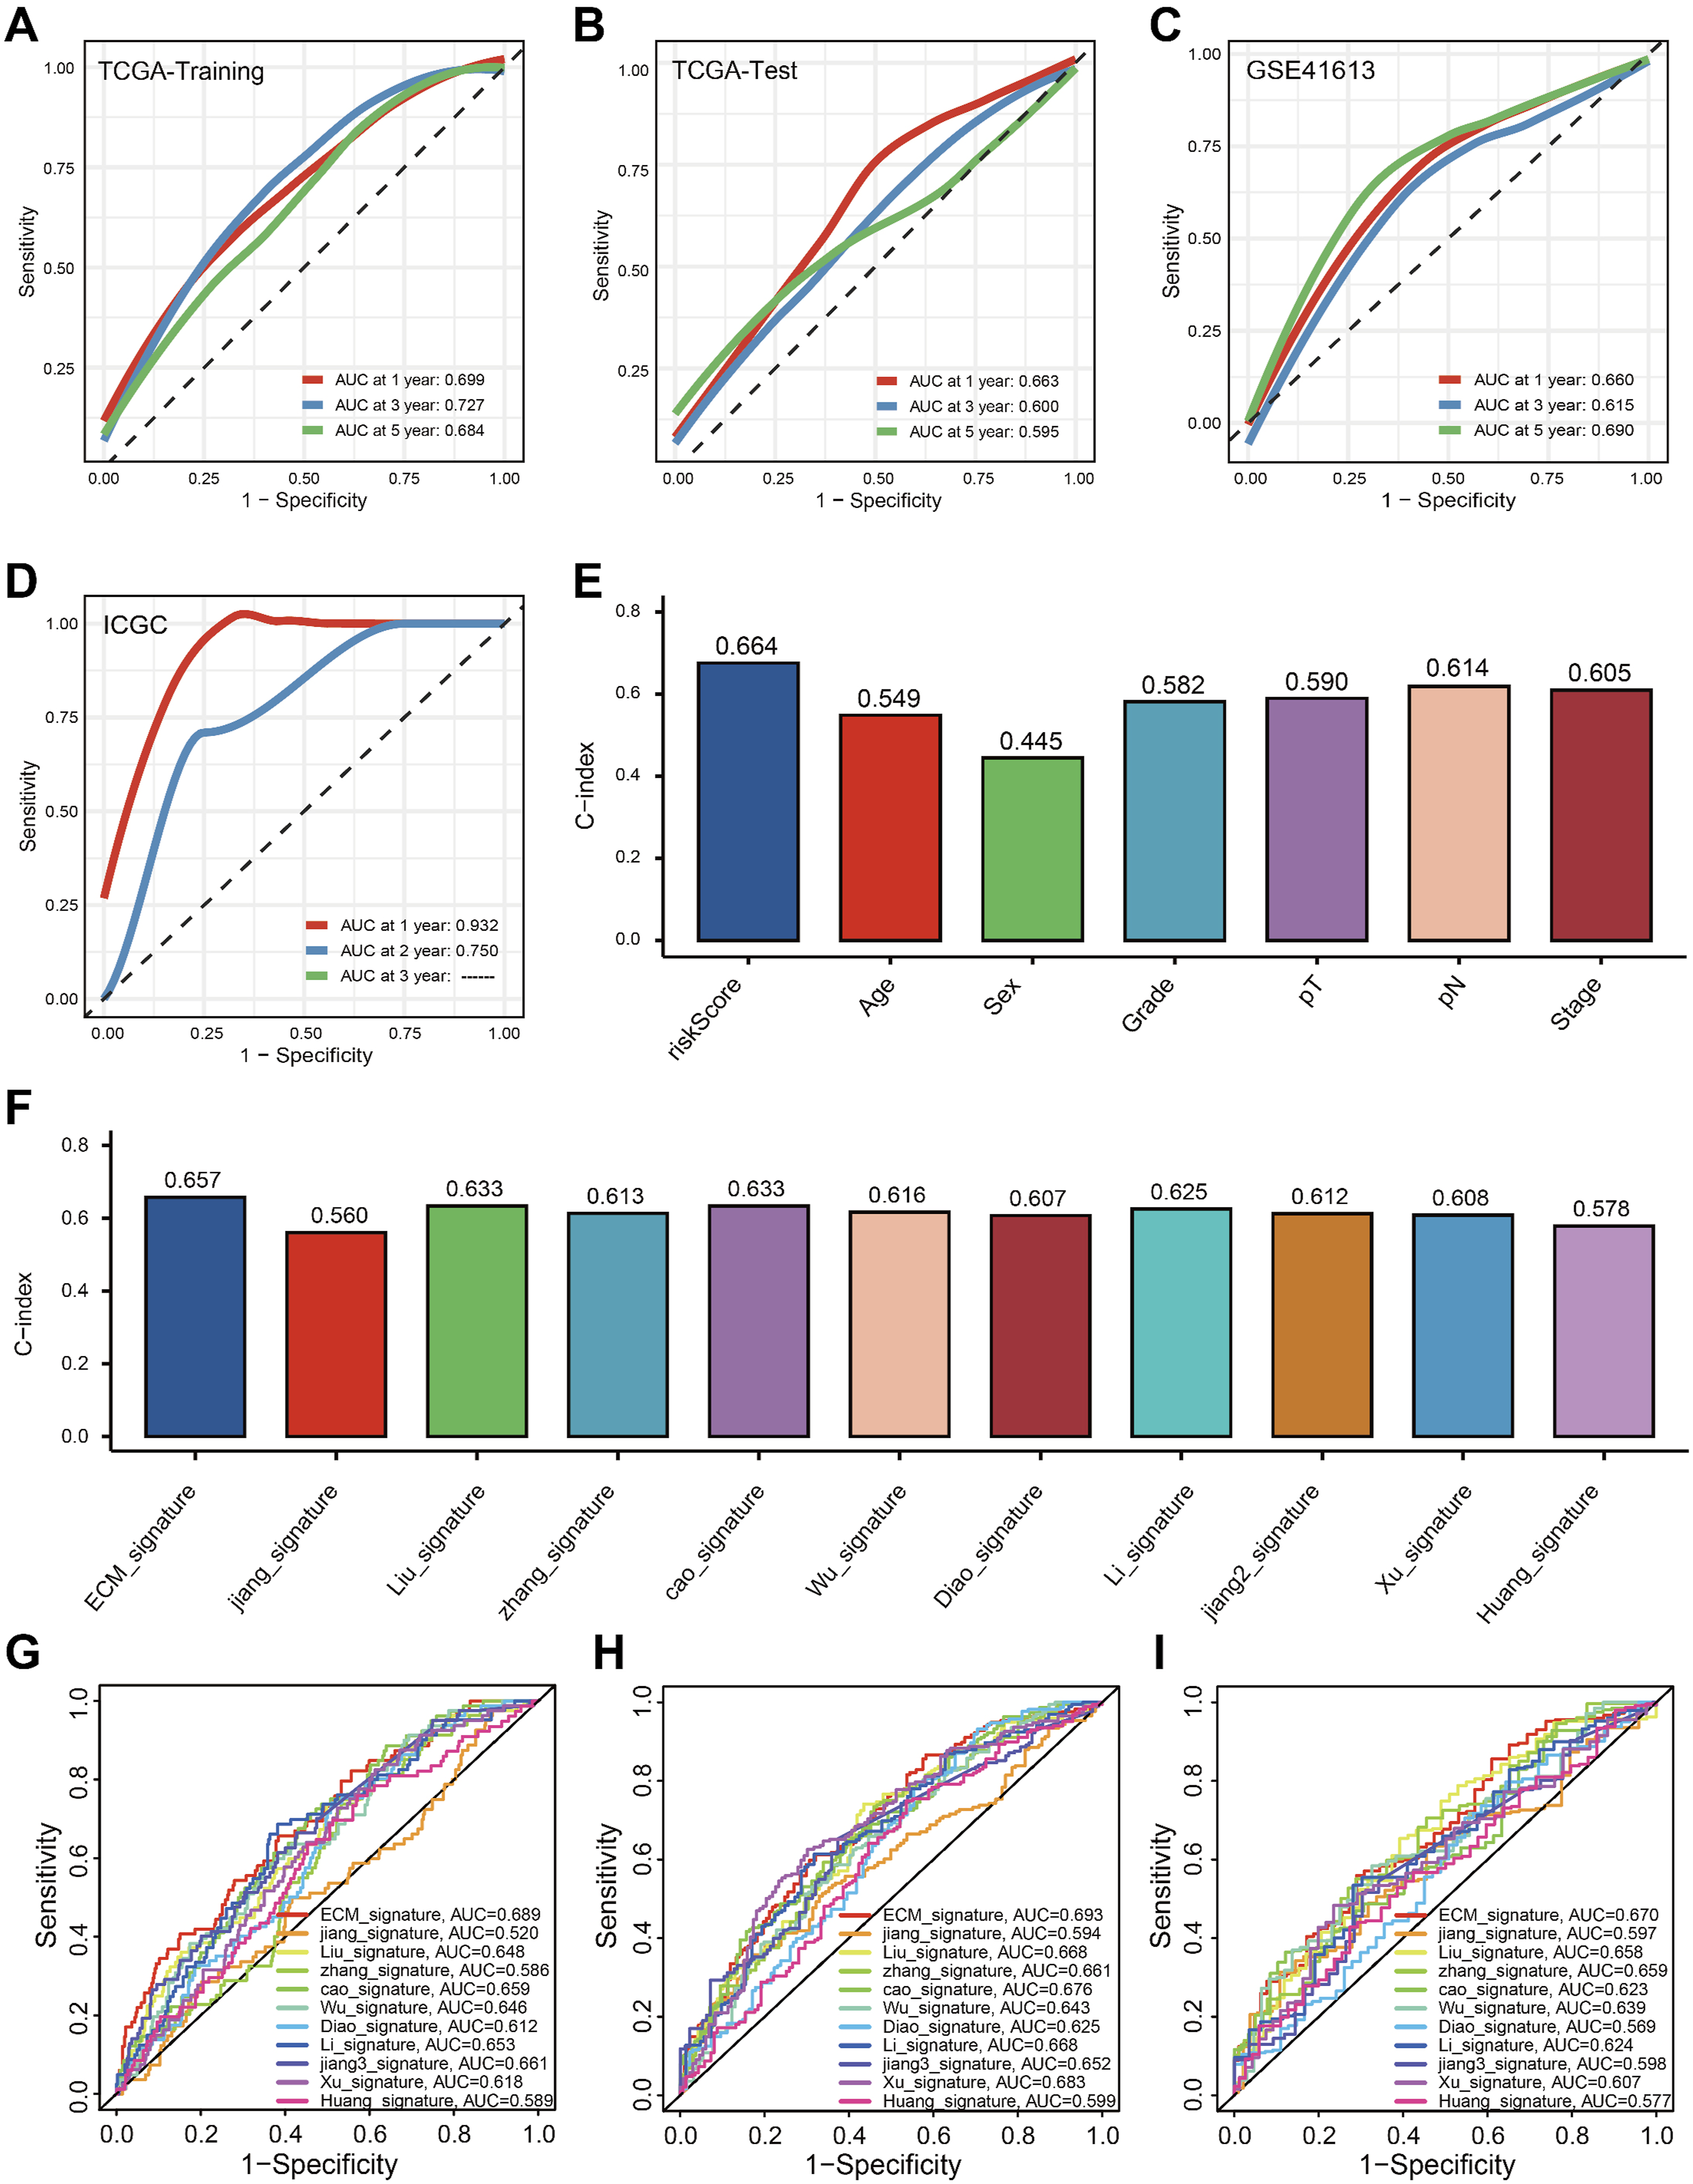
Establishment a Nomogram Combined With Clinical Characteristics
An intriguing idea is whether combining ECMS with clinical features can enhance clinical utility. We conducted univariate (Figure 6A) and multivariate (Figure 6B) Cox analyses, and ECMS, age, and stage were identified as independent prognostic factors for HNSCC. To better integrate ECMS into clinical applications, we constructed a nomogram by combining it with other prognostic clinical features (Figure 6C). Calibration curves were generated using 1000 bootstrap resamples, demonstrating good agreement between predicted and observed OS (Figure 6D). The optimism-corrected C-index was calculated via bootstrap cross-validation, and the reported value represents the mean of 1000 out-of-bag predictions. ROC analyses indicate that the nomogram outperforms individual clinical features in predicting OS (Figure 6E–H). Decision curve analysis (DCA) was performed across a clinically relevant threshold probability range, showing superior net benefit of the nomogram relative to individual clinical features (Figure 6I). These findings suggest that the nomogram based on ECMS may represent a potentially useful exploratory approach for prognostic prediction in HNSCC, although further validation is required before clinical application. Construction and evaluation of Nomogram. Univariate Cox regression analysis (A) and multivariate Cox regression analysis (B) illustrated that the ECMS could be used as an independent prognostic factor for HNSCC patients. (C) A nomogram constructed by multi-Cox regression analysis on ECMS, stage, and age. (D) Calibration curves indicate that the nomogram is specific. C-index(E) and ROC curve analysis at 1 (F), 3 (G), and 5 years (H). (I) DCA curves for the nomogram, the ECMS and other clinical traits in terms of their net benefits for HNSCC patients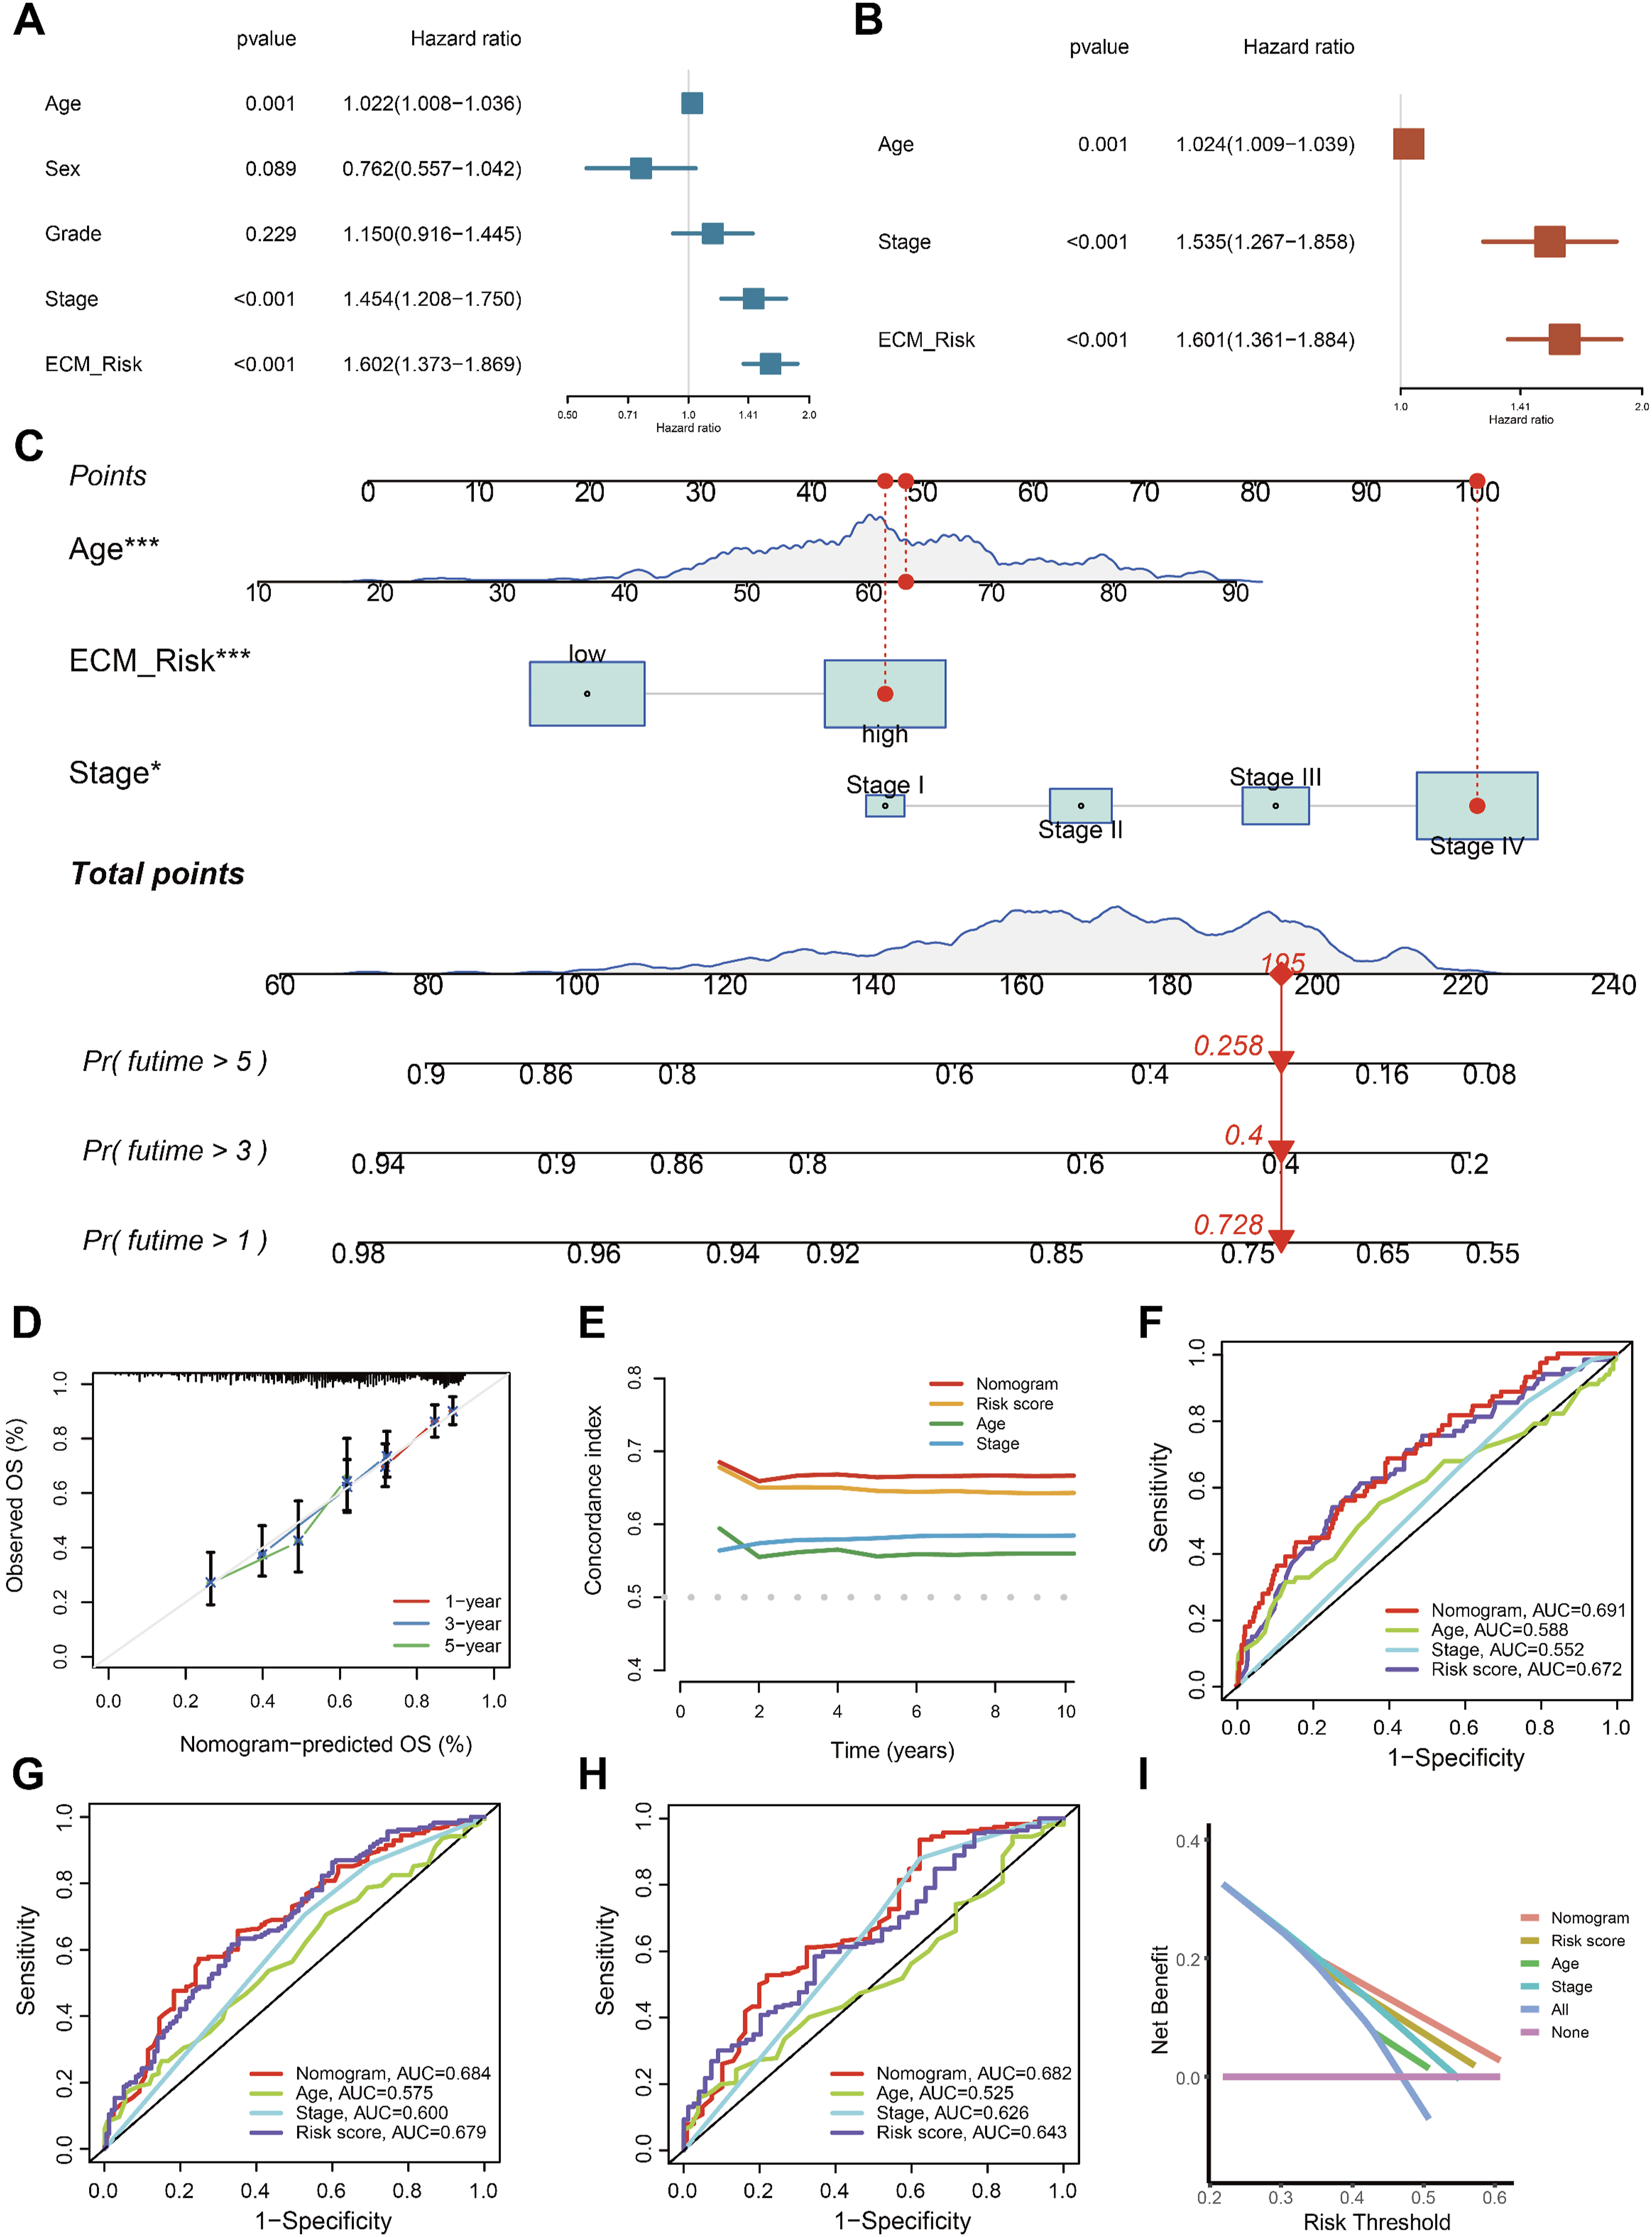
The Immune Microenvironment and ECMS
To better understand the relationship between ECMS and immune cell content, Spearman correlation analysis and Wilcoxon tests were performed using seven different software programs. As shown in Figure 7A, indicate a significant correlation between immune cells such as B cells, T cells, macrophages, and ECMS. Furthermore, there are substantial differences in immune cell content between two risk groups (Figure 7B). Specifically, patients in the low-risk group exhibited higher levels of CD8+ T cells, Tregs, and B cells (Figure 7C–E), while the high-risk group showed a more abundant presence of M0 macrophages, resting mast cells, and NK cells (Figure 7F–H). It should be noted that the prognostic implications of Tregs are highly context-dependent in HNSCC and do not uniformly indicate a favorable outcome across all cancer types. Likewise, the elevated NK cells in the high-risk group may reflect a compensatory anti-tumor response or potential functional exhaustion, which cannot be fully delineated by bulk deconvolution alone. (A)The ECMS correlated with the presence of many kinds of immune cells, which was analyzed via XCELL, TIMER, QUANTISEQ, MCPCOUNTER, EPIC, CIBERSORT-ABS, CIBERSORT. (B) The heatmap shows the differential analysis of different numbers of immune cells between the high-risk and low-risk group. Comparison of CD8+ T cells (C), Tregs (D), and B cells (E), M0 macrophages (F), resting mast cells (G), and NK cells (H) between high-risk and low-risk patients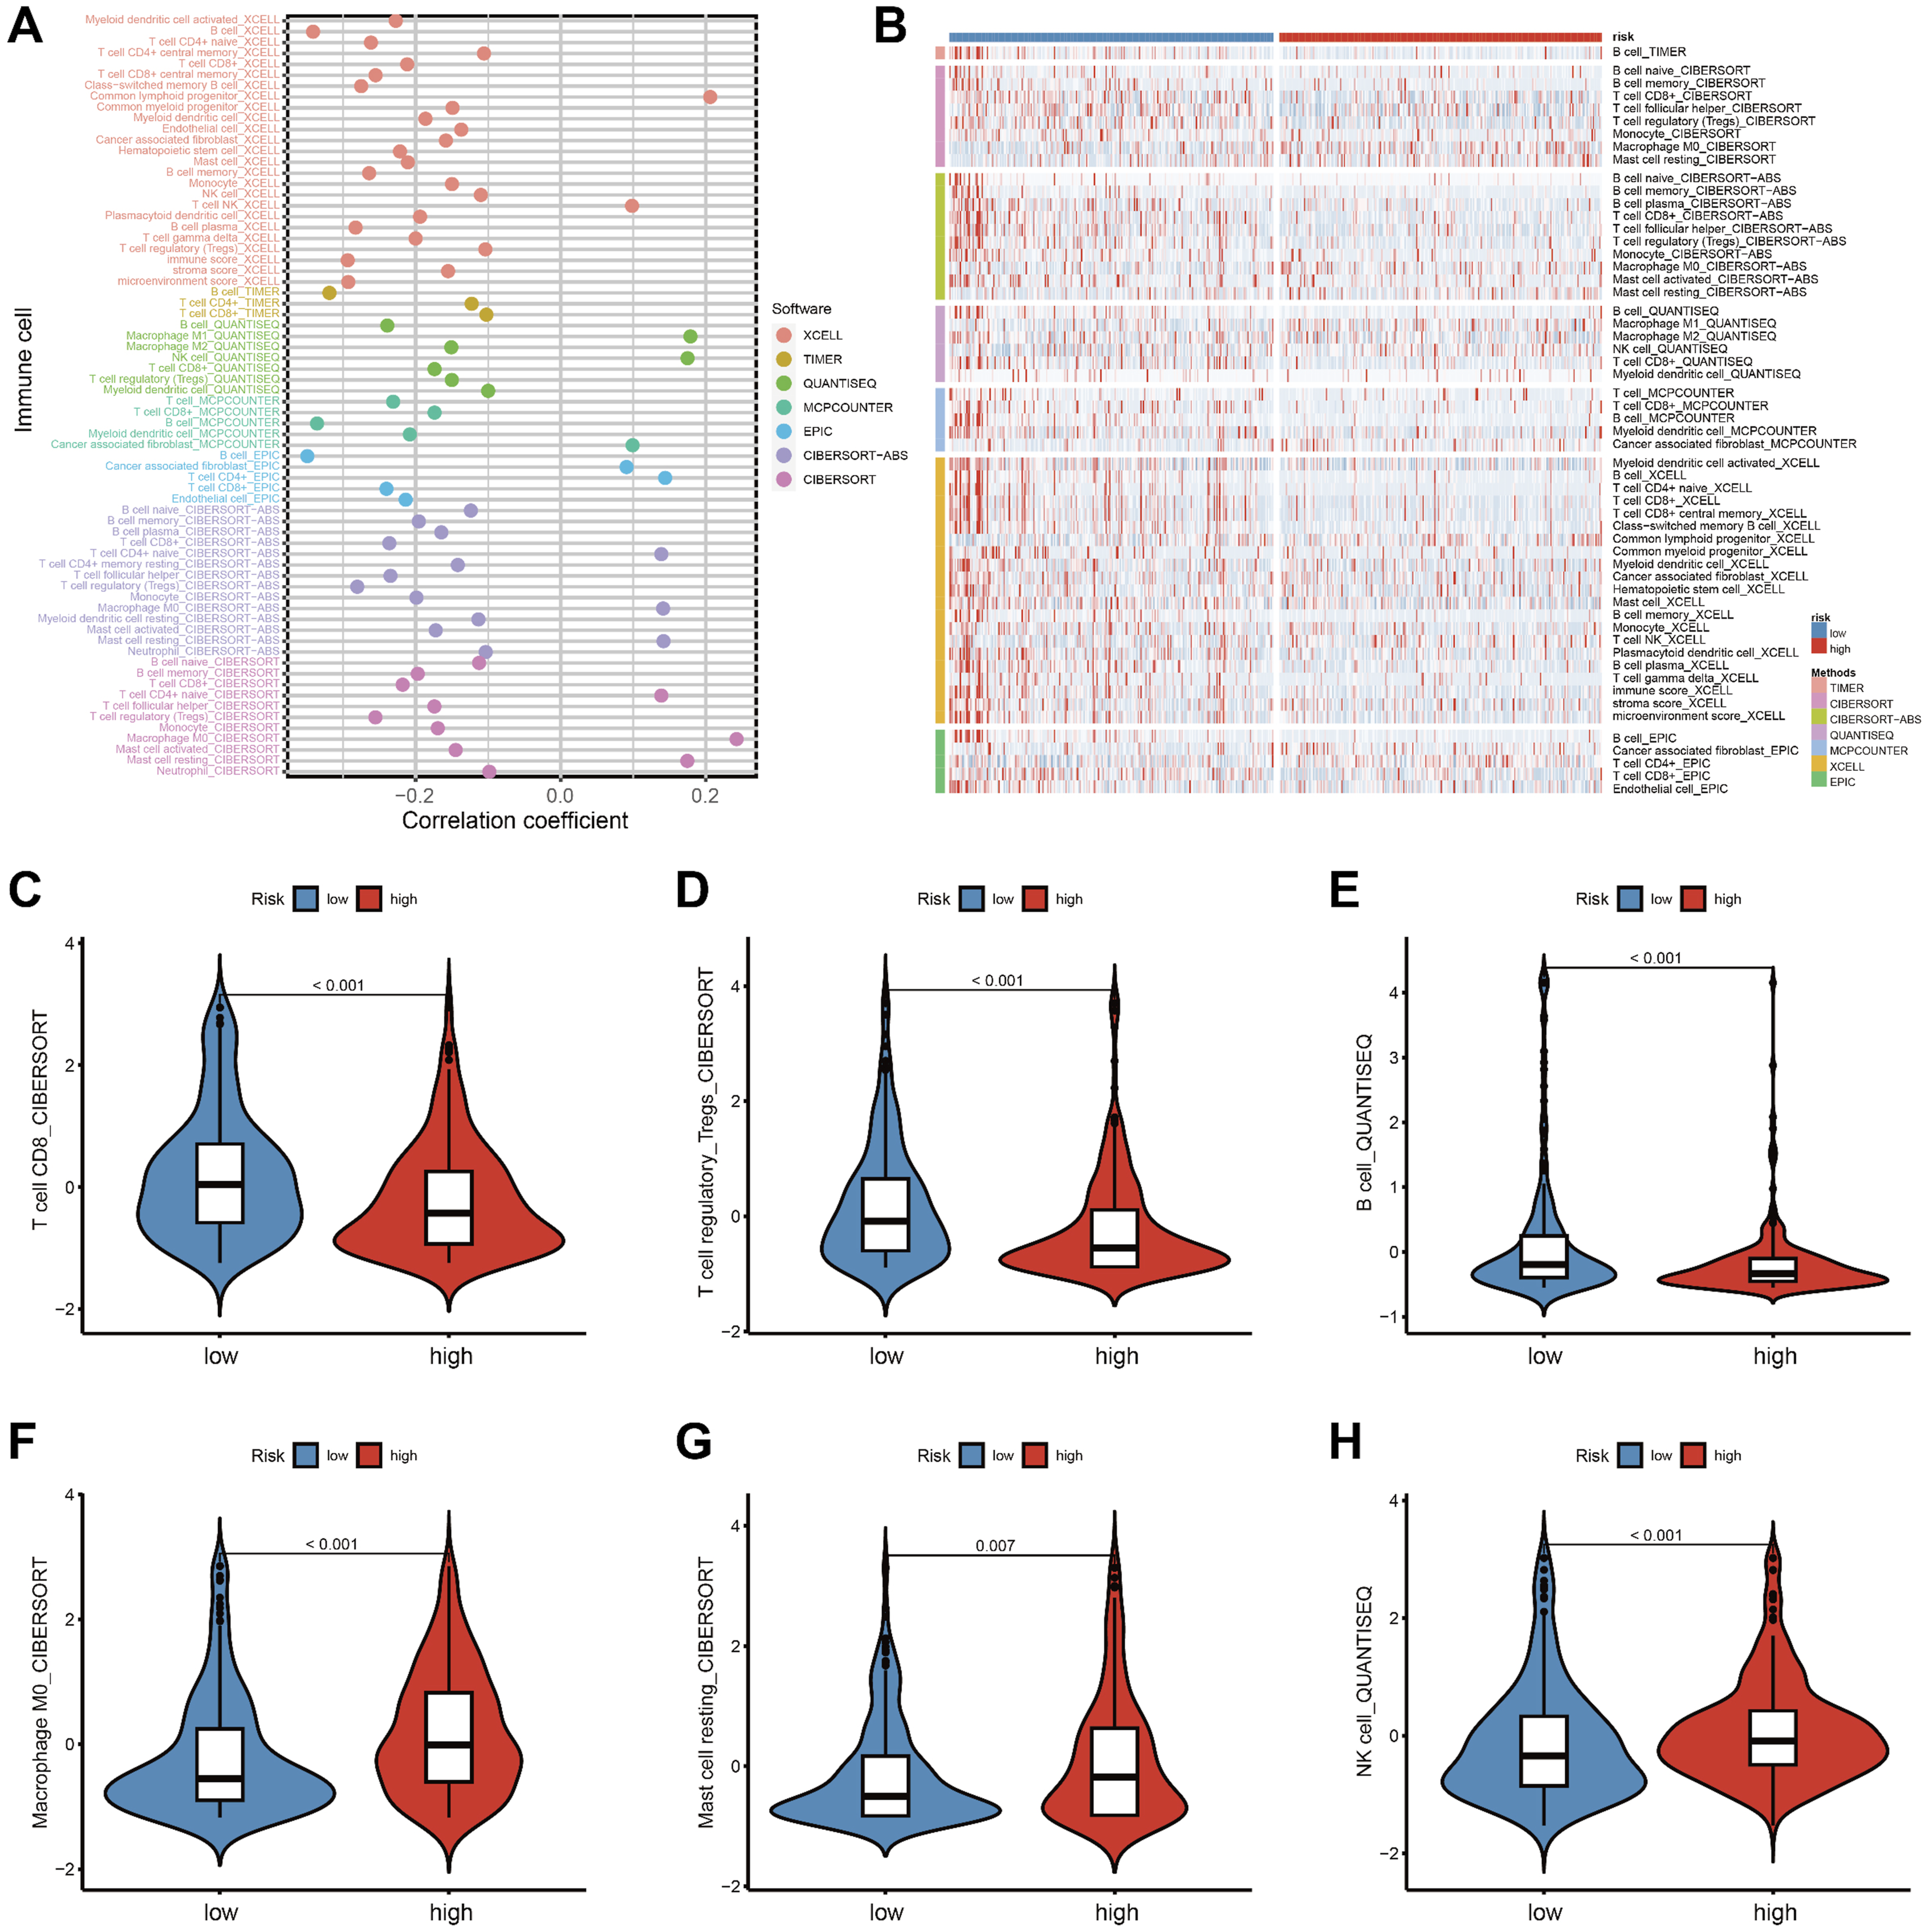
Therapy Response and Pathway Analysis
Chemotherapy is one of the standard treatment methods for HNSCC. We utilized the R package “pRRophetic” to estimate the IC50 of commonly used chemotherapy drugs for each HNSCC patient. The results indicate that patients in the high-risk group are more sensitive to cisplatin and docetaxel (Figure 8A and B). Conversely, patients in the low-risk group have lower IC50 values for methotrexate, afatinib, gefitinib, and oxaliplatin (Figure 8C–F). Immunotherapy has become a pivotal focus in cancer treatment. Regrettably, not every form of cancer reacts to it, and not all patients derive advantages from it. TIDE score was utilized for predicting the response to immunotherapy. Generally, the lower TIDE score, the more sensitive the response to immunotherapy. The results reveal that the TIDE scores in the high-risk group are significantly lower than those in the low-risk group (P < 0.001, Figure 8G). Furthermore, there is a negative correlation between risk scores and TIDE scores (cor = -0.23, P < 0.001; Figure 8H). We then examined the expression levels of immune checkpoints in samples with different risk scores and further discovered differential expression of several immune checkpoint genes between the two groups (Figure 8I). The results suggest that these genes may serve as prospective indicators for immune activity regulation in the tumor microenvironment and could play important roles in checkpoint inhibitor-based immunotherapy. Association between the ECMS and therapy sensitivity. (A-F) The IC50 values for the chemotherapeutic drugs between the two subgroups. (G) Differences in the TIDE scores between the high-risk and low-risk groups. (H) Scatter plots depicting the negative correlation between TIDE scores and ECMS by the Spearman correlation analysis. (I) Expression of immune checkpoints among high- and low-risk groups. (J) KEGG and GO enrichment analyses of differential genes between high-risk and low-risk groups. BP, biological process; CC, cellular component; MF, molecular function.*p < 0.05, **p < 0.01, ***p < 0.001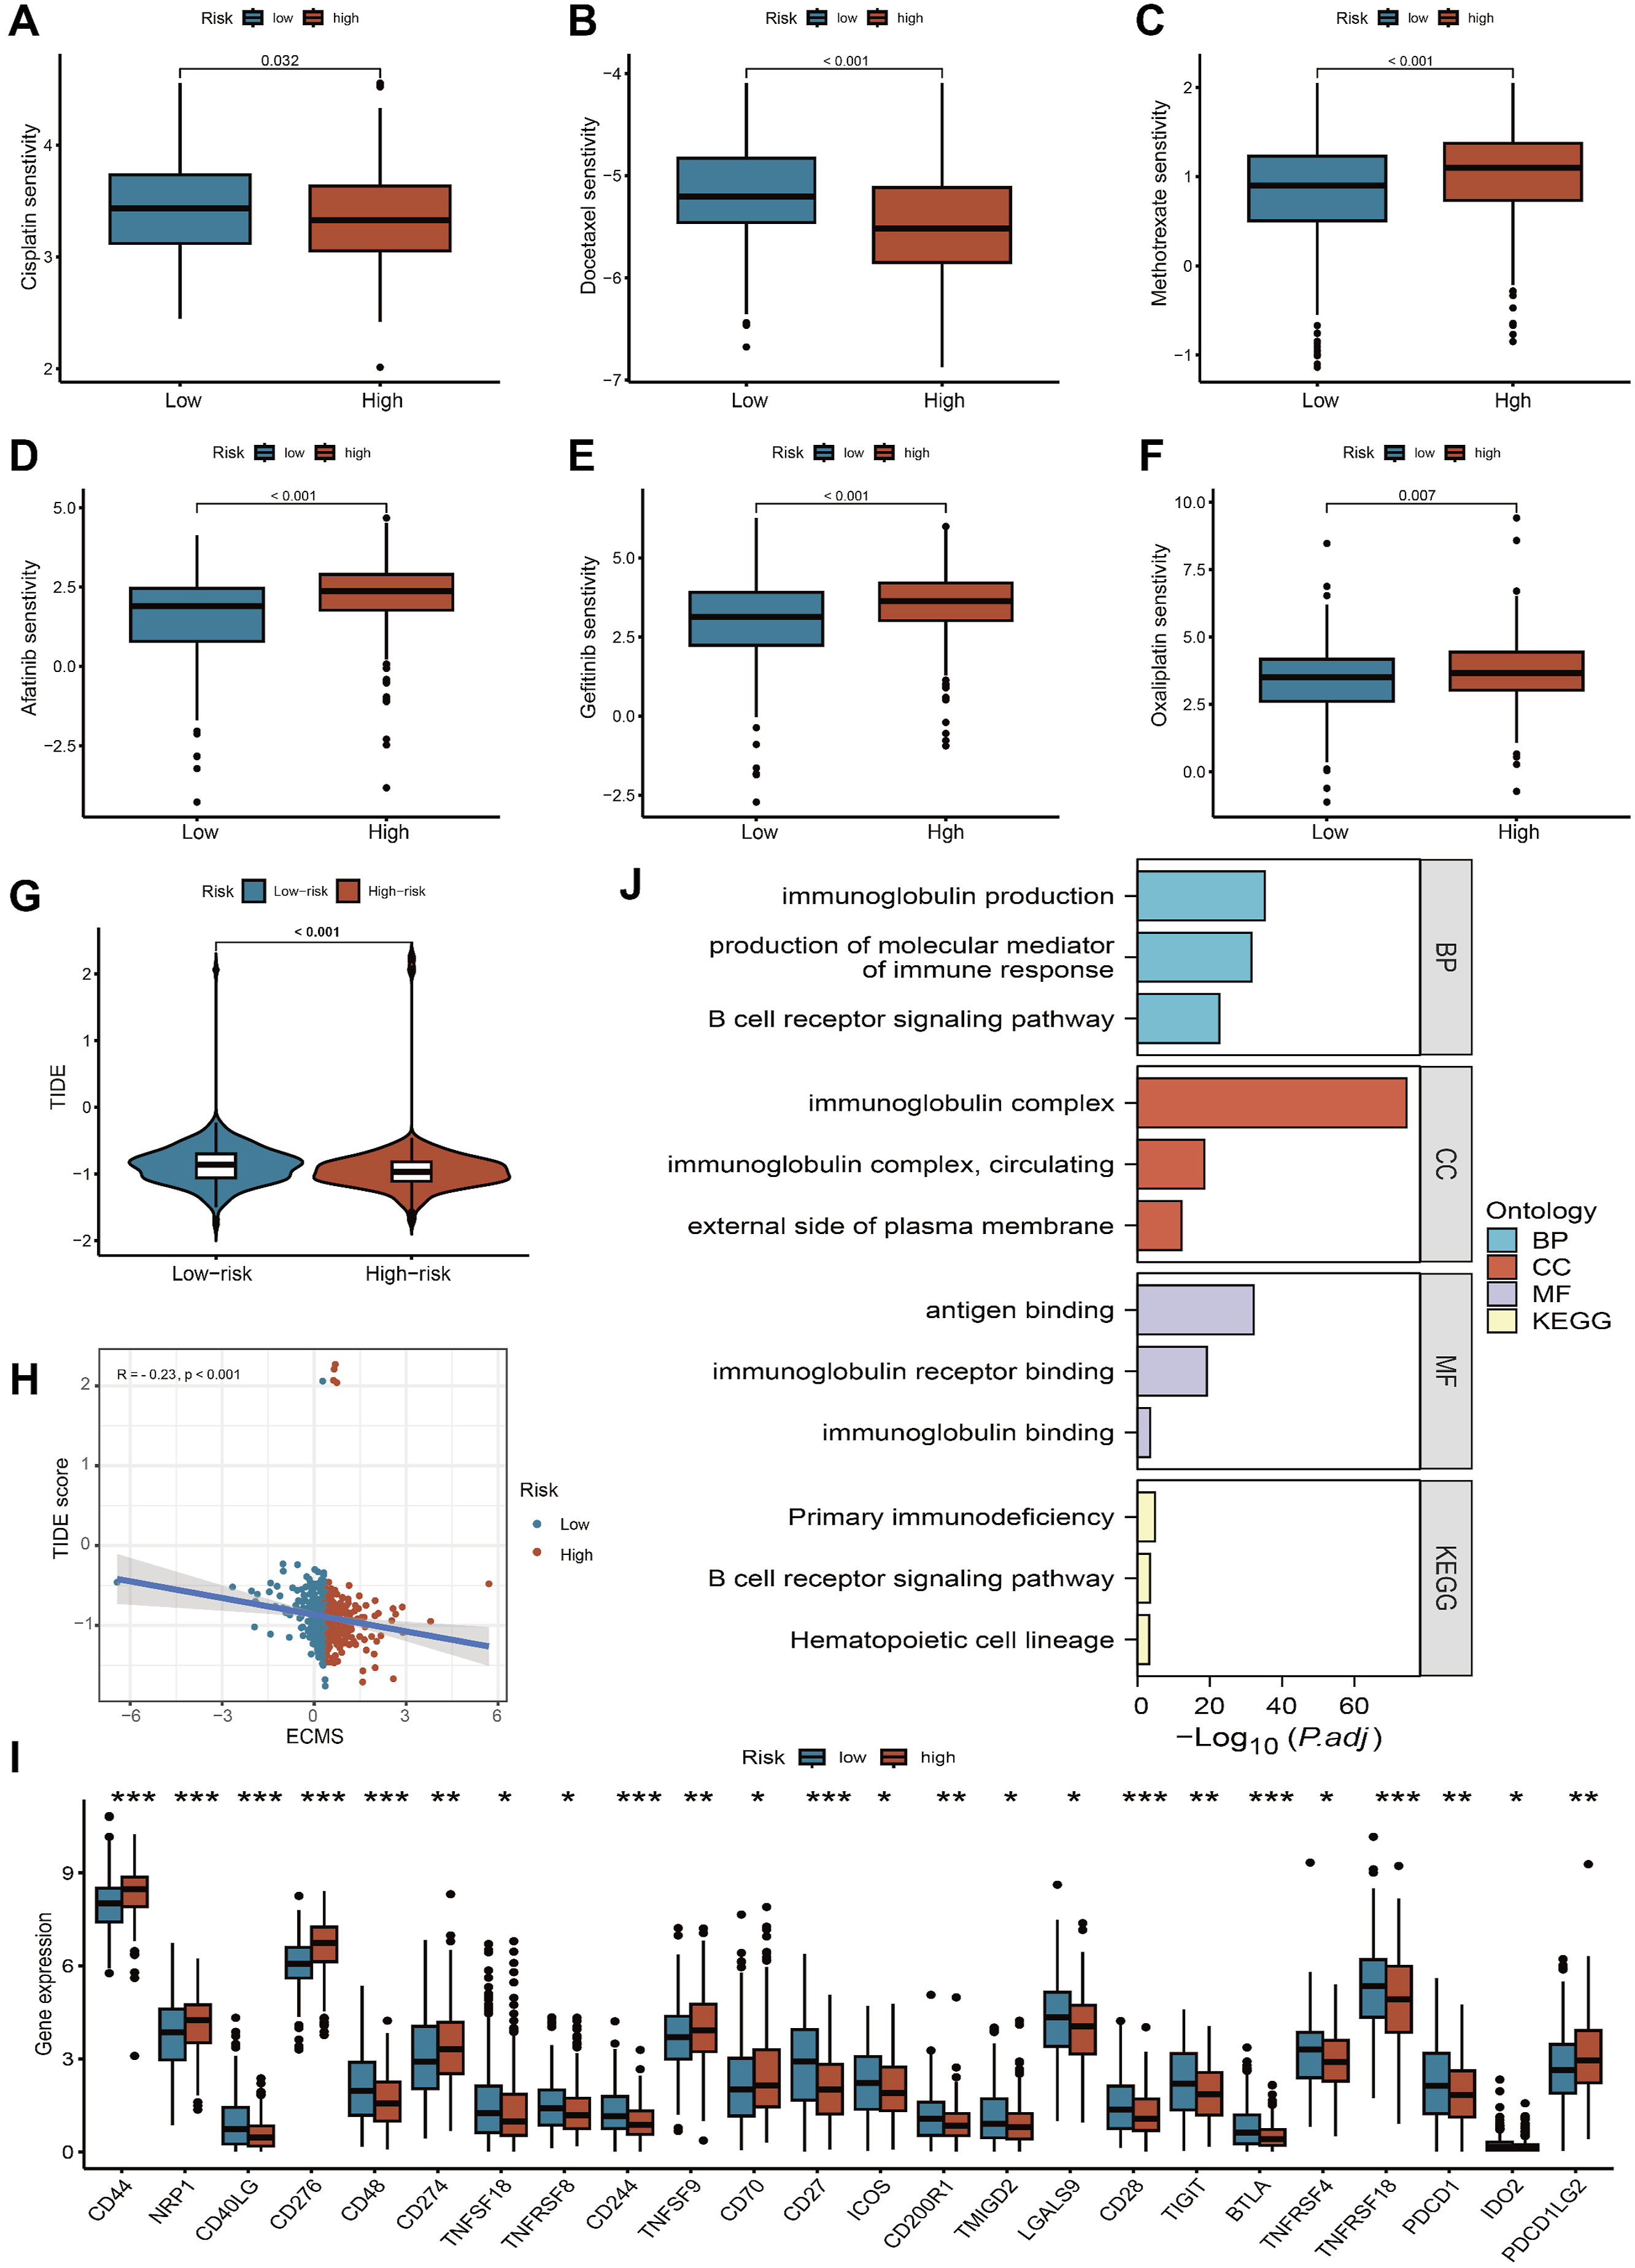
Notably, Enrichment analysis results suggest that DEGs between the high- and low-risk groups is primarily involved in immunoglobulin production, immunoglobulin complex, immunoglobulin binding and B cell receptor signaling pathway, which may be the underlying mechanism behind the features we constructed (Figure 8J).
Validation of Gene mRNA Expression in HNSCC Patients
qRT-PCR was used to examine the mRNA expression levels of these genes in 15 pairs of HNSCC and adjacent tissues. As shown in Figure 9, the expression of IFNE, WNT7A, CCL26 and PLOD2 were much higher in HNSCC tissues, ELANE, SEMA3F, IL22, FGB, SLPI and RSPO1 were lower in HNSCC tissues. Comparison of mRNA expression levels of genes in 15 paired HNSCC tissues and adjacent normal tissue samples by qRT-PCR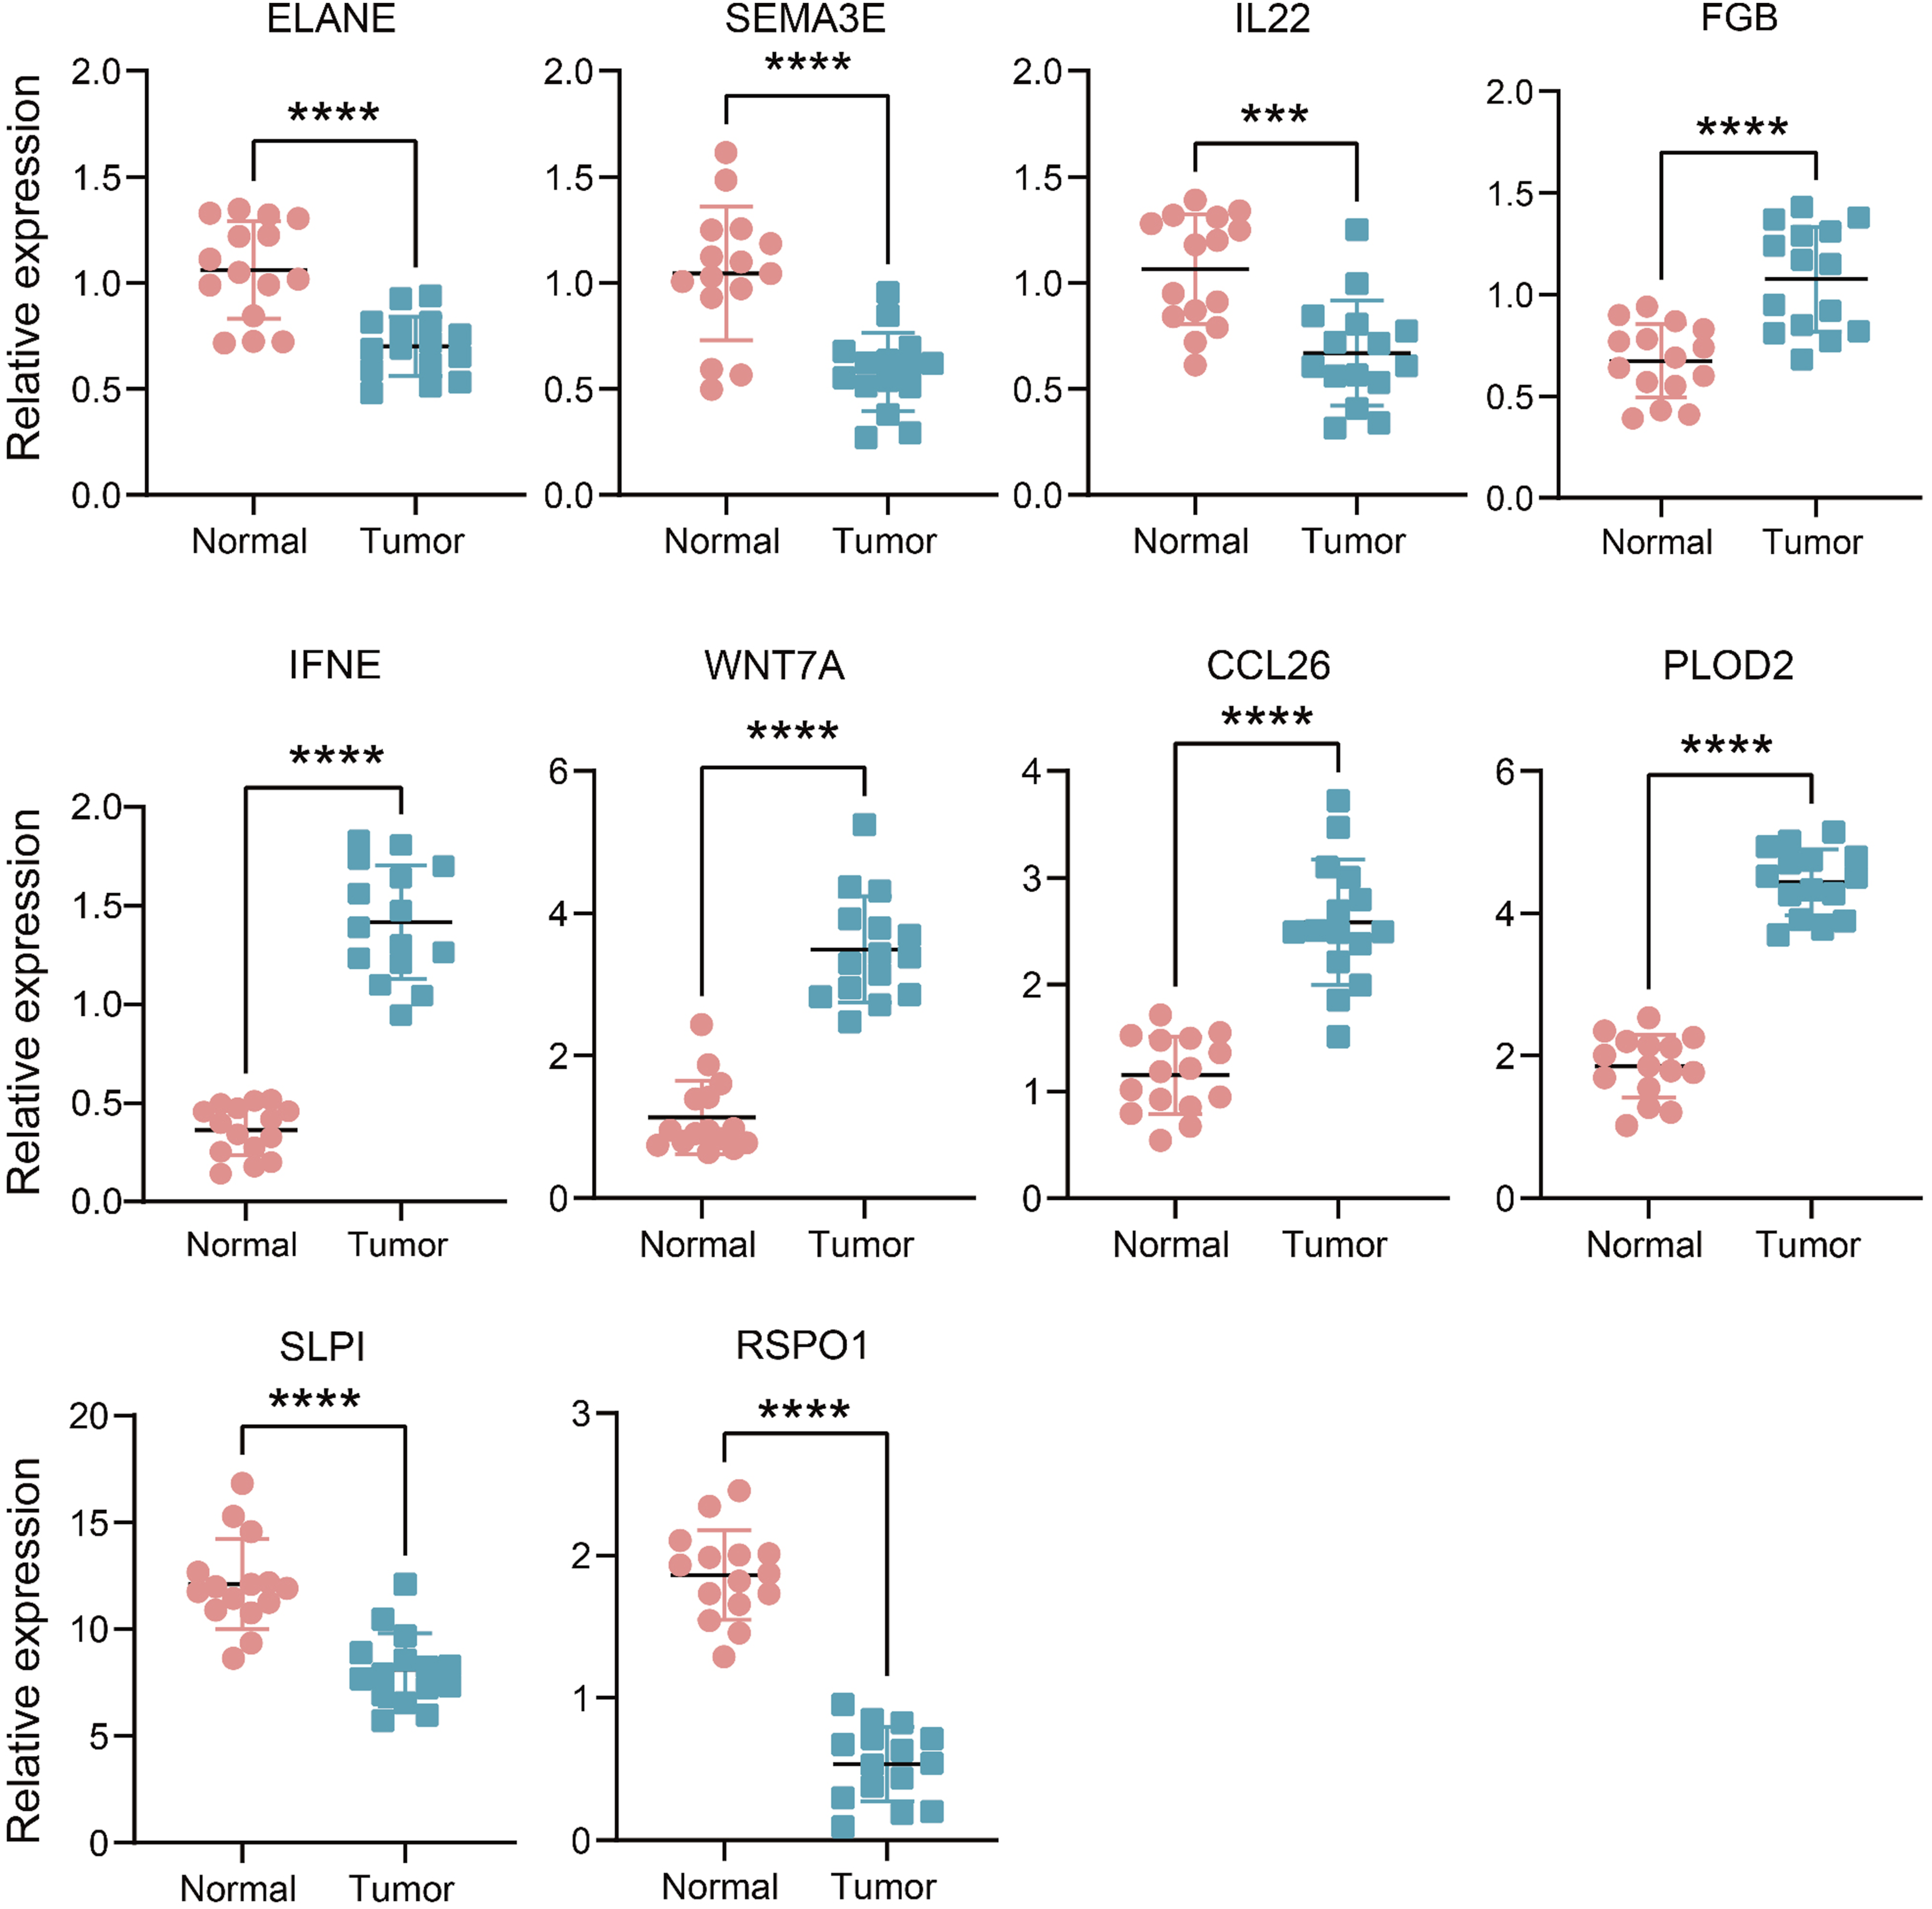
WNT7A Promotes HNSCC Tumor Progression in Vitro
We created a stable WNT7A knockdown FaDu cell line to investigate the biological functions of WNT7A in HNSCC. Western blot analysis was used to confirm the efficacy of WNT7A knockdown in the constructed cell lines (Figure 10A). CCK-8 and colony formation assays demonstrated that WNT7A knockdown markedly decreased cell viability and colony formation in FaDu cells (Figure 10B–D). Wound healing and transwell assays revealed that WNT7A knockdown led to a notable decrease in these processes (Figure 10E–H). In summary, WNT7A promotes the proliferation, migration, and invasion of HNSCC cells. WNT7A promotes HNSCC cells progression. (A) Western blot validation of WNT7A knockdown in FaDu. Colony formation assays(B-C) and CCK-8 proliferation assays(D) in FaDu-shWNT7A cells and corresponding control cells. (E-F) Wound healing assays were performed in FaDu-shWNT7A cells and corresponding control cells cultured for 24 h. (G-H) Transwell assays were performed in FaDu-shWNT7A cells and corresponding control cells. (I) Western blot validation of WNT7A knockdown in CAFs. (J) Schematic diagram of cell co-culture experiments in CAF–FaDu cells. (K-L) Transwell assays were performed in co-culture cells.*** P < 0.001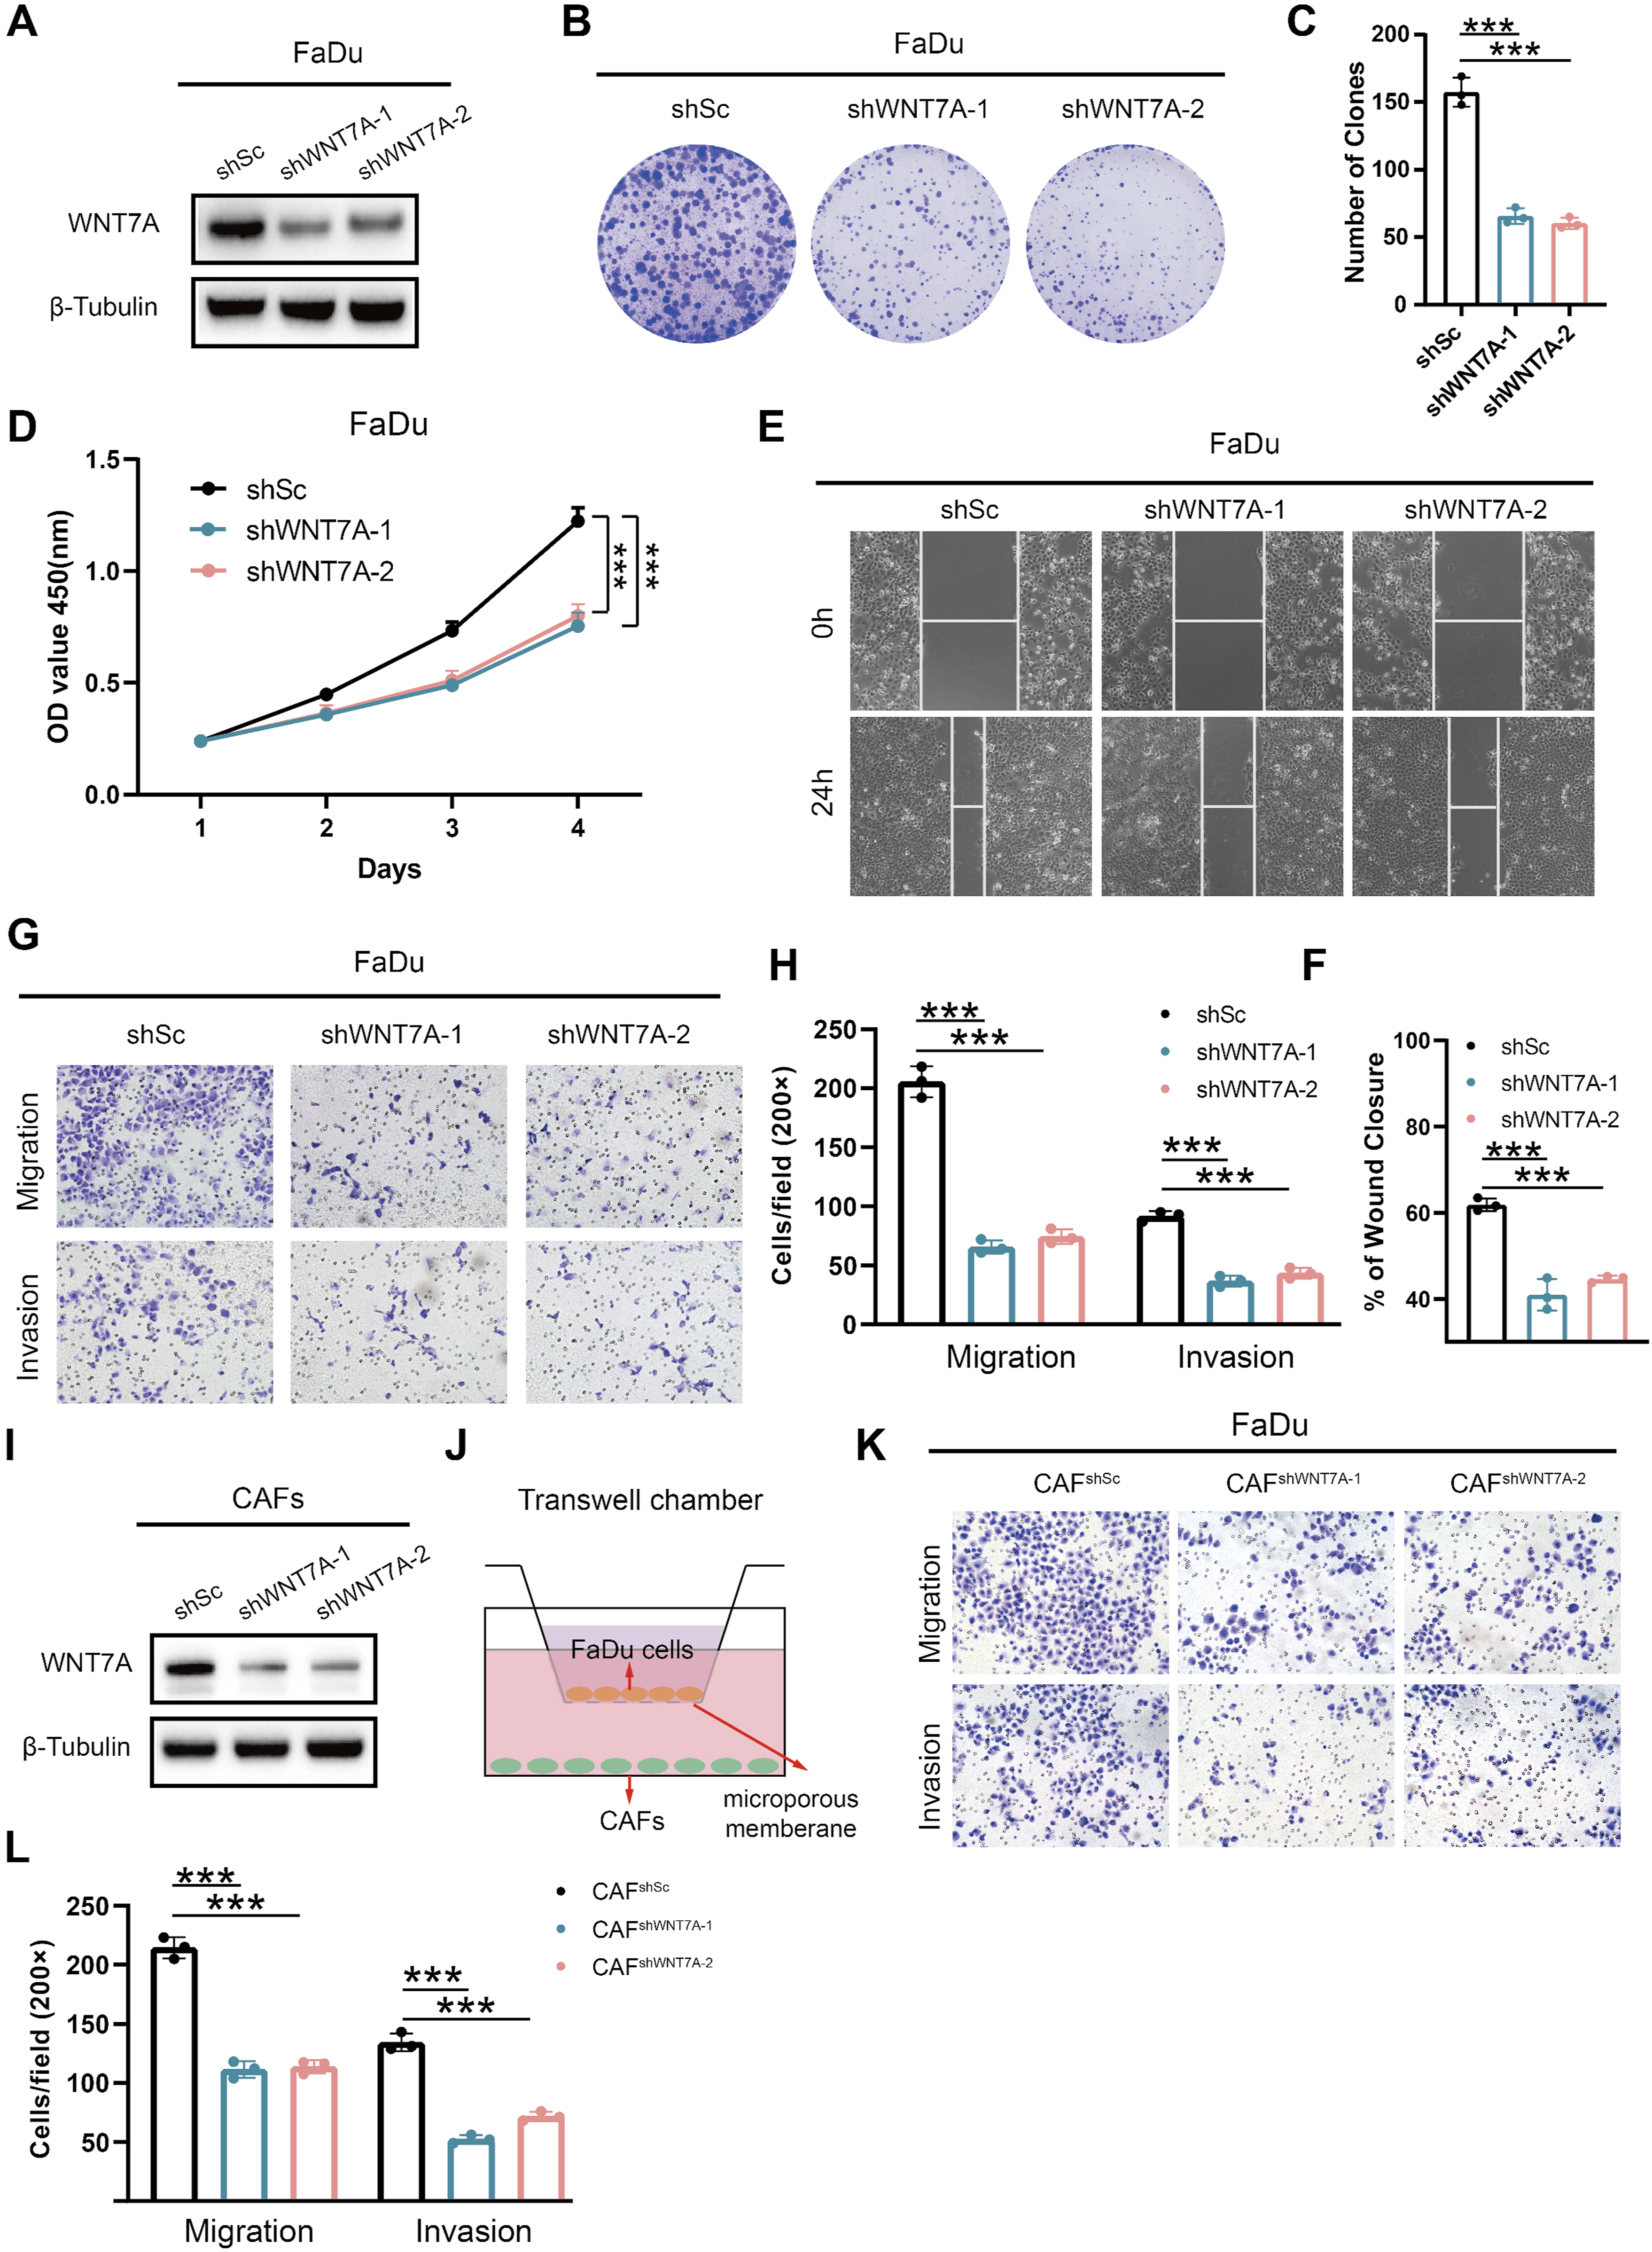
Subsequently, we isolated CAFs from HNSCC tissues and knocked down WNT7A expression using lentivirus-mediated shRNA (Figure 10I). Transwell co-culture assays demonstrated that suppression of WNT7A in CAFs significantly reduced the migratory and invasive capabilities of HNSCC cells (Figure 10J–L). Collectively, these results indicate that ECM related genes, such as WNT7A, play an important role in regulating the malignant biological behavior of HNSCC.
Discussion
The advancements in high-throughput sequencing technology have led to the identification of a wealth of prognostic biomarkers and therapeutic targets, significantly advancing our understanding of cancer.26-29 Alterations in the biochemical and mechanical traits of the ECM have the potential to influence cellular behavior via transmembrane receptors, including integrins and syndecans. A common occurrence in solid tumors, the desmoplastic response is typified by an excessive accumulation of ECM proteins, which has been implicated as a hallmark of poor prognosis. 30 The migration of cancer cells through the ECM is crucial for their spread to distant parts of the body; thus, alterations in the biophysical properties of the ECM, such as deformability or stiffness, can impact metastasis. Studies have demonstrated that remodeled and stiffened ECM facilitates the dissemination of cancer cells.31,32 Moreover, the ECM acts as a reservoir for cytokines, regulating their distribution and interaction with cells. 33 In solid tumors, the ECM can act as a protective shield against host antitumor immunity, thereby inhibiting lymphocyte infiltration and reducing the efficacy of immunotherapy. Considering the crucial role that ECM components play in tumor initiation and progression, a thorough understanding of their biophysical and biochemical effects, as well as remodeling processes, appears essential for identifying promising biomarkers with therapeutic implications. Studies indicate that ECM and fibroblasts regulate the immune microenvironment and tumor behavior in HNSCC through diverse pathways. Specifically, apCAFs modulate CD4+/CD8+ T cell proportions to promote tumor progression 34 ; CTHRC1 promotes EMT via the ITGA5/PI3K/AKT signaling pathway 35 ; and KLF7 reshapes the tumor immune microenvironment, driving HNSCC development. 36 These studies primarily focused on individual molecules or specific pathways and lacked integration across cohorts or systematic functional validation. In contrast, our study constructed an ECMS by integrating multi-cohort machine learning, clinical validation, and functional experiments, enabling a comprehensive assessment of ECMRGs and clarifying the incremental contribution and potential clinical relevance of our work compared with previous studies. This ECM-related prognostic signature may facilitate risk-based prognostic prediction and support clinical decision-making in HNSCC.
In this study, we integrated expression profiles of ECMRGs from the TCGA-HNSC dataset and identified ten genes to develop a novel prognostic model for ECMRGs using Cox and LASSO regression analysis. Through ROC curve analysis and KM survival analysis, the ECMRGs showed the ability to stratify patients to predict outcome. Unfortunately, the C-index is not very satisfactory, but it is also superior to some existing gene signatures and traditional TNM staging methods, and has a certain reference value for the clinical treatment of HNSCC. Given that TCGA-HNSC includes both HPV-positive and HPV-negative tumors, and HPV is a key prognostic factor in HNSCC, we performed HPV-stratified analyses to assess its potential impact (Figure S2). ECMS remained significantly prognostic in the HPV-negative subgroup, while in the HPV-positive subgroup it showed a trend consistent with the overall cohort but did not reach statistical significance. This suggests that the model’s predictive value is largely independent of HPV status, and the limited events and generally favorable prognosis in HPV-positive patients may account for the lack of statistical significance. Furthermore, among the various published functional gene signatures, only a minority have been successfully integrated into clinical practice, and even fewer have undergone comprehensive validation. Additionally, we identified ten published signatures, each comprising various functional gene combinations. Among these signatures, only a handful have been integrated into clinical practice, and even fewer have undergone thorough validation. 37 For further testing of the clinical interpretation of ECMRGs, we conducted another validation based on qRT-PCR results from frozen HNSCC tissues, verifying our prior findings and assessing their feasibility in different centers. Therefore, our signature shows promise as a surrogate for evaluating HNSCC prognosis in clinical settings.
This study utilized stepwise statistical analyses to identify ten key prognostic ECMRGs, including ELANE, SEMA3E, IL22, FGB, IFNE, WNT7A, CCL26, PLOD2, SLPI, and RSPO1, in order to develop a prognostic signature for patients with HNSCC. Previous studies have demonstrated the biological roles of these genes in tumors. ELANE promotes M2 macrophage polarization by suppressing PTEN, consequently facilitating cell proliferation, migration, and invasion in vitro, as well as promoting the growth of lung cancer cells in vivo. 38 Previous studies have indicated that Sema3E plays a role in promoting lung metastasis in vivo. 39 The overexpression of IL-22 can promote tumor metastasis. Mechanistically, IL-22 acts on endothelial cells, inducing endothelial peptidase N to enhance endothelial cell permeability and cancer cell migration. 40 FGB is upregulated in renal cell carcinoma, and its overexpression can rescue the inhibition of renal cell carcinoma proliferation caused by SIRT1 overexpression. This novel SIRT1-STAT3-FGB axis provides a potential target for the treatment of renal cell carcinoma. 41 WNT7A activates FZD7/JAK1/STAT3 signaling pathway, which accelerates proliferation rate and reduces apoptosis of HNSCC cells, 42 consistent with our experimental results. The FOXQ1/NDRG1 axis stimulates STAT6 to increase the production of CCL26, thereby promoting the malignant progression of hepatocellular carcinoma. 43 Targeting PLOD2 to inhibit EGFR phosphorylation activation may benefit clear cell renal cell carcinoma patients by utilizing the PLOD2/EGFR/AKT axis as a target for diagnostic markers and therapeutic interventions. 44 In a mouse model, the overexpression of SLPI in lung carcinoma cells led to a reduction in the number of liver metastases. 45 In colon cancer cells, the collaboration between RSPO1/LGR5 and the TGFβ type II receptor directly activates TGFβ signaling, thereby augmenting TGFβ-mediated growth inhibition and stress-induced apoptosis. 46
Through the integrated analysis of high-throughput data, we found the link between ECMS and immune infiltration. Our study showed that the abundance of CD8 T cells, regulatory T cells, and B cells in low-risk group was higher, and the high-risk group had higher M0 macrophages, resting mast cells, and NK cells. It should be emphasized that the prognostic value of immune cell subsets is highly context-dependent in HNSCC. Although dense infiltration of B cells and CD8 T cells is widely recognized to indicate a favorable prognosis in tumors,47,48 elevated Tregs in the low-risk group do not uniformly predict a favorable outcome across all cancer types and may exert distinct immune regulatory functions in the tumor microenvironment. Similarly, increased NK cells in the high-risk group may represent a compensatory anti-tumor response or impaired functional status rather than a simple protective or detrimental effect, which cannot be fully distinguished by bulk deconvolution analysis. Correspondingly, M0 macrophages and resting mast cells tend to have a poor prognosis for solid tumors,49,50 and our results are consistent with these conclusions. Furthermore, it is important to acknowledge that bulk transcriptome deconvolution cannot capture spatial distribution or functional states of immune cells, and these results should be interpreted as estimations of the immune microenvironment. In addition, KEGG and GO analysis showed that the two groups of DEGs were mainly enriched in immune related pathways, which also revealed the potential relationship between ECMS and tumor immunity.
The combination therapy for HNSCC typically involves concurrent chemoradiotherapy and induction chemotherapy, with cisplatin plus 5-fluorouracil being the most common treatment regimen. 51 Currently, the addition of docetaxel to cisplatin plus 5-fluorouracil has emerged as a revolutionary treatment strategy, capable of improving patient prognosis and preserving organs. 52 Our study findings indicate that patients in the high-risk group exhibit greater sensitivity to cisplatin and docetaxel. Previous clinical study results have shown that for recurrent/metastatic HNSCC patients who have received platinum-based chemotherapy or progressed after chemotherapy, second-line treatment with afatinib significantly prolongs progression-free survival compared to methotrexate. 53 The combination of gefitinib with docetaxel was well-tolerated; however, it did not lead to improved outcomes in patients with HNSCC who had a poor prognosis but were otherwise unselected. 54 In contrast to the former two drugs, patients in the low-risk group benefit more from methotrexate, afatinib, gefitinib, and oxaliplatin.
The ECMS can be replicated with a simple PCR-based test, making it an appealing choice for clinical translation and implementation. While the clinical significance of ECMS in HNSCC holds promise, it’s important to acknowledge some limitations. Firstly, all samples in this study were retrospective, emphasizing the need for future validation of IRLS in a prospective multicenter cohort. Secondly, the clinical pathological parameters and molecular features in public datasets are notably inadequate, potentially obscuring the potential associations between ECMS and certain variables. Thirdly, the roles of some genes within ECMS in HNSCC remain unknown, necessitating further in vivo and in vitro experiments to elucidate their functions. Fourth, it remains unclear whether the prognostic value of the ECMS reflects global ECM biology or is driven primarily by a few key genes. In addition to these limitations, we also recognize that the AUC values of our model are relatively low, and this could be influenced by several factors. Data noise and sample heterogeneity may contribute to less accurate predictions for specific patient subgroups. Additionally, the limited sample size and potential data imbalance may have led to overfitting, impacting the generalizability of the model. Despite these challenges, our model demonstrates superior performance compared to some existing gene signatures and traditional TNM staging, offering clinical value for prognosis prediction. We also acknowledge that the differential expression analysis was performed between tumor and adjacent non-tumor tissues, which may not represent truly normal controls in HNSCC due to field cancerization, chronic inflammation, and stromal alterations. This issue may complicate DEG identification and affect the candidate gene pool. In addition, our immune analysis relied on bulk deconvolution, which cannot capture spatial biology or state-specific immune function, and these findings require further functional validation. Moving forward, we plan to expand the sample size, refine feature selection, and enhance the model’s robustness to improve both its predictive accuracy and clinical applicability.
Conclusion
By integrating bioinformatics, machine learning, and molecular biology, we developed an ECM-related prognostic signature with potential utility for evaluating prognosis and treatment response. This signature may provide additional insight to complement existing clinical variables for risk stratification in HNSCC patients.
Supplemental Material
Supplemental Material - Extracellular Matrix-Related Prognostic Signature for Head and Neck Squamous Cell Carcinoma via Multi-Algorithm Survival Modeling
Supplemental Material for Extracellular Matrix-Related Prognostic Signature for Head and Neck Squamous Cell Carcinoma via Multi-Algorithm Survival Modeling by Wenwen Chen, and Yehai Liu in Biomarker Insights.
Footnotes
Acknowledgments
We extend our sincere appreciation to the publicly accessible TCGA, GEO, and ICGC databases for their valuable resources.
Ethical Considerations
The research involving human participants underwent review and approval by the Ethics Committee of the First Affiliated Hospital of Anhui Medical University (PJ 2022-03-19). All procedures performed in studies involving human participants were in accordance with the ethical standards of the institutional and/or national research committee and with the 1964 Helsinki declaration and its later amendments or comparable ethical standards.
Consent to Participate
Written informed consent was obtained from all individual participants included in the study.
Consent for Publication
All patients included in this study provided written informed consent for the use of their tissue samples and related data in scientific publications.
Author Contributions
W.C. contributed to Data curation, Funding acquisition, Investigation, Methodology, Software, Visualization, and Writing-original draft. Y.L. contributed to Conceptualization, Resources, Supervision, and Writing-review & editing. All authors read and approved the final manuscript.
Funding
The authors disclosed receipt of the following financial support for the research, authorship, and/or publication of this article: This work was supported by the Tongling Medical Science Research Institute Open Project (YKY20260110).
Declaration of Conflicting Interests
The authors declared no potential conflicts of interest with respect to the research, authorship, and/or publication of this article.
Data Availability Statement
The RNA-sequencing data and corresponding clinical information were downloaded from The Cancer Genome Atlas (TCGA) database (https://portal.gdc.cancer.gov/), International Cancer Genome Consortium (ICGC) databases (https://dcc.icgc.org/), Gene Expression Omnibus (GEO) databases (![]() ).
).
Supplemental Material
Supplemental material for this article is available online.
References
Supplementary Material
Please find the following supplemental material available below.
For Open Access articles published under a Creative Commons License, all supplemental material carries the same license as the article it is associated with.
For non-Open Access articles published, all supplemental material carries a non-exclusive license, and permission requests for re-use of supplemental material or any part of supplemental material shall be sent directly to the copyright owner as specified in the copyright notice associated with the article.