
Abstract
This study quantified lead (Pb) and cadmium (Cd) in widely consumed cereals and pulses, such as rice (Oryza sativa), black gram (Vigna mungo), and lentils (Lens culinaris), collected randomly from various local markets in Dhaka, Bangladesh, and assessed human health risks. Carcinogenic Pb and Cd were detected in most samples, with 20-80% containing levels exceeding the maximum limits set by regulatory authorities. Human health risks were assessed through estimated daily intake (EDI), incremental lifetime cancer risk (ILCR), target hazard quotient (THQ), and hazard index (HI). The EDI values for Cd in rice and black gram surpassed the provisional tolerable daily intake (PTDI) limits. The cumulative ILCR values for the majority of samples, excluding small lentils consumed by children, exceeded the safety threshold (ILCR>10-4), suggesting a potential carcinogenic risk from prolonged consumption. Additionally, the THQ for Cd in rice among children was greater than the reference limit (THQ > 1.0), indicating potential non-carcinogenic health risks. The HI for rice exceeded 1.0 in both adults and children, indicating a potential risk of non-carcinogenic health effects associated with regular consumption. These findings may help foster food safety, regulatory compliance, and consumer protection in Bangladesh.
Introduction
Rice and pulses are two vital components of human nutrition, playing a crucial role in ensuring food security, health, and economic development worldwide. 1 Rice, a cereal grain, is a primary carbohydrate source for over half of the global population. Its nutritional value lies in its caloric content and its rich array of essential vitamins and minerals. 2 In addition to being a good source of B-vitamins, iron, zinc, and magnesium, rice is gluten-free, making it suitable for those with gluten-related disorders, such as celiac disease. 3 Pulses, on the other hand, encompass a wide variety of leguminous crops, including lentils, grams, beans, and peas are recognized for their high protein content, making them an invaluable source of essential amino acids, especially for vegetarians and vegans. 4 Pulses are an excellent source of dietary fiber, contributing to improved digestive health and a reduced risk of chronic conditions such as cardiovascular disease and type 2 diabetes.5,6 According to FAO statistical database, worldwide rice and pulses consumption was 520 and 89 million metric tons in 2021/22 crop year. 7 As of ‘Food Outlook-June 2022′ of FAO, Bangladesh is the third largest global rice producer, whereas the country is also ranked third rice-consuming country with 37.3 million metric tons of yearly consumption 8 Both rice and pulses are staple foods in Bangladesh, where the national per capita rice and pulse consumption is 328.9 g and 17.1 g per day, respectively. 9 However, as billions of people consume rice and pulses globally, these grains should be safe and free from contamination to safeguard public health, ensure food security, and maintain consumer confidence.
Worldwide toxic metal contamination in grains, including rice and pulses, holds crucial importance due to its far-reaching implications on public health, agriculture, and the environment.10,11 Some toxic metals, such as Pb and Cd, may naturally exist in the soil.12-15 However, different anthropogenic activities, including industrial processes, mining, smelting, and using contaminated fertilizer, pesticides, and untreated industrial wastewater, cause soil contamination, leading to heavy metal accumulation in plant parts.16-19 Regular consumption of toxic metal-contaminated foods such as rice and pulses may accumulate in tissues and organs, leading to a gradual increase in toxicity.20,21 Toxic metals often have long half-lives, meaning they remain in the body for extended periods. 22 Living cells have no efficient mechanisms to eliminate these toxic substances, so their prolonged retention can disrupt cellular function, impairing body systems. 22 Therefore, different national and international regulatory authorities settled tolerable limits to ensure food safety, minimizing the risk of acute and chronic health issues associated with heavy metal toxicity.
Toxic metal contamination in food grains represents a major global public health issue. Dietary intake is considered the principal pathway of exposure, contributing to more than 90% of total human toxic metal uptake. 23 As rice and pulses are a staple food in many countries, toxic metal contamination in these grains is a serious food safety concern, particularly in developing countries. 12 Prolonged exposure to carcinogenic metals has been linked to a range of adverse health outcomes, including mutagenic and teratogenic effects, neurological impairments, renal dysfunction, reproductive issues, skeletal disorders, cardiovascular complications, and elevated risks of specific cancers.24,25 Pb poisoning in Michigan, USA, 26 severe mercury pollution in Minamata, Japan, 27 Cd poisoning of rice in Wanshan, China 28 are a few examples of severe food safety incidents due to toxic metal contamination. The United States Environmental Protection Agency (USEPA) has established health risk assessment models to estimate potential risks arising from heavy metal exposure through dietary intake. 29 Nonetheless, mitigating the health risks associated with toxic metal contamination in staple foods such as rice and pulses necessitates a comprehensive strategy centered on routine monitoring and surveillance.
Several studies have documented the presence of toxic metal contamination in rice and pulses across various countries.16,21,30-34 In Bangladesh, limited studies have investigated toxic metal contamination in rice and pulses.35-37 However, to the best of our knowledge, no published research has reported toxic metal levels in rice and pulses collected from Dhaka, the capital city of Bangladesh and one of the most densely populated cities in the world. As the country has faced numerous challenges related to food safety and a lack of public awareness of food safety issues, it is important to monitor toxic metals in mass-consumed food items like rice and pulses. Hence, this study aims to evaluate human health risks by quantifying toxic metal concentrations in milled rice and pulses (black gram, small lentils, and large lentils) sourced from various local markets in Dhaka, Bangladesh.
Materials and Methods
Collection of Rice and Pulse Samples
The consumption of rice and pulses in Bangladesh is deeply ingrained in the country’s culinary traditions and cultural practices. As staple foods, people consume them daily, thus available in all local markets. Dhaka has numerous local markets where residents can conveniently purchase their daily groceries. Generally, many vendors throughout the country supply food to such local markets across the city. In this study, milled rice and three types of pulses, such as black gram, small lentils, and large lentils, were randomly collected from five major local wet markets in Dhaka, Bangladesh: Kawran Bazar, Camp Bazar, Taltola Bazar, Kochukhet Bazar, and Agargaon Bazar. In this random collection method, samples were purchased from different local vendors within each selected market without prior selection of brand or source, reflecting typical consumer purchasing behavior. The markets selected are major distribution hubs in Dhaka, supplied by diverse production regions, thereby capturing variability in origin and brands. From each market, three samples of each food item were collected, yielding a total of 60 samples (15 per item). The selected markets represent key urban distribution hubs and ensure broad coverage of consumer purchasing sources. The sample size was chosen to provide a representative cross-section of commonly consumed rice and pulse varieties while maintaining analytical feasibility and cost-effectiveness for toxic metal analysis. It should be noted that each sample was analyzed three times, and the mean concentrations were used for data analysis. The collected samples were individually sealed in polythene bags and transported to the Agro-Environmental Laboratory at Sher-e-Bangla Agricultural University (SAU) in Dhaka, Bangladesh. In the process of sample transport and storage, we ensured that the samples did not make contact with metal instruments to avoid cross-contamination.
Sample Preparation
Initially, each grain sample was manually mixed to ensure homogeneity. The fresh weight was recorded, and the samples were subsequently oven-dried at 65 °C until a constant weight was obtained. The dried materials were then ground using a Wiley Hammer Mill, sieved through a 40-mesh screen, thoroughly mixed, transferred to plastic vials, and stored in a desiccator before analysis.
Chemicals
Standards and chemical reagents for Pb and Cd were procured from Merck (Darmstadt, Germany) via Sigma Aldrich and supplied by Kuri & Company (Pvt) Limited, Dhaka, Bangladesh. All other chemicals and reagents, including nitric acid, perchloric acid, hydrochloric acid, lead nitrate, zinc nitrate, cadmium nitrate, and chromium oxide, were of analytical grade with a purity of 99.5%.
Sample Digestion
A 1 g portion of the finely ground sample was placed into a digestion tube, followed by the addition of 10 mL of a diacid mixture composed of nitric acid and perchloric acid in a 2:1 ratio. The mixture was allowed to stand for 20 min before being transferred to a digestion block, where it was initially heated at 100 °C. The temperature was then progressively increased to between 180 °C and 200 °C, continuing until the digest turned pale or whitish in appearance, indicating readiness for heavy metal analysis.17,20 Once digestion was complete, the solution was cooled, diluted with deionized water in a 100 mL volumetric flask, and filtered using Whatman No. 42 filter paper. Any remaining residues on the filter were minimal. The final filtrate was transferred into a plastic container and stored in a refrigerator to prevent evaporation until analysis.
Analysis of Toxic Metals
The concentrations of Pb and Cd in the acid-digested samples were determined using an Analytik Jena novAA 400P Atomic Absorption Spectrophotometer (Germany), equipped with a graphite furnace and an autosampler, following standard analytical protocols. 20 Calibration curves were prepared using standard solutions of known concentrations. Background correction was performed using a deuterium lamp. All measurements were carried out using graphite furnace atomization to ensure high sensitivity for trace-level detection. Each sample was analyzed in triplicate, and the mean values were used for data analysis. Even though the samples were oven-dried prior to analysis, the final concentrations were expressed on a fresh weight (fw) basis to reflect actual consumption patterns and to allow comparison with regulatory limits. Conversion from dry weight to fresh weight was performed using each sample’s measured moisture content. However, the obtained concentrations were compared with the maximum limits established by Codex Alimentarius under FAO/WHO guidelines.
Quality Assurance and Method Validation
To ensure the reliability of the analytical results, rigorous quality assurance measures were implemented. Careful sample handling protocols were followed to minimize the risk of cross-contamination, and all glassware was meticulously cleaned. Analytical-grade reagents and deionized water were used throughout the experimental procedures. Method validation was conducted by assessing parameters such as linearity, coefficient of determination (R 2 ), limit of detection (LOD), limit of quantification (LOQ), accuracy, and precision. Calibration curves for Pb and Cd were constructed using standard solutions with concentrations ranging from 0.0 to 1.0 mg/kg in deionized water, yielding strong linearity (R 2 = 0.995 to 0.998). Procedural blanks were included throughout the digestion and analysis process to monitor potential contamination, and blank values were found to be negligible. Quality control was further assessed through replicate analysis and spike-recovery tests. To meet internal quality control (IQC) standards, each analysis included a blank and a spiked sample, where a known concentration of the target metal (0.6 mg/kg) was added to ground samples. Identical procedures were applied to both spiked and unspiked samples, using deionized water throughout. Recovery rates ranged from 94% to 105%, with relative standard deviations (RSD) not exceeding 10%. The LOD values were determined as 0.011 mg/kg for Pb and 0.016 mg/kg for Cd, while the corresponding LOQ values were 0.039 mg/kg and 0.055 mg/kg, respectively.
Calculation of the Average Pollution Index
The average pollution index (API) is a quantitative measure used to assess the cumulative pollution load from multiple toxic metals. It is considered a dependable indicator for evaluating toxic metal contamination across various sample types. In this study, the API (Equation. 1) for rice and pulse samples was determined by calculating the sum of the individual pollution indices (PI) for each metal and dividing it by the total number of trace metals analyzed (n).
38


Csample is the toxic metal concentration in the sample (mg/kg-fw), CFAO/WHO-standard is the regulatory limit set by Codex Alimentarius. 39 An API value greater than 1.0 signifies substantial contamination, suggesting that the sample may pose potential health risks. 17
Estimated Daily Intake (EDI) of Toxic Metals
Toxic metals enter the human body through various exposure routes and may accumulate over time, posing health risks. The EDI is used to evaluate such risks and can be compared with the PTDI set by regulatory authorities. This study used the standard model by USEPA (USEPA, 2011) for EDI calculation (Equation. 2).

Health Risk Assessment
The average concentrations of Pb and Cd in each sample were utilized to assess human health risks. Both carcinogenic and non-carcinogenic effects depend on factors such as metal type, concentration, exposure duration, and individual susceptibility. 40
Carcinogenic Risk
The ILCR model (Equation. 3) estimates the likelihood of developing cancer due to long-term consumption of grains contaminated with carcinogenic metals.
41

Here, CDI represents the chronic daily intake (mg/kg body weight/day), and CSF denotes the cancer slope factor (mg/kg/day). The CSF values for Pb (0.0085 mg/kg/day) and Cd (6.1 mg/kg/day) were adopted from previously published studies 42 for comparative purposes. However, it should be noted that standardized oral CSF values for Pb are not established by USEPA, and Cd toxicity varies depending on its chemical form and exposure pathway.42,43
CDI values for each toxic metal were calculated using the following model:

Here, EDI is the estimated daily intake (mg/kg/day), EF is the exposure frequency (365 days/year), TED is the total exposure duration (70 years), and AT is the average exposure time (365 × 70 = 25,550 days). The total carcinogenic risk for each sample was determined by summing the ILCR values (ΣILCR) for all toxic metals.

Here, i denotes the number of toxic metals analyzed in the sample. An ILCR value below 10-6 indicates negligible risk, while a value exceeding 10-4 is considered above the acceptable risk threshold. 44
Non-Carcinogenic Risk
The THQ (Equation. 6) was used to evaluate the non-carcinogenic health risk associated with individual toxic metals.45,46

Here, CDI represents the chronic daily intake (mg/kg body weight/day), and RfD refers to the oral reference dose. The RfD values applied in this study were 0.0035 mg/kg/day for Pb and 0.003 mg/kg/day for Cd.17,47
The non-carcinogenic risk associated with grain consumption was estimated using the chronic HI (Equation. 7), following the model proposed by USEPA:

Generally, an HI value below 1 suggests no significant health risk, whereas a value above 1 indicates potential non-carcinogenic effects from consuming the contaminated grains.48,49
All analyses in this study were performed using Microsoft Excel 2021.
Results and Discussion
Toxic Metal Concentration in Rice and Pulses
Heavy Metal Concentration of Rice and Pulses in Bangladesh
ML= Maximum limit set by Codex Alimentarius (1995), LOD= Limit of detection.
*Decimal number in parenthesis indicates ML set by Bangladesh Food Safety Authority.
Pb contamination in common foods can have significant health effects, particularly when ingested over a long period or in exceeded amounts from the recommended safe level. 50 Among the studied samples, Pb was detected in rice, black gram, and large lentils, while no detectable Pb was found in small lentil samples. In terms of mean concentration, all samples detected with toxic metals, exceeded the international (FAO/WHO) and Bangladesh Food Safety Authority (BFSA)’s ML. 51 Overall, 20% rice, 40% black gram, and 60% large lentil samples exceeded the BFSA’s ML of Pb. Since compared to Codex Alimentarius, BFSA (national authority) set higher ML for Pb in pulses and cereals, hence these results are compared with BFSA’s ML. The mean concentration of Pb was found to be highest in large lentils (0.38 ± 0.36 mg/kg-fw), followed by rice (0.33 ±0.68 mg/kg-fw) and black gram (0.31 ± 0.43 mg/kg-fw). Reference 37 reported 2.60-15.89 and 0.582-0.863 mg/kg-dry weight (dw) of Pb in paddy rice and red split lentils collected from Samta village, Jessore district of Bangladesh. Another study has reported 0.07-1.3, 0.08-1.6, and 0.14-1.6 mg/kg-dw in rice, black gram, and lentils, respectively, collected from the Bogura district of the country. 36 Pb content in cereal grains above the recommended safe level of consumption is also detected in other countries like China 52 Iran,21,53 and Pakistan. 54 The detected Pb and Cd in rice and pulses may be associated with potential sources such as soil composition, atmospheric deposition, irrigation with contaminated wastewater, and the use of agrochemicals, as reported in previous studies.55,56
Plants absorb Cd from the soil, accumulating in their tissues, resulting in carcinogenic human health risks through dietary intake. 57 The mean Cd concentrations in the analyzed samples ranged from 0.36 to 0.60 mg/kg. The highest level was detected in rice (0.60 ± 0.51 mg/kg), while the lowest was observed in small lentils (0.36 ± 0.37 mg/kg). A considerably high amount of Cd was also detected in black grams (0.55 ± 0.36 mg/kg-fw) and large lentils (0.55 ± 0.38 mg/kg-fw). All studied samples except a few small lentils had higher mean Cd content than ML. Overall, about 60% rice and small lentils, 80% black grams, and 40% large lentils exceeded the Codex ML for Cd (0.1 mg/kg-fw for pulses and 0.4 mg/kg-fw for polished rice). However, when compared to the national regulatory limit, the percentage of rice samples exceeding the ML would be significantly higher since the BFSA has set the ML for Cd in rice at 0.1 mg/kg-fw. Previous study reported 0.008-0.042 and 0.003-0.032 mg/kg-dw Cd in rice and pulses collected from the Jessore district of Bangladesh. 37 Reference 36 reported 0.001-0.66 mg/kg-dw Cd in different cereals and pulses, including rice, wheat, lentils, and black grams collected from the country’s northern district. A wide range of Cd content (0.005-0.692 mg/kg-dw) was detected in cereal grains, whereas it was reported that toxic metal concentration in grains is significantly influenced by soil pH. 33 A recent study reported that Cd content in rice substantially varies with the geographical variation of harvested area. 35 Cd is a naturally occurring toxic metal that can accumulate in plant tissues through soil-plant transfer pathways, with its levels often elevated due to anthropogenic activities such as mining, industrial processes, and the application of phosphate fertilizers and pesticides.58,59
Pearson’s correlation coefficient analysis was conducted to assess the relationships between the analyzed metals and to infer their potential sources in commonly consumed foods in Bangladesh. A positive correlation denotes comparable or regular sources as opposed to a negative correlation, which indicates different or uncommon sources of certain toxic metals in foods. 60 Pb and Cd exhibited a strong positive correlation, suggesting a common source of contamination in the food samples. Plants from contaminated soil and water may take up these metals. Due to their natural occurrence, crops like rice and pulses readily absorb Pb and Cd from the soil as well as from the application of Pb and Cd-containing fertilizers, waste from industrial discharges,61,62 and irrigation of toxic metal contaminated wastewater via the water-soil-crop pathway. 63 These metals can go up the food chain when contaminated crops are consumed by humans.
Pollution Index
The pollution index evaluates toxic metal contamination across samples. The single-factor pollution index (PI) reflects the concentration of a specific metal relative to its ML. As shown in Figure 1A, the PI values for Pb in rice, black gram, and small lentils exceeded the threshold (PI > 1.0), indicating potential health risks. In addition to Pb, PI value of Cd was >1.0 in rice, black gram, and small lentil samples. However, PI values of both toxic metals in small lentils was <1.0. Out of four types of samples, only black gram exceeded the threshold value of average pollution index (PIavg>1.0) (Figure 1B). PIavg values of rice, small and large lentils (PIavg<1.0) imply no potential health hazards from these samples. (A) Single-factor pollution index (PI). (B) Average pollution index of heavy metals found in rice and pulses
Daily Intake of Toxic Metals
The EDI is a key metric for assessing exposure relative to safety thresholds. In this study, EDI values were compared with the PTDI set by the Joint FAO/WHO Expert Committee on Food Additives (JECFA) to evaluate compliance
64
(Figure 2). It should be noted that the Joint FAO/WHO Expert Committee on Food Additives (JECFA) previously established a provisional tolerable weekly intake (PTWI) for Pb of 0.025 mg/kg body weight (equivalent to 0.0035 mg/kg body weight/day). However, this PTWI was withdrawn in 2011, as evidence indicated that no safe exposure level for Pb could be established. Despite this, in the absence of an updated tolerable intake value, the previously derived equivalent value (0.0035 mg/kg body weight/day) is still widely used in the literature for comparative risk assessment purposes and was therefore adopted in this study. For Cd, the provisional tolerable monthly intake is 25 µg/kg body weight/month, which is approximately equivalent to a PTDI of 0.00083 mg/kg body weight/day. In this study, the EDI values of Cd in rice samples for both adults and children exceeded the PTDI, with higher exposure observed in children. In contrast, the EDI values of Pb in all samples remained below the referenced threshold. Estimated daily intake (EDI) and FAO/WHO provisional tolerable daily intake values for Pb and Cd of rice and pulses
The EDI of Pb was in the range of 8.8×10-05 - 1.8×10-03 and 2.0×10-04 - 3.4×10-03 mg/kg/day for adults and children consumers, respectively. EDI of Pb in rice is very close to the PTDI (Figure 2), implying that control measures should be taken to reduce health risks from Pb toxicity. The EDI of Cd ranges between 1.6×10-03 - 3.0×10-03 and 3.0×10-04 - 5.0×10-03 mg/kg/day for adults and children, respectively. While the EDI of Cd in rice crossed the PTDI value, other samples are very close to PTDI values indicating potential food safety concerns for both consumer groups.
Human Health Risk Assessment
Carcinogenic Risk
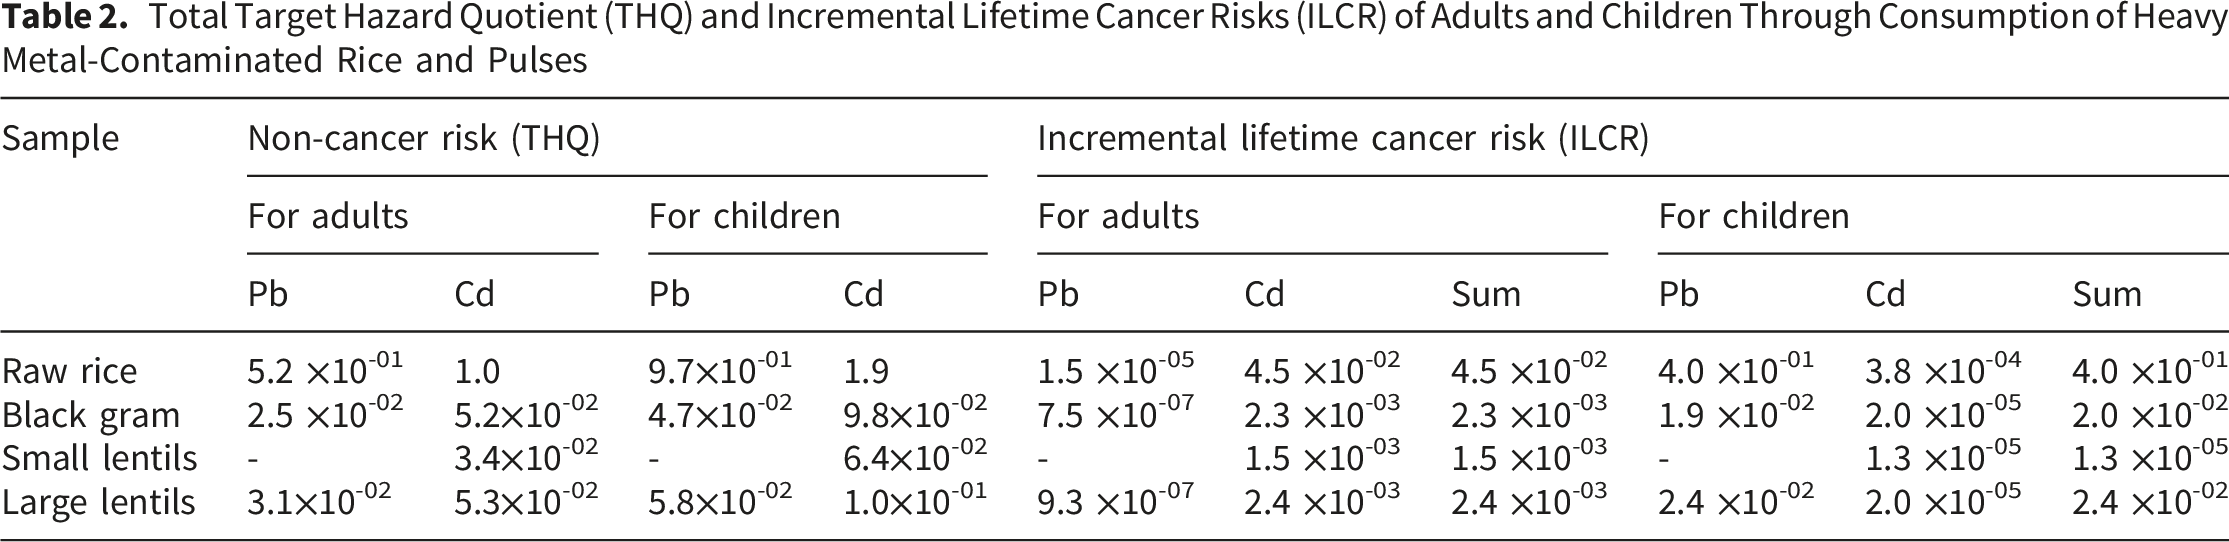
Total Target Hazard Quotient (THQ) and Incremental Lifetime Cancer Risks (ILCR) of Adults and Children Through Consumption of Heavy Metal-Contaminated Rice and Pulses
Non-Carcinogenic Risk
Non-carcinogenic risks from toxic metals refer to the potential health effects caused by exposure to these substances, excluding their ability to cause cancer. The non-carcinogenic health risk from consuming toxic metal-contaminated rice, gram, and pulses was assessed using THQ, with values for Pb and Cd in adults and children summarized in Table 2. Cd in rice posed a notable risk for children (THQ = 1.9) and approached the critical threshold for adults (THQ = 1.0), while Pb levels remained within safe limits (THQ < 1.0) for all samples. Cumulative non-cancer risks, expressed as the hazard index (HI = ΣTHQ) and shown in Figure 3, exceeded the benchmark value (HI > 1) for both adults (1.7) and children (3.1), indicating potential long-term health effects from regular rice consumption. However, there are no potential non-carcinogenic risks from regular consumption of black gram and lentils as their HI values were lower than the benchmark. These findings highlight the need for regular monitoring and control measures to mitigate long-term non-carcinogenic risks associated with rice consumption. Non-cancer risk of heavy metals through consumption of contaminated foods
Conclusion
This study evaluated human health risks by quantifying Pb and Cd levels in rice, black gram, small lentils, and large lentils from local markets in Dhaka, Bangladesh. Pb and Cd were detected in most samples, with mean concentrations exceeding regulatory limits in all but small lentils. The single-factor pollution index indicated elevated Pb and Cd levels in all samples except small lentils. Although the average pollution index for rice was below 1, indicating relatively lower contamination compared to regulatory limits, the high health hazard indicates a substantially higher consumption rate of rice, which increases overall exposure. Cd’s EDI in rice surpassed the PTDI for both adults and children. ΣILCR values for Pb and Cd exceeded the risk threshold (ΣILCR> 10-4) across all samples, indicating carcinogenic risk. Cd’s THQ and the HI (ΣTHQ > 1.0) in rice also suggested non-carcinogenic risks for both groups. These findings highlight the need for regular monitoring of toxic metals in staple cereals and pulses by the BFSA, alongside public awareness campaigns to inform consumers about potential dietary risks. However, the study has several limitations, including a small sample size, a limited number of markets surveyed, and the lack of analysis regarding the effects of cooking on metal concentrations. Future research addressing these limitations is needed to better assess real-world exposure.
Footnotes
Author Contributions
Funding
The authors received no financial support for the research, authorship, and/or publication of this article.
Declaration of Conflicting Interests
The authors declared no potential conflicts of interest with respect to the research, authorship, and/or publication of this article.
Data Availability Statement
The test data is restricted to the relevant personnel of the project and is not allowed to be disclosed to the public but are available from the corresponding author on reasonable request.
Disclosure Statement
All authors certify that they have no affiliations with or involvement in any organization or entity with any financial interest or non-financial interest in the subject matter or materials discussed in this manuscript. Hence, the authors report there are no competing interests to declare.