
Abstract
This study shows the importance of landscape scene composition in relation to aesthetic ratings used in preference research where static and dynamic presentation methods substitute landscape onsite evaluation. We aimed to evaluate whether the method of presenting a landscape scene influenced aesthetic ratings and whether these potential differences in ratings were affected by the composition of the static presentation. Using a questionnaire for rating the same scenes of agricultural landscapes presented both in photographs and in videos, it was determined that the presentation method used significantly affected ratings. Respondents (N = 145, age 20-25 years, students) rated scenes presented in photographs higher than videos. Concerning the effect of composition, well-composed photographs had higher mean ratings than poorly composed photographs. Moreover, the difference in ratings between static and dynamic presentation methods determined for well-composed scenes was larger than that for poorly composed scenes, always in favor of photographs. The results indicate that preference ratings can be influenced both by the medium and by composition. This is a crucial aspect for environmental assessments using a visual preference approach as part of planning and management strategies, and it should always be taken into account.
Introduction
Visual experience is of utmost importance for perception and for the corresponding aesthetic response. Human evolution has led to the preeminence of sight as the main sense used in perceiving the environment (Bell, 1999).
In physiological terms, visual perception is the ability of an organism to sense and evaluate stimuli so as to acquire information from its surroundings. The human eye is the organ that provides visual experience. It enables humans to recognize the size, distance, orientation, and color of an observed stimulus using light reflected or emitted by the stimulus (Fagura, 2008). Refraction of light inside the optical system of the eye projects an image of the perceived stimulus onto the focal point of the retina, thereby creating a retinal image. The retinal image contains all input data needed by the observer to create a perception of the visualized scene. In contrast to reality, however, this image is always only two-dimensional and lacks depth. The third dimension is reconstructed from the two-dimensional image using a number of clues such as movement, perspective, gradient, overlaps, and height (Šikl, 2013; Stamps, 2012).
Human Perception of Static and Dynamic Environments
Perception of the environment is usually based on the fact that the surrounding world is constantly changing. The human brain has also evolved to be more sensitive to change than to a stable state (see Gibson’s ecological psychology; Gibson, 1979). This is closely connected with human innate perception of safety or threat, as explained by prospect-refuge theory (Appleton, 1975) or by the permeability theory of environment perception (Stamps, 2005, 2010a). Moreover, movement brings new types of clues to the human visual system for creating three-dimensional perceptions. Movements of observed objects cause changes to their position on the retina, and enable us to form a more detailed idea of their position within the scene, and of their distance (Bell, 1999). The brain is attuned to detecting change; change attracts its attention and we can even state that the brain “thinks” about the world in terms of change (Šikl, 2013; Gibson, 1979). An example can be seen in information processing theory, presented by Kaplan and Kaplan (1989), who explore the human ability to acquire information from the external environment and work with four predictors of visual preference: complexity, coherence, legibility, and mystery. In terms of perceiving dynamic and static scenes, the most important predictors are legibility and mystery. The legibility of an environment increases the preference for dynamic simulations relating to interpretations, structuring, and readability of space. These factors are supported more by a dynamic scene than by a static scene. In contrast, mystery evokes positive ratings for static scenes, as the unseen parts of dynamic scenes are gradually revealed by the movement of the image, thereby decreasing the effect of mystery on the observer (see the concept of transition in Gibson, 1979).
This theoretical context of human perception implies that if movement is required for observation, then an environment should be simulated as dynamic rather than static. However, the results of research carried out on the types of simulations suggest that the issue is more complex than it might seem at first sight.
Perception Research on Static and Dynamic Simulations of an Environment
Some authors have shown that the presentation method considerably affects the appraisal of a perceived scene (e.g., Gibson, 1979; Hetherington, Daniel, & Brown, 1993; Meitner, 2004; Tahvanainen, Tyrvainen, Ihalainen, Vuorela, & Kolehmainen, 2001). Fundamental research investigations on the character of the media selected for environment simulation have been performed by Stamps (2000, 2007, 2009, 2010b, 2016), Meitner (2004), Heft and Nasar (2000), and by Vining and Orland (1989).
Most studies on perception using simulations of an environment have been based on the use of static representation techniques (Stamps, 2010b), these most frequently being photographs (e.g., Arriaza, Canas-Ortega, Canas-Madueno, & Ruiz-Aviles, 2004; Dupont, Antrop, & Van Eetvelde, 2015; Kalivoda, Vojar, Skřivanova, & Zahradnik, 2014; Schüpbach, Junge, Lindemann-Matthies, & Walter, 2016; Svobodova, Sklenicka, Molnarova, & Salek, 2012). The use of photographs to simulate an environment is supported by many authors, who have shown that there is a high positive correlation between ratings of landscape photographs and ratings of the same landscape on-site (e.g., F. J. Palmer & Hoffman, 2001; Shuttleworth, 1980; Stamps, 1993, 2000). In addition, as stated by Heft and Nasar (2000), static presentations correspond more strongly “with the long-held view that perception is based on a static image projected on the essentially two-dimensional surface that is the retina of the eye” (p. 302).
In contrast, a number of authors have objected that the real environment is characterized by dynamic rather than static qualities, and that therefore these qualities should also be presented when conducting sociological perception research (Gibson, 1979; Heft & Nasar, 2000; Hetherington et al., 1993; Thiel, 1997). However, empirical research involving dynamic representation of the environment has been very limited in comparison with research based on static representation (Brown & Daniel, 1991; Feimer, 1984; Hetherington et al., 1993; Huang, 2009; Zacharias, 2006).
As regards the validity of various simulation media, Stamps (2010b) compared static, dynamic and onsite participant evaluations, but did not explore any statistical difference between these types of simulations. Furthermore, according to Stamps (2016) “both static color and dynamic color simulations were quite valid vis-à-vis on-site responses and were both equally valid vis-à-vis each other, so the choice of static or dynamic media is a question of efficiency rather than validity” (p. 15). Similarly, Vining and Orland (1989) compared static and dynamic representations of a residential landscape and found considerable agreement between these two different kinds of representational media. Nasar (2008) and Rohrmann, Palmer, and Bishop (2000) also indicated that photographs and videos have the same realistic value. In contrast, Heft and Nasar (2000) evaluated the perception of photographs as distinct from the perception of videos. According to their findings, higher preference ratings were given to static displays, while dynamic displays had a more robust effect on preference ratings in relation to epistemic variables. Stamps (2016) pointed out that “for the medium range future, it seems that static simulations might be more efficient than dynamic simulations” (p. 5).
Considerable attention has been paid to research on simulations of real environments. Static simulations are frequently used and are found to be efficient in perception research. However, the effect of the composition of static presentations on perception and visual preferences has been neglected. However, Svobodova, Sklenicka, Molnarova, and Vojar (2014) and Leyssen, Linsen, Sammartino, and Palmer (2012) determined that image composition had a significant influence on aesthetic ratings.
Image Composition
The composition of an image concerns the arrangement and the character of the elements within the displayed scene. The sense of composition is part of the human visual perception process, and is necessary for analyzing information from a visual scene (Gowlett, 2011). To attract the attention of observers, rules of composition have been used in art since the times of the ancient Greeks (Green, 1995). These include mainly the golden section, the rule of thirds, and horizon placement (Bertamini, Bennet, & Bode, 2011; Kent, 1995; Svobodova et al., 2014). Other important considerations for composition include proportions, geometry, contrast, symmetry, colorfulness, and texture (see, e.g., Canas, Ayuga, & Ayuga, 2009; De la Fuente de Val, Atauri, & de Lucio 2006; Serpa & Muhar, 1996). Significant effects from the rules of composition on positive perceptions of static scenes have been shown in studies such as those by Hagerhall, Purcell, and Taylor (2004), Leyssen et al. (2012), McManus, Cook, and Hunt (2010), Svobodova et al. (2014), and Weber (1931), who determined that well-composed images receive higher ratings in terms of visual preferences than do poorly-composed images (i.e., those whose elements are not arranged according to the rules of composition).
It is necessary here to emphasize the different position of static and dynamic scenes in terms of composition. Static scenes (e.g., photographs) can be proportionally altered in their composition so as to be, in general, more aesthetically beautiful. In contrast, it is very much more difficult to arrange the composition of dynamic scenes (e.g., videos), or to alter their composition in order to affect the resulting attractiveness. Precisely this different compositional arrangement of dynamic and static scenes may be considerably reflected in the method of presenting perceived scenes as applied in existing perception research. Although McManus et al. (2010) and Svobodova et al. (2014) have shown the importance of the compositional arrangement of static presentations within perception research, no-one has yet studied the composition of the image as a factor potentially affecting differing perceptions of static and dynamic simulated media.
The question thus arises: Does image composition, as an essential characteristic of every photograph, not determine that aesthetic ratings derived from the use of static methods of simulating landscape scenes will differ from the aesthetic ratings ensuing from the use of dynamic methods?
Aims and Objectives
The present study aims to evaluate whether the method of presenting a landscape scene has a significant effect on aesthetic ratings and, mainly, to find out whether potential differences in ratings for static versus dynamic presentations are affected by the composition of the static presentation. Additionally, the study includes the following objectives: (a) determine whether landscape appraisal is affected by presentation method (photo vs. video), and whether the mean assessment of identical landscapes differs according to presentation method, (b) determine whether ratings of well-composed and poorly composed photographs differ, and (c) compare the mean ratings for well-composed and poorly-composed photographs with ratings for videos.
Method
Study Area, Photographs, and Videos
The study area is located in the Trenčin and Žilina regions in northern Slovakia, near the borders with the Czech Republic and Poland (see Figure 1). Twenty-seven different locations were selected in these two regions, based on Corine Land Cover 2006 (European Environment Agency, 2012). All 27 study locations were limited to land cover class arable land and permanent crops, that is, the actual most frequent land cover type in Slovakia after land use changes connected with the political situation following World War II, especially agricultural intensification (Druga & Falťan, 2014; Druga, Falťan, & Herichová, 2015). We suggested that, because of the ordinariness of the landscapes and because of the similarity in key landscape characteristics, respondents’ assessments would avoid undesirable influences from other landscape types. Our aim was to avoid the significant effect of different landscape types and characters on aesthetic ratings for landscape simulations that has been indicated by Vining and Orland (1989) and by Wang, Zhao, and Liu (2016). In addition, as recommended by Dupont, Antrop, and Van Eetvelde (2013), the selection of study localities was strictly focused on open agricultural landscapes, in order to avoid effects of the degree of openness on the observation pattern of the landscapes.

Study area in northern Slovakia with locations marked where landscape scenes were captured.
In June and July 2012, 65 photographs were taken and 65 videos were made at study locations (see Figure 1). The videos were shot so as to capture the same scenes as the photographs had portrayed. They were always filmed from left to right to conform with cerebral lateralization and aesthetic preference biases (see Friedrich, Harms, & Elias, 2014). All photographs and videos were taken in similar weather conditions in the summer season, in order to avoid effects of vegetation transparency that would occur if the photographs were taken in different seasons (see Junge, Schüpbach, Walter, Schmid, & Lidenmann-Matthies, 2015; Misgav, 2000). An Olympus X-940 camera with a focal length of 37 mm was used to capture the photographs and videos. The camera was supported by a tripod always at a height of 170 cm, which is the mean adult eye level as guided by Tahvanainen et al. (2001). The photographs and videos were captured from footpaths and roads which are widely used for observing the landscape. The arrangement of landscape attributes according to the rules of composition (the rule of thirds and horizon placement) was respected when taking the photographs. Half of the shots were intentionally taken with regard to the compositional arrangement of elements according to lines dividing the scene into thirds. Elements were placed at intersections of the lines and on the lines; the horizon was placed two-thirds of the way up the shot—on the upper line (Bertamini et al., 2011; Pihan, 2008). These rules of composition were selected on the basis of the findings of Leyssen et al. (2012) and Svobodova et al. (2014).
From all 65 photographs and 65 videos, 20 photographs (10 well-composed and 10 poorly composed) and 20 videos of the same scenes were selected on the basis of their technical quality. Subsequently, using random sampling, 10 photographs (5 well-composed and 5 poorly composed) and 10 corresponding videos were selected, always with a photograph and a video of the same landscape (random sampling selection was guided by Stamps, 2016; see Figure 2). Using Windows Live Movie Maker, the videos were cut into 5-second clips, such that the displayed scenes precisely matched those in the photographs. The photographs were not altered.
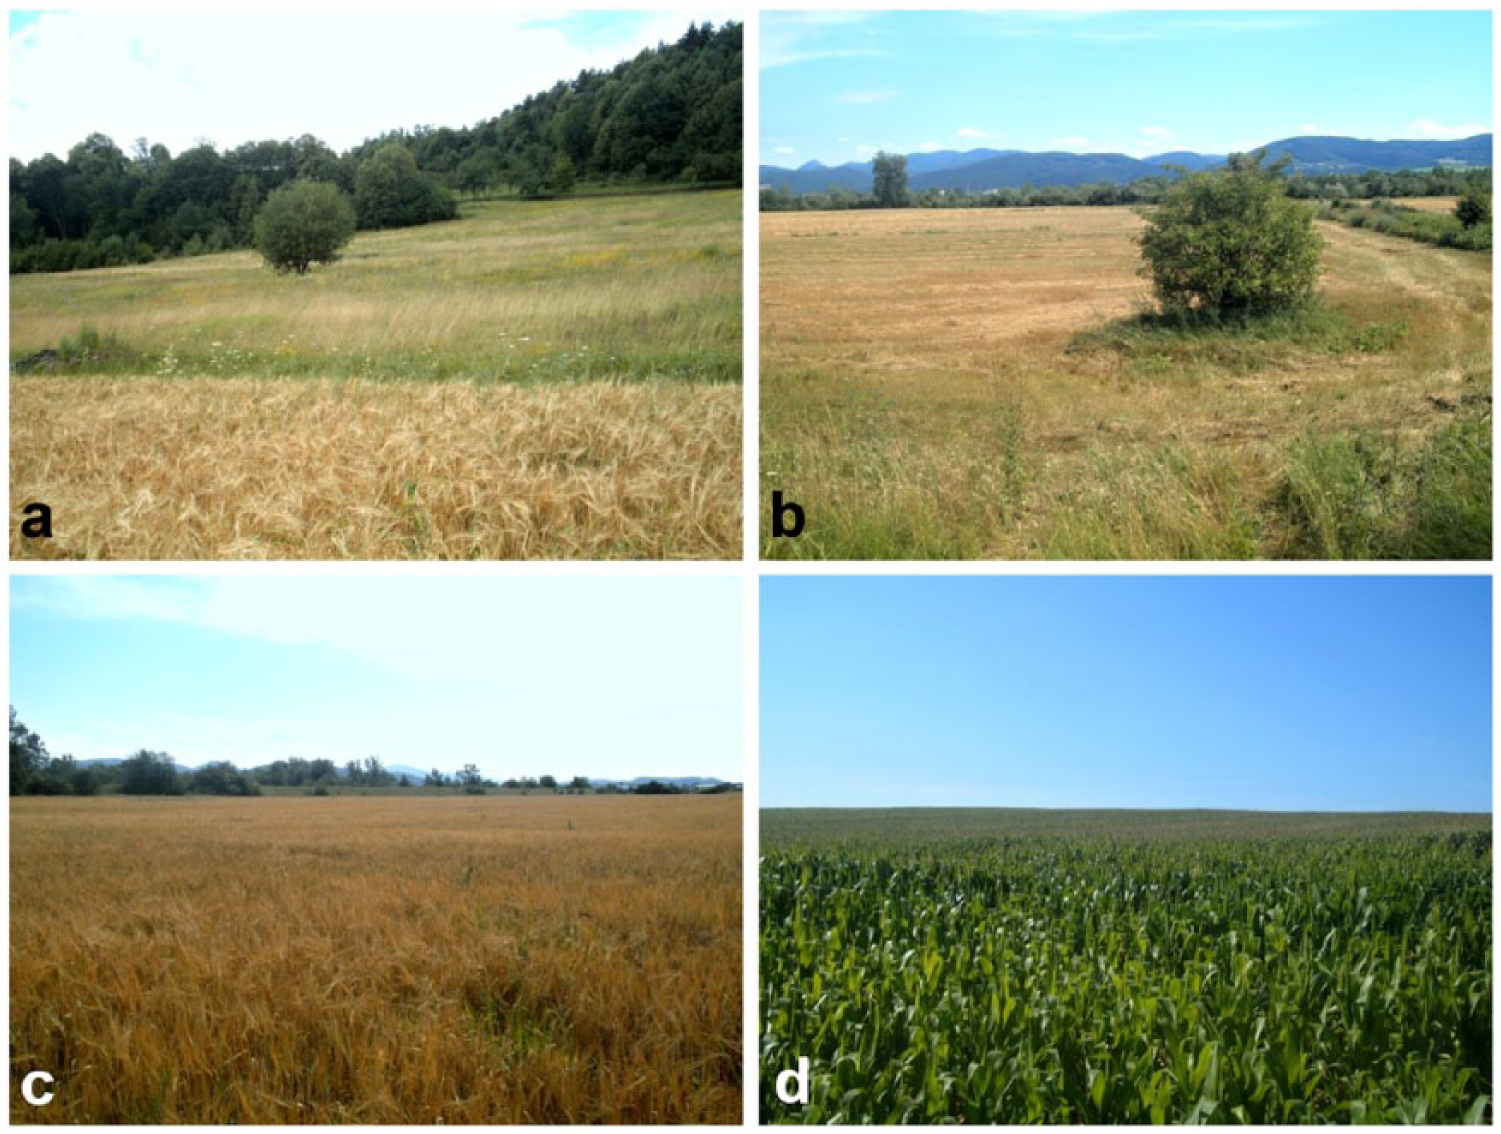
Selected photographs presented to respondents. Photographs a and b are well composed (i.e., arranged according to the rule of thirds), while photographs c and d are poorly composed. Photograph a received the highest ratings and also had the largest difference in ratings compared with the video. In contrast, the landscape scene in photograph c received the second lowest rating among the presented scenes. Only the landscape scene in photograph d received higher ratings as a video than as a photograph. However, the difference in ratings was very small.
Visual Preference Ratings
A quantitative survey was conducted to determine visual preferences for photographs and videos of open agricultural landscapes. A set of 10 photographs and 10 videos was shown to a total of 145 university students aged 20 to 25 years. The selection of a homogeneous sample of student respondents was guided by the investigation of Zube (1974) who found that there are no differences between the responses of different groups of respondents, and by other studies on the perception of landscape simulations that similarly involved only student participants (e.g., Heft & Nasar, 2000; Hetherington et al., 1993; Stamps, 2010a; Vining & Orland, 1989). Although the homogeneous sample of respondents does not represent the opinions of the whole population, the homogeneous structure helps to demonstrate differences between individuals and to show preferential trends.
Respondents received a questionnaire that checked their name and asked them to evaluate the photographs/videos according to the order in which they had been presented. All instructions on how to fill in the questionnaire were given to the respondents before they rated the photographs/videos verbally. The respondents were also told not to rate such attributes as the colorfulness and the quality of the photograph/video, but to express primarily the aesthetic judgement evoked in them by the displayed scene. Respondents rated each photograph/video on a scale of 1 to 10 based on their aesthetic preferences (1 = very low scenic beauty, 10 = very high scenic beauty). The 10-point rating scale was selected with regard to Preston and Colman (2000) who recommend using such a scale in sociological surveys of this type.
Photographs and videos were presented to the respondents in two steps. First, a Microsoft PowerPoint presentation containing 10 slides, always with one photograph per slide, was shown to the respondents. The presentation was projected on a screen using a data projector in a university classroom. The second part of the survey was conducted 4 weeks after the first part in order to avoid the effects of familiarity with the same landscapes depicted on the photographs and in the videos, and to focus on the effect of the presentation method. The same respondents rated the set of 10 videos played consecutively on Windows Media Player, using the same technology as was used with the photographs. The videos were played without sound in order to eliminate any potential effects of sound on respondents’ visual preferences. This was necessary since, as noted by Hetherington et al. (1993), sound has a substantial effect on aesthetic ratings. Given that the objective of our study was not to determine the effect of respondents’ sociodemographic characteristics on their visual preferences, the questionnaire did not contain questions about gender, age, and so on (guided by Stamps, 2010a). Respondents wrote in the questionnaire only their name and their aesthetic ratings for the photographs and videos. The presentation took about 7 minutes.
Data Processing
Experiment 1: Effect of the Method on Overall Ratings for Photos and Videos
A linear mixed-effects model was employed to analyze the possible effect of presentation method on landscape perception. In our model, landscape perception (i.e., respondents’ ratings of the scenes that were evaluated) constituted a semiquantitative response variable on a 10-point assessment scale (from 1 to 10) with a normal distribution (assessed on the basis of the histogram of the variable). Essentially, each of the 145 respondents provided ratings for 10 landscapes presented once as a photo and the second time as a video (i.e., a total of 2,900 evaluations, corresponding to the rows in the model. To avoid pseudoreplications, identification of the respondent was included in the model as a random factor. For this reason, a mixed-effects model was used. Presentation method (photo vs. video) was taken as the explanatory variable.
Because we found a significant effect of the presentation method, we wanted to compare the mean ratings of the same landscapes (n = 10), presented as photographs and as videos, using a paired test. We therefore tested whether potential differences in ratings for the same scene differ from zero. Because the response variable (differences between landscape ratings as a photo and as a video) was not normally distributed, the nonparametric Wilcoxon paired test was used.
Experiment 2: Effect of Composition on Photo Ratings
A linear mixed-effects model was also employed to analyze the effect of composition on landscape perception within the subset of landscapes presented only by photographs. In the model, landscape perception (10 ratings from each of the 145 respondents, i.e., a total of 1,450 evaluations) constituted the response variable and had a normal distribution; identification of the respondent was included as a random factor, and good or poor composition in a given photograph was used as the explanatory variable.
Experiment 3: Comparison of Mean Ratings for Well-Composed and Poorly Composed Photographs With Dynamic Presentation Using Videos
Another objective was a paired comparison of the same landscapes presented as photographs and as videos, but doing so separately for well-composed and poorly composed photographs. For this purpose, we compared differences in ratings for five well-composed scenes (photo vs. video) and for five poorly composed scenes, using two independent nonparametric Wilcoxon paired tests.
All the statistical analyses mentioned above were performed in R version 3.0.1 (R Development Core Team, 2009).
Results
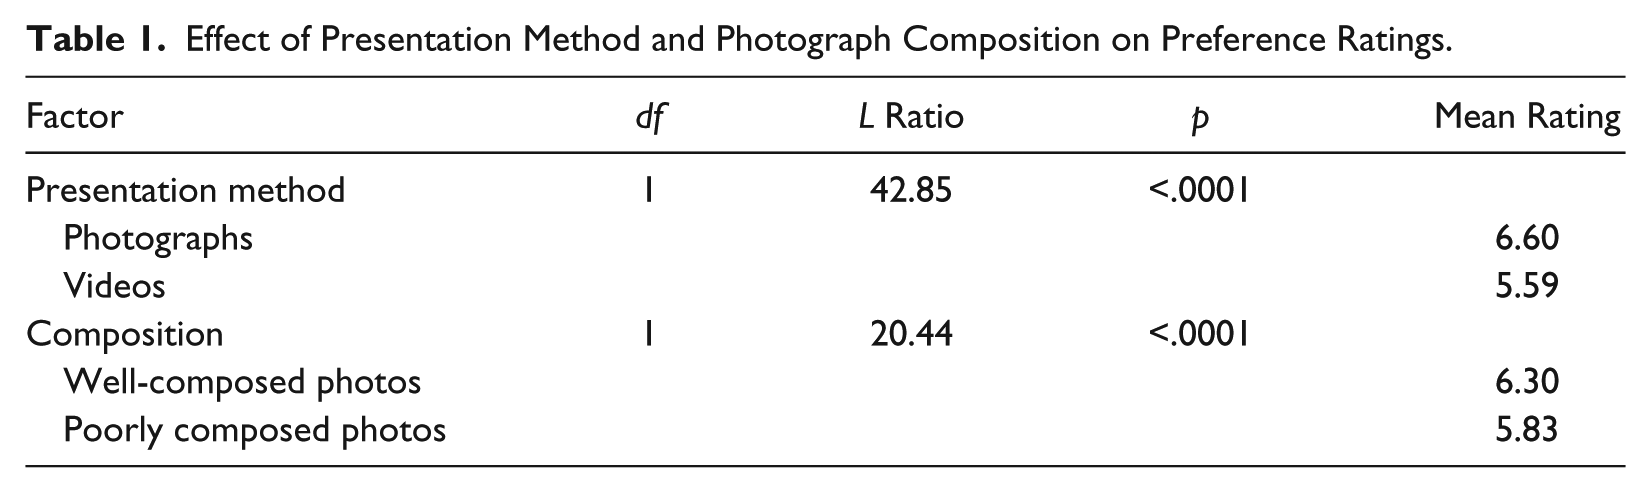
The landscape presentation method had a significant effect on the visual preference ratings for the assessed scenes. Landscapes presented as photographs were perceived on average more positively than were landscapes presented as videos (Table 1). The positive effect of the static presentation method using photographs was confirmed by a paired comparison of the same scenes (W = 53, p = .01). Nine out of 10 compared scenes received higher ratings when presented as photographs. On average, ratings for landscapes presented as photographs were 0.47 points higher than ratings for landscapes presented as videos (see Table 2).
Effect of Presentation Method and Photograph Composition on Preference Ratings.
Mean Rating of Surveyed Types of Landscape Simulations Regarding the Composition of Static Simulations; Differences in Mean Ratings.
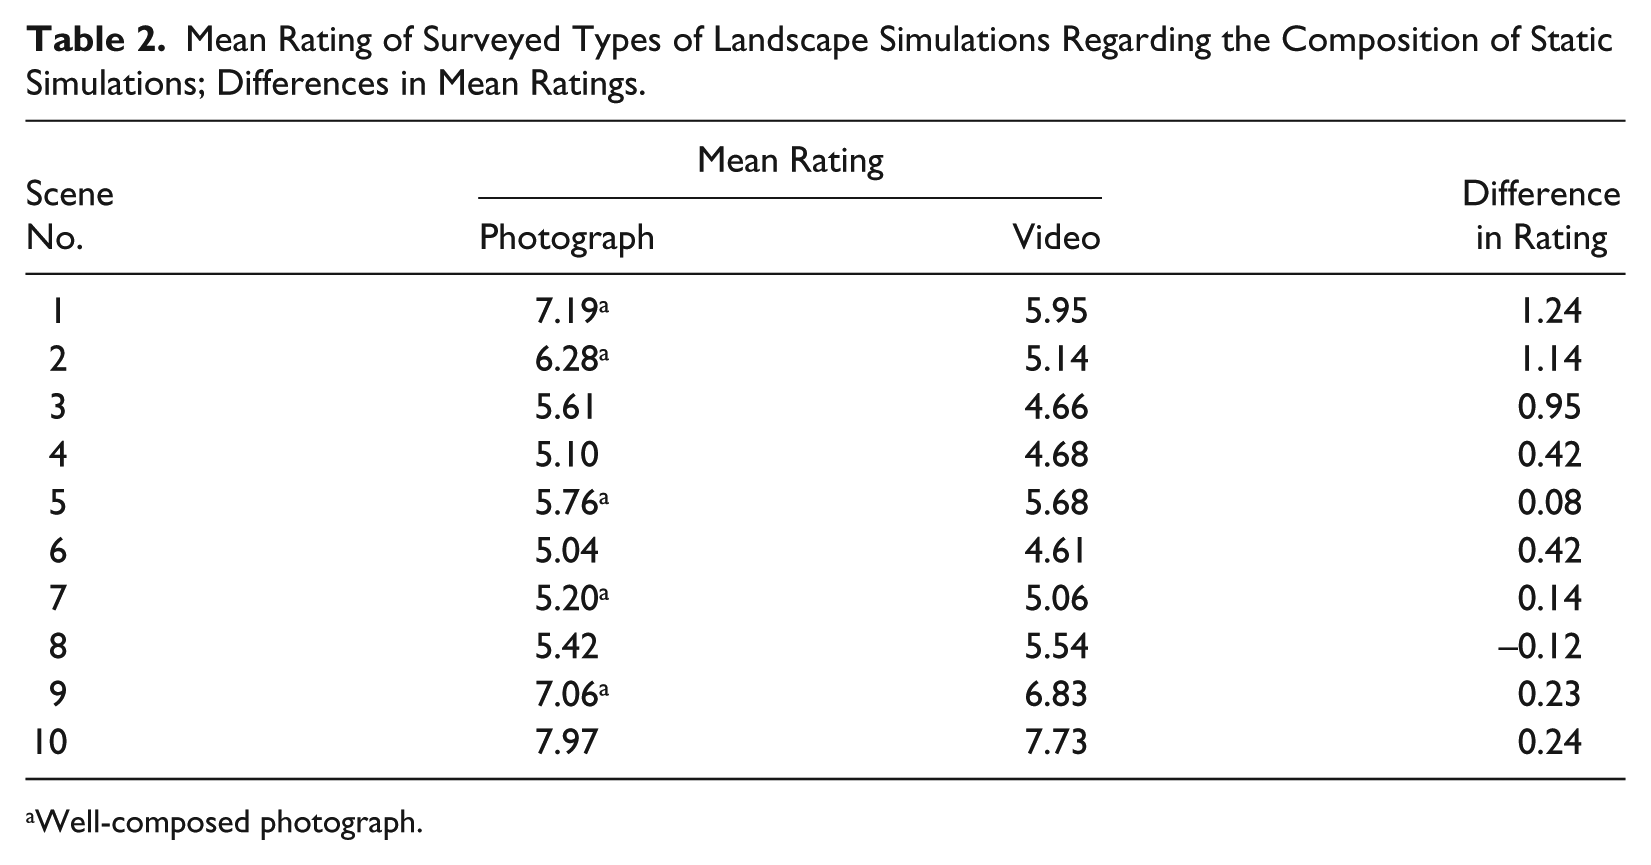
Well-composed photograph.
In addition, the results confirmed that composition had a significant effect on the visual preference ratings for landscapes presented as photographs. Well-composed photographs received higher ratings on average than poorly composed photos (see Table 1).
Given the significant effect of composition on ratings for the attractiveness of the photographs, we subsequently performed a paired comparison of the same scenes, presented once as a photograph and once as a video, separately, for well-composed (n = 5) and poorly composed (n = 5) photographs. Photographs, both well-composed (by 0.57 points) and poorly composed (by 0.38 points), received higher ratings than did videos (see Figure 3). This difference was only marginally insignificant for well-composed scenes (well-composed scenes, W = 15, p = .06; poorly composed scenes, W = 14, p = .10). Summarizing the results, we can therefore conclude that good composition can affect differences in ratings for the same scenes using static and dynamic methods.

The mean ratings for surveyed types of landscape simulation: poorly composed photographs, well-composed photographs, and video.
Discussion
Effect of Presentation Method on Aesthetic Ratings
This study has confirmed a significant effect of the type of landscape scene presentation on its aesthetic ratings. The same scenes received a higher rating when they were presented as a photograph than when they were presented as a video. Our results are in accordance with the findings of Heft and Nasar (2000). However, we did not confirm the findings of Stamps (2007, 2010b), Hetherington et al. (1993), and Vining and Orland (1989), who had observed no differences in ratings between static and dynamic landscape presentations.
Vining and Orland (1989) determined that differences between ratings for videos and slides were minuscule in comparisons of videos and photographs of three different scene types (urban street, arboretum, and hardwood forest scenes). In their study, street and arboretum scenes received higher mean ratings as slides than as videos, while forest scenes received higher ratings on average as videos than as photos. However, the authors did not mention that this insignificant difference in ratings might have been caused by presenting three considerably different landscape types. We avoided this potential problem in our study by examining ratings for a single—agricultural—landscape type. Forest scenes are characterized by low readability of the space, which, according to Kaplan and Kaplan (1989), increases preferences for their dynamic presentation because dynamic presentation generally facilitates space interpretation. An open agricultural landscape avoids this aspect of readability, and is therefore a suitable landscape type for this kind of study.
As in our study, Heft and Nasar (2000) found significantly higher preferences for static presentations of landscape scenes. They drew attention to common modes of static presentation, such as drawings and photographs, both in research and in daily design. They interpreted this general preference for static displays as ensuing from the history of Western cultures, where an “assessment of environmental beauty may more naturally occur in relation to static rather than dynamic displays” (p. 317). Images are a common part of our everyday routines and in this regard, they are more readable for us than are videos. According to Heft and Nasar (2000), this may affect preference ratings for dynamic landscape presentation, since a request for preference assessments of dynamic displays requires individuals to perform something unfamiliar.
In contrast to dynamic presentations, static presentations always display a specific arrangement of image parts and displayed elements (Kent, 1995). According to Clifton (1973), such an arrangement of elements has an effect on the attractiveness of the presentation. Two static images which display the same elements but in different spatial arrangements within the displayed scene may receive considerably different aesthetic ratings (see also, e.g., Feschner, 1871; Korkmaz, 2009; S. E. Palmer, 1991). As Russell (2000) found, the placement of crucial image elements in certain positions within a static scene can lead to significantly increased preference for the scene. Another potential predictor of increased preferences for static presentations compared to dynamic presentations of the same scene is the compositional arrangement of the static image. The effect of the composition of static scenes on differing preferences for static and dynamic displays of landscapes has not previously been investigated.
Effect of Photograph Composition on Preference Ratings
Our study compared preference ratings for well-composed and poorly composed photographs. For the purposes of our study, good composition of a photograph was defined by the arrangement of crucial elements in the photograph according to the rule of thirds (i.e., a simplified golden section, according to Pihan, 2008) and by the placement of the horizon along the upper line dividing the scene into thirds. This is in accordance with the definition of good composition, as stated by Bertamini et al. (2011), Hagerhall et al. (2004), and Pihan (2008). The results indicated that the compositional arrangement of a photograph significantly increased its preference ratings. Well-composed photographs received higher ratings than poorly composed photographs. This finding confirmed the results of other studies by, for example, Hagerhall et al. (2004), McManus et al. (2010), Svobodova et al. (2014), and Weber (1931) in demonstrating a significant effect of the compositional arrangement of landscape photographs on their preference ratings.
The essential question dealt with in this study is whether composition within the presentation of a static scene can influence differing preference ratings for static and dynamic presentations of the same scene. We used a paired comparison of the same scenes presented as photographs and as videos, separately, for well-composed and poorly composed photographs. We determined that both well-composed and poorly composed photographs receive higher ratings than do videos. The difference in ratings between videos and photographs was only marginally insignificant for well-composed scenes, while the difference in preference ratings between poorly composed photographs and videos was insignificant.
Our results therefore indirectly indicated that differing perceptions of static versus dynamic presentations were caused by the composition of the static scene. In this regard, our findings indicate the direction in which landscape simulation research should proceed. It is necessary to perform further, more detailed studies on the significance of composition within presentation methods, with the objective of increasing the precision and the proper interpretation of the results of preference studies.
Study Implications
Although we did not directly demonstrate that differing perceptions of static and dynamic presentations are caused mainly by the composition of a static scene, our results clearly indicate that there is danger of improper interpretation in research on public visual preferences as determined through static and/or dynamic landscape presentations.
Our study has demonstrated that there is greater preference for well-composed photographs than for poorly composed photographs. This draws attention to the errors that can be made when static scenes are presented and the composition of the scenes is not taken into account (e.g., Arriaza et al., 2004; Kalivoda et al., 2014; Tempesta, 2010). In research combining static and dynamic presentation methods for a real environment, it is necessary to account for the composition of the photographs and to use exclusively poorly composed photographs. Even during the dynamic and static capture of the scene for evaluation, it is necessary to avoid unwanted distortion from the given compositional arrangement of the crucial elements of the landscape scene, so as to eliminate the effect of composition on the attractiveness of the captured scene.
We have also demonstrated a significant effect of presentation method on preference ratings, and significantly higher preference for scenes presented statically than for the same scenes presented dynamically. We therefore recommend that careful consideration be given to the selection of the presentation method in order to avoid simplistic or erroneous conclusions (see Stamps, 2016). As static presentations of a landscape, photographs are affected by several factors that need to be taken into account (Barroso, Pinto-Correia, Ramos, Surová, & Menezes, 2012). In addition to image composition (Svobodova et al., 2014), these factors include colorfulness (Shuttleworth, 1980), fuzziness (Barroso et al., 2012), and focal length (Nassauer, 1983). The use of videos seems more neutral in this regard. However, Kaplan and Kaplan (1989) noted dangers resulting from the character of the presented scene, and emphasized the importance of the readability of the landscape scene, stating that landscape preferences can be directly related to how readily individuals are able to comprehend a landscape scene. If a scene can be characterized as chaotic, busy, or messy, for example scenes containing a great deal of wilderness, forest landscape scenes, and densely-developed urban scenes, it is better to use video (dynamic display) as the presentation medium. Video reveals these kinds of landscape scenes gradually, and preserves the legibility of the scene for observers. By contrast, scenes containing mystery, which the Kaplans define as the “promise of new but related information,” evoke more positive aesthetic evaluations if they are represented in a static display than in a dynamic display (see Heft & Nasar, 2000). Landscape scenes which contain complexity with order, and are therefore easy to orientate within, for example agricultural, rural, coastal, and savannah landscapes, appear to be little affected by the presentation method.
These conclusions should not be overgeneralized. Partial landscape scenes should always be approached individually, and the suitability of the presentation method should be assessed separately for each scene, as emphasized by Stamps (2007, 2010b, 2016).
Limitations of the Study and Future Research
There are a number of limitations in this study, including the way that the questionnaire was designed, the nature of the tested variables, and the way in which the image composition was defined.
The results showed a marginally insignificant effect of image composition on different ratings for photographs and videos. The lack of statistical significance is probably only due to the small size of the set of tested photographs and videos (10 + 10), and therefore, due to the low power of the test. Future research should therefore involve a larger set of photographs and videos to avoid Type II error (Crawley 2007). While the participants represented a consistent sample of students, future research may consider surveying a sample representing the general public, rather than a selected group of respondents. In future research, we may consider including a survey of the sociodemographic characteristics of the respondents, in an attempt to explore correlations between individual characteristics and aesthetic ratings for different simulation methods. Our study also did not reflect the effect of various landscape types on preference ratings. We studied the issue in open agricultural landscapes, in order to avoid distorting the findings. Future research may be focused on a range of landscape types, taking into consideration various landscape characteristics and patterns in photograph and video design.
The present study has also focused on two particular rules of image composition: the rule of thirds and the position of the horizon, which were applied when taking photographs in the field. Future research may explore the effect of other compositional rules and considerations on landscape simulation methods, for example colors, foreground–background effects, symmetry, and framing.
Conclusion
Composition, an essential and integral characteristic of images, is a phenomenon known particularly among painters and photographers as a basic artistic concept. Composition is also a part of people’s everyday lives. We make aesthetic judgments every day concerning natural vistas, paintings in galleries, or views of city streets. In the present study, we therefore raised the question of whether composition, as an aspect of the static landscape presentations commonly used in preference research, might affect the findings of the research, in particular when comparing static and dynamic presentations of the same landscape scenes. We have demonstrated that the composition of a photograph can have a non-negligible effect on the preference ratings generated by various methods for simulating a real environment. In particular, well-composed photographs received a higher rating than other simulations. We have discussed some implications of our findings, and have suggested some future studies that might be undertaken.
Footnotes
Declaration of Conflicting Interests
The author(s) declared no potential conflicts of interest with respect to the research, authorship, and/or publication of this article.
Funding
The author(s) received no financial support for the research, authorship, and/or publication of this article.