
Abstract
This study was carried out with the specific objectives of mapping the present level of mathematical skills of community members, and their radio listening behaviour preferences, with a view to making recommendations for the nature of radio programmes to be produced and broadcast among community members to enhance their numerical ability. To this end, the study employed quantitative research design, which involved the survey of a sample of 12,000 respondents taken from among the community members constituting the audience of the community radio stations in the country. The study employed multi-stage sampling to first identify 12 community radio stations, in the first instance, followed by the identification of one thousand households in each of these community radio stations and one respondent from each of the selected households, giving due consideration to the parity of gender. The data collected from each of these 12,000 respondents was processed with the help of descriptive statistical tools to arrive at inferences necessary to achieve the purposes of the study. The study revealed that while community members were comfortable in solving simple mathematical sums and calculating their wages, they experienced difficulties in the use of mathematical skills in the computation of interest, discount, percentage and conversion of scales of measurement. The study further revealed that community members listened to radio extensively and were eager to not just listen to radio programmes based on the imparting of mathematical skills but also willing to adopt a participatory approach in their production, based on their competencies.
Introduction
India’s Human Development Index (HDI) value stood at 0.640 in 2017, 1 registering an increase of 49.8 per cent from 1990 to 2017. Though this placed the country in the medium human development category, occupying the 130th place among 189 countries in the world, it fell short of the average of 0.645 for countries in this category. Furthermore, what is of note is the precipitous fall in the HDI value, when it is adjusted for inequality in the country. The inequality-adjusted Human Development Index (IHDI) fell from 0.640 to 0.468, a loss of 26.8 per cent compared to 25.1 per cent for the countries in the medium human development category. This steep decline in the HDI was attributable to the inequality in the HDI dimension indices. With a human inequality coefficient of 26.3 per cent, the country had inequality in life expectancy at birth (21.4%), inequality in education (38.7%) and inequality in income (18.8%). In terms of gender differences, the Gender Development Index (GDI) for India stood at 0.841, compared to 0.878 for countries in the medium human development category, with female HDI at 0.575 and male HDI at 0.683. In contrast, the Gender Inequality Index (GII) for India stood at 0.524, compared to 0.489 for the countries in this category, placing it at number 127 out of 160 countries in the 2017 index.
Insofar as the sustainable development indicators are concerned, 2 India’s performance did not differ much from that of its HDI. As per the Tendulkar Committee Report, 21.92 per cent of the Indian population lived below the poverty line in 2011–2012. The figure is a conservative estimate in view of the manner in which poverty was defined by the committee. According to the National Family Health Survey (NFHS-4), almost half of pregnant Indian women aged 15 and 49 were reported anaemic and more than one-third of women had a low body mass index. Among children aged below 5, 38.4 per cent had low height-for-age and 21 per cent had low weight-for-age, on account of malnutrition. As per the SDG India Index Baseline Report, ‘Food security and nutrition pose a challenge in India because of a number of factors such as inadequate access to food, structural inequalities (gender, caste and social groups), lack of water and sanitation, micronutrient deficiencies and illiteracy’. In the parameter of health, the maternal mortality rate was 130 per 100,000 live births and for every 1,000 live births, 50 children aged under 5 die. Besides, the country reported 138 cases of tuberculosis per 100,000 people. As against this, there were only 221 government health workers for every 100,000 people. Besides, though India reported a literacy rate of 74 per cent, with male literacy pegged at 82.1 per cent and female literacy at 65.5 per cent, 3 the literacy rate by completed years of levels of education was not encouraging. As per Census 2011, 4 only 6.9 per cent of people aged 5 and above had a graduate degree and above, with 49.1 per cent of literates being concentrated in the category of people having studied up to upper primary school only. Obviously, the divide between the haves and the have-nots is skewed unfavourably against the latter.
The model of development that India adopted in the aftermath of its independence was the top-down one, famous as the Nehru–Mahalanobis model. Though post liberalization, it underwent a change, but that did not impinge on the model as such. Liberalization only dismantled the command economy structure to liberate the impulse for free enterprise with a view to unleash the people’s power to develop. But with so many inequalities to contend with, it only helped to further accentuate the fault lines of community development as is borne out by the statistics of sustainable development reported here. With the change in the government at the federal level and in most states, a new way of looking upon development began to emerge. This veered closer to the Gandhian model of Gram Swaraj, wherein the focus is on grassroots community development. For the first time in the history of independent India, the federal government started engaging directly with the public institutions at the bottom of the administrative pyramid, the Panchayati Raj institutions. This was made possible with the extensive use of the information and communication technologies which helped to connect the nation directly with the head of the government. The other initiative adopted to make this direct liaison between the highest echelons of the government and the community at the grassroots level possible was the radio. Mann ki Baat (radio programme hosted by the Prime Minister of India, Mr. Narendra Modi) became a constant fixture as did Internet-enabled social networking and video conferencing.
The government also turned attention towards the revitalization of the community radio as a medium of mainstreaming the community in the national development discourse. The initial impulse for community radio came from the Supreme Court judgement in 1995 which reiterated that the radio waves belonged to the people and the government was only a caretaker. 5 In the initial stage, granting of community radio license was restricted to reputed educational institutions only (Dutta & Ray, 2017–2018; Ediga, 2015). Though in 2006, the government allowed non-profit organizations to run community radio stations as a strong tool for community mobilization for empowerment, community radio could not make much of an impact in the country except in certain pockets because of the lack of an enabling and facilitating environment (Dutta & Ray, 2017–2018; Ediga, 2015). This changed with the swearing in of the new government in 2014, which seized it as an opportunity not only to mobilize support for its development agenda but also to involve the community and its institutions in the developmental initiatives.
As education is the key to community empowerment, the Department of Science & Technology of the Government of India conceived the Radio Mathematics Project for enhancing the mathematical skills of the people through community radio. It is pertinent to note here that successive annual status of education reviews has been critical of the mathematical and language skills competencies of school going children. The 13th Annual Status of Education Report 6 released in New Delhi on 15 January 2019 reported that the proportion of Standard V students who could read Standard II level texts had declined steadily since the high of 2008 till 2012 and had since been rising only marginally and that the proportion in 2018 was still below the 2008 level. The National Achievement Survey 2017 7 did not have a different story to tell. As the data on literacy and levels of completed education show that the bulk of the Indian population of ages 5 and above lies at the bottom of the educational pyramid, one can understand their inability to participate in the mainstream economy of the nation. As per the result of a survey on employment and unemployment conducted in 2011–2012 by National Sample Survey Office (NSSO) and Ministry of Statistics and Programme Implementation, the number of estimated employed persons in 2011–2012 on usual status basis was 474.1 million, of which 82.7 per cent of workforce (391.4 million persons) was in the unorganized sector. 8 With 30 million persons unemployed, 26 million officially underemployed, 40 million seeking additional work and 35 million looking for alternative modes of livelihood, the situation takes on a grim face. Uplifting these large numbers out of the morass of poverty can only be possible if they are given the right skills that can help them to earn livelihood.
Review of Literature
Most research studies on community radio regard it as an engine of equitable community development. One study examines how community radio contributes to community development by providing information about community services made available by the government (Dutta & Ray, 2012). Another study examines the role played by community radio in educating the nomads of Nigeria through the open distance learning mode (Ngwu, Ekwe, & Chukwuma, 2012). Similarly, another study explores the role played by community radio stations in community development, particularly rural and remote, in Bangladesh (Khan et al., 2017). A case study on Sadhana Community Radio beneficiary farmers was carried out in India with a view to map their listening behaviour vis-à-vis the programmes broadcast (Ratanparkhi et al., 2016). There has also been a study of the role that All India Radio, public broadcaster, has played, much before the advent of community radio, to overcome the literacy barrier among highly diversified audiences in the Indian subcontinent (Srivastava & Sekhar, 2017).
Some studies explore the challenges faced by community radio stations to ensure their sustainability and to serve the local communities (Dutta & Ray, 2017–2018; Muswede, 2009; Seth, 2013; Singh & Kumari, 2018). Similarly, one study examines the capability of community radio to address the issues of social change and development in Cuba (Bautista, 2018). Also, another study on community radio investigates the reasons for the slower growth of community radio in India in comparison with the phenomenal progress in countries such as Nepal, Thailand, Columbia and the Democratic Republic of Congo (Pavarala, 2013). Yet another study looks at the challenges faced by community radio in Western developed economies where community radio operates on the fringes as much of the public audience is engaged with the mainstream mass media (Cammaerts, 2009). One study examines the innovative practices followed by community radio stations in India (Dutta, 2014). Research has also focussed on the creation of a theoretical framework of value for community radio in terms of the benefits of participation and those of community listening (Order, 2013).
While studies have been carried out on the role played by community radio in community development, in general, and education, in particular, we could not come across studies that focussed on the use of community radio for teaching mathematical skills. It is in this context that the Radio Mathematics Project was conceived as an action research-based project with support from the Department of Science and Technology (DST) of Government of India. The project envisaged a baseline study, in the first instance, to explore the need for such a mediated intervention in community, followed by the broadcast of some 180 radio programmes to be broadcast among community members. The present study is based on the baseline survey carried out for this action-based research project.
Objectives of the Study
This study was carried out with the following specific objectives:
Mapping of the level of numerical ability of community members; mapping of their radio listening behaviour preferences; and making recommendations for the nature of radio mathematics interventions.
Research Design and Methods
The baseline study employed a multistage quantitative research design for achieving its objectives. In the first instance, it was important to identify the community radio stations which would form a part of the Radio Mathematics project. To this end, proposals were invited for participation in the project from all community radio stations throughout the country. Based on the need to have a diversified sample of community members, representative of the diverse social and economic conditions of the country, and the willingness of the community radio stations to participate in such a study, a sample of 12 community radio stations was selected. These were: Jagannath International Management School (JIMS) Vasant Kunj (VK), New Delhi, Kamalvani, Kolsiya, Rajasthan, Jnan Taranga, Krishna Kanta Handiqui State Open University, Guwahati, Assam, Vanya, Khalwa, Khandwa District, Madhya Pradesh, Popcorn, Bhopal, Madhya Pradesh, Alwar Ki Awaz, Alwar, Rajasthan, Vasundhara Vahini, Baramati, Pune District, Maharashtra, The Film and Television Institute of India (FTII), Pune, Maharashtra, Pasumai, Dindigul, Tamil Nadu, Jana Dhwani, Saragur, H. D. Kote Taluk, Mysore district, Karnataka, Active, Bengaluru, Karnataka, Periyar, Periyar Maniammai University, Thanjavur, Tamil Nadu.
Once, the community radio stations had been selected, it was important to select a sample of respondents from within the communities of each of these radio stations. In the first stage, the areas falling within the range of the air waves of each of the 12 community radio stations were identified. In the second stage, a sample of 1,000 households from each Community Radio (CR) was selected randomly, resulting in a total sample size of 12,000 households for all the 12 identified CRs. In the third stage, one respondent was chosen from each household and due care was taken to ensure that the number of respondents comprised of equal number of men and women and were aged above 18 years. The standardized questionnaire developed by Media4 Community Foundation after translation in the regional language of the station was administered to each of the 12,000 respondents forming the sample. The entire process of field survey, right from the stage of the identification of individual respondents to data collection and data processing, was done by the respective CRs. Each CR station identified teams comprising of community volunteers, CR staff and students in case of educational institutions and field supervisors. Data processing, was done on the day of data collection and the survey was completed in 3 to 4 days in each of the CR. Data were analysed using a pre-designed analysis framework.
Results and Discussion
Profile of the Respondents
Occupational Distribution
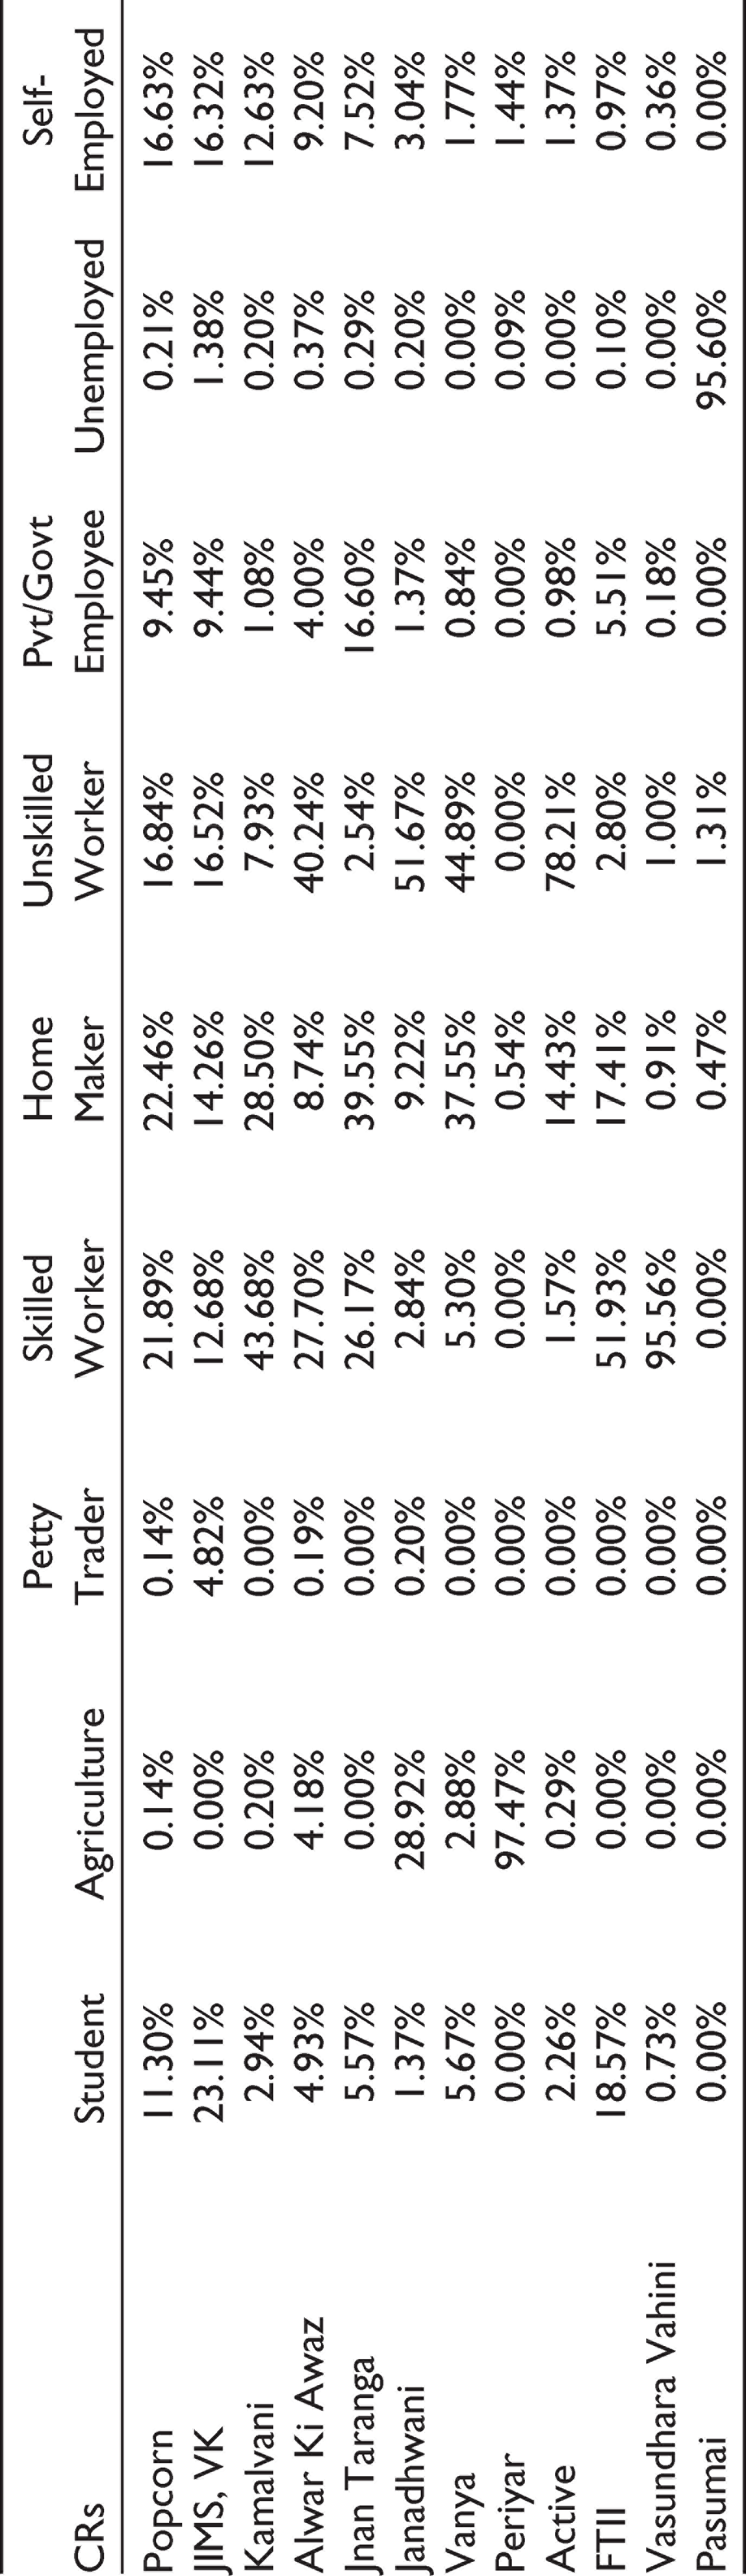
As is clear from Table 1, the sample distribution across various occupational categories in each of the 12 community radio stations was divergent. Only two community radio stations had substantial agriculture-based listener–respondent concentration. While CRs Jana Dhwani had 28.92 per cent listeners drawn from the agricultural community, Periyar had as high as 97.47 per cent listeners from agriculture. Another notable variation was the almost exclusive concentration of listeners in the unemployed category at Pasumai, which was a phenomenal 95.60 per cent. Similarly, CRs Vasundhara Vahini had 95.56 per cent of its listener respondents drawn from the skilled workers’ category. The remaining nine CRs had their listening audience distributed over the non-agricultural categories. Among these, only three CRs had a considerable category of listener–respondents as students: CRs JIMS VK (22.11%), FTII (18.57%) and Popcorn (11.30%). While the listener–respondents of CRs Popcorn, JIMS VK and Kamalvani were distributed across any four to five non-agricultural occupational categories of skilled workers, homemakers, unskilled workers, self-employed and students, those of CRs Alwar, Jana Dhwani, Vanya and Active were concentrated in any two of the categories of skilled workers, homemakers and unskilled workers, and those of FTII and Jnan Taranga in any three of the categories of skilled workers, homemakers, students and private/government employment.
Monthly Household Income
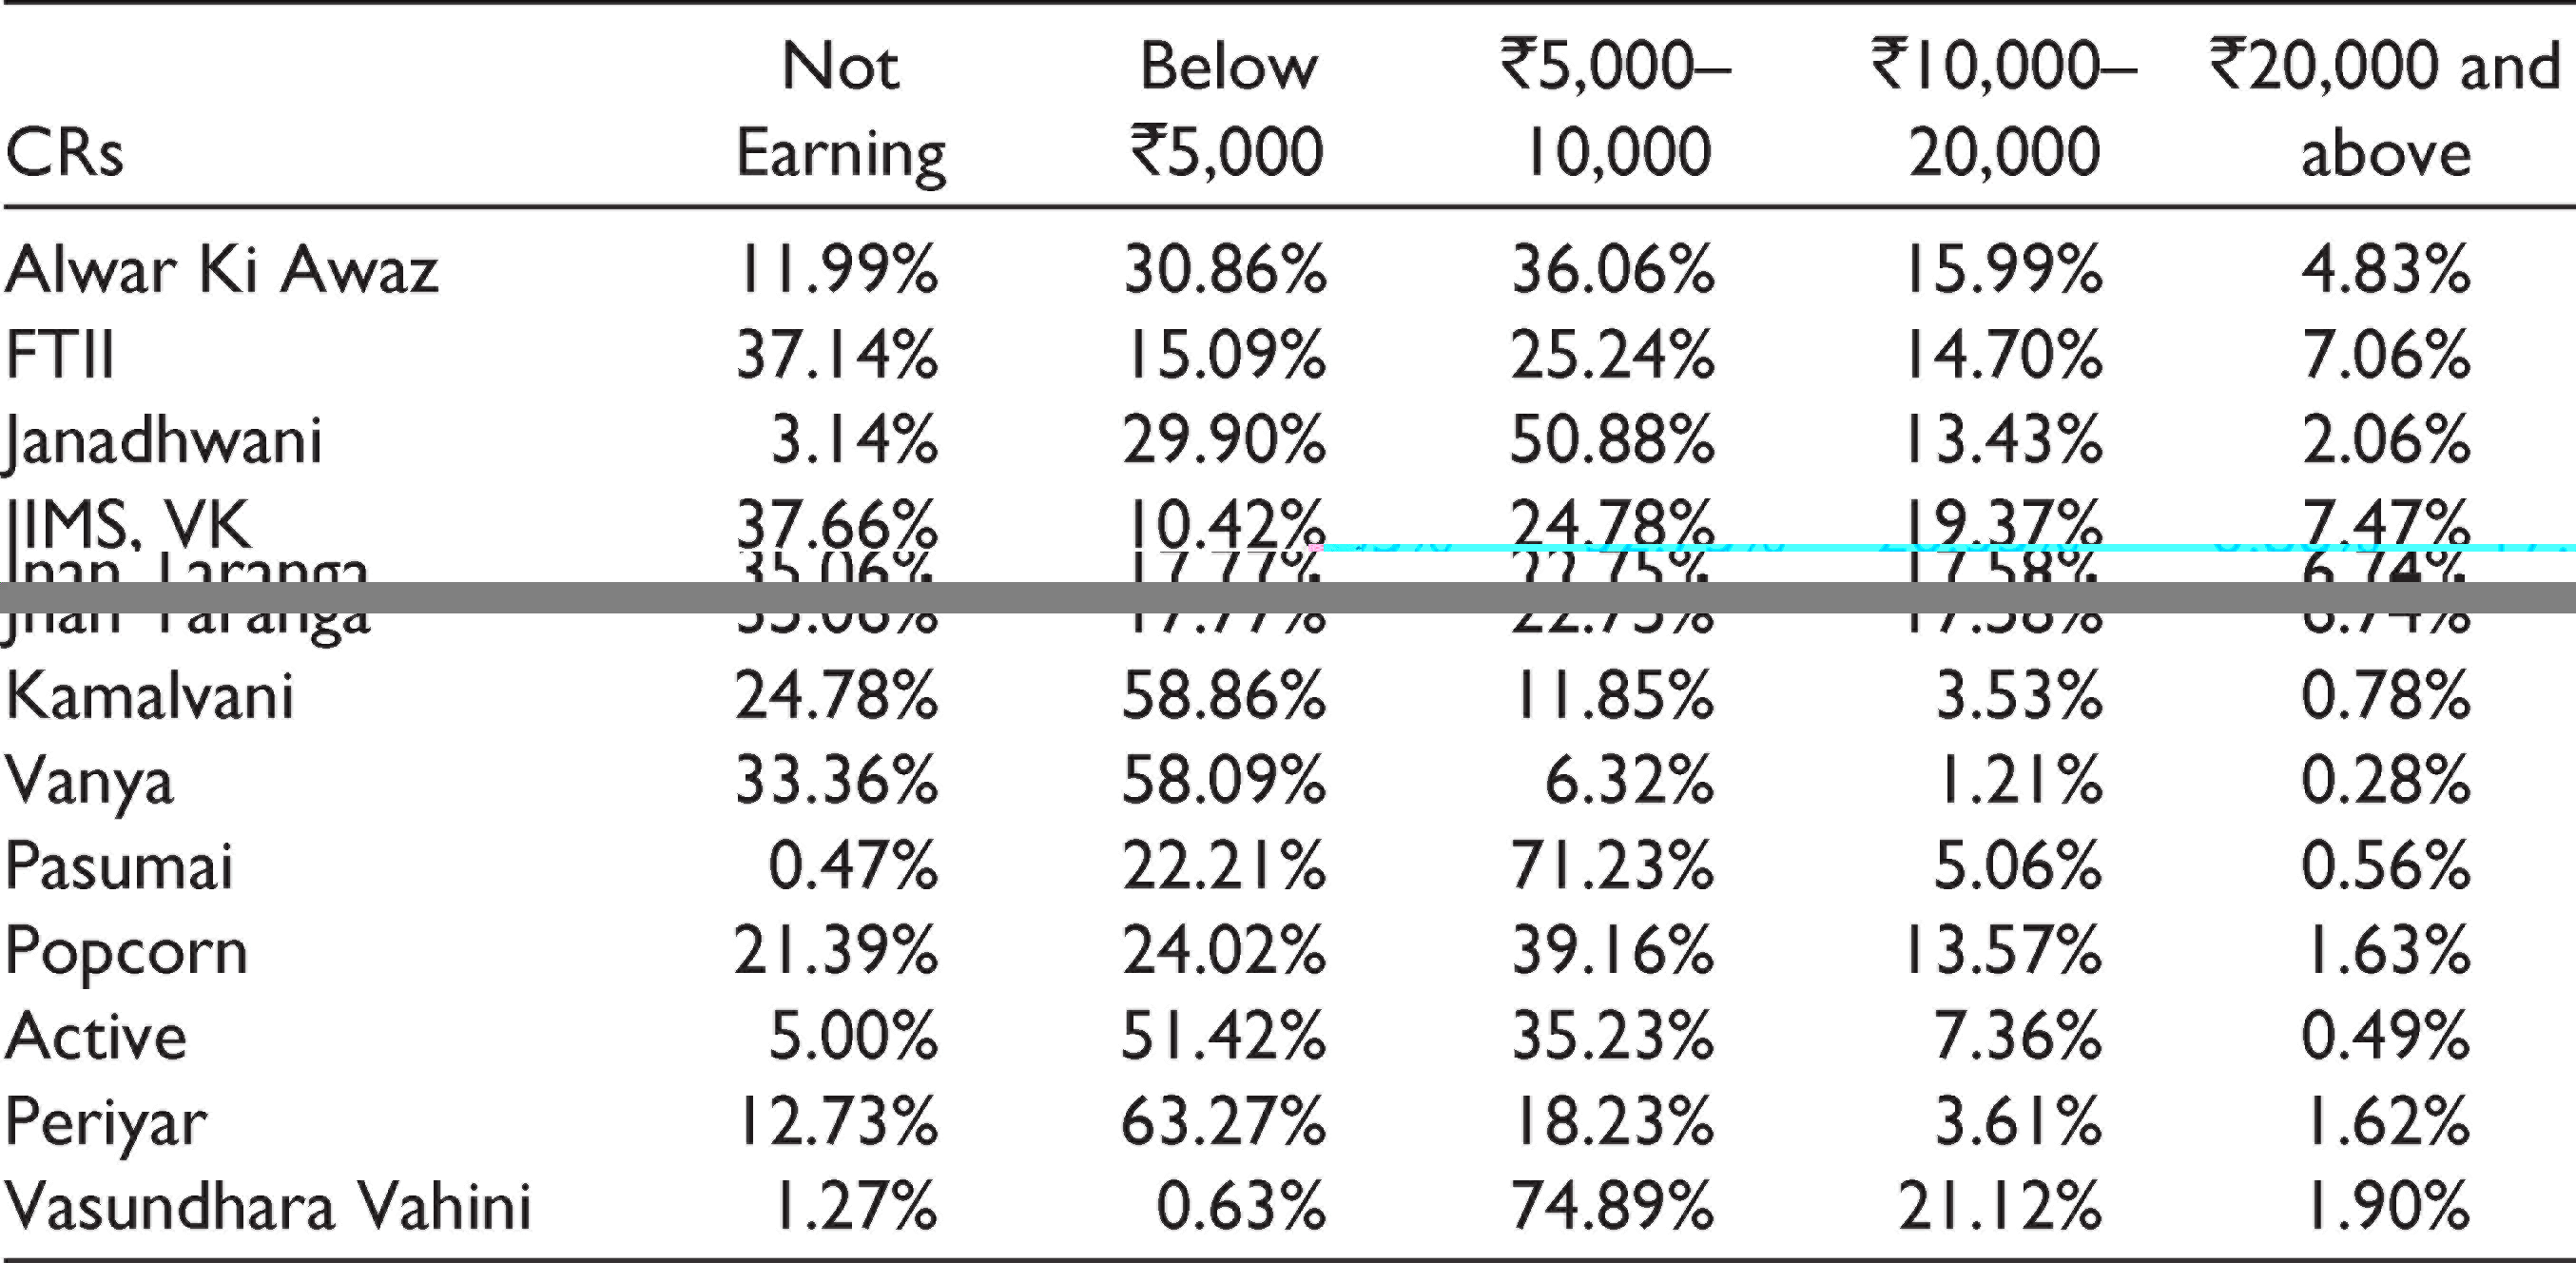
As is clear from Table 2, 6 of the 12 CRs had more than 50 per cent of their respondents falling in the category of households earning less than ₹60,000 per annum, with 4 of these having more than a third of their respondents having no household income. Vanya had the highest concentration of respondents (91.45%) having annual household income below ₹60,000, followed by Kamalvani (83.64%), Periyar (76.00%), Active (56.42%), Jnan Taranga (52.83%) and FTII (52.23%). Five of the 12 CRs participating in the Baseline Survey for Radio Mathematics had more than 20 per cent of their respondents with an annual household income of ₹120,000 and above. JIMS VK had the highest concentration of 26.84 per cent, followed by Jnan Taranga (24.32%), Vasundhara Vahini (23.02%), FTII (21.76%) and Alwar (20.82%). Only three of these CRs had more than 5 per cent of their respondents earning an annual household income of ₹240,000 and above. The variation in the structure of household income across the CRs points to the character of their listeners/communities. While CRs in the rural hinterland have poorer people, those in or near towns or cities tend to have better household incomes.
Occupational Distribution
Monthly Household Income
Level of Formal Education
As Table 3 shows, the respondents of only four CRs have more than 10 per cent of listeners with educational qualification beyond 12th class. CR with the highest concentration of graduates/postgraduates is Jnan Taranga (25.98%), followed by Popcorn (14.64%), FTII (13.54%) and Vasundhara Vahini (11.70%). On the other end of the spectrum are the respondents with no formal schooling. The situation here is abysmally pathetic. Vanya has the highest number of respondents (70.26%) with no formal schooling, followed by Jana Dhwani (60.49%), Kamalvani (45.54%) and Active (40.73%). The situation continues to be bleak when we add to the aforementioned category the number of respondents who have studied up to 5th class. More than 50 per cent of the respondents in eight CRs fall in the two categories of no formal schooling and have not studied beyond 5th class. Vanya has the highest concentration of respondents (90.80%) in the lowest two categories, followed by Jana Dhwani (86.08%), Kamalvani (77.76%), Pasumai (77.31%), Alwar Ki Awaz (73.33%), Active (67.02%), Periyar (55.69%) and JIMS VK (53.60%). The high percentage of such scantily educated respondents calls for strong non-formal inputs of all kinds of literacy, be it verbal or mathematical.
Level of Formal Education

The analysis of the sample profile across the 12 community radio stations reveals that there is a heavy preponderance of illiterate population who are caught up in the vortex of poverty on account of being involved in no or unskilled occupations. Reaching out to this segment of population to uplift them from the vicious cycle of poverty through educational broadcasts such as those on everyday Mathematics can ameliorate their lot.
Mapping of Mathematical Ability
This section presents the findings of the survey regarding the frequency of use of mathematics and the comfort and competence level of the respondents in meeting the challenge of using everyday mathematics in the course of transacting the business of life.
Use of Simple Mathematical Calculations for Various Purposes
Use of Simple Mathematical Calculations for Various Purposes
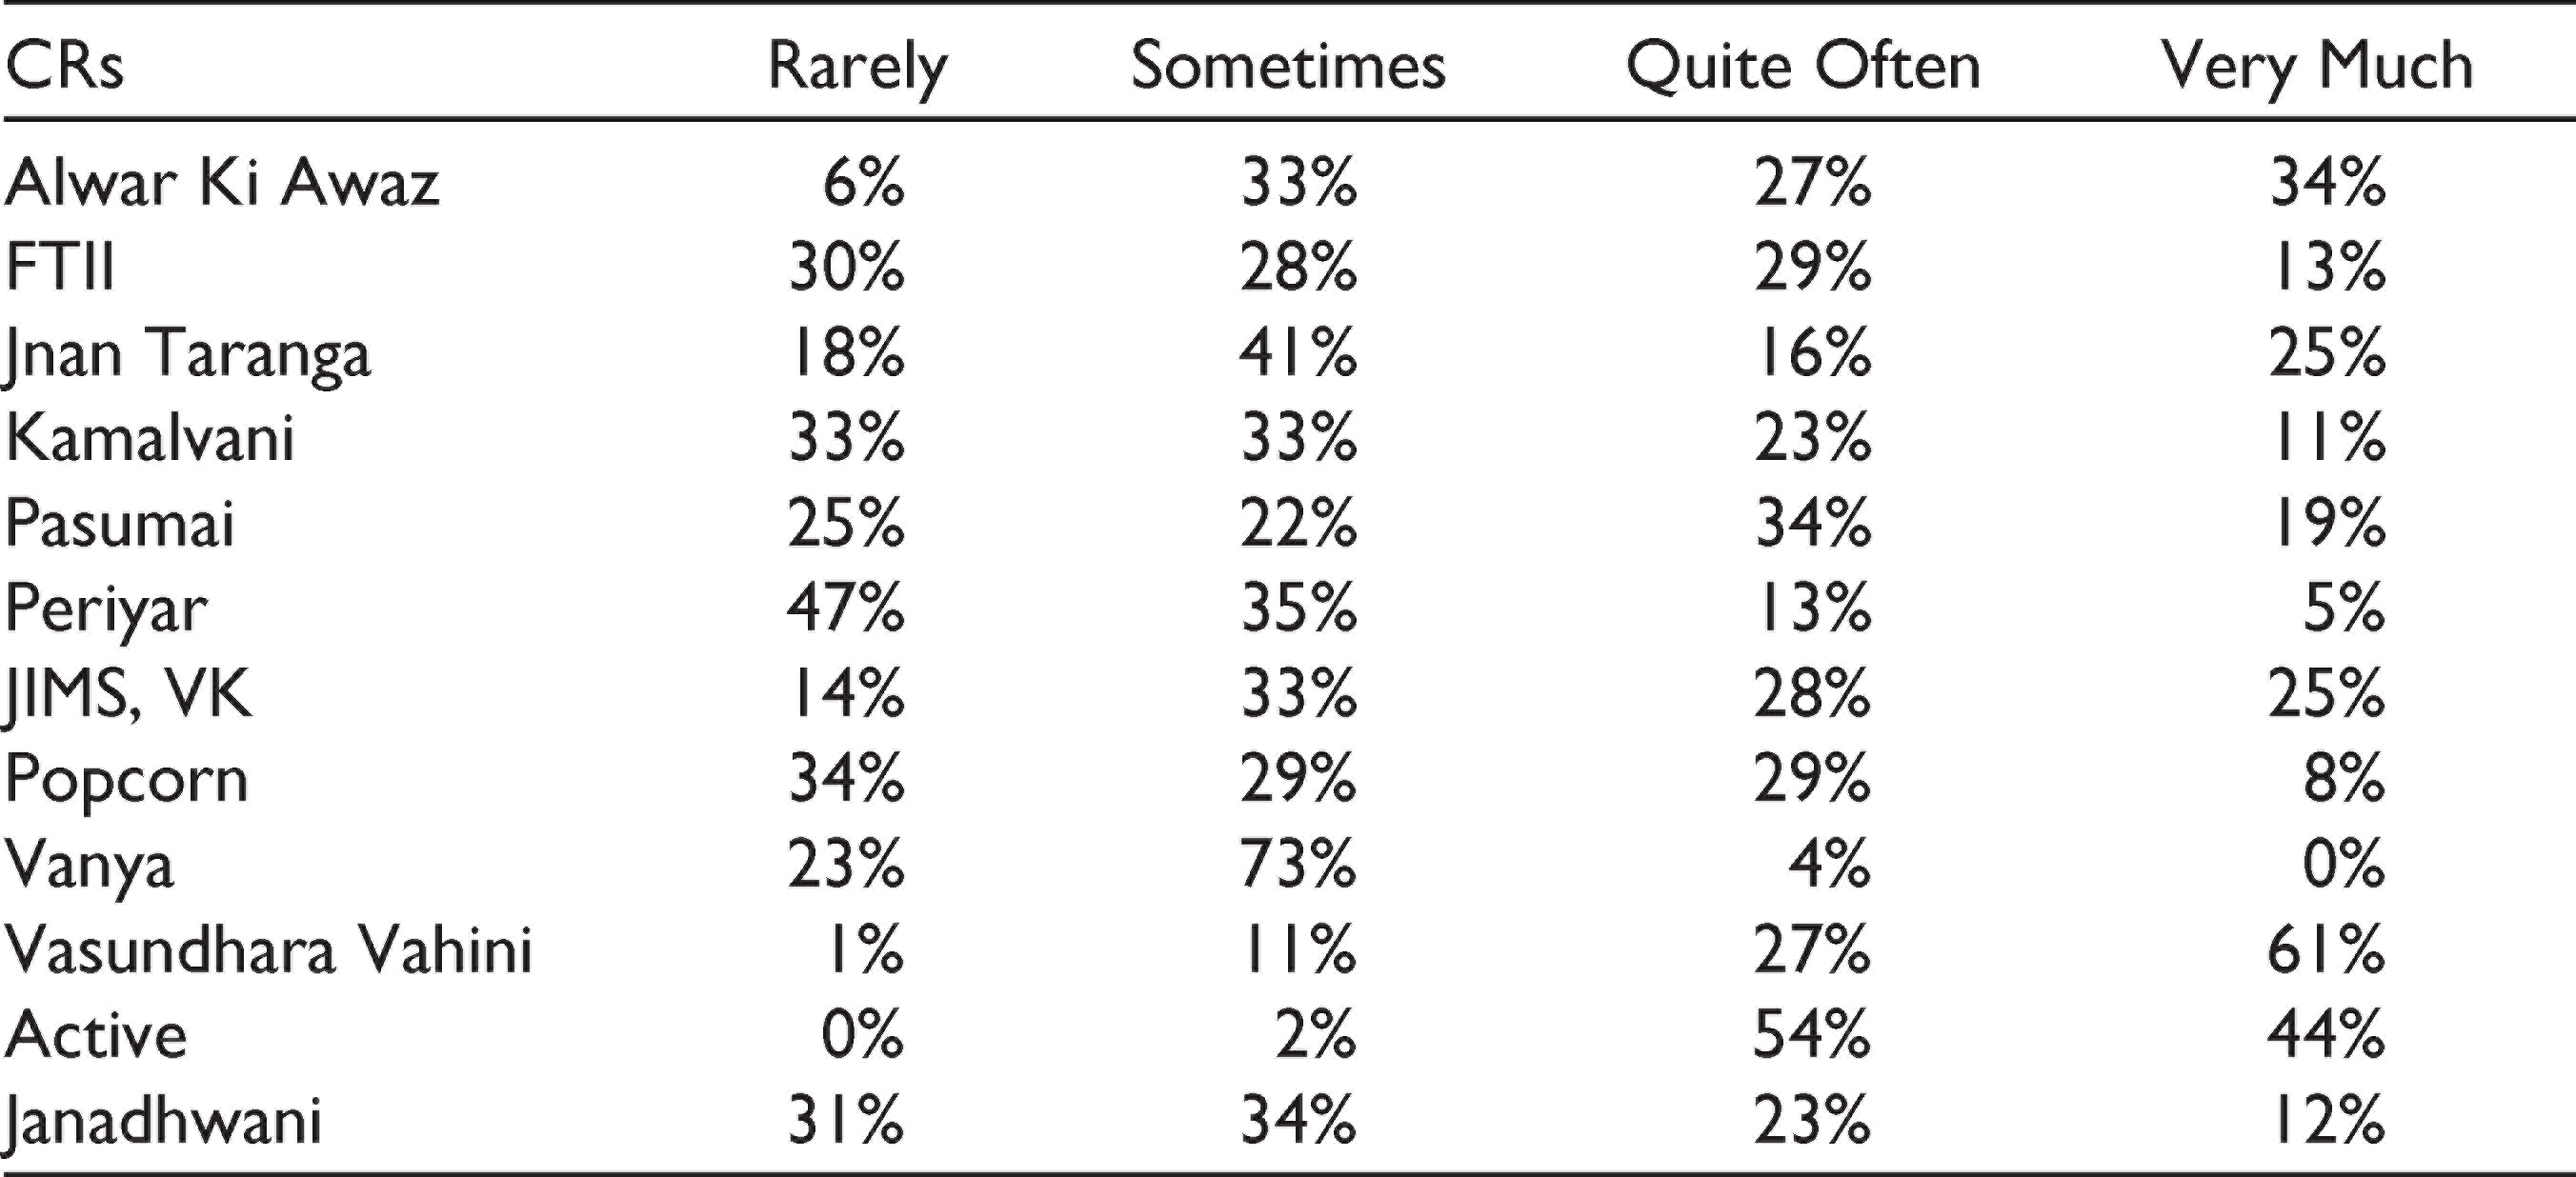
When the respondents across the 12 CRs were asked about the frequency with which they used simple mathematics and calculations in their everyday life, they came up with interesting responses. Table 4 shows that more than a half of the respondents in 7 of the 12 CRs felt that they used simple mathematics either rarely or only sometimes in their daily life. Vanya had the highest concentration of such respondents (96%), followed by Periyar (82%), Kamalvani (66%), Jana Dhwani (65%), Popcorn (63%), Jnan Taranga (59%) and FTII (58%). In contrast, more than 50 per cent of the respondents in 5 of the 12 CRs felt that they used simple mathematics and calculations quite often and very much in their daily life. Obviously, those in the grip of poverty do not even realize how much mathematics finds application in their everyday life. Hence, these people need not only mathematical inputs but also a reorientation of their perception to the ways in which mathematics impinges their lives.
Level of Ease in Everyday Calculation
As shown in Table 5, more than 70 per cent of the respondents in only six CRs felt that they could manage to solve simple mathematical problems on their own. Vasundhara had the highest concentration of respondents (86%) with the confidence that they could solve mathematical problems easily without any help, followed by FTII (79%), Alwar Ki Awaz (77%), Jnan Taranga (72%) and Periyar and Active (70% each). The other CRs had a considerable section of respondents who either needed someone else’s help fully or at times. More than 30 per cent of the respondents in eight CRs felt that they needed help with even simple calculations. Vanya had the highest concentration of such respondents (88%), followed by Kamalvani (56%), JIMS, VK (48%), Jana Dhwani (46%), Periyar (41%), Popcorn (39%, Pasumai and Active (30% each).
Level of Ease and Competence in Solving Simple Addition- and Subtraction-based Problems
A set of simple Maths questions in order of increasing degree of difficulty was asked to the respondents in order to understand their level of ease and competence in solving them. Table 6 shows that subtraction posed a bigger challenge than addition to the respondents. Most of the respondents returned correct answers to the addition problems, with very few reporting errors in their calculations. The percentage of incorrect additions ranged from 2 to 9 for most of the CRs, with the exception of Vanya which recorded 15 per cent incorrect answers. In stark contrast, the percentage of incorrect answers reported in the case of subtraction questions ranged from 5 to 45, with Alwar ki Awaz reporting the highest percentage of incorrect answers (45), followed by Popcorn and Jana Dhwani (36 each), JIMS VK (35), Pasumai (28), Periyar (26), Kamalvani (25), FTII (21), Vasundhara Vahini (13), Jnan Taranga (7), Active (6) and Vanya (5).
Level of Ease and Competence in Solving Application-Based Multiplication Problems
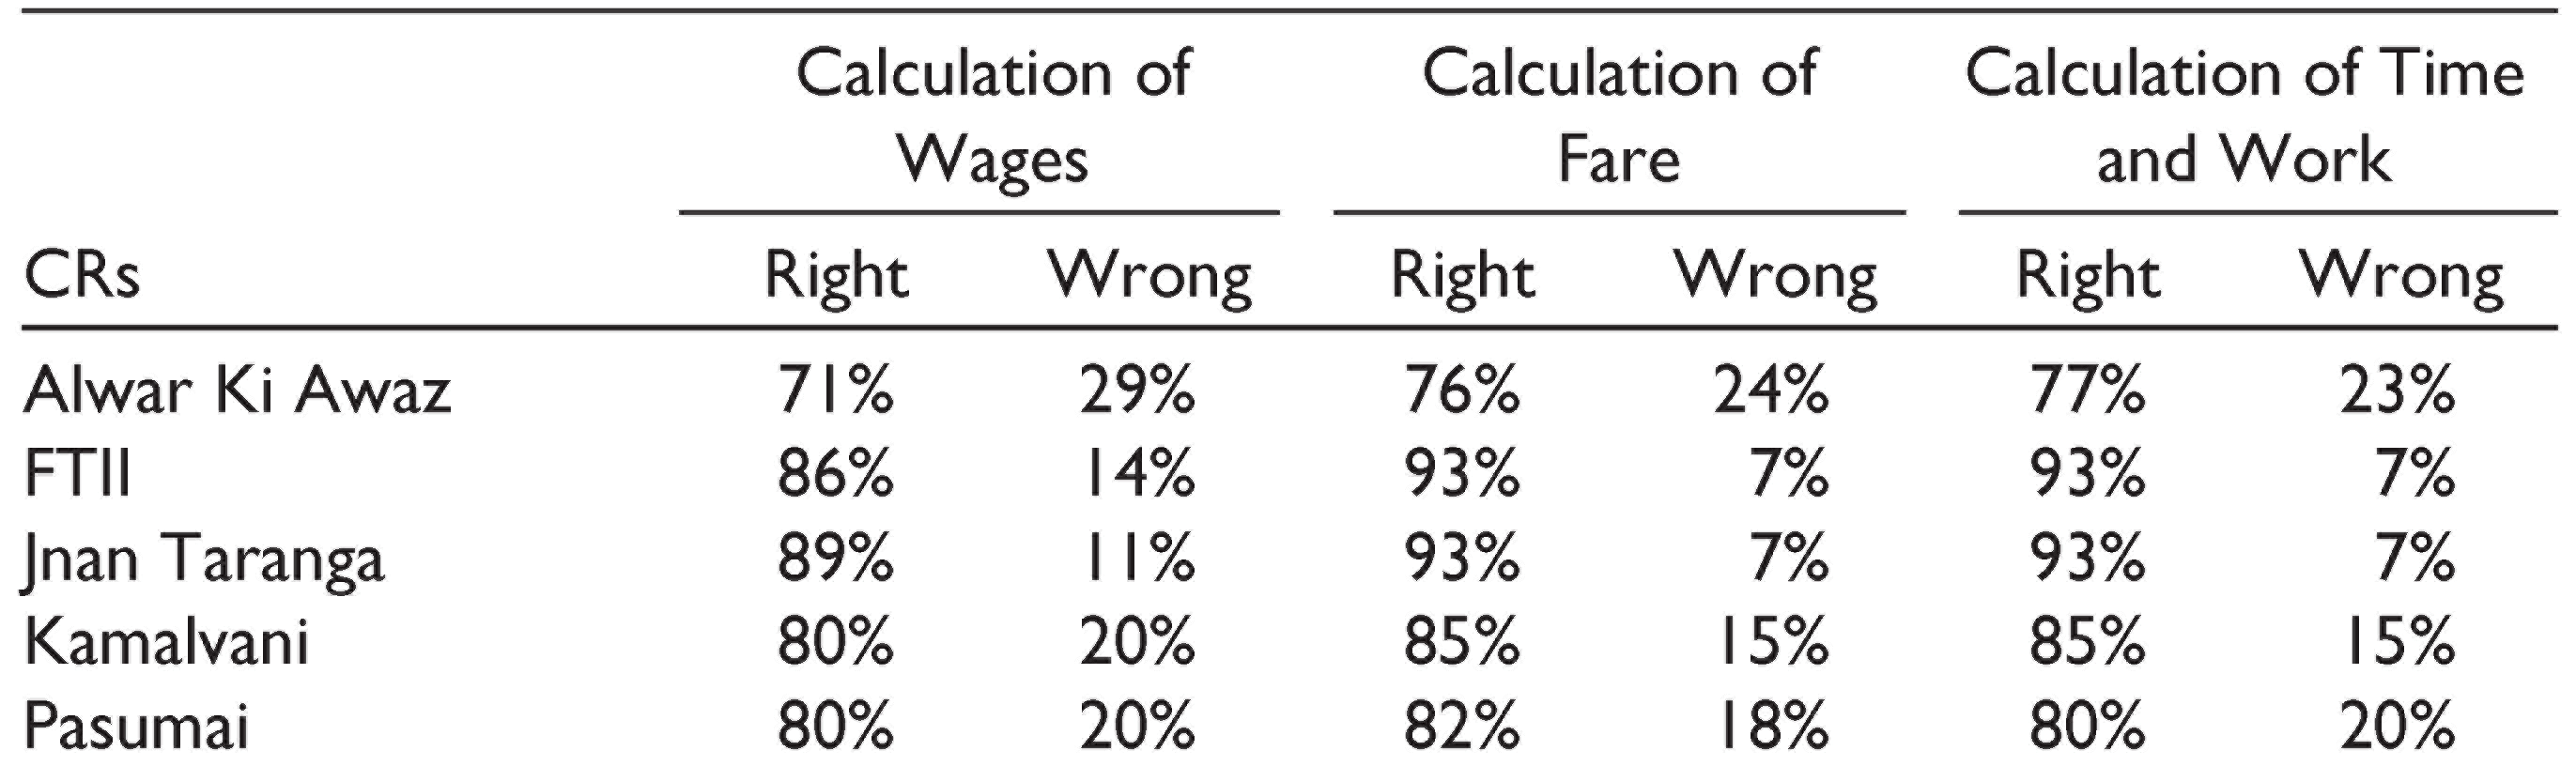
Table 7 shows that when the respondents were asked questions with regard to the calculation of wages, fare, time and work, most of the respondents in each of the CRs replied correctly, though in the case of certain CRs, the results were not very encouraging. In regard to the question on calculation of wages, which was ‘If the daily wage of a person is 130 rupees, how much does he earn in eight days?’, only 3 stations recorded more than one-third incorrect answers. These were: Jana Dhwani (45%), followed by Popcorn (40%) and JIMS VK (36%). With regard to calculation of fare, which was ‘If a person spends 50 rupees a day on auto fare, how much does he spend in 6 days?’ respondents in only 2 CRs recorded more than one-third incorrect answers. These were: CR Vanya (42%), followed by Popcorn (34%). In the case of questions on time and work, which was ‘If a woman stitches three dresses in a day, how many can she stitch in four days?’, the respondents of only one CR, Vanya, recorded more than one-third incorrect answers, which was 45 per cent.
Level of Ease in Everyday Calculation

Level of Ease and Competence in Solving Simple Addition and Subtraction-based Problems

Level of Ease and Competence in Solving Application-based Multiplication Problems

Calculation of Percentage, Discount and Interest
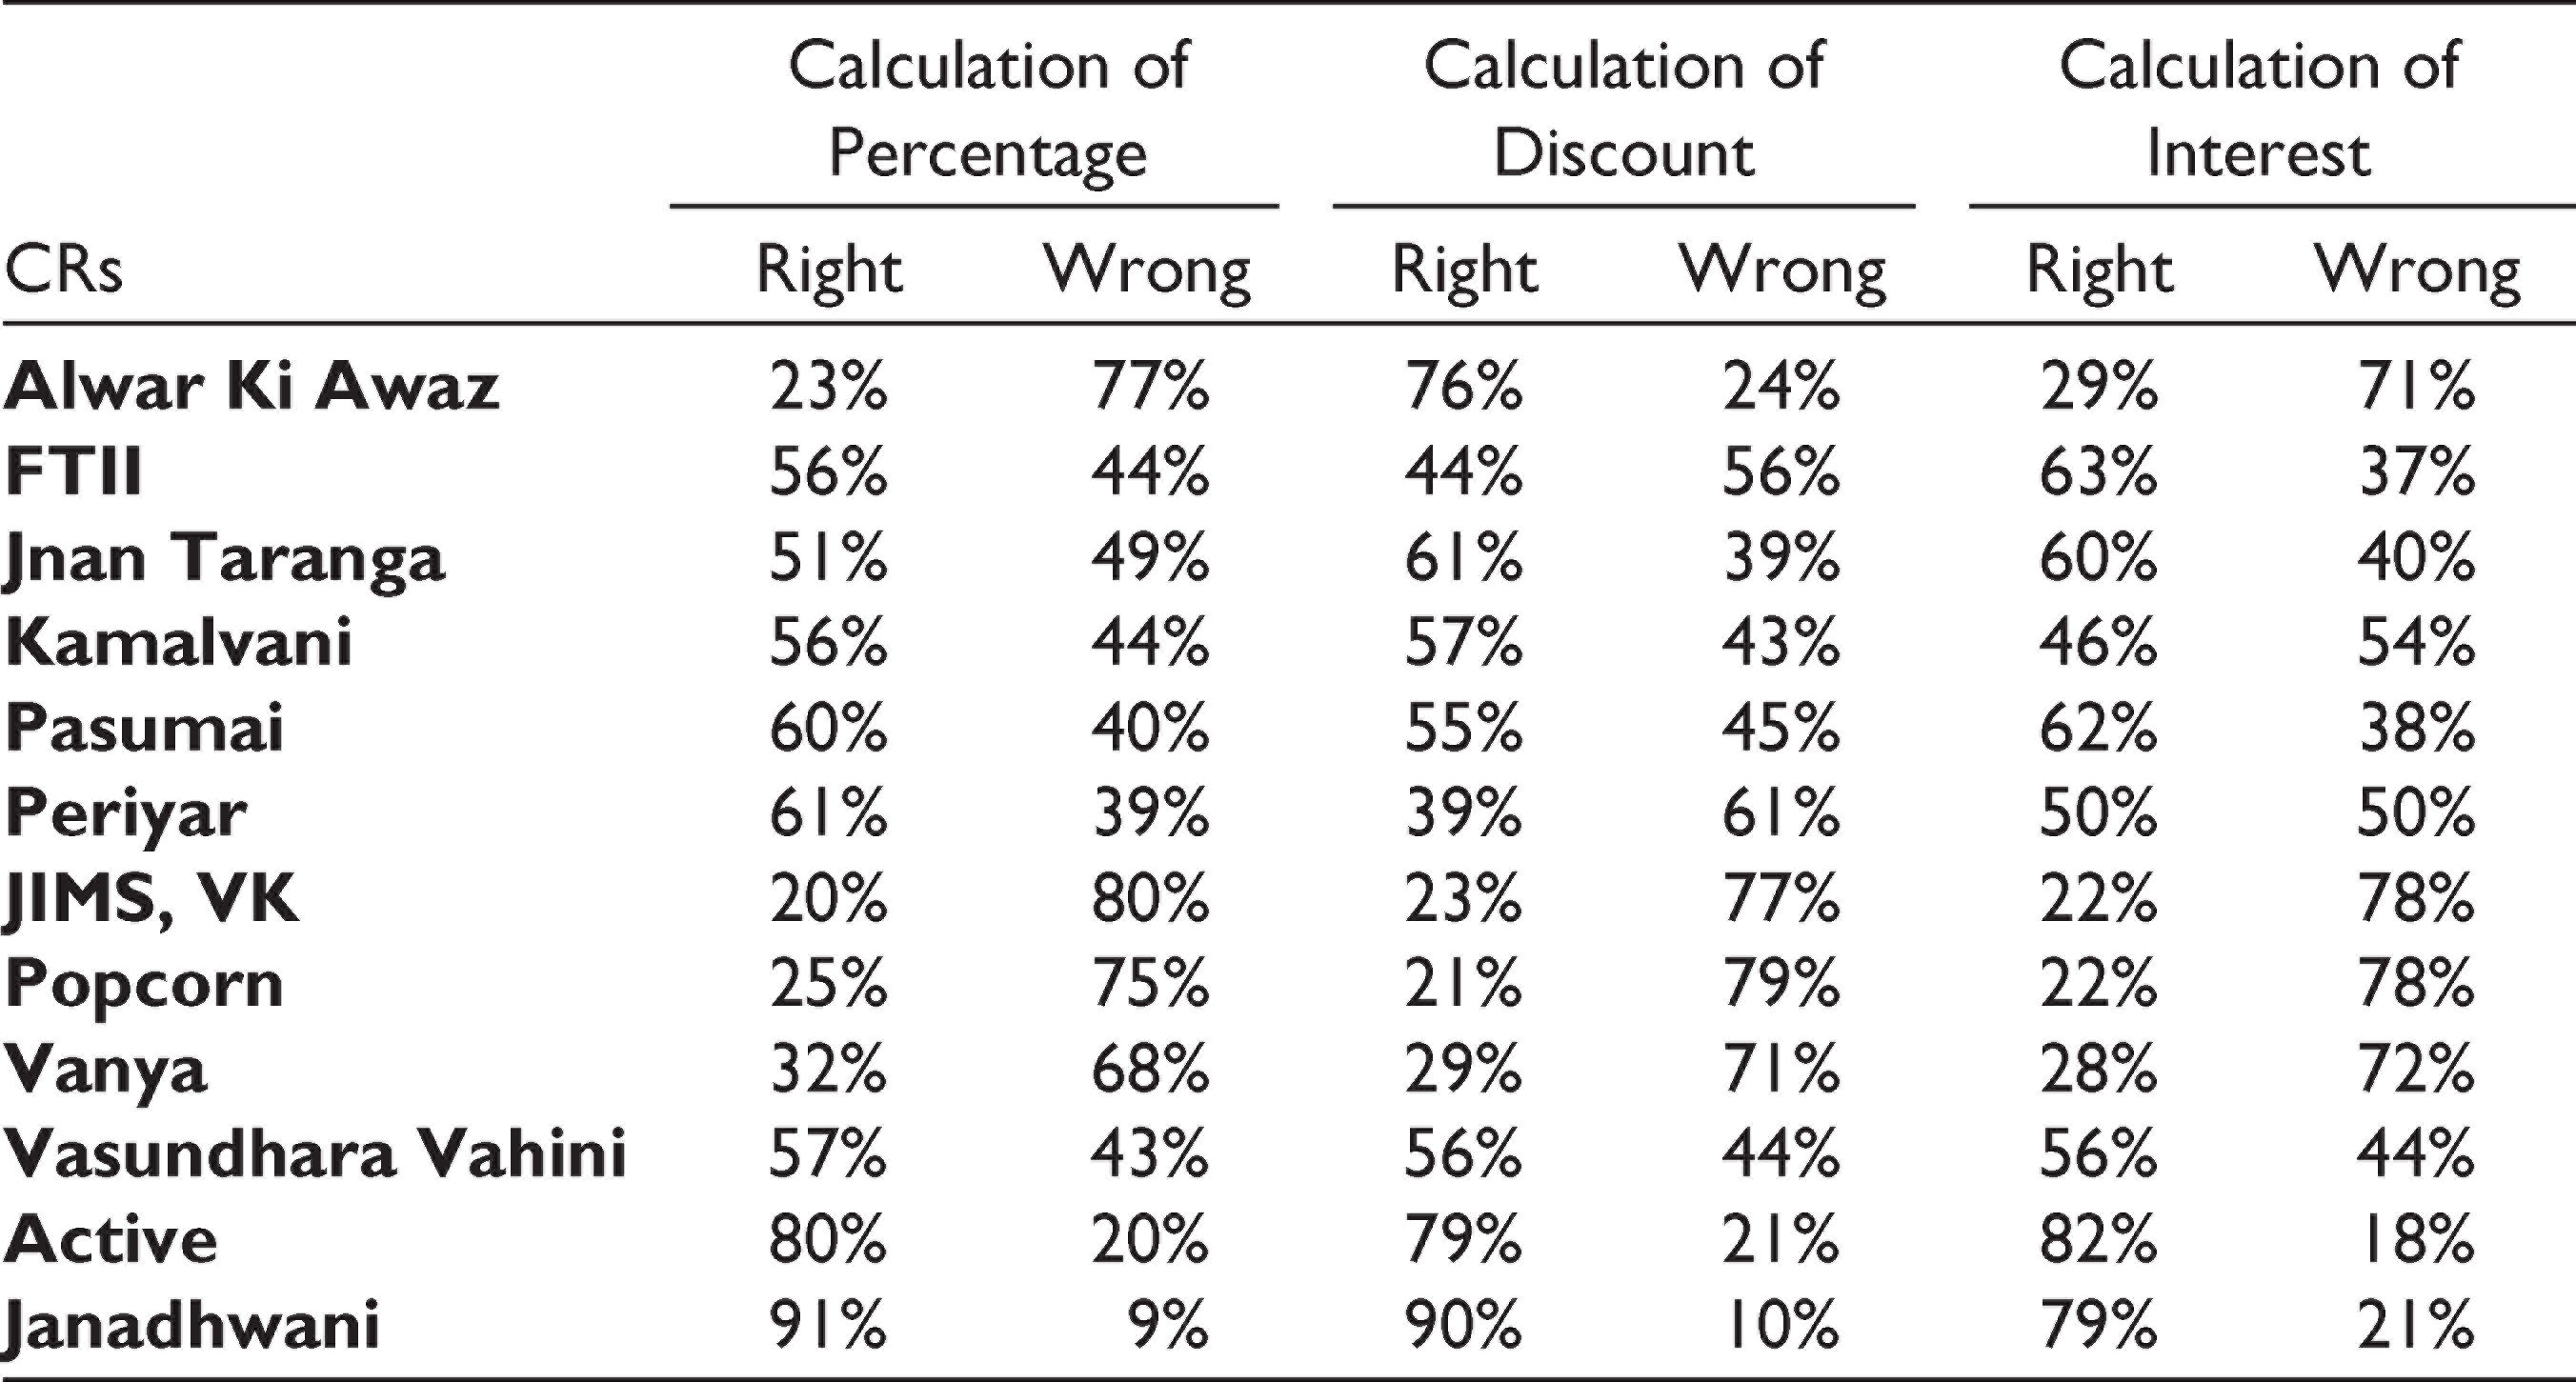
In sharp contrast with the responses to the questions discussed in the previous section, Table 8 presents the responses of the respondents to the questions involving calculation of percentage, discount and interest, which were incorrect in an overwhelmingly large number of cases. With the exception of Jana Dhwani, where the incorrect responses recorded to the question on calculation of percentage was of the order of 9 per cent, the incorrect responses recorded in CRs JIMS VK were the highest (80%) followed by Alwar Ki Awaz (77%) Popcorn (75%), Vanya (68%), Jnan Taranga (49%), FTII and Kamalvani (44% each), Vasundhara Vahini (43%), Pasumai (40%), Periyar (39%) and Active (20%). Respondents in five CRs came up with more than 50 per cent incorrect responses to questions on calculation of discount. While the highest percentage was recorded by Radio Popcorn (79%), it was followed by Radio JIMS (77%), Vanya (71%), Periyar (61%) and FTII (56%). Similarly, when it came to calculating interest, either half or more than half of the respondents in six CRs could not give a correct answer. These were CRs: JIMS VK and Popcorn (78% each), Vanya (72%), Alwar Ki Awaz (71%), Kamalvani (54%) and Periyar (50%). The inability of a large section of respondents across all the CRs to solve mathematical problems with slight complexity drives home the need for improving the mathematical literacy of the people in these areas.
Calculation of Percentage, Calculation of Discount and Calculation of Interest
Conversion from Foot to Inches and Time Conversion
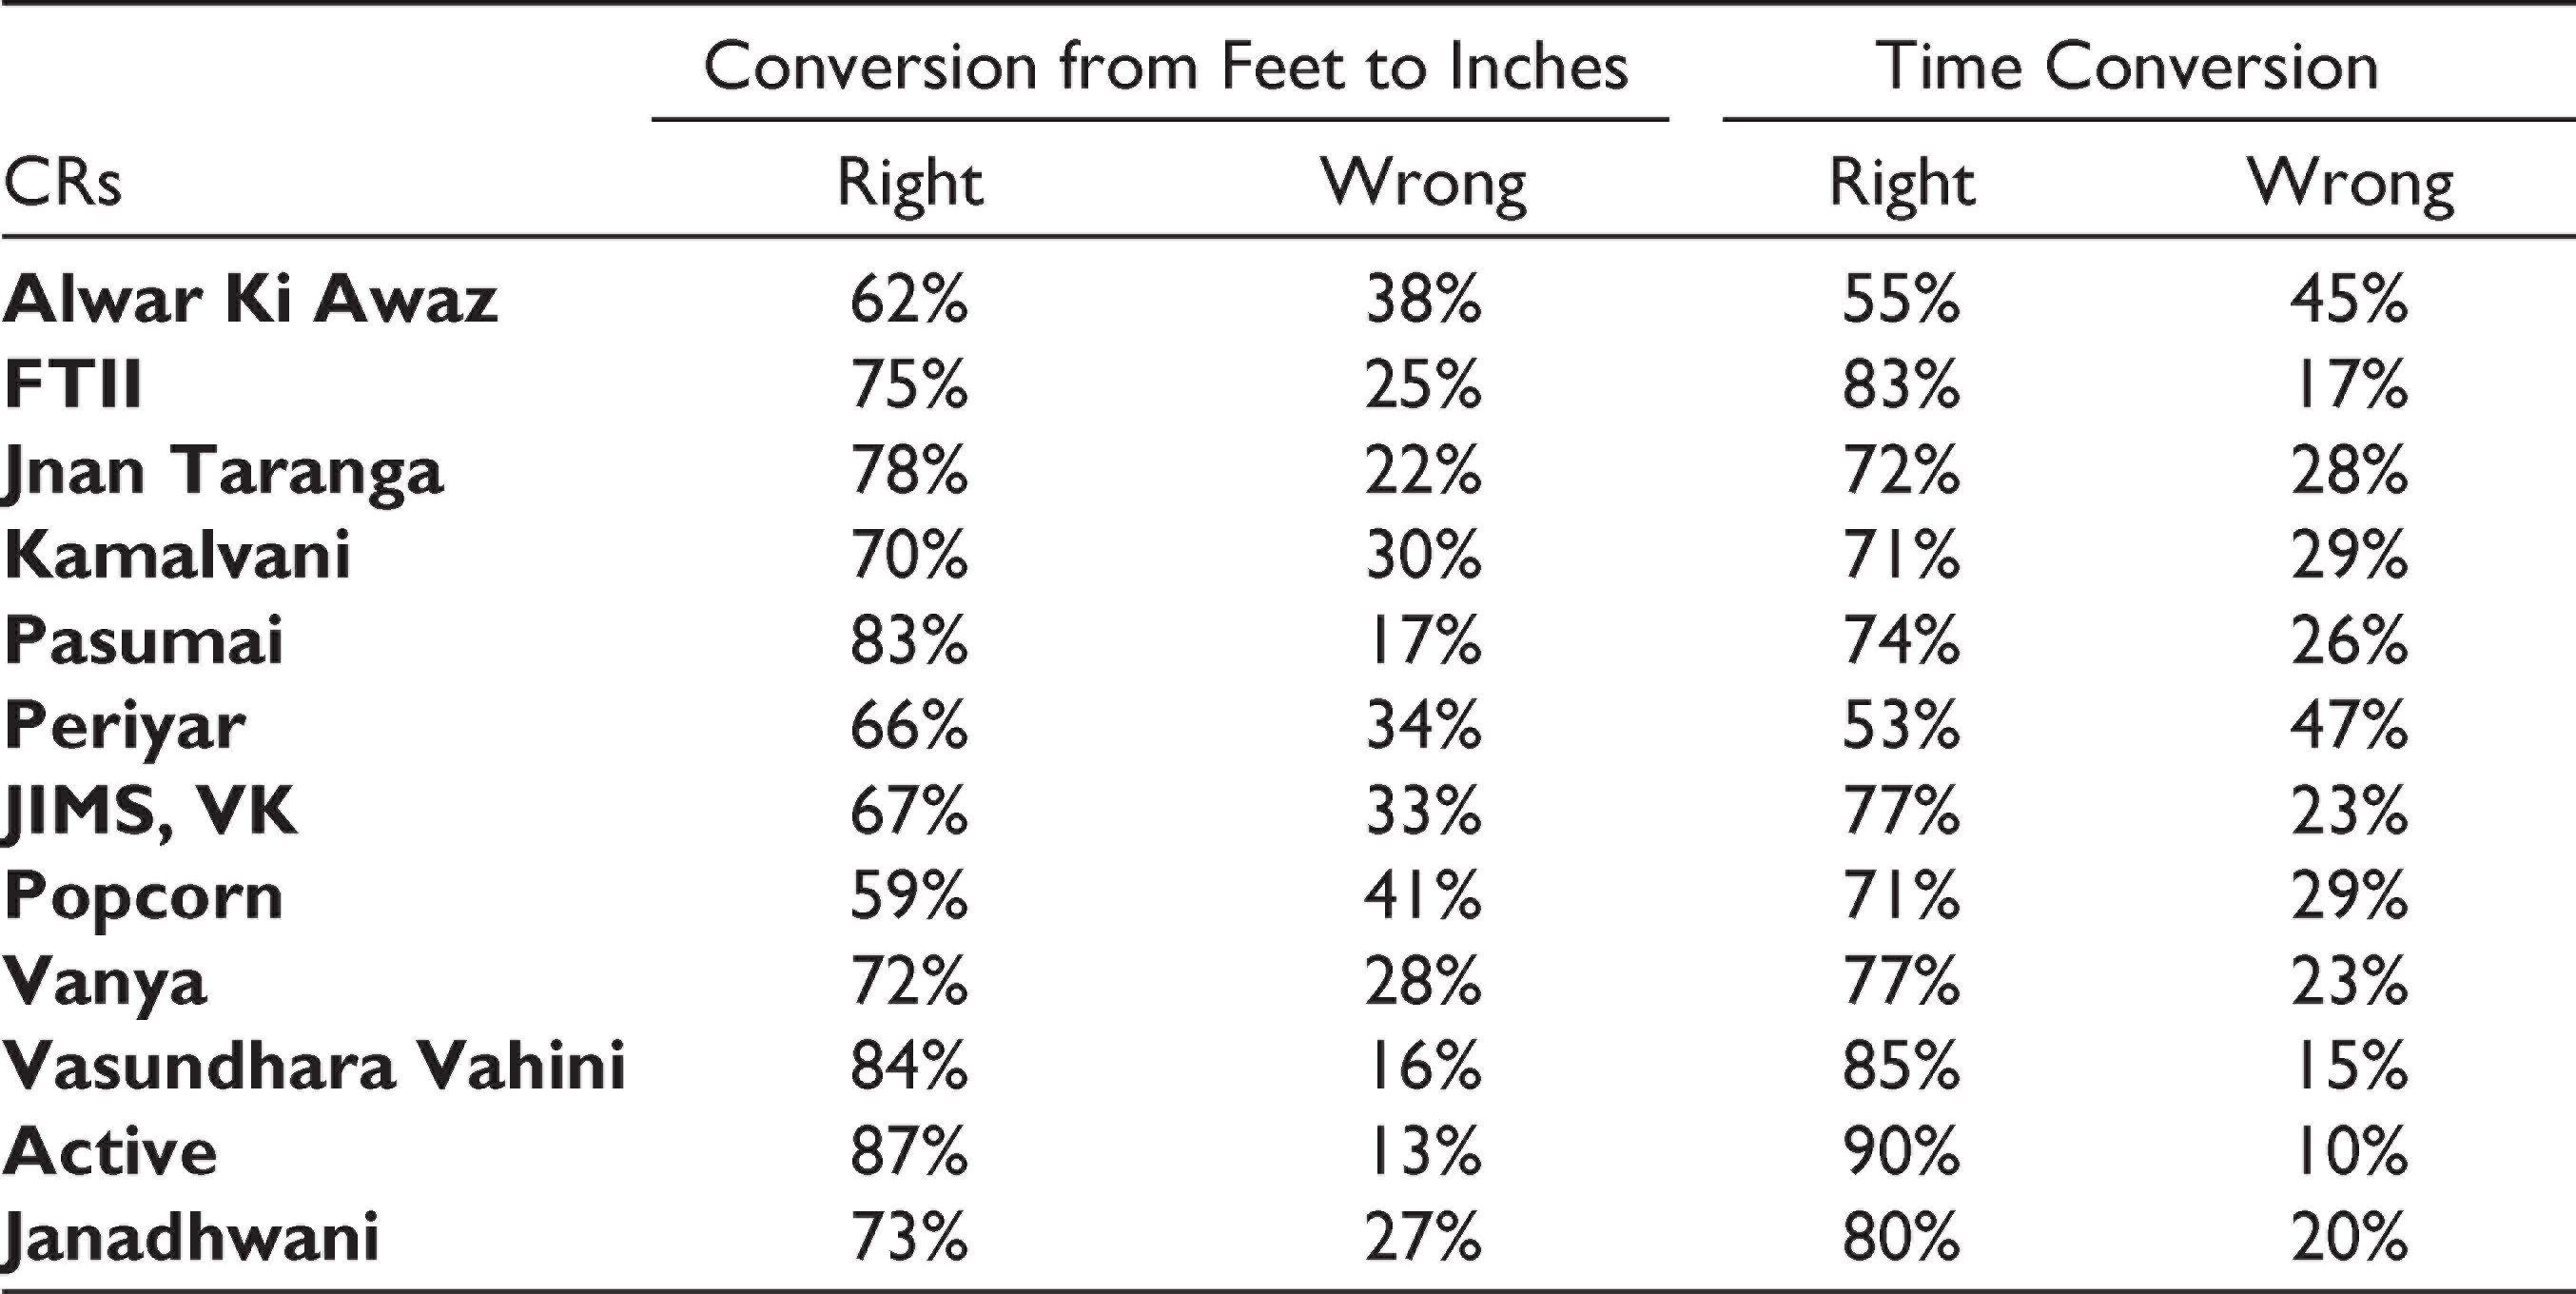
The other everyday mathematical problems on which the respondents’ mathematical competence was tested were conversions of units of distance and time. The inaccurate responses to the conversion of the units of measuring distance ranged from 41 per cent recorded in CRs Popcorn to 13 per cent in Active, with four stations registering more than one-third inaccurate answers. These were: Alwar ki Awaz (38%), Periyar (34%) and JIMS VK (33%), other than Popcorn. For conversion of time from a 24-h format to a 12-h format, the highest percentage of respondents who were not able to give the right answer was seen in CRs Periyar (47%) and lowest in Active (10%), as shown in Table 9.
Conversion from Foot to Inches and Time Conversion
The observation of the method employed by the respondents to solve the questions showed that despite possessing a pen/pencil or a calculator (on their phones), they did not know how to apply a method or the logic behind the calculation. Clearly, the mathematical skills of the respondents were too inadequate to help them confront everyday situations involving the use of basic mathematical knowledge.
Feeling of Being Cheated Because of Low Mathematical Ability
Often, the awareness of their own lack of knowledge comes to the surface when one feels cheated or exploited as a result of not being able to calculate correctly. Hence, the question to the respondents was whether they had felt cheated at any time. This awareness also often fuels the need to learn.
The analysis as per Table 10 shows that an overwhelming percentage, more than 60 per cent, of respondents in 7 of the 12 community radio stations admitted that they had felt cheated at one time or the other because of their inability to calculate correctly. A majority of them cited ‘during shopping or purchasing’ as the time when they had ‘felt cheated’. The problems faced at the time of shopping included inability to calculate big amounts, getting the wrong amount of change from shopkeepers or giving extra money to them by mistake. Some also mentioned being cheated by employers. Being cheated or exploited, as the respondents admitted, was not just about money and calculation. It carried with it an underlying emotion of ‘feeling ashamed’ and ‘feeling bad’ due to the inability to calculate correctly.
The mapping of mathematical skills among the listening audiences of the 12 community radio stations shows that their basic numerical ability is far from desirable from the point of its requirement for everyday personal and professional purposes. Besides, the survey reveals that many of them also feel embarrassed about their inability to cope up with situations that call for these skills. Hence, there is a strong need to bolster their skills and also their confidence so that their participation in the national economy may be mainstreamed. In view of the extensive reach of the mass media, it could be employed for the purpose.
Feeling of Being Cheated Because of Low Mathematical Ability
Mapping of Radio Listening Behaviour
As radio has the highest penetration and the maximum reach, it is one of the most suitable mass media for reaching out to such audiences. Besides, as it has easy access both by way of cheap radio sets and/or mobile phone app, it is appropriate for delivering messages to audiences from economically weaker sections. However, with a view to assessing the suitability of the medium for making mediated educational interventions for these audiences, the survey sought responses to map their radio listening behaviour.
Radio Listenership
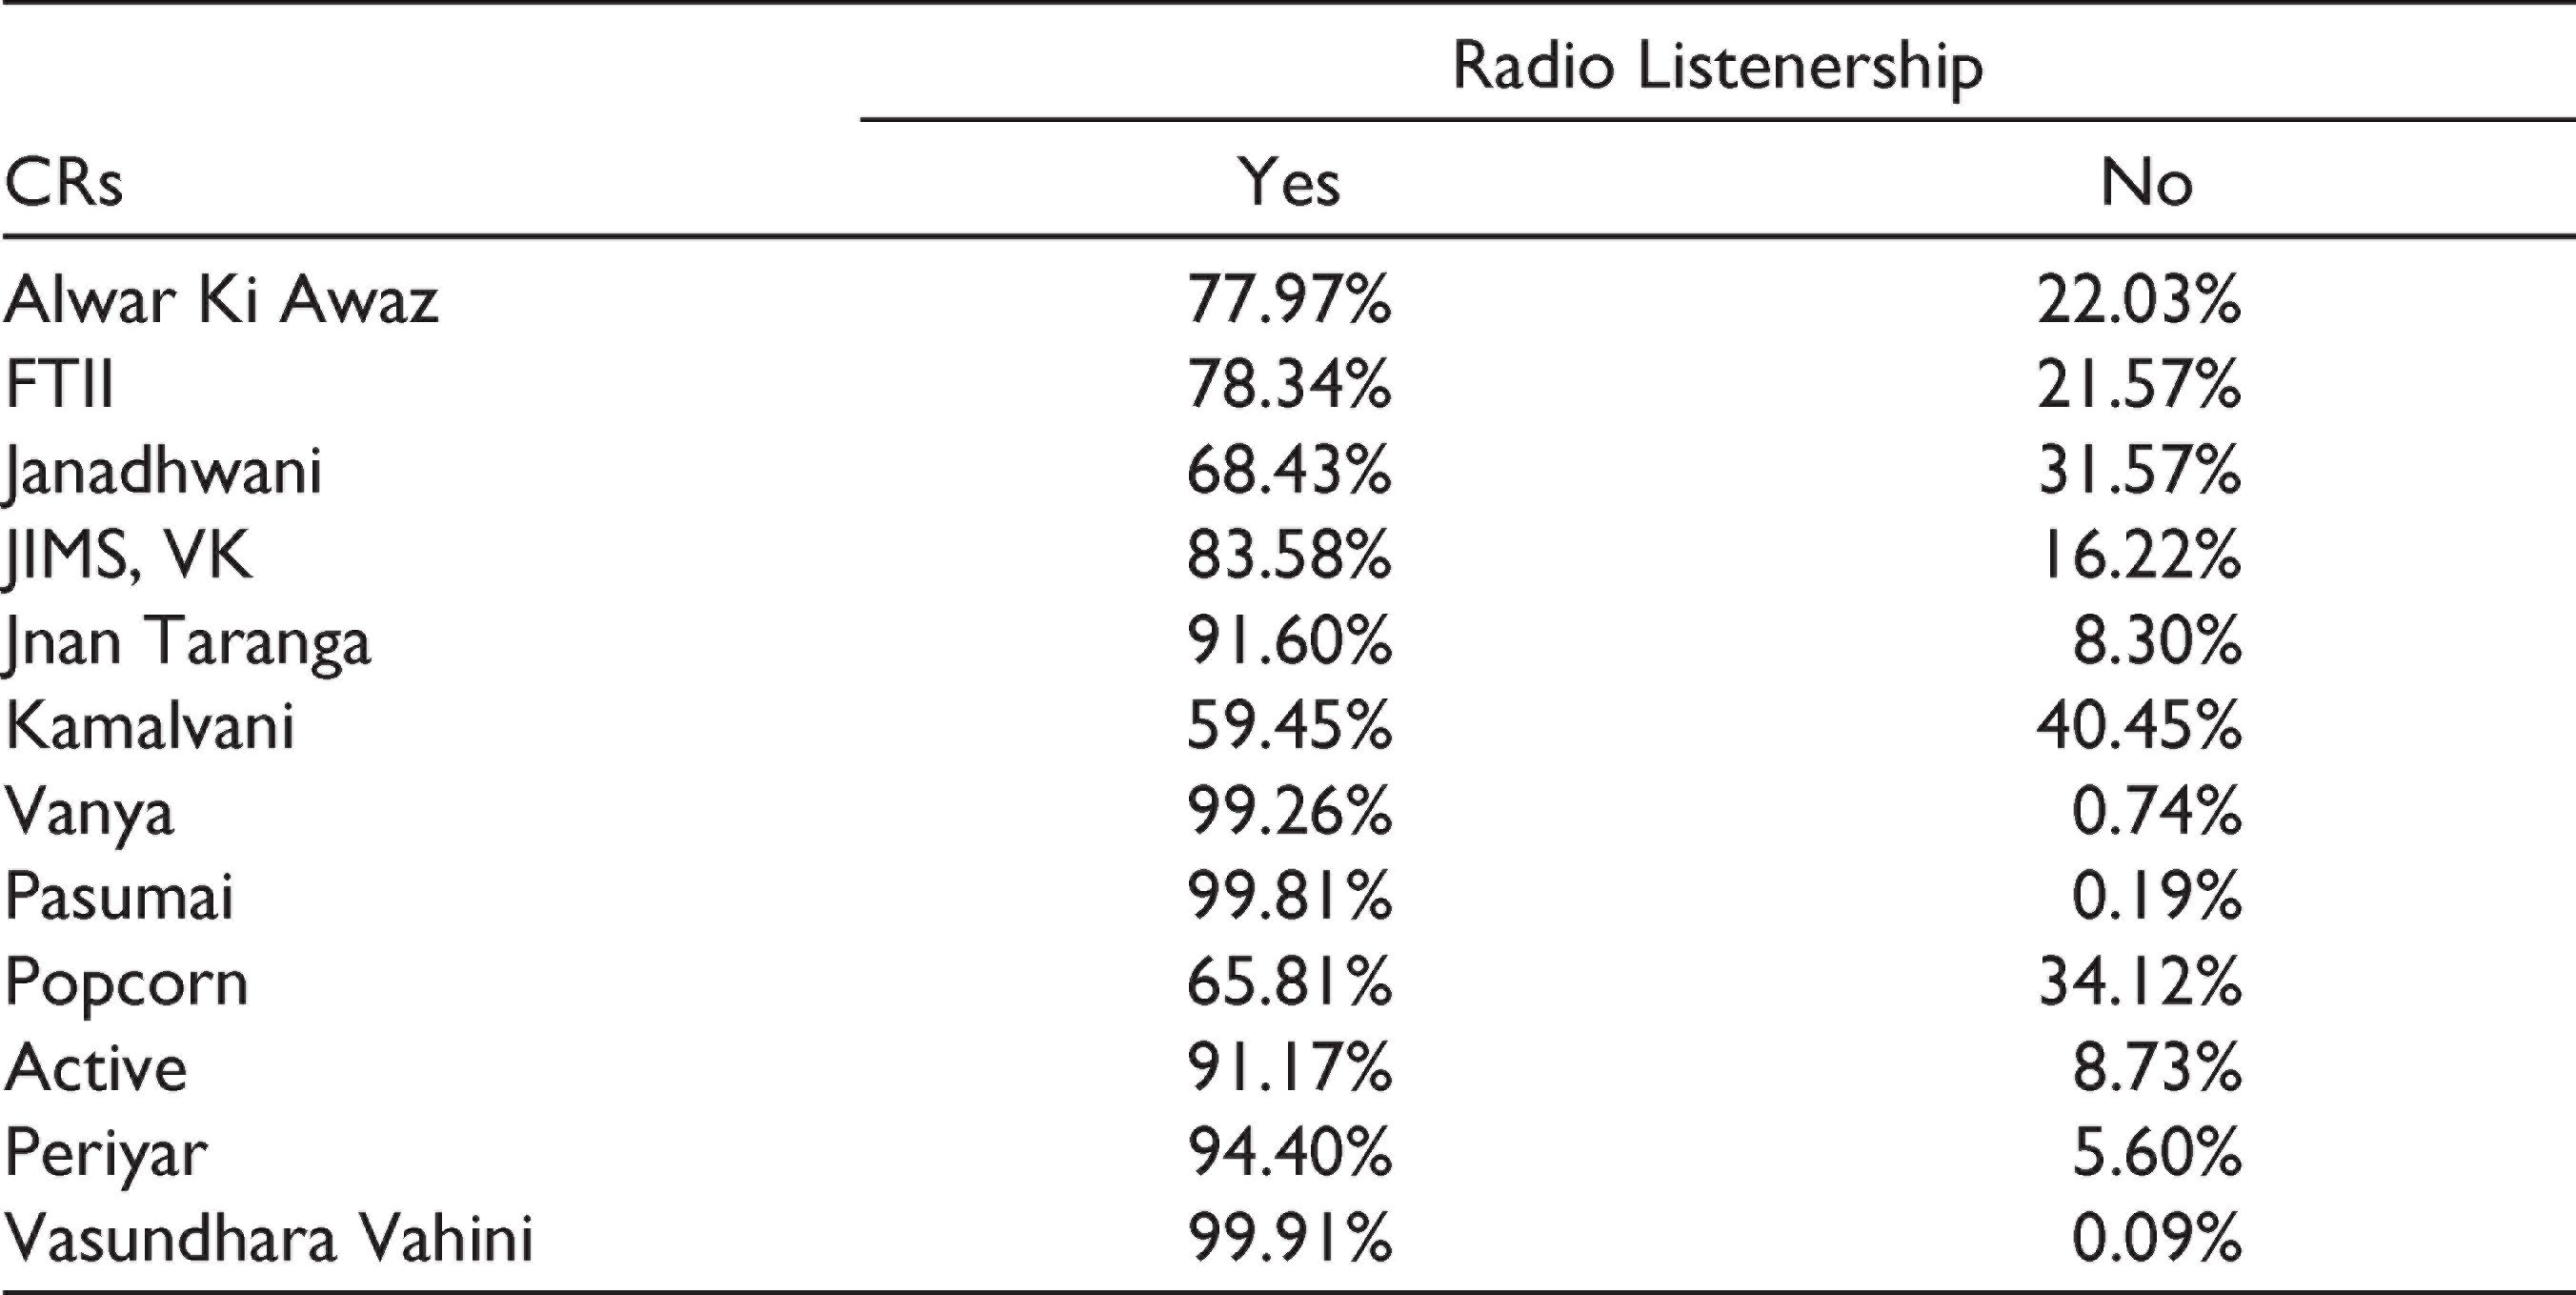
Table 11 shows that from among the sample of respondents, those who listened to radio programmes in each of the 12 CRs ranged from 59.45 per cent in the case of Kamalvani to 99.91 per cent in the case of Vasundhara Vahini. With such high listenership percentage figure, CRs could squeeze in and gain the attention of the communities for the purposes of delivering their specific messages to them.
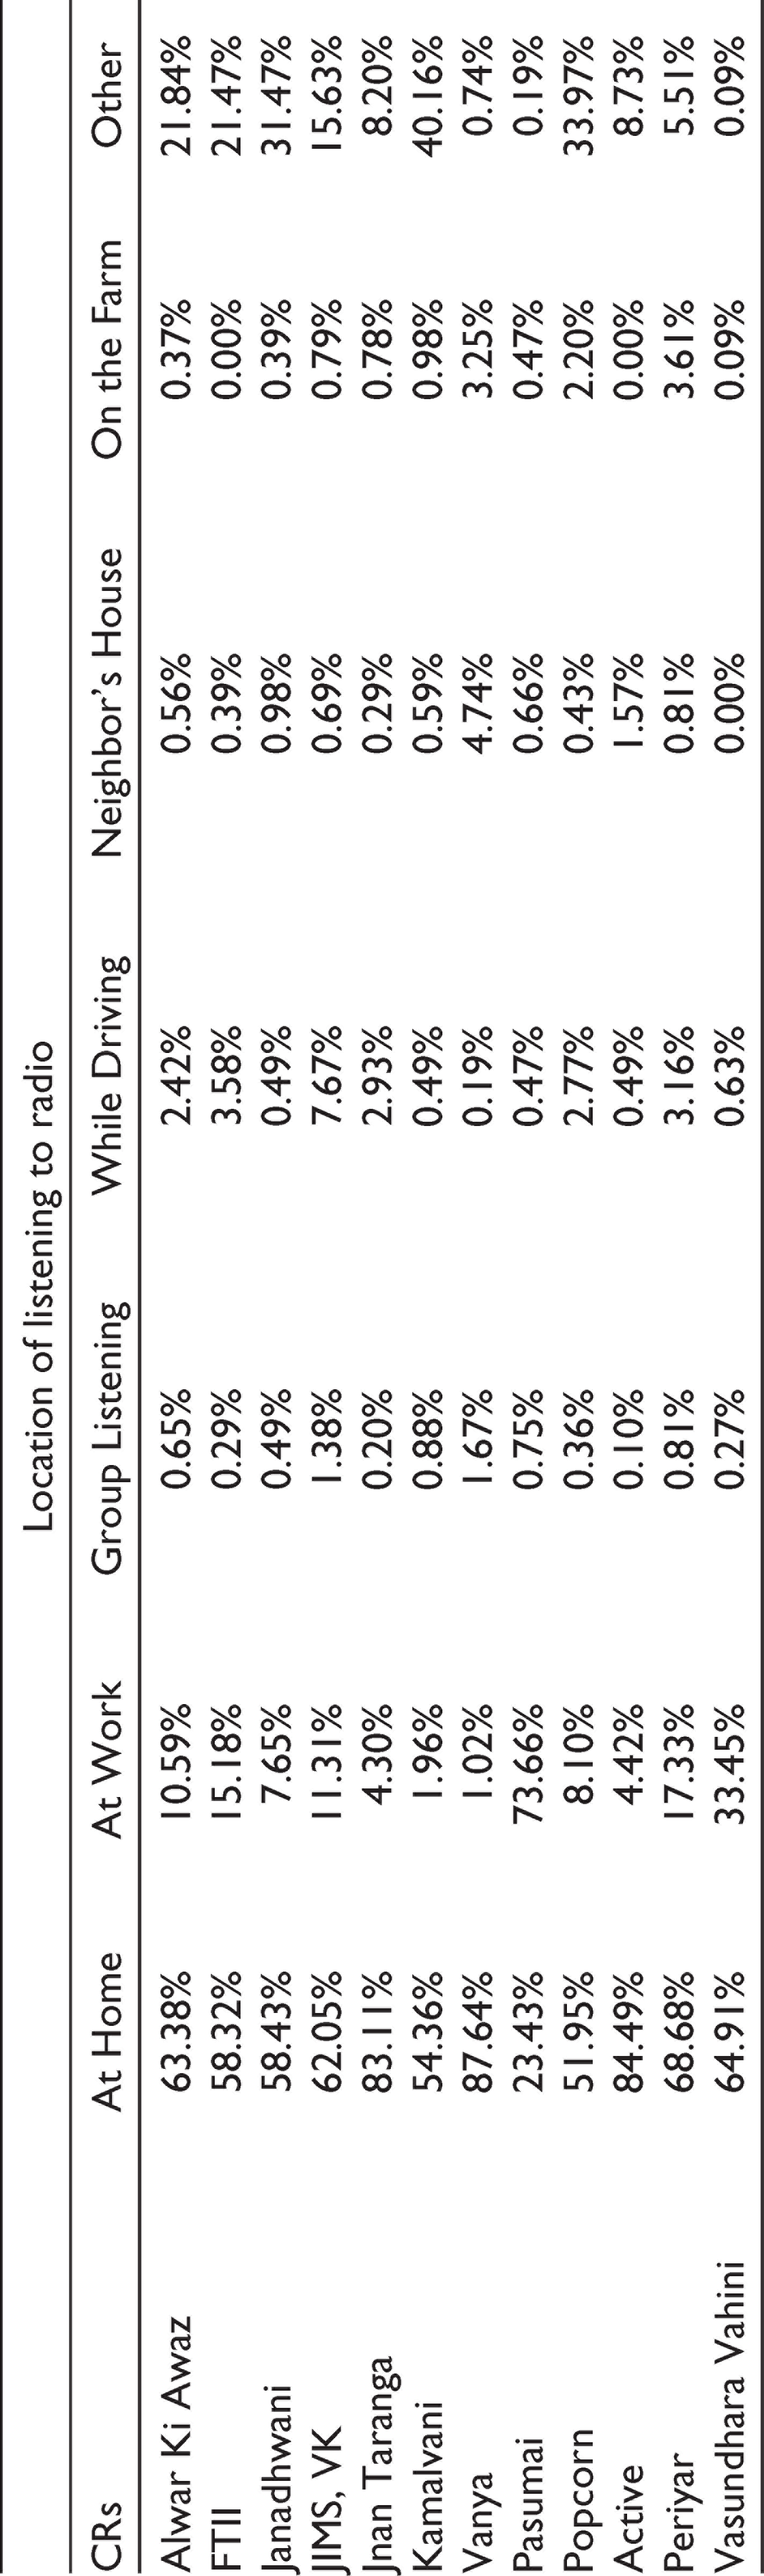
Location of Listening to Radio
The place(s) where the listeners access the radio programmes is important insofar as it indicates the level of engagement/attention the radio programme is able to command from its listeners. The survey revealed that across all community radio stations, as shown in Table 12, the respondents preferred to listen to radio at home instead of any other location. The only exception was Pasumai where 73.66 per cent of the respondents reported listening to radio while at work. The listenership of radio stations at home ranged from 51.95 per cent in the case of Popcorn to 87.64 per cent in the case of Vanya.
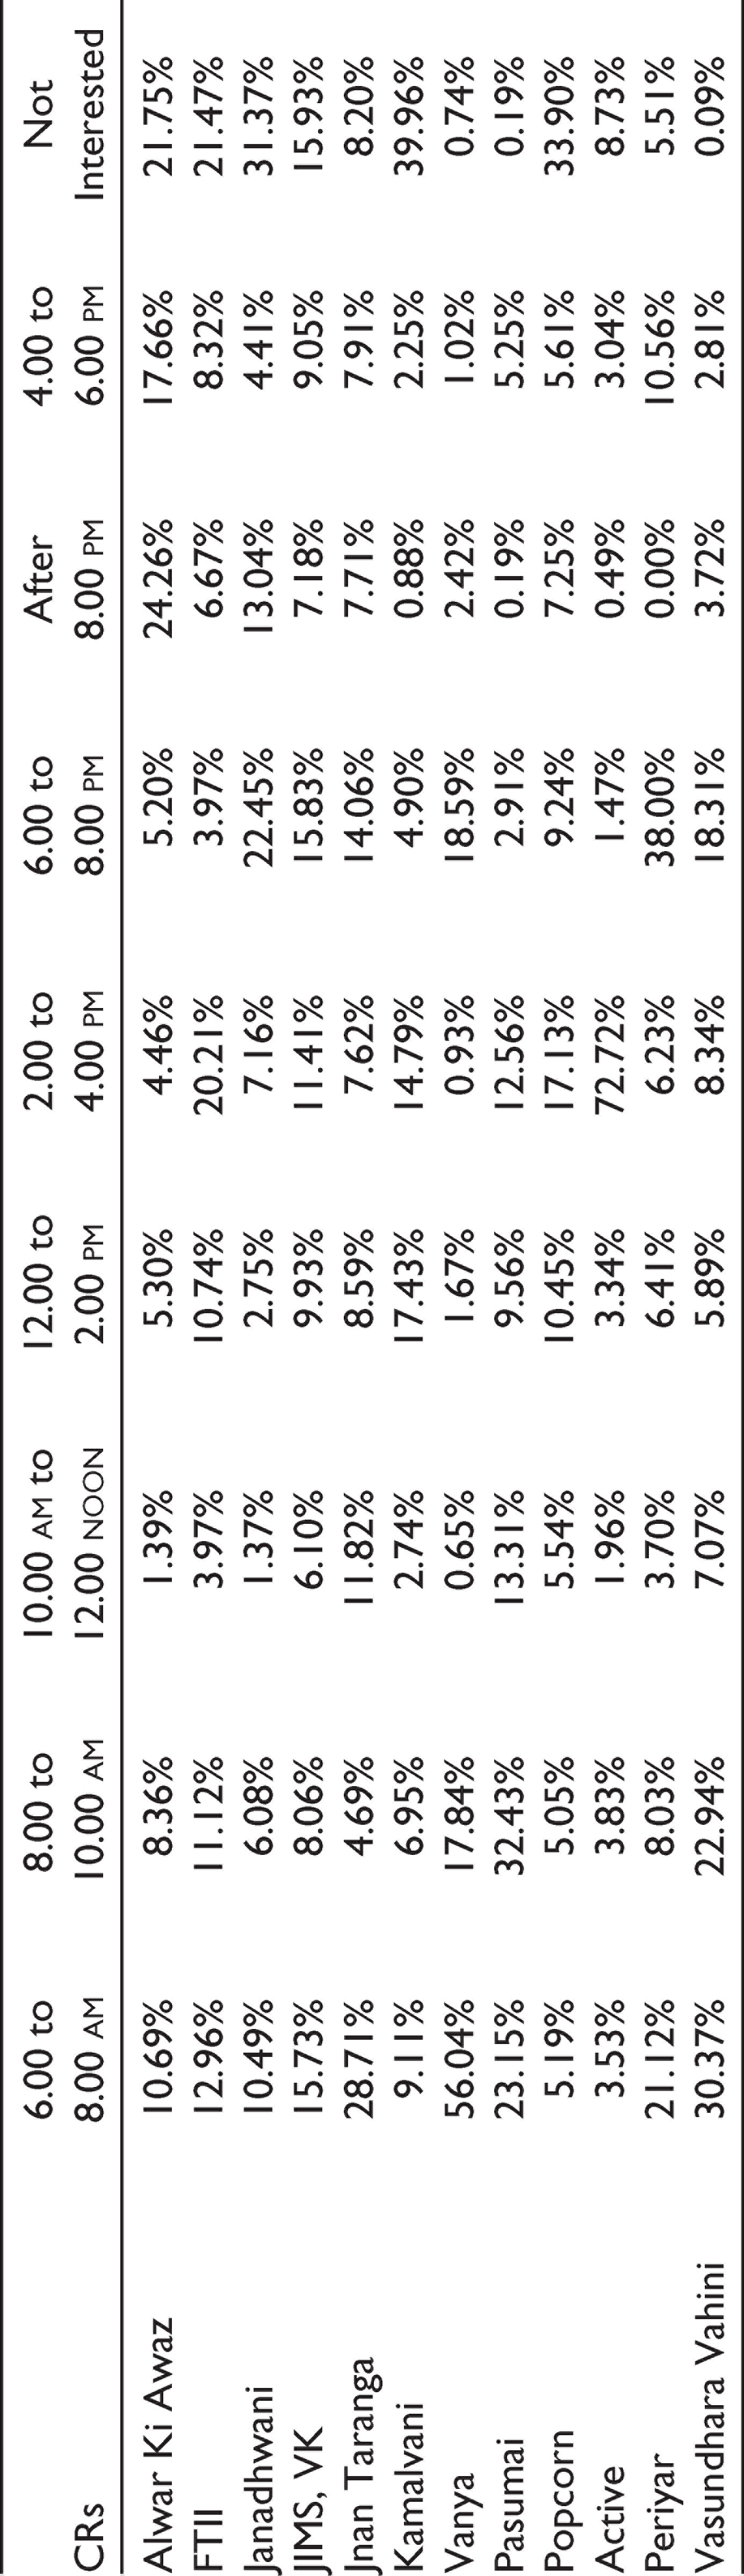
Time of Listening to Radio
Table 13 shows that the popularity of time slots varied from one CR to another. The three main time slots that listeners preferred in CRs, Alwar Ki Awaz were 0600 to 0800 h (10.69%), 1600 to 1800 hours (17.66%) and after 2000 hours (24.26%), in FTII were 0600 to 0800 hours (12.96%), 1200 to 1400 hours (10.74%) and 1400 to 1600 hours (20.21%), in Jana Dhwani 1800 to 2000 hours (22.45%), after 2000 hours (13.04%) and 0600 to 0800 hours (10.49%), in JIMS VK 0600 to 0800 hours (15.73%), 1400 to 1600 hours (11.41%)and 1800 to 2000 hours (15.83%, in Jnan Taranga 0600 to 0800 hours (28.71%), 1000 to 1200 hours (11.82%) and 1800 to 2000 hours (14.06%), in Kamalvani 0600 to 0800 hours (9.11%), 1200 to 1400 hours (17.43%) and 1400 to 1600 hours (14.79%), in Vanya 0600 to 0800 hours (56.04%), 0800 to 1000 hours (17.84%) and 1800 to 2000 hours (18.59), in Pasumai 0600 to 0800 hours (23.15%), 0800 to 1000 hours (32.43%) and 1000 to 1200 hours (13.31%), in Popcorn 1200 to 1400 hours (10.45%), 1400 to 1600 hours (17.13%) and 1800 to 2000 hours (9.24%), in Periyar 0600 to 0800 hours (21.12%), 1600 to 1800 hours (38.00%) and 1800 to 2000 hours (10.56%) and in Vasundhara Vahini 0600 to 0800 hours (30.37%), 0800 to 1000 hours (22.94%) and 1800 to 2000 hours (18.31), with the exception of Active where an overwhelming percentage of respondents (72.72) preferred 1400 to 1600 hours’ time slot.
Radio Listenership
Location of Listening to Radio
Time of Listening to Radio
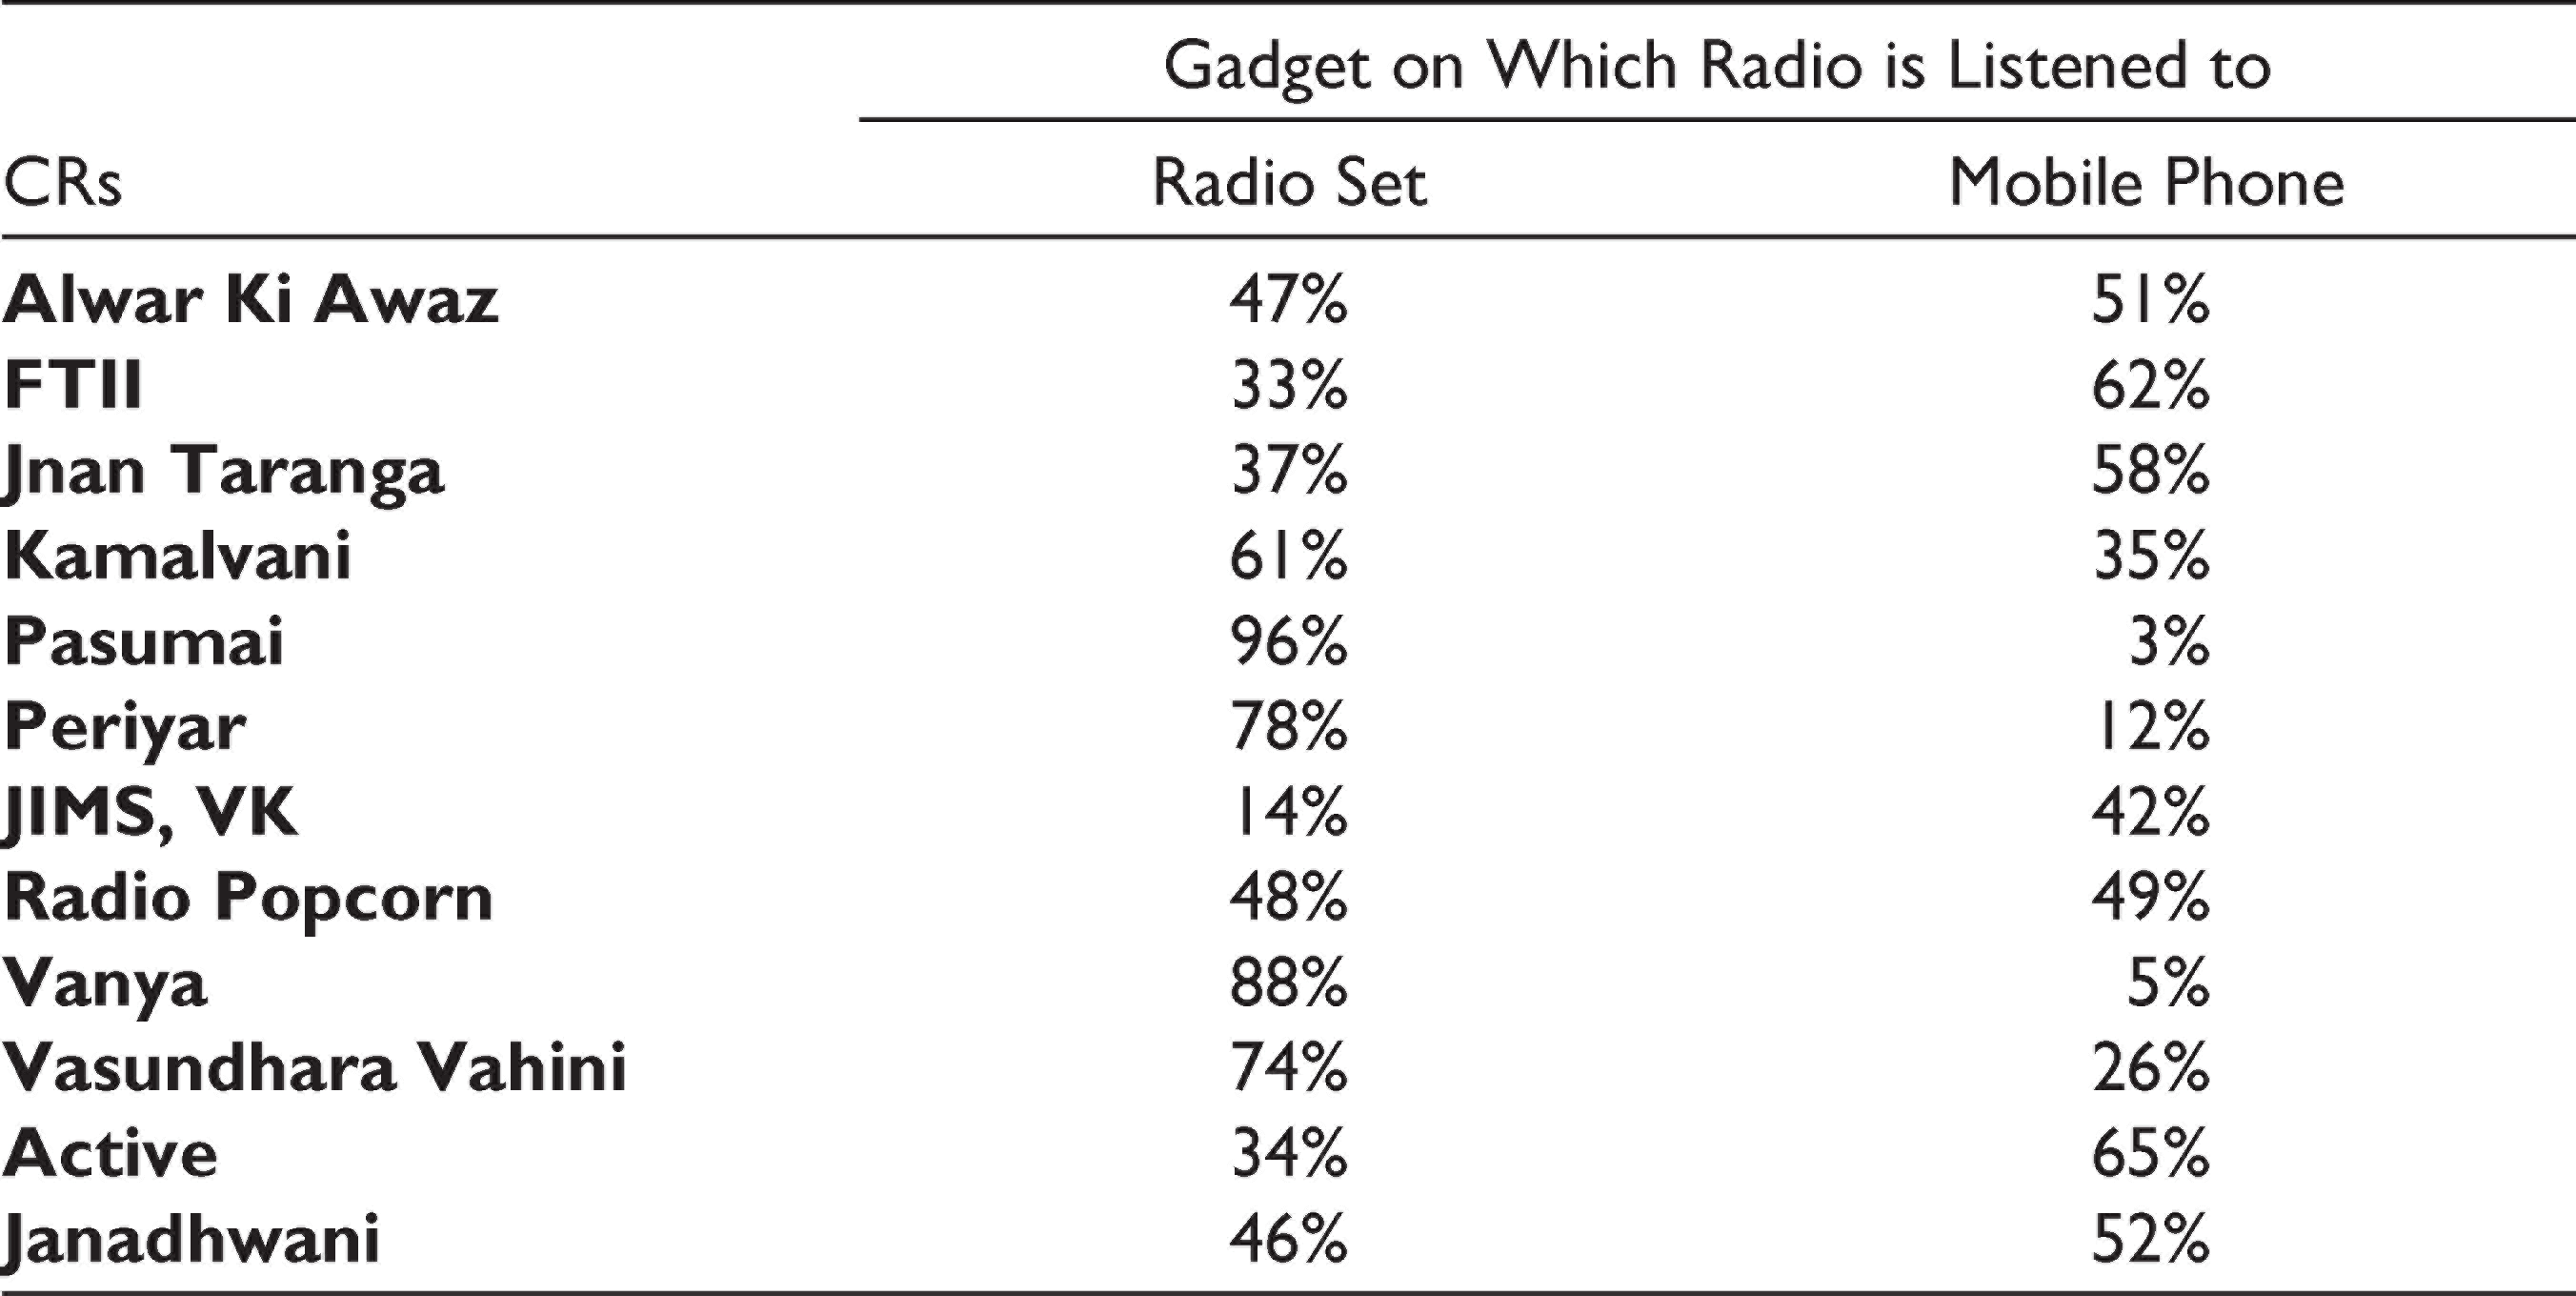
Instruments Used for Listening to Radio Programmes
Table 14 shows the instruments used for listening to radio programmes. Listeners in five community radio stations preferred to listen to radio programmes on traditional radio sets. Listeners in Kamalvani (61%), Pasumai (96%), Periyar (78%), Vanya (88%) and Vasundhara Vahini (74%) used traditional radio sets to listen to radio programmes. Listeners in seven other community radio stations preferred to listen to radio programmes on mobile phones. On the whole, the listeners are almost evenly divided between the uses of the two kinds of instruments, pointing to the inroads being made gradually by the new communication technology of mobile phones into their lives.
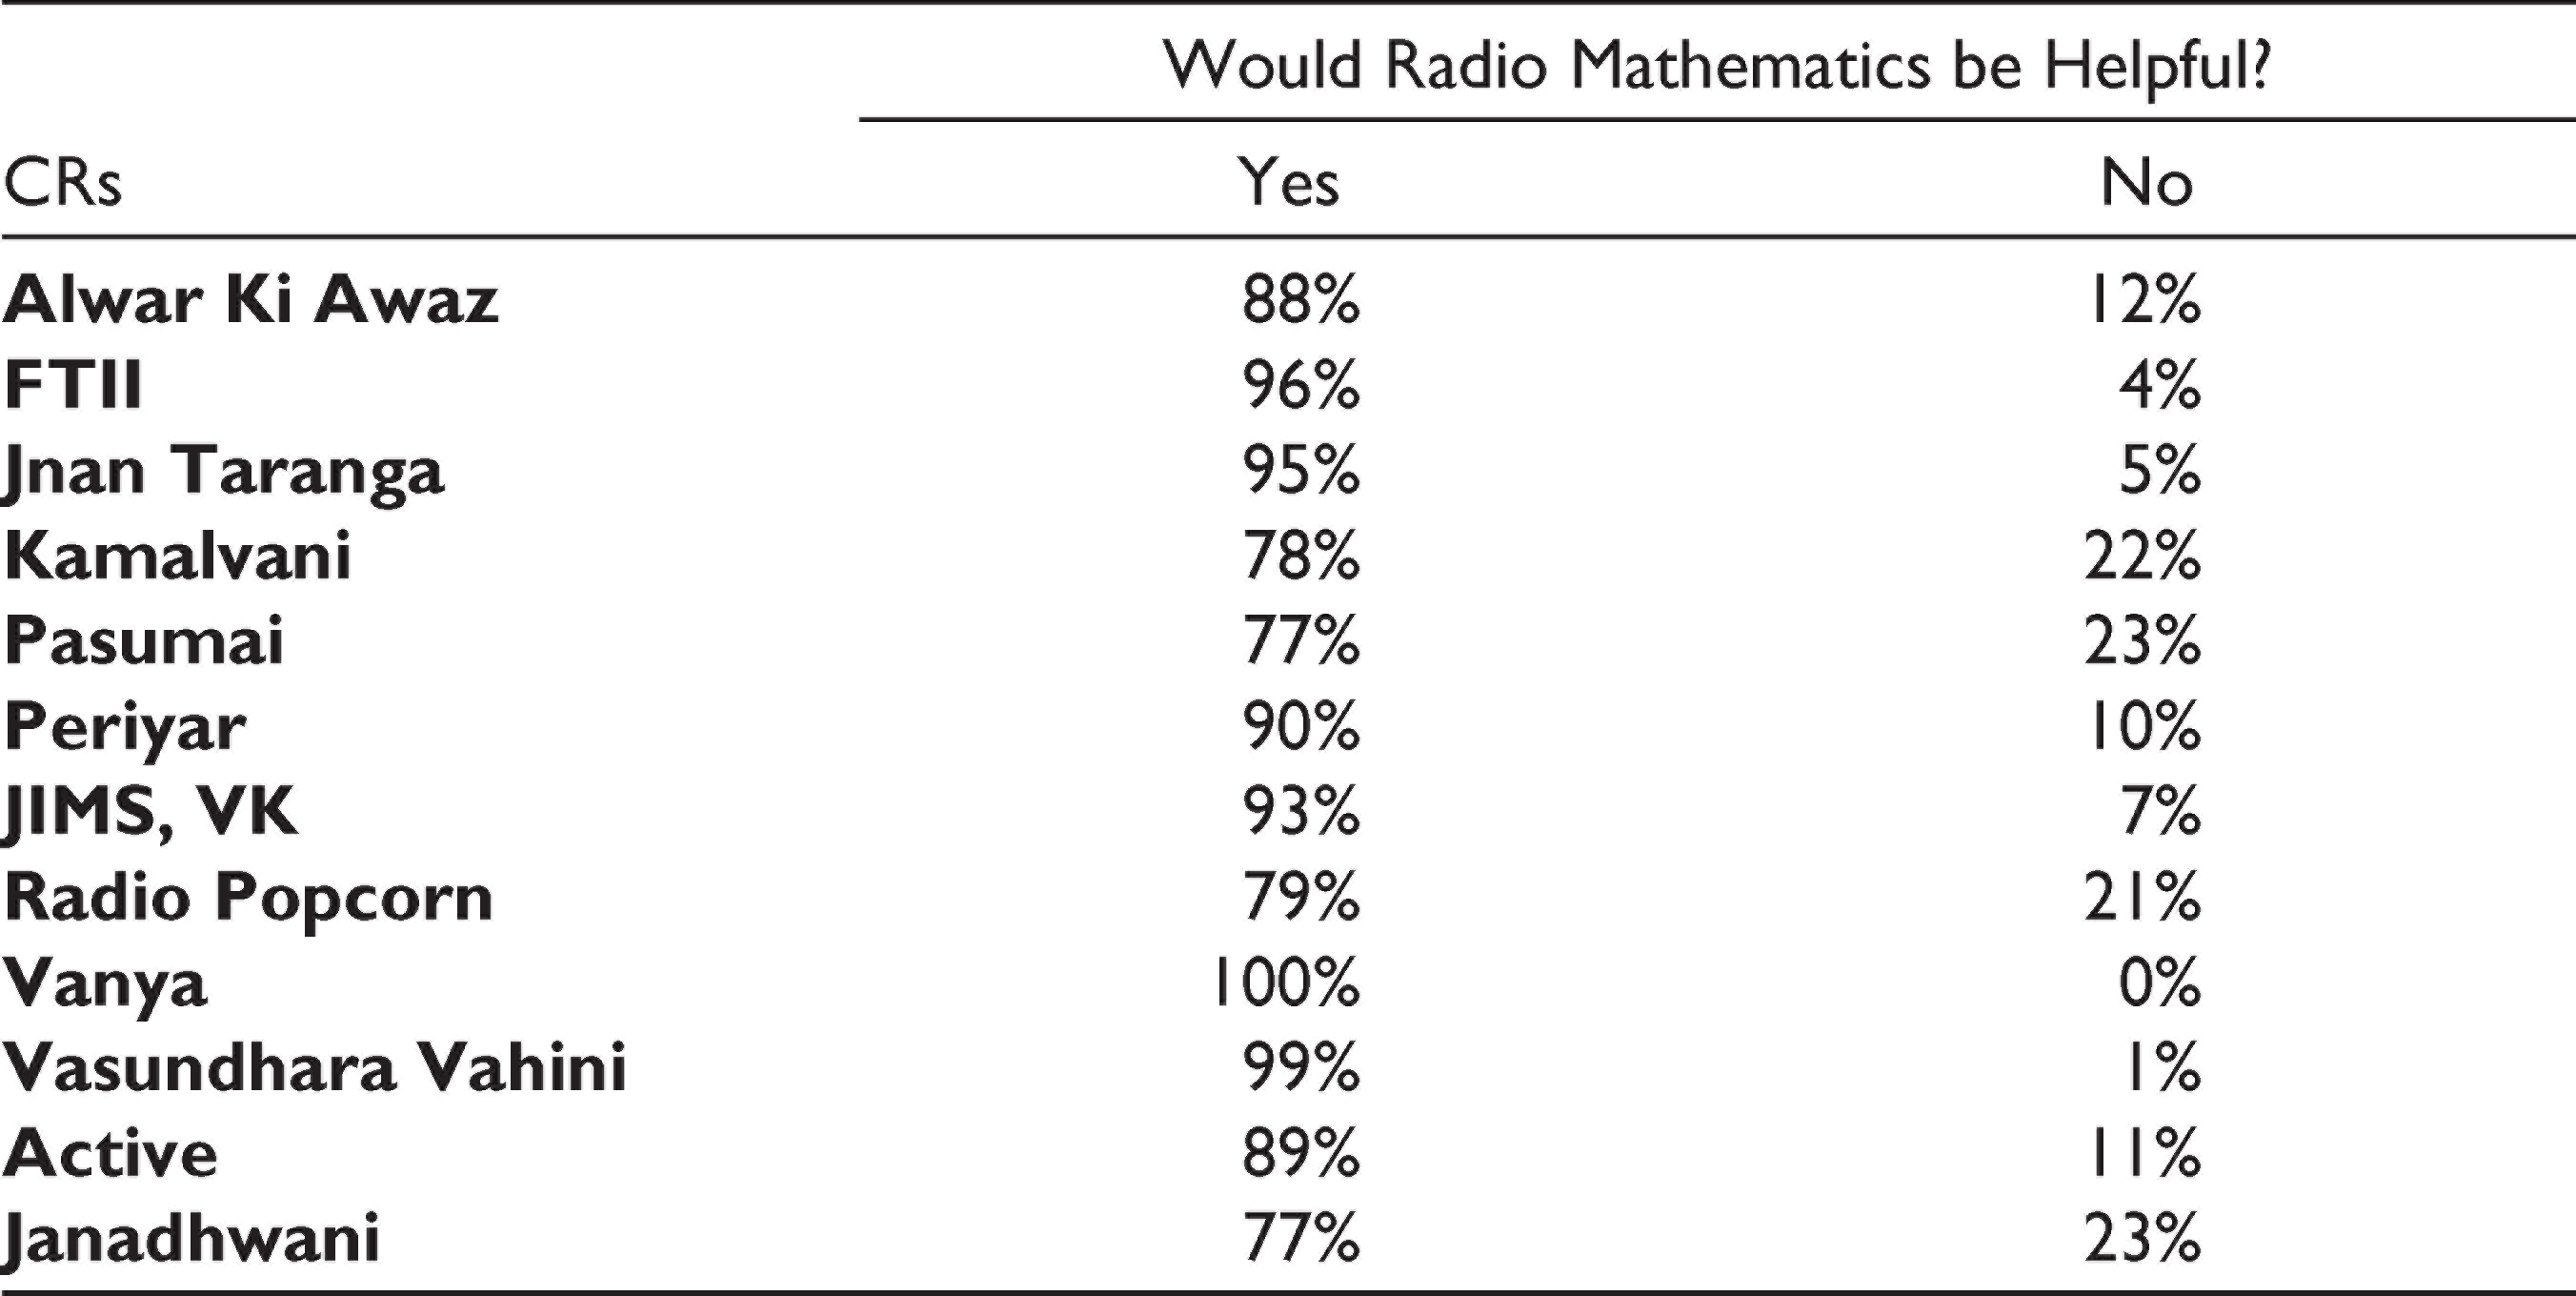
Perception of the Usefulness of Radio Mathematics
When asked if they felt it would be helpful for them to listen to the broadcast of Radio Mathematics programme, the response was overwhelmingly positive, as shown in Table 15. Their affirmative responses ranged from the high of 100 per cent in CRs Vanya to the low of 77 per cent in Pasumai and Active. With such clear enunciation of the need for an intervention like Radio Mathematics, it stood to reason that the project be launched in all the 12 community radio stations.
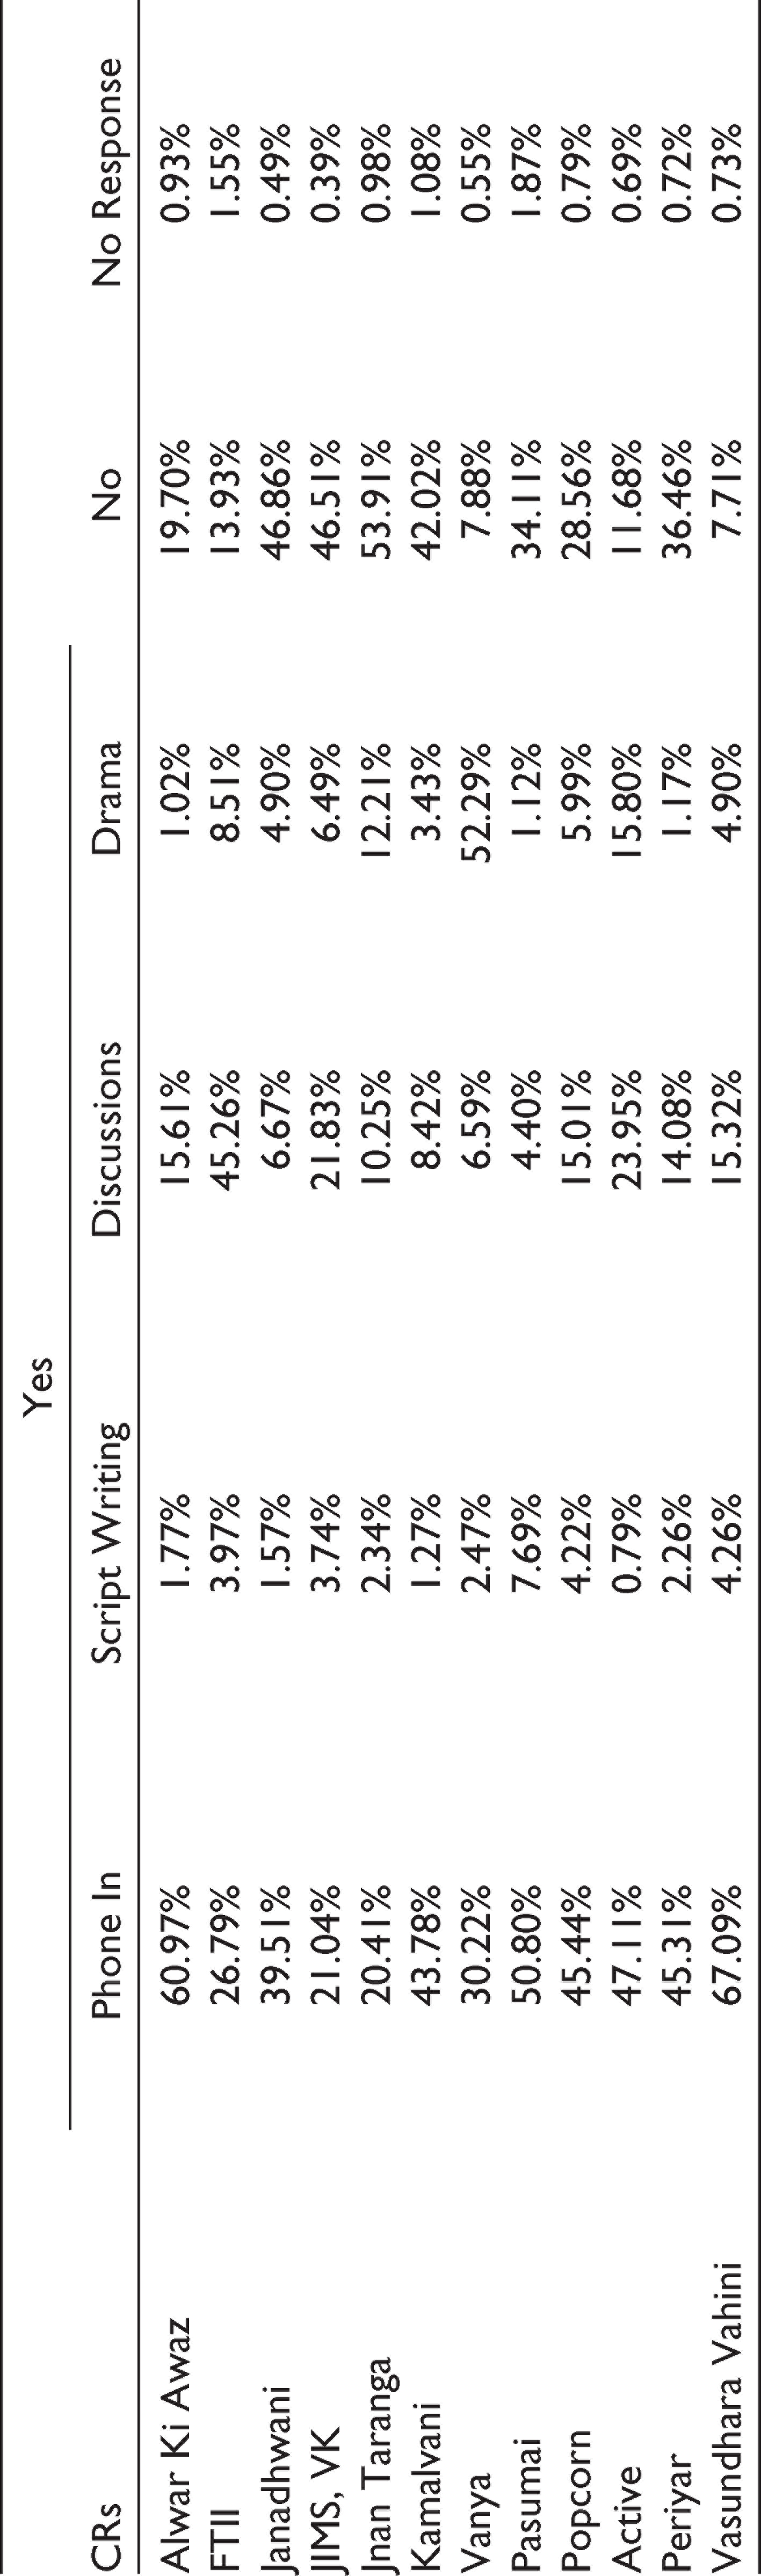
Listeners’ Willingness to Participate in Radio Maths Programmes
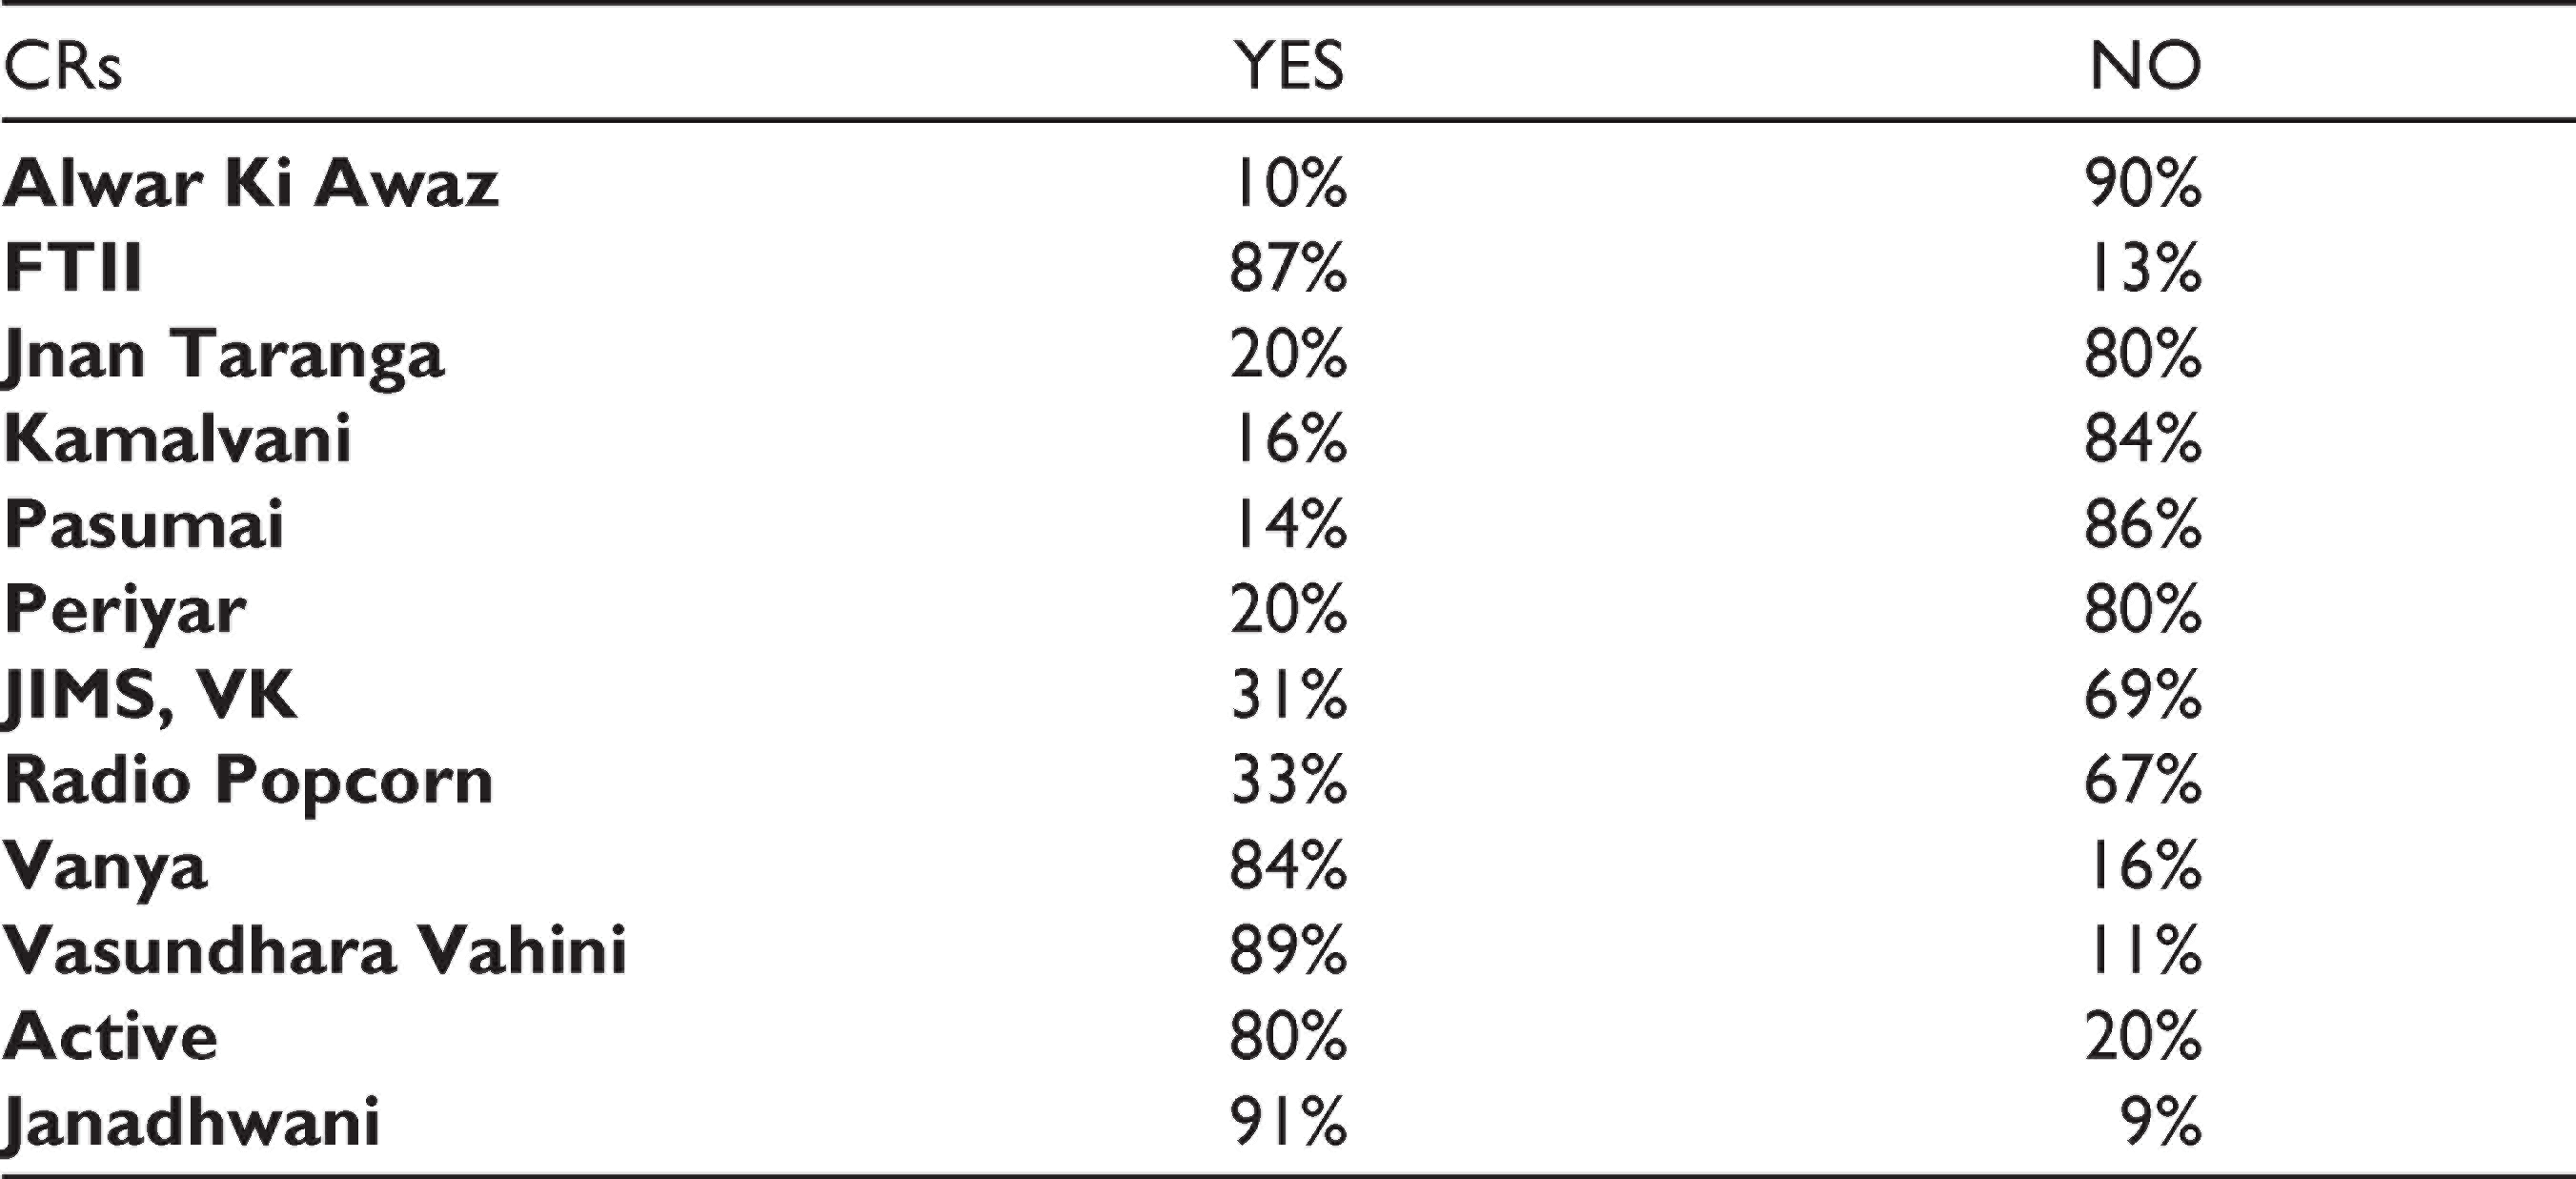
Table 16 shows the listeners’ willingness to participate in Radio Maths Programmes. When asked if they would be interested in participating in the production of Radio Mathematics programmes, the respondents in the 12 community radio station areas were divided in their readiness to do so. More than one-third of the respondents in 6 of the 12 CRs were hesitant in participating in programme production, while an overwhelming number of respondents in the other six CRs were keen to participate in the production effort. Among those who were willing to participate in programme production, a majority of the listeners in eight CRs were comfortable with only phoning in their questions to CRs. Again, while respondents in FTII (45.26%) were keen to participate in discussion-based programmes, respondents in Vanya (52.29%) were willing to participate in drama-based programmes. Interestingly enough, there were no takers for scriptwriting in any of the 12 CRs.
Instruments Used for Listening to Radio Programs
Perception of the Usefulness of Radio Mathematics
The preceding discussion yields the following findings:
While assessing the level of awareness of community members in regard to the use of simple mathematical problems in their daily lives, it was surprisingly found that most of them had a very low level of awareness. While analysing the level of ease experienced by the community members in solving everyday mathematical problems, it was found that respondents in other CRs did not face major issues while solving problems related to simple addition. However, they experienced significant level of difficulty in solving problems related to subtraction. Similarly, community members, with the exception of those in one CR, did not face much difficulty in solving mathematical problems involving multiplication in regard to the calculation of wages, fare and time and work. In sharp contrast, community members in overwhelming numbers faced problems in using mathematical skills to calculate percentage, discount, interest and conversions of scales such as from foot to inches. In such situations, they got stuck and looked for support. Majority of the community members reported that they had felt cheated at one time or another because of their inability to calculate correctly. They also reported that they felt robbed not only of their money but also of their self-esteem in such situations. The study also shows that more than 60 per cent of community members listened to radio programmes. In regard to the location where they preferred to listen to these programmes, they expressed a preference for their homes. However, in regard to the preferred listening time, with the exception of three community radios, the community members in other CRs preferred either afternoon or late evening. In respect of the instruments on which the community members preferred to listen to radio broadcasts, the study revealed that the community members were almost evenly divided, with community members in five stations preferring traditional radio sets and those in the others the mobile handsets. Regarding the perceived usefulness of listening to mathematics-based radio programmes, an overwhelming percentage of community members showed their desire to do so. However, when asked if they would be interested in participating in the production of such programmes, the response received was a mixed one, with more than one-third of the community members hesitant in doing so in six of the CRs in contrast to an overwhelming percentage of community members in the other CRs keen to do so. Most of the community members who were inclined to participating in the production of the programmes were comfortable with phone-ins only, while a few were willing participate in discussion-based programmes.
Listeners’ Willingness to Participate in Radio Mathematics Programs
Conclusions and Recommendations
The results of the baseline survey clearly show that there is an urgent need to make a mediated intervention in shoring up the competence and the confidence of marginalized communities with respect to their everyday numerical ability. Besides, the survey reveals that across all community radio stations spread across the various regions of India, community members continue to rely on radio as their mediated point of contact with the wide world not just for information but also for learning and entertainment. Delivering inputs of everyday numerical ability through radio could be much useful. Furthermore, as community radio stations operate in a niche space with greater interface between producers and consumers of information involving the participation of the community not simply as listeners but also as producers of information, production and broadcasting of radio programmes on everyday numerical ability could be much useful and desirable.
Footnotes
Declaration of Conflicting Interests
The authors declared no potential conflicts of interest with respect to the research, authorship and/or publication of this article.
Funding
The authors received no financial support for the research, authorship and/or publication of this article.