



Abstract
Vacuum insulating glazing can be very effective as a thermal insulator, which makes it potentially useful in reducing energy loss through building facades. This article examines its effectiveness for airborne sound insulation. Measurements of intensity sound reduction index were made of samples of single glazing and commercially manufactured vacuum insulating glazing, which showed that vacuum insulating glazing (made from pairs of panes with the same thickness) followed mass law principles in the low-frequency range, with a deep coincidence dip in mid-to high-frequency region. The coincidence dip occurred at the frequency for an individual constituent pane. The coincidence dip was reduced or removed by clamping another pane of glass to the vacuum insulating glazing sample. The resulting airborne sound insulation rating of the augmented vacuum insulating glazing samples is substantially improved and comparable to ratings achieved by other thin window airborne sound insulation techniques.
Introduction
Vacuum insulating glazing (VIG) is a form of glazing designed for thermal insulation. 1 Two sheets of glass are separated by a vacuum, which, in conjunction with low-emittance coatings, typically provide U-values (thermal conductance) in the range of 0.8–1.2 Wm−2K−1, with values as low as 0.3 Wm−2K−1 reported. 2 Unlike high-performance double or triple glazing, the thickness of VIG assemblies is similar to that of single glazing: often consisting of a pair of 3 or 5 mm panes separated by a 0.2-mm vacuum. The vacuum in the interstice is typically 1 mTorr or 0.13 Pa, and it minimises heat transmission by conduction and convection, while low-emittance coatings minimise transmission by radiation. However, due to the atmospheric pressure on the glass, internal support is required to prevent the panes collapsing into contact, and this is done using a grid of support pillars. The force from an atmospheric pressure of 101.3 kPa is equivalent to about 10 ton m−2. A typical VIG assembly that is 1 m2 uses an array of 2500 pillars, 0.5 mm diameter, made of high-strength steel. The main energy loss in sealed buildings is from transmittance through the façade, which includes all components of the building envelope. Since glass is typically the weakest insulating element in the façade, accounting for up to 60% of total energy transmission, 3 VIG has significant potential to contribute to efforts in meeting current and future energy conservation goals in buildings. However, energy is not the only consideration in façade design: in the urban environment, buildings also usually require acoustic insulation from their surroundings, and the purpose of this article is to examine the airborne sound-insulating characteristics of VIG. In a sealed building, windows are the principal element through which sound is transmitted between outside and inside, and so their sound-insulating performance is key to controlling this.
The fact that sound does not travel in a vacuum is superficially appealing but is scarcely relevant to the sound-insulating performance of VIG. Vibration between the two panes is transmitted by the support pillars, so there is little basis to expect high performance in terms of sound insulation. The support pillars have not been designed to provide vibration isolation, and to do so would be a formidable challenge considering the small space and large forces involved. Rather than examining such intricate design issues, this study examines the acoustic performance of VIG samples in commercial production and evaluates a simple way of improving their airborne sound insulation.
In a study of the prospects of using vacuum for sound insulation in building elements (not limited to glazing), Walters and Dance 4 identified practical difficulties. The main issues come from the very large pressures on the surfaces, meaning that they require internal support to prevent collapse (unless convex structures are used to resist the pressure, a concept incompatible with normal glazing). One of their experiments used resilient supports, but when the interstice was evacuated, the sound insulation became worse because the resilience was lost under the large compressive force. Their results show that evacuating the interstice between flat panels with internal support tended to make them behave as a single panel, rather than providing any acoustic separation of the panels.
The main impetus for this article is that information on airborne sound insulation of VIG is relatively scarce at present. Asano et al. 5 present one example of airborne sound insulation properties of VIG in 1/3-octave bands, comparing the sound transmission loss of an assembly consisting of a pair of 3 mm panes with a single 3 mm pane, a single 6 mm pane and a conventional insulated gas (IG) unit consisting of a pair of 3 mm panes separated by a 6-mm gap. Their observations concur with those in this article, which we will return to in section ‘Discussion’. Without providing details, Tang and Hohenstein 2 state that the weighted sound reduction index (Rw) of 10-mm-thick VIG can reach 37 and that the Rw of composite VIG can exceed 42. The values are impressive considering that the VIG units are much thinner than acoustic double glazing.
Theoretical considerations
In this article, we are not examining the details of sound transmission within VIG assemblies, but instead are comparing its performance to simple single pane glazing. In classical sound insulation theory, airborne sound insulation of simple panels comes from a combination of effects, including the following: stiffness at very low frequencies due to edge constraints, the mass law, panel resonances, bending wave coincidence (and the critical frequency) and shear wave transmission.6,7 The two effects that are of particular relevance to this study are the mass law and coincidence (for the samples tested, the other effects are mostly outside of the frequency range of interest). The mass law predicts the airborne sound insulation in the low part of the frequency range, based on the surface density (mass per square metre) of the panel. Sound reduction index, R, is the ratio of incident to transmitted energy, expressed in decibels. Doubling the surface density yields a 6-dB increase in sound reduction index, and sound reduction index increases with frequency at 6 dB/octave. There are several versions of the mass law, and in this article, we compare results with the following commonly expressed simple version of the field incidence mass law, equation (1), where f is 1/3-octave band centre frequency (Hz) and ρs is surface density (kg m−2)

The speed of bending waves in a panel increases with frequency, and they mostly have little influence on sound reduction index where the bending wave speed is substantially lower than the speed of sound in air. The important exception to this is panel resonances (eigenmodes) in finite panels, especially the lowest order resonance where the whole panel vibrates in phase. However, the low-order eigenmodes for the glass in this study are below the frequency range of interest. The frequency at which the bending wave speed is equal to the speed of sound in air is known as the critical frequency and is associated with a substantial dip in sound reduction index unless the panel has high internal losses. This local dip in sound reduction index, referred to as the coincidence dip, may start to be evident about one octave below the critical frequency. The critical frequency, fc, can be calculated in a number of ways, including equation (2), where c is the speed of sound in air (m s−1), h is the thickness of the panel (m), ρ is the density of the panel (soda-lime glass: 2.53 kg m3), σ is Poisson’s ratio (soda-lime glass: 0.208), and E is Young’s modulus (soda-lime glass: 72 × 103 Pa)

As observed by Quirt, 8 this is well approximated by fc≈12/h for typical soda-lime glass properties.
These theoretical principles apply to large (notionally infinite) panels, and some additional considerations may arise when finite panels are measured. Although size clearly affects the resonant frequencies of the panels, another size-related phenomenon in this study is the baffle effect, which is an increase in measured sound reduction index in the low-frequency range for smaller panels.9–11 The baffle effect is especially relevant when the panel dimensions are of a similar order or smaller than the wavelength under consideration. It can be partly explained by considering that a small sample mounted in the wall of a reverberant room will not be exposed to all room modes, and at low frequencies this will result in a significant discrepancy with the spatially averaged sound pressure level measured from the microphones within the room. Another issue is the niche effect, which is the effect of mounting a sample on one side of or within a test aperture of appreciable depth. This also has a greater effect on smaller samples and similarly results in increased low-frequency sound reduction index values when the sample is mounted on one side of the niche,12–14 which can be of the order of 5 dB depending on frequency, the size of the sample and niche depth. These effects are commonly seen in glass measurements because of the relatively small sample sizes and are of particular relevance to VIG because it can be difficult to source large samples due to the specialist manufacturing processes involved.
Considering these theoretical principles, selecting thicker glass should increase the sound reduction index in the low- to mid-frequency range due to the mass law, but it is not possible to achieve very high values with single glazing of a practical glass thickness. Making the glass thicker also reduces the critical frequency, which is likely to partially undermine the mass law improvement. These principles are consistent with published measurements of single glazing.15,16 Although these principles apply to single glazing, the measurement results in this article indicate that they remain useful with VIG.
Method
Airborne sound insulation measurements were made following ISO 15186-2, 17 based on the difference between the spatially averaged sound pressure level in the source room and the sound intensity level radiated by the test sample into the receiving room. Although the measurements were made in a laboratory, the procedure followed might be better described as a field measurement mainly because the sample size was smaller than required for standard laboratory measurements, and the sample was held in place with closed cell foam and metal clamps rather than putty. The intensity method has been shown to give results consistent with the conventional pressure method of measuring sound reduction index, 18 apart from a systematic difference that can occur when the receiving room in conventional measurements is not large.12,17,19 An adaptation term, Kc, is included in ISO 15186 to compensate for this discrepancy, including a set of suggested values for a typical receiving room volume. The calculation of modified intensity sound reduction index (RI,M), which incorporates the adaptation term, is done following equation (3), where Lp1 is the spatially averaged sound pressure level in the reverberant source room, LIn is the sound intensity level radiated from the surface (in the receiving room), Sm is the total area of the measurement surfaces and S is the area of the test specimen. In this study (where the sample is in a niche), Sm = S, so the surface area adjustment is 0 dB

The source room is a reverberant room with a volume of 130 m3, with mainly concrete and painted rendered masonry surfaces. Static diffusing panels were suspended in the source room. Two sound sources were used simultaneously, chosen for their capacity to emit high sound power levels. These loudspeakers were Turbo Sound TA-500, which were arranged asymmetrically in the room. Steady state pink noise was used (two-channel incoherent), which had been band-pass filtered to remove energy outside of the frequency range of interest (high-pass at 80 Hz, low-pass at 6.3 kHz). Six microphones (Brüel and Kjær 4189) were distributed in the room. One of the arrangements of equipment in the room is shown in Figure 1. Sound pressure level was measured using a Brüel and Kjær Pulse system, and values were power-averaged. The typical spatially averaged sound pressure level achieved in the source room was approximately 117 dB broadband.
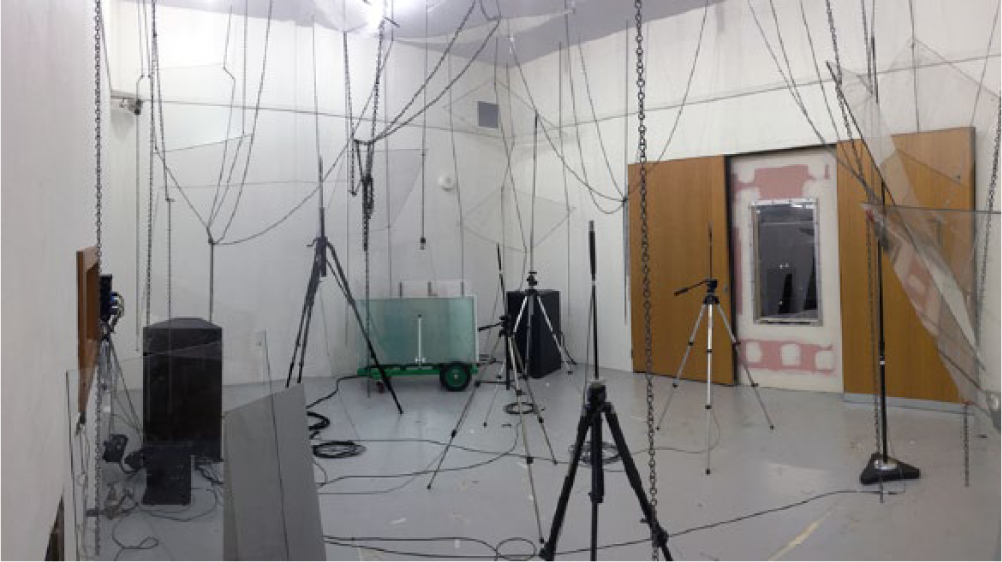
Photograph of the reverberant source room. The test aperture is visible on the right (the dark rectangle within the pink and white plasterboard wall). This shows one example of source and receiver arrangement.
The use of two-channel incoherent noise from two spatially separated sources provides a means of physically power-averaging sound fields from two source positions in a single measurement. Hence, combined with six microphone positions, this yields the equivalent of 12 source–receiver pair combinations in a single measurement. An added benefit of this is an increase in the sound power within the reverberant room (of approximately +3 dB), which contributes to an improved signal-to-noise ratio for the intensity measurements. The diffusivity of the resulting sound field was examined from the range of sound pressure levels received at the six microphones, the results of which are summarised in Figure 2. There is greater deviation at low frequencies: the interquartile range is 1.75 dB at 100 Hz, less than 1 dB at and above 160 Hz, and less than 0.6 dB at and above 500 Hz. Deviations do not increase in the high-frequency range (where the loudspeaker has greater directivity), which provides an indication that the use of directional loudspeakers did not introduce problems with sound field diffusivity for the chosen transducer positions.
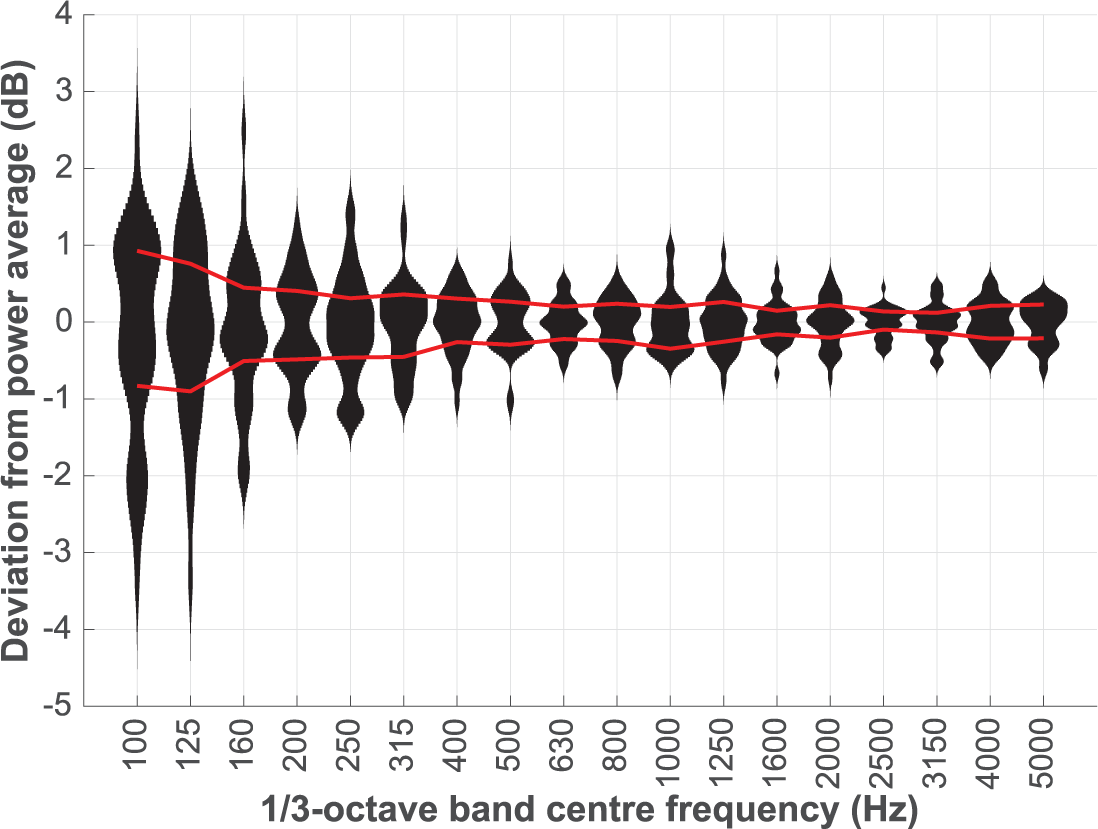
Distribution of sound pressure level deviations from the power spatial average in the source (reverberant) room. The chart shows the combined distribution from six independent transducer arrangements (i.e. a total of 36 underlying data-points per band). The red lines are the first and third quartiles, which together show the interquartile range.
The test aperture between reverberant room and general laboratory room was 1200 mm × 640 mm, with an additional 20 mm margin around it to allow the glass samples to be clamped into the wooden window testing frame (built into the wall). The 20-mm margin was padded with closed cell foam tape. The sample was resiliently clamped and sealed around its edges using metal strips with foam tape pressing against the glass, held into the frame by bolts and wing-nuts. The test aperture was within a stud wall that had been built into a large double doorway to the reverberant room: the wall consisted a timber stud structure with two layers of 13 mm plasterboard on each side, together with one layer of 15 mm compressed fibre cement on one side (the receiving room side), with mineral wool material for sound absorption within the wall (Figure 3). The measured weighted modified intensity sound reduction index of the wall itself was 48. The glass sample was mounted on the source room side of the aperture, leaving a niche 150 mm deep on the receiving room side (this is a shallow niche compared to common laboratory measurements).
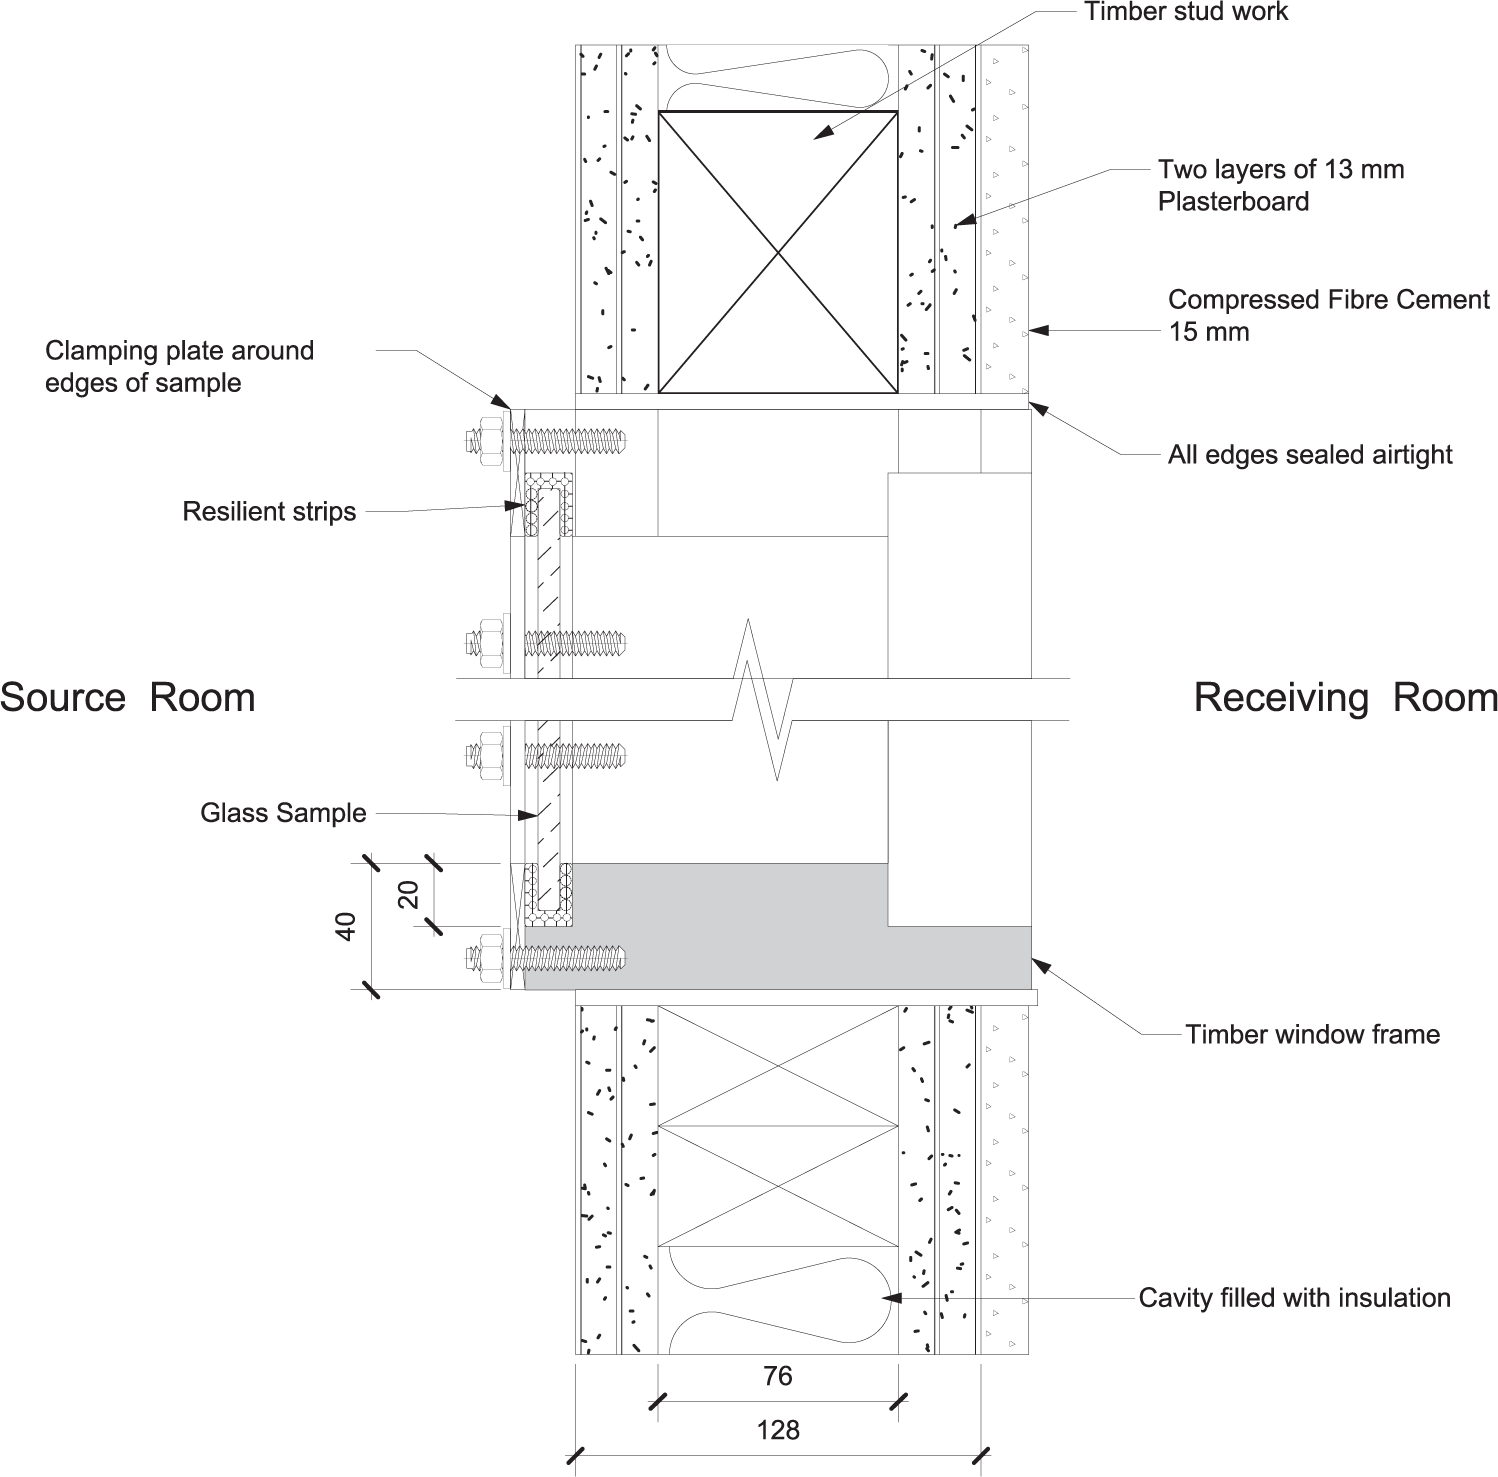
Cross-section of the stud wall, showing a glass sample mounted into the frame.
The receiving room is not a special test room, but instead is a large general-purpose room in the acoustics laboratory (its main volume is 200 m3, although it has adjoining rooms that are not acoustically separated). Measurements of sound intensity radiated by the sample were made by the continuous scanning method, using a Brüel and Kjær 2260 handheld meter (12 mm microphone spacer), 250 mm from the test specimen (or 100 mm outside the aperture niche). Based on the manufacturer’s documentation, the 12-mm microphone spacer is suitable for the 100 Hz to 5 kHz range that is considered in this article. This was done twice in each scanning direction per measurement to ensure repeatability. While sound intensity measurement has some immunity to steady state noise and reflections, it performs more accurately when these are minimised. To reduce acoustic reflections and background noise received by the probe, a large amount of polyester fibre sound absorptive material was placed in the vicinity of the test sample in the form of a tent-like structure. Each of the four surfaces of the tent consisted of two layers of 100-mm-thick absorptive polyester fibre (1.2 m × 2.4 m sheets). Background noise measurements were taken at the start of each measurement to assure that a minimum of 15 dB signal-to-noise ratio was consistently achieved in each 1/3-octave band. The difference between pressure level and intensity level received by the probe was no more than 6 dB in any 1/3-octave band in any measurement.
Two samples of VIG were prepared for the measurement. One had two panes of 3 mm glass (3V3), and the other had two panes of 5 mm glass (5V5). The VIG samples had lubricated steel spacers and were provided by a Japanese manufacturer. Three samples of single glass were also used for the test, with nominal thicknesses of 3, 6 and 10 mm, which were sourced from an Australian manufacturer. While the sound reduction indices of single glass have been reported many times before, the main purpose of measuring them in this study was to include the particularities of this measurement (sample size, smaller reverberant room and intensity method), for comparison with the VIG samples. The 3V3 sample was also measured in combination with the monolithic samples, with the two samples clamped together by the frame (3V3 + 3, 3V3 + 5 and 3V3 + 10). The purpose of the combined measurement was to examine whether the sound-insulating performance of VIG could be improved with a simple modification. The window frame was not sufficiently deep to safely test combinations of monolithic glass with 5V5 VIG.
Repeated measurements were made, with different positions of loudspeakers in the source room and with re-mounting the glass between measurements. Figure 4 shows the deviation of intensity sound reduction index from six independent measurements of the 3V3 sample. Results are shown as deviation from the sound reduction index derived from the averaged transmission coefficients (i.e. a form of power averaging). The six measurements were made with different source and receiver positions in the source room. The interquartile range is less than 2 dB above 125 Hz, but greater than 1 dB in the 400–800 Hz bands and the 2.5–4 kHz bands. In repeated measurements of sound reduction index of glass (using both intensity and conventional methods), Cops et al. 12 found standard deviations due to loudspeaker movements to be less than 1 dB above 250 Hz, rising to about 3 dB in the low-frequency range. The increased variation at low frequencies is due to the relatively small size of the glass sample. In the present results, some low-frequency bands (125 and 160 Hz) have widely spread results, but substantial variation remains in the mid- and high-frequency range. A possible contribution to the deviation at higher frequencies is variation in the mounting conditions of the glass.

Distribution of the intensity sound reduction index in each 1/3-octave band, in relation to the average of the underlying transmission coefficients.
Values are for repeated measurements of the 3V3 vacuum-insulated glazing sample, using different transducer positions in the source (reverberant) room. The sample was removed and remounted for each measurement. The red lines are the first and third quartiles, which together show the interquartile range.
Results
Individual samples
The results for the single pane samples approximately follow expectations. A clear coincidence dip is evident in all three cases. In the low-frequency range, the results show typical mass law behaviour, in combination with the baffle and perhaps niche effects (which are both expected to raise the values at low frequencies, thereby reducing the slope). Sewell 9 presents a theoretical prediction of the baffle effect, which is much closer to the measured values than the mass law at low frequencies. The 3-mm pane has values higher than mass law and baffle effect predictions, but the 6-and 10-mm samples follow predictions quite closely. Results, along with those for the VIG samples, are shown in Figures 5 and 6.

Modified intensity sound reduction index values for the 3-, 6- and 3V3-mm samples (note that the measured thickness of the nominally 3-mm sample was 2.6 mm and that of the 6-mm sample was 5.7 mm). The field incidence mass law curves for 2.6 and 5.7 mm glass are shown as straight dashed lines. The Sewell expression, accounting for the baffle effect, is also shown as dotted lines in the low-frequency range (also taking the Kc adaptation term into account).

Modified intensity sound reduction index values for the 6-, 10- and 5V5-mm samples (note that the measured thickness of the nominally 6-mm sample was 5.7 mm and that of the 10-mm sample was 9.6 mm). The field incidence mass law curves for 5.7 and 9.6 mm glass are shown as dashed lines. The Sewell expression, accounting for the baffle effect, is also shown as dotted lines in the low-frequency range (also taking the Kc adaptation term into account).
The single pane samples have a coincidence dip frequency higher than the critical frequency predicted by theory and higher than published results for some instances of glass of the same nominal thickness. This is partly explained by a discrepancy between their nominal thickness and their actual thickness. The 3-mm sample is actually 2.6 mm thick, and the critical frequency for 2.6 mm soda-lime glass should be 4.6 kHz (i.e. within the 5-kHz 1/3-octave band), compared to a critical frequency of 4.0 kHz if the glass were 3 mm thick (which is self-evidently within the 4-kHz 1/3-octave band). The 6 mm sample is 5.7 mm thick, which has a theoretical critical frequency of 2.1 kHz, rather than 2.0 kHz, and although this does not fully account for the measured coincidence dip in the 2.5-kHz band, it is a shift in the right direction. Similarly, the 10-mm sample, which is actually 9.6 mm thick, has a theoretical critical frequency of 1.25 kHz (rather than 1.2 kHz for 10 mm thickness), although the measured coincidence dip is at 1.6 kHz. Apart from the issue of deviations from nominal glass thickness, the coincidence dip can occur at a frequency higher than the critical frequency, as observed in single glazing measurements by Tadeu and Mateus. 7
In the mass law region, the VIG samples closely follow the results of single pane samples of equivalent surface density: the 3V3 results are similar to those of the 6-mm sample, and the 5V5 results are similar to those of the 10-mm sample. However, the coincidence dip for the VIG samples is at a higher frequency than for single pane samples of equivalent surface density, and instead is approximately the same as that for single pane samples corresponding to the individual constituent panes of the VIG: that is, the 3V3 coincidence dip is in the same range as the 3-mm sample, and the 5V5 coincidence dip is in the same range as the 6-mm sample. The 5V5 sample’s sound reduction indices at and above the coincidence dip are remarkably similar to those of the 6-mm single pane. Since the coincidence dip is at a higher frequency than for a monolithic pane of equal surface density, the mass law effect continues to a higher frequency in the VIG samples, resulting in some bands with substantially higher sound reduction indices. However, the coincidence dip of the VIG samples is deeper than for single pane samples, which means that the overall sound insulation is not improved (as reflected by single number ratings, which are discussed later).
Composite samples
Adding a second layer of glass, clamped into the frame together with the VIG (3V3) sample, had a substantial effect on the sound insulation performance in the coincidence region. The 1/3-octave band results shown in Figure 5 show the deep coincidence dip at 4 kHz of the 3V3 sample. That dip remains with the addition of a 3-mm sheet (3V3 + 3), but is much shallower – less than 4 dB, compared to more than 11 dB for 3V3 alone. There is no 4 kHz dip for 3V3 + 6 or for 3V3 + 10, and instead their sound reduction indices rise at about 3 dB/octave in the high-frequency range.
Nevertheless, there is some indication of the effect of coincidence at lower frequencies, which is what would be expected for thicker glass. For the 3V3 + 3 sample, there is a small dip in the 2-kHz band, which corresponds to the theoretical critical frequency of 6 mm glass (2.0 kHz). For the 3V3 + 6 sample, there is a dip in the 1.25-kHz band, corresponding to the theoretical critical frequency of 9 mm glass (1.33 kHz, which is within the 1.25-kHz band). For the 3V3 + 10 sample, there is a broad and shallow dip spanning the 1- and 1.25-kHz bands, which might also be attributed to the critical frequency of the 3 + 10 mm layer (calculated at 920 Hz, which is within the 1-kHz band). Hence, for bending wave phenomena, it appears that the additional layer of glass is acting together with the VIG pane that it is clamped together with, while the other VIG pane continues to act independently (in terms of bending waves) but with reduced contribution to the sound transmission (Figure 7).

Modified intensity sound reduction index values for a 3V3-mm VIG sample in combination with an additional sheet of glass (clamped together by the frame). The lines show the results for 3V3 mm alone, and with the addition of a 3-, 6- and 10-mm sheet.
Overall, adding a second glass sheet to the VIG increased the sound insulation performance of the glazing at all frequencies except in the vicinity of 1 kHz. In the low-frequency region (500 Hz and below), the increase is not far from the expected change due to the mass law (about 5 dB when the surface density is doubled, rather than the theoretical 6 dB). In the high-frequency range, the increase in insulation performance is large, due to the low-frequency coincidence notch, as well as the reduction in its depth.
Single number quantities
Table 1 shows the single number quantities derived from the 1/3-octave band sound reduction indices. Rw is the weighted modified intensity sound reduction index, shown together with the spectrum adaptation terms C and Ctr. 20 STC is the sound transmission class. 21 The outdoor–indoor transmission class (OITC) 22 was not calculated because the 80-Hz 1/3-octave band was not reliably measured, but the spectrum adaptation terms C and Ctr provide an indication of performance in relation to outdoor sound fields, which tend to be weighted to lower frequencies than important indoor sources such as speech sounds. One reason for the difference between Rw and STC is that Rw is evaluated using the 100–3150 Hz bands and STC using the 125–4000 Hz bands, and the coincidence notch for 3 mm panes is at 4 or 5 kHz (beyond the Rw evaluation range). Another reason for the difference is the 8-dB limit on individual band deficiencies from the reference curve which applies to STC, but not to Rw. This is important because the notch for the VIG samples is large, and so the sound reduction index at the notch determines the STC value for the 3V3 and 5V5 samples. The values in Table 1 incorporate the Kc adaptation term, which adjusts for systematic differences between intensity and conventional measurements due to the size of the receiving room in conventional measurements (using the suggested values in ISO 15186-2).
Single number sound insulation quantities of the glazing configurations tested.
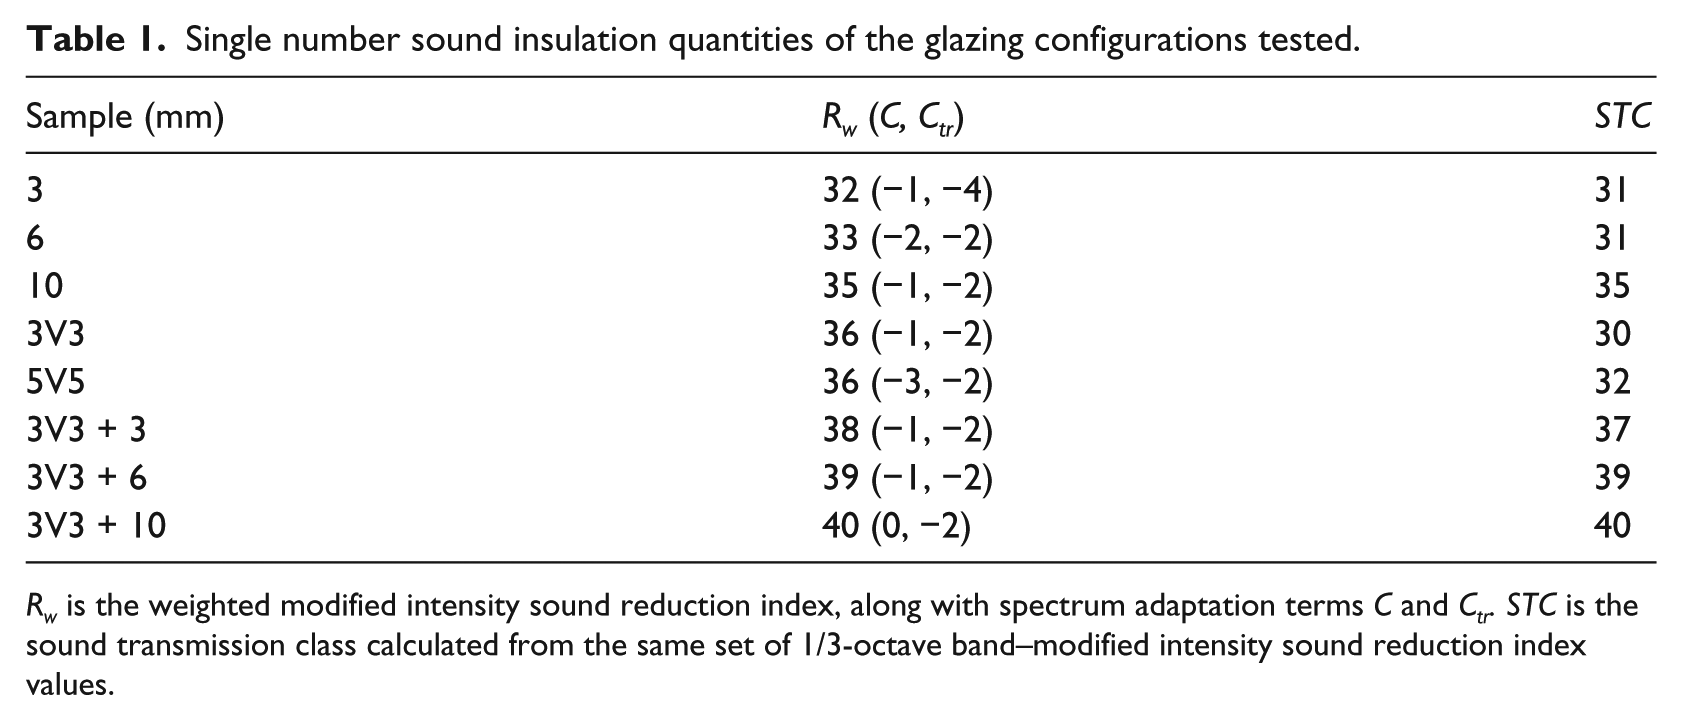
Rw is the weighted modified intensity sound reduction index, along with spectrum adaptation terms C and Ctr. STC is the sound transmission class calculated from the same set of 1/3-octave band–modified intensity sound reduction index values.
Even though the measurements were not strictly compliant lab measurements, with some issues evident from low-frequency deviations, baffle and perhaps niche effects, the calculated Rw and STC values for the single glazing samples are reasonably close to values reported elsewhere. For example, Quirt 15 reports STC values for 3 and 6 mm glass as 30 and 32, respectively. More recent data published by an Australian glass manufacturer 16 have Rw of 30 and STC of 29 for 3 mm glass, Rw of 32 and STC of 30 for 6 mm glass, and Rw of 36 and STC of 36 for 10 mm glass. These are all within 1 dB of the respective values from the current measurements.
Interestingly, the single number quantities for 3V3 and 5V5 mm are almost the same, which is due to the way in which the lower coincidence dip frequency for 5V5 mm sample offsets the increase in sound reduction index at lower frequencies due to added surface density. This phenomenon of a downward shift in critical frequency causing added mass to contribute little to overall sound insulation, which is well known in single glazing, is particularly important with the symmetric VIG samples because of the depth of the coincidence notch.
The single number quantities of the composite samples are of practical interest because of their relatively high values. The 3V3 + 10 mm sample has the same rating value as reported values for 19 mm annealed single glazing or double glazing consisting of a 10- and 6.38-mm pane with a 12-mm air gap. 16 In general, glazing solutions that have higher sound insulation single number quantities than this involve significantly greater thickness than the 3V3 + 10 mm sample, and much higher values are only achieved using large gaps between the panes of double or triple glazing.
Discussion
The VIG measurement results can be interpreted with established theory of thin panel sound insulation, especially with regard to the effect of surface density (mass law) in the low-frequency region and the effect of bending waves (critical frequency and coincidence) in the mid- and high-frequency region. In conjunction with the baffle and niche effects, the sound reduction index below the critical frequency is quite well predicted from the surface density of the glazing (i.e. all of the panes considered together). However, the results show that bending waves in VIG are predominantly due to the characteristics of individual constituent panes, rather than due to the two panes acting as one. This is evident in the frequencies of the large coincidence dip found in the VIG samples, which would be at lower frequencies if the panes were acting as one. The fact that they act individually suggests why the coincidence dip is deeper than for single glazing, as they mutually reinforce the transfer function in the critical frequency region. While this highlights a significant sound insulation problem with VIG, it also indicates a solution to the problem, which is to use dissimilar glass thickness (with different critical frequencies) that does not reinforce each other’s transfer function. Although we were unable to test this directly in this study, we were able to test a similar arrangement by clamping an additional layer of glass onto the VIG. Results show evidence of bending waves coming from the clamped layer acting together, while the other VIG pane continues to behave independently in the coincidence region.
If the two constituent panes of VIG have sufficiently different bending wave speeds, then the waves will cancel (or counterbalance) each other to some extent over a number of wavelengths. For example, if one pane is four times thicker than the other, then the bending wave speed ratio will be 2:1, which should result in destructive interference of bending waves over a distance of one or two wavelengths. Hence, interference between bending waves of the two panes contributes to an explanation of the disappearance of the 4-kHz notch from the tested composite samples (in the case of 3V3 + 6 and 3V3 + 10, the latter of which has approximately a 4:1 thickness ratio). However, the effect of the coincidence notch of the thicker composite pane is not completely removed in any of the tested cases. The disappearance of the coincidence dip from the thin pane of the composite samples is similar to acoustic behaviour of air-filled double glazing: Kim et al. 23 found that in double glazing with dissimilar glass thickness, the thicker pane dominates in determining the coincidence dip. They found a deep coincidence notch (e.g. about 10 dB) for double glazing with identical pane thickness, the frequency of which is unaffected by the air gap distance, but is determined by the critical frequency of a single pane. Using dissimilar glass thickness in the double glazing reduced the depth of the coincidence notch and shifted its frequency to that of the thicker pane (i.e. the lower frequency).
The use of composite panes rather than VIG with different pane thicknesses is likely to have introduced damping into the window, and if so, this also contributes to an explanation of the sound insulation in the coincidence region. If damping is less in equivalent VIG, then coincidence notches in VIG with different pane thicknesses would be more pronounced than the notches seen in the corresponding composite glass measurements, and this is an area that warrants further investigation. Quirt 15 provides measurement results of two layers of 3 mm glass touching, and the resulting sound reduction index spectrum lacks deep coincidence notches (at either the 6- or 3-mm notch frequencies). However, in this study, the composite panes were held together more firmly than appears to have been the case in Quirt’s reported measurements (considering the frequency of the coincidence notch in the results). Nonetheless, the simple modification of VIG by an additional layer of glass may have some practical use in itself. The VIG samples used in this study used lubricated spacers, and it is conceivable that this contributed to the bending wave behaviour of the VIG. Non-lubricated samples were not tested in this study, which is also a matter for further investigation. This study is preliminary, in the sense that it highlights the need for a more detailed and extensive study of the sound insulation qualities of VIG. Beyond the need for more and better measurements, it would be useful to study the details of sound transmission within VIG assemblies so that further opportunities for improving sound insulation can be examined and deployed. The findings in this study are consistent with previous results presented by Asano et al. 5 and Tang and Hohenstein, 2 and so serve to extend the publicly accessible knowledge about the sound insulation of VIG assemblies.
Conclusion
Measurements of the airborne sound insulation of VIG indicate that simple principles, borrowed from thin plate theory, can contribute to an understanding of the airborne sound insulation of VIG. In the low-frequency range, the two panes act as one and appear to follow the same mass law principles as single glazing of equivalent surface density. In the coincidence region, the dip frequency is determined by the characteristics of individual panes. The coincidence dip is large when the two panes have the same thickness, which significantly affects the single number quantities of sound insulation. Clamping an additional pane to one side of VIG that has two equal-thickness panes substantially reduces the VIG sample’s coincidence dip (and may remove it) and introduces a shallow dip corresponding to the combined thickness of the additional pane and the VIG pane that it is clamped to. In this, there is an analogy with double glazing of dissimilar pane thickness, where the thicker of the two panes determines the coincidence dip. Hence, this provides a hypothesis that VIG of dissimilar pane thickness will also behave in this way. The overall conclusion is that the sound insulation performance of VIG can be controlled in the coincidence frequency region without incorporating it into double glazing with a gap between panes, and this has a substantial impact on the single number quantity. However, as expected, in the low-frequency range, the sound insulation is still governed by overall surface density in the configurations tested, and therefore, improvements to VIG in that frequency range would probably rely on incorporating it into double glazing with a substantial gap between panes.
Footnotes
Acknowledgements
The authors thank Adrian Clarke, Bruno Marion, William Martens, Tim Scarpellino, David Spargo, Ken Stewart, Thomas Stewart and Martin Thorpe for their assistance with this work.
Declaration of conflicting interests
The author(s) declared no potential conflicts of interest with respect to the research, authorship and/or publication of this article.
Funding
The author(s) received no financial support for the research, authorship and/or publication of this article.