



Abstract
This article reports numerical and experimental results concerning the estimation of the diffuse field sound absorption coefficient of several different materials under a synthetized diffuse acoustic field excitation in laboratory and in situ conditions. The proposed measurement method is based on a sound field reproduction approach and a synthetic array of acoustic monopoles facing the material to be tested. Numerical simulations are first conducted to optimize the geometrical parameters of the method and to compute theoretical sound absorption coefficients of the considered materials. Measurements on a set of six typical acoustic materials are then conducted following the standardized reverberant room method as well as the proposed approach in a hemi-anechoic room and in two realistic rooms. Albeit showing limitations in the low-frequency domain, the proposed method enables a significant reduction of the tested specimen dimensions compared with the reverberant room method and allows performing tests in non-ideal acoustic environments.
Introduction
Random-incidence sound absorption coefficients, also known as Sabine absorption coefficients, are estimated in reverberant chambers following the ASTM C423 1 or ISO 354 2 standards. The absorption coefficient of the material in the third octave bands can be calculated as follows

where
The reverberant chamber method requires large and costly measurement infrastructures. Therefore, simple yet accurate alternatives for measuring absorption of acoustic materials under diffuse field conditions have been proposed, such as the use of small reverberation rooms (also called “alpha” cabins) 6 or ensemble averaging in large rooms with a pressure–velocity sensor and improved calibration. 7 Many studies report laboratory techniques based on pairs of microphones or particle velocity sensors in anechoic environments,8–11 but they are limited to normal or oblique incidence excitations. Recently, techniques using spherical or hemi-spherical microphone antennas placed at close distance from the material surface together with spherical harmonic decomposition of the sound field have been investigated to provide an accurate estimate of surface impedance, reflection, and absorption coefficients under point source excitation.12,13 Such approaches have not yet been generalized to provide random-incidence sound absorption coefficients. On the other hand, an approach inspired from sound field reproduction techniques and using a virtual planar array of loudspeakers at close distance from the material has been proposed by the Robin et al. 14 More specifically, a single loudspeaker was moved at discrete positions above the material (the source array is thereby termed virtual) and a microphone doublet recorded the sound field in vicinity of the material. Sound absorption under diffuse field conditions was computed in a post-processing step using sound field reproduction techniques.
In parallel to standard laboratory measurements, a large number of publications have been devoted to measuring the sound absorption of acoustic materials in situ, meaning that the treatments are installed and operate in usually uncontrolled environments involving background noise and reverberation. A comprehensive review of in situ absorption measurement techniques can be found in Brandao et al. 15 The measurement of in situ absorption of a material consists of several components: a sound source (or an array of sources) allowing to insonify a zone or a sample of the material to be characterized, a sensor (or an array of sensors), and a data processing system. The in situ measurement system must be compact and ideally robust to ambient noise and must provide an estimate of absorption under incident acoustic field conditions similar to the actual application. It should be emphasized that the term in situ is often used in a misleading way in many works. While an in situ measurement would rigorously correspond to a measurement “on site,” the term is often used improperly to define measurements made outside the standard means (e.g. with no careful preparation or installation of the material sample) but often under controlled conditions in the laboratory. Previous works on in situ measurement focused on comparing the results to standard laboratory measurements 16 and suggesting sensor arrangements as well as data processing optimized to reduce the effect of background noise. 17 Others have examined the use of ambient noise as the only source of excitation. 18 A double-layer microphone array was proposed in Hald et al. 19 to estimate sound impedance and absorption of porous material samples in an anechoic room and in an ordinary room, with consistent results considering different samples sizes and incidence angles. However, most in situ measurement systems for material absorption remain, however, limited to normal incidence excitation.
The purpose of this work is to pursue the preliminary investigations presented by the authors in Robin et al. 14 on the use of a virtual loudspeaker antenna to achieve absorption measurement under a diffuse sound field. In Robin et al., 14 comparisons were made between experiments conducted with this approach, the standard reverberant room method, and numerical simulations using the transfer matrix method (TMM) for the case of two melamine foam samples of different thicknesses and areas and in the 200- to 2000-Hz frequency range. Nevertheless, only measurements in controlled laboratory conditions were considered, and the study did not include highly common sound-absorbing materials (like fiberglass or ceiling tiles as examples). In this article, the measurement technique is first optimized using finite element calculations with respect to key geometrical parameters such as material sample dimensions and geometry of the loudspeaker antenna. The technique is then tested on six different acoustic materials, both in laboratory conditions and in environments approximating in situ conditions and in an extended frequency range (0–5000 Hz). The results are compared to the results of standard reverberant chamber measurements as well as reference TMM calculations.
Proposed approach
Sound absorption coefficient under a point source
The proposed approach has been described in detail in Robin et al.
14
so that only the main steps are recalled here. The concept starts with the case of a single monopole over a laterally infinite layer of absorbing material (Figure 1 (a)). Considering an ideal point source positioned at a given position

with


(a) Description of the problem and coordinate system for a single point source and (b) an array of point sources in a plane parallel to the material surface.
The corresponding absorption coefficient can then be deduced using the relation
Sound absorption coefficient under a synthesized pressure field
Figure 1(b) illustrates the proposed approach for creating any surface sound pressure excitation described by its spatial cross-spectral density (CSD) function, based on the previous point source solution. The source is successively positioned at discrete points over a rectangular grid parallel to the material surface, and the microphone pair is kept fixed at the center of the material surface. Using the two-microphones method described in the previous section, the reflection coefficient can be measured under various incidence angles corresponding to successive source positions
For simplification, the free-field Green’s functions corresponding to the propagation from the image point source to the microphone

where
Note first that while two microphones are needed for the calculation of the individual reflection coefficients
Tested materials
Five absorbing materials were initially considered in this work: melamine foam (25-mm thickness), glass wool (80 mm), high-density fiberglass board (HDFB) (22 mm), polyurethane foam (PUF) (25 mm), and ceiling tiles (14.5 mm). With the exception of melamine foam, the four other materials are commonly used in the building industry. These materials were described using the Johnson–Champoux–Allard (JCA) model 26 in the numerical simulation results reported hereafter. In order to carry these simulations for the materials listed above, the physical parameters required for the JCA model were measured in the Acoustic Materials Characterization Labs of Groupe d’Acoustique de l’Université de Sherbrooke, using the methods described in Doutres et al. 27 (Direct measurements were also performed for mass density, open porosity, 28 and static air flow resistivity.) 29 The obtained JCA parameters for the five materials are listed in Table 1. Photographs of samples used for impedance tube measurements are shown in Figure 2.
Measured material parameters used in numerical simulations.
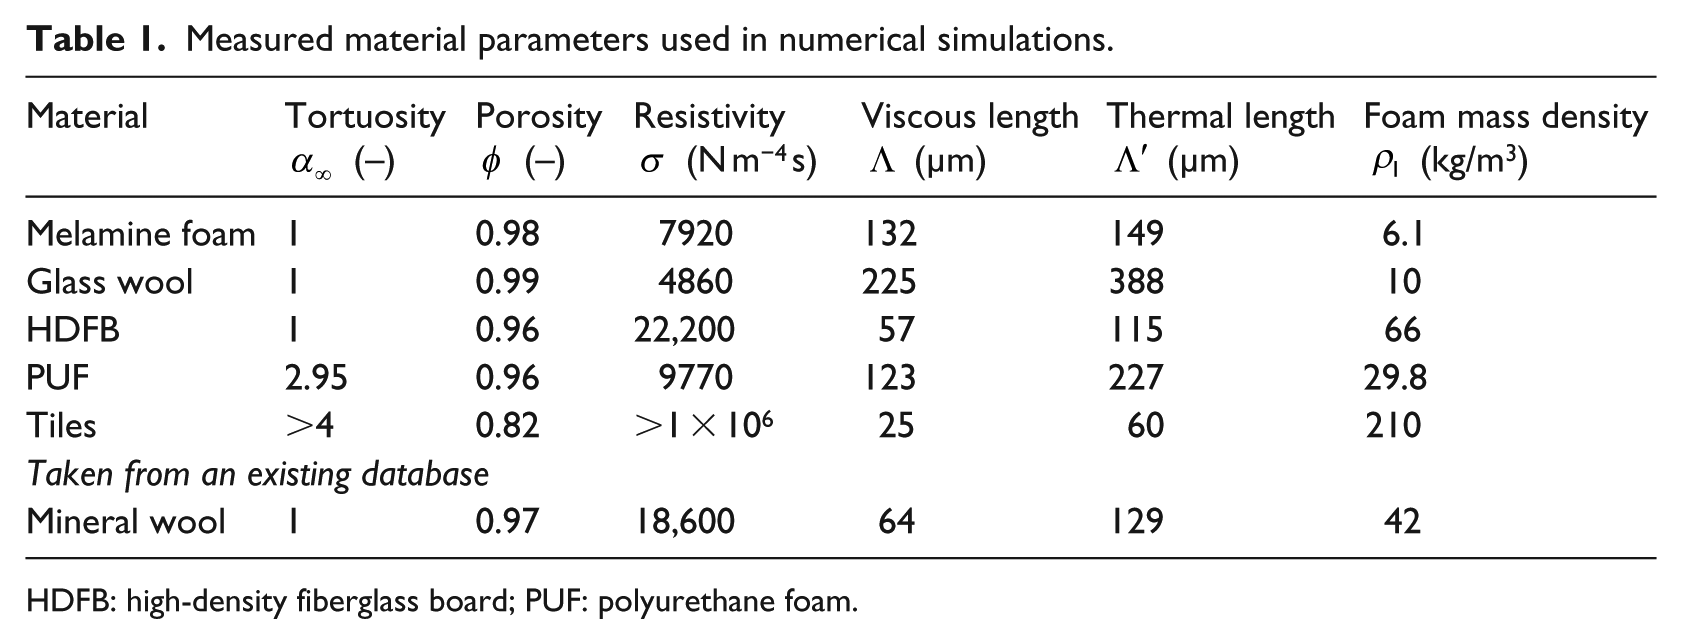
HDFB: high-density fiberglass board; PUF: polyurethane foam.

(a) Top and (b) side views of material samples used in impedance tube measurements.
Given its extremely wide use for sound and thermal insulation applications, a mineral wool was also finally considered in both measurement campaigns conducted in the reverberant room and following the proposed method (in an hemi-anechoic room and realistic rooms). Compared with the five other materials that were found to be relatively homogeneous, mineral wool shows large variability of its physical parameters. As reported in Table 1, an existing database was used for numerical calculations reported below.
Numerical simulations
The numerical simulations served two objectives: (1) simulate the experimental approach described previously in Robin et al. 14 and optimize the geometrical parameters of the experiment (material sample dimensions, geometry of the loudspeaker antenna and arrangement of the microphone pair) and (2) compute the diffuse field absorption coefficient of the tested materials (see Table 1).
The first objective was investigated using the FEM/BEM NOVA software.
30
An acoustic point source was modeled in a semi-infinite acoustic domain above a layer of absorbing material. The material was modeled as a limp medium using the JCA model
26
with prescribed thickness and lateral dimensions. The material is assumed to lay on an infinite, rigid backing. The element size in the meshing of the absorbing medium was 0.025 × 0.025 × 0.0127 m3 so as to take into account the material’s finite thickness and side length (at the largest frequency of interest, 2000 Hz, this gives more than six elements per acoustic wavelength in length and width and four elements for a thickness of 50 mm). The acoustic coupling of the sound material with the external medium was accounted for using a radiation impedance matrix calculated numerically in an efficient way.
31
In these simulations, the sound pressure was computed using Rayleigh’s integral at the locations corresponding to the microphone pair under a point source excitation set at point
As explained above, the second objective of the numerical simulations was to provide a reference value of the absorption coefficient under an ideal diffuse sound field. This was done using the TMM. 26 In this calculation, the material is a laterally infinite layer of finite thickness on a hard backing. The PUF and the compressed fiberglass board have been treated as “rigid” porous materials (equivalent fluid model assuming that the skeleton of the material is rigid, i.e. the solid phase remains motionless). Two materials (melamine foam and compressed fiberglass board) were considered and treated as porous “limp” materials (the stiffness of the solid phase is null, but the equivalent fluid model now takes into account its inertial effects). The JCA material model was used in all cases. Numerical simulation results are not presented for the ceiling tiles, made of a complex perlite-felt mix difficult to describe as an equivalent fluid. Also, the large tortuosity and flow resistance values made the simulations conducted for this material not successful.
The numerical results are reported in the following. For brevity, only results for a 50-mm melamine foam are presented.
Dimension of the material sample
A baseline configuration of 7 × 7 sources separated by
Various material sample dimensions are first considered, corresponding to

Schematic illustration of test cases concerning sample size

Comparison between FEM/BEM simulations of the proposed approach and a reference TMM calculation for various material side lengths and fixed array geometry (i.e. constant height and side length). The material considered is melamine foam.
Material to source array separation
The baseline array configuration considered now is an array of 9 × 9 point sources separated by 15 cm. The array is, therefore, a square of 1.2-m side, and it is placed above a 1.8 × 1.8 m2 melamine foam of 50-mm thickness. Different vertical separations between the material and source array are considered, varying between

Comparison between FEM/BEM simulations of the proposed approach and a reference TMM calculation (for a maximum incidence angle corresponding to
Other comparisons 34 show that for a fixed array side length, increasing the array height has the same consequence as reducing the array side length for a fixed array height: the highest incidence angle included in the database becomes lower. This results in similar estimations of the sound absorption coefficient under a DAF (thus with similar maximum incidence angle).
It is, therefore, essential that the source array be sufficiently close to the material surface in order to induce grazing wave incidence at the microphone pair. Also note that the low-frequency deviation between the expected diffuse field absorption and the proposed approach is still visible. Additional numerical simulations with larger source arrays (up to 13 × 13 sources) or smaller source separations (10 cm instead of 15 cm) did not reveal significant improvements in the frequency range investigated (0–2 kHz). In summary, the selected configuration for experiments was a 7 × 7 array of loudspeakers separated by 15 cm and placed 20 cm above the material surface. In all cases, the material sample was centered below the source array and was larger than the array.
Experimental methods
Reverberant chamber measurements
All selected materials were tested in a 143-m3 (7.2 × 6.5 × 3 m3) reverberant room following the ASTM C4231 standard (see Figure 6(a)). Five half-inch microphones (PCB 377B02) were positioned in the room following recommended practices (minimal distance with room walls, specimen, and sound source). A sound source (JBL PRX) fed with a white noise signal was used to create diffuse field conditions in the room (either empty or with the material specimen). Each specimen had a minimum area of 6.7 m2 and was directly laid on the room floor. Its perimeter was sealed with wood framing and aluminum tape (type “A” mounting according to the ASTM E795-05:2005)
35
. Ten consecutive sound decay rates were measured after the sound source was switched off either in the empty room or in the presence of the specimen. The corresponding reverberation times

Pictures of measurement setups for the glass wool case: (a) reverberant room (6.7 m2 sample) method following the ASTM C423 standard, (b) proposed method in controlled acoustic space (hemi-anechoic room; 1.5 m2 sample), (c) proposed method in a small laboratory space (1.5 m2 sample), and (d) proposed method in a large machine shop (1.5 m2 sample).
Measurements with the proposed approach
All the materials tested using the synthetic diffuse field approach were square samples (see Figure 6(b)–(d)). Combining small elements of 2 × 2 ft2 or 2 × 4 ft2 for the material unit slabs (≈ 0.61 × 0.61 m2, ≈ 0.61 × 1.22 m2, respectively), the obtained area was 16 ft2 (≈ 1.5 m2). The materials were simply laid on a rigid floor, with no specific preparation at the perimeter. The procedure initially included two microphones as described in Figure 1(a) and (b), but this setup revealed errors in both low and high frequencies. Indeed, a microphone separation distance larger than half an acoustic wavelength leads to erroneous results.
36
A 5-cm separation gives a theoretical maximum frequency of approximately 3400 Hz, and it was found in preliminary results that this separation allows correct measurement up to the 2500-Hz third octave frequency band. Three quarter-inch PCB microphones were instead positioned at

(a) Measurement with a microphone triplet and (b) microphones permutation.
The measurements were conducted in three different rooms: (1) A hemi-anechoic room, (2) a 100-m3 acoustically untreated laboratory space, and (3) the 3500-m3 machine shop of the Sherbrooke engineering faculty. Equations (2)–(4) in the proposed approach assume free-field conditions, and any room reverberation will break this assumption. The last two environments, therefore, aimed at estimating the robustness of the approach to non-ideal conditions (reverberation and background noise). The measured background noise levels in the two uncontrolled spaces are reported in Figure 8(a) and (b). All the sound pressure levels reported in Figure 8(a) and (b) were obtained using a control microphone positioned in the vicinity of the tested material. Measurements were made when the sound source was placed at a corner of the source grid positions so that the distance between the control microphone and the microphone triplet is identical (the measured sound pressure level at the triplet varies depending on the source position). This helps evaluating the difference between sound pressure levels measured when the sound source is active with respect to the background sound pressure level, a ratio of overall signal level (active source plus background noise) to background noise level.

(a) Small laboratory space: Comparison of background noise with sound pressure levels measured with and without the disturbance noise source. (b) Large machine shop: Comparison of background noise with sound pressure levels during measurements.
During measurements, ventilation fans were active in both rooms, and the sound pressure level peaks in the 315- and 630-Hz third octave bands for the large machine shop were due to the heating and ventilation system fan (Figure 8(b)). An additional noise source, a loudspeaker driven by a white noise generator, was inserted in the laboratory space to deliberately decrease the level difference between the one produced by the active source and background noise during measurements on one of the materials. The disturbance noise source level at the control microphone was set so as to be equal or larger than the level of the source used for measurements. According to Figure 8(a), the level difference had a value of −2/−3 dB on the 200- to 5000-Hz third octave bands (even reaching −8 dB in the 500- and 630-Hz third octave bands). In the case of the large machine shop, no additional disturbance noise source was used since the background noise level was already large compared with the one obtained when the acoustic source was activated (see Figure 8(c)) with a level difference of 0/−1 dB up to the 1000-Hz third octave band. The measured T60 reverberation times in octave bands between 125 Hz and 4 kHz varied between 0.47 and 0.39 s in the laboratory space, while it varied between 1.29 and 0.66 s in the machine shop. When converted into critical distances (equal to
For each test, the source was manually moved over all positions of the 7 × 7 source grid, and the sound pressures captured by the three microphones were recorded (see Figures 6(b)–(d)). All further operations to extract the diffuse field absorption coefficient were done during the post-processing stage.
Experimental results
Results in hemi-anechoic conditions
The experimental results obtained with the proposed approach are compared to reverberant chamber measurements and TMM calculations (except for ceiling tiles) for glass wool, mineral wool, HDFB, PUF, and ceiling tiles in the upper parts of Figures 9–13, respectively. Since results concerning melamine foam of 2-in thickness were already published, 14 only results obtained in realistic environments are provided for this material (see next section).

Glass wool: (upper) comparison between reverberant chamber measurements, proposed approach, and a reference TMM calculation and (lower) proposed approach: comparison between measurements in various rooms and a reference TMM calculation.

Mineral wool: (upper) comparison between reverberant chamber measurements, proposed approach, and a reference TMM calculation and (lower) proposed approach: comparison between measurements in various rooms and a reference TMM calculation.

HDFB: (upper) comparison between reverberant chamber measurements, proposed approach, and a reference TMM calculation and (lower) comparison between measurements in various rooms and a reference TMM calculation.

PUF: (upper) comparison between reverberant chamber measurements, proposed approach, and a reference TMM calculation and (lower) proposed approach: comparison between measurements in various rooms and a reference TMM calculation.

Ceiling tiles: (upper) comparison between reverberant chamber measurements, proposed approach, and a reference TMM calculation and (lower) proposed approach: comparison between measurements in various rooms and a reference TMM calculation.
The reverberant chamber absorption coefficients reach values larger than 1 for rock wool, glass wool, and PUF. The proposed method provides values that are overall in better agreement with the TMM calculations above 400 Hz, with material samples significantly smaller than the ones tested in the reverberant chamber. Compared with the 6.7-m2 requirement of the ASTM C423 standard, the area of tested specimen is divided by a factor of 4.5. If the 12-m2 requirement of the ISO 354 standard is now considered, the area reduction factor now reaches a value of 8. In addition, no specimen preparation is necessary as opposed to the required framing for the reverberant room.
Note that in this problem, the reference result is taken to be a TMM calculation of the absorption coefficient under diffuse field excitation, but the TMM involves strong assumptions on the acoustic material (laterally infinite, porous limp material) which are not easy to quantify. For several samples and compared with TMM results, the results obtained using the proposed method exhibit a slightly larger sound absorption in high frequencies that may be attributed to a non-locally reactive sample. This point is discussed in Brandao et al. 15 Below a frequency of approximately 400 Hz, as observed in numerical simulations, the proposed method leads to large differences in comparison with TMM results and reverberant chamber data (the resulting absorption coefficient becoming potentially negative in this frequency range). This is mainly due to the inability of the spherical wave model to describe the reflected sound field in Figure 1(a). A more exact formulation of the reflected sound field such as in Nobile and Hayek 21 would be necessary in this case.
Results in realistic environments
As in the previous section, the results obtained in the two realistic spaces and comparison with hemi-anechoic room measurements and reference TMM calculations are shown in the bottom of Figures 9–14, respectively.

Melamine foam of 2-in thickness. Proposed approach: Comparison between measurements in various rooms and a reference TMM calculation.
The experimental results obtained in the three different environments compare well with each other. As an example, in the case of glass wool, mineral wool, and HDFB and above a frequency of approximately 500 Hz, the three sound absorption curves overlay. For all materials and below this frequency, discrepancies between the three measurement rooms are seen depending on the considered material and room. These differences are attributed to (1) the low frequency underestimation of the absorption coefficient due to the spherical wave model, (2) possible positioning errors for microphones and sound source (the source was manually scanned) that can bias the estimation, 36 and (3) the fact that a different sound source was used between tests in hemi-anechoic conditions and tests in uncontrolled spaces. The discrepancies between results obtained in the three rooms also become larger with smaller sound absorption. In other words, measurements on low sound absorption material at low frequency seem to be more sensitive to the three sources of errors listed above. Finally note that the tests in the two uncontrolled rooms were made consecutively, while the tests in the hemi-anechoic room were conducted at the beginning of this study.
The results obtained in the smaller standard laboratory room show large deviations in some third octave bands. A first example is the clearly biased results at a frequency of 2000 Hz for the case of the PUF, see the lower part of Figure 12, or at the same frequency but to a lower extent for the glass wool (see Figure 9). In the case of the ceiling tiles, Figure 13, the results are highly biased, especially over the 1600-Hz third octave band. This is attributed to a stronger contribution of early reflections in the smaller room, leading to outliers at some specific frequencies that are then summed in this third octave band.
Conclusion
This article reported numerical and experimental results on the estimation of the sound absorption coefficient of six different materials under a synthetized diffuse acoustic field excitation in laboratory and in situ conditions. The experimental arrangement consists of an array of 7 × 7 loudspeakers separated by 15 cm and placed 20 cm above the material surface. A microphone triplet is placed in the vicinity of the material to extract the incident and reflected sound fields. The method assumes free-field conditions. Diffuse field absorption coefficients were measured in the 200- to 5000-Hz range and compared to numerical results using the TMM and experimental results using the standard reverberant room method.
The results obtained with the proposed method show better agreement with TMM predictions than those obtained with the reverberant room method and do not show the large absorption overestimation encountered in reverberant room results. Also, the measurement under a synthetized diffuse acoustic field in laboratory conditions requires smaller specimens with no need of specific preparation like framing of the material. At frequencies below 400 Hz, the proposed approach provides unreliable absorption data mostly originating from the simplified spherical wave model used for calculating the sound reflection coefficient under each monopole of the array. A more exact formulation of the total sound pressure field above the specimen such as in Nobile and Hayek 21 would be needed to solve this discrepancy.
The method was also tested in two uncontrolled acoustic environments, a small laboratory space and a large machine shop, involving significant background noise and reverberation. The results obtained in these three different environments provide comparable results. The largest source of error that was identified is the contribution of early sound reflections that can largely bias the results obtained. More precisely, the results obtained in the small laboratory space show that the method is more sensitive to early reflections than to background noise.
Future investigations include a more exact formulation of the sound field of a monopole source above an absorbing material to process the measured data, as well as a more accurate, motorized, and automatic positioning of the sources, leading to a possible alternative to current standardized measurements in the reverberant room.
Footnotes
Acknowledgements
The authors are thankful to Institut de recherche Robert-Sauvé en santé et en sécurité du travail (IRSST) members and to the follow-up committee who provided helpful suggestions, as well as Marc-Antoine Bernard and Xavier Mongrain-Lalonde for contributing to the project.
Declaration of conflicting interests
The author(s) declared no potential conflicts of interest with respect to the research, authorship, and/or publication of this article.
Funding
The author(s) disclosed receipt of the following financial support for the research, authorship, and/or publication of this article: This work was supported by the Institut de recherche Robert-Sauvé en santé et en sécurité du travail (Grant 2014-0006).
