



Abstract
Acoustic comfort and indoor air quality are essential for the health and wellbeing of the occupants of the building. Thus, the façade must guarantee enough sound insulation and ventilation conditions. However, these aspects conflict because opening windows or using ventilation openings reduces the sound insulation of the envelope and allows the exterior noise entrance. To limit noise transmission into the building, ventilators use passive, active or hybrid noise control techniques. This work addresses the noise reduction performance of a mechanical ventilator for façades, evaluating the effect of different options of passive noise control strategies in the sound insulation of the proposed ventilator. In addition, the air change rate and energy consumption of the ventilator were also investigated. Three prototypes were fabricated and tested at an acoustic chamber, along with ventilation tests carried out in a room equipped with a blower door. CFD simulations were used to enhance the aeraulic geometry of the prototypes, prior to its fabrication. The acoustic experiments showed Dn,e,w values up to 55 dB and noise emission levels lower than 25 dB(A). The use of resistive sound absorbers proved to be more effective in mitigating noise than reactive absorbers, over the entire frequency range. The ventilation tests revealed air change rates of 3.7 h−1 at 50 Pa, while the ventilator’s annual energy consumption was 17.52 kWh. The results highlight the proposed device as a viable alternative for decentralised mechanical ventilation, capable of ensuring noise protection and satisfactory ventilation rates, under a sustainable perspective of minimum energy demand.
Introduction
The harmful effects of external noise, as well as the lack of an adequate ventilation rate for the health and wellbeing of the occupants of the buildings, is extensively analysed in the literature.1–7 Despite it and the state-of-the-art in the construction industry, noise pollution affects more than one million people every year in Europe, 7 and at least 30% of the new buildings have inadequate Indoor Air Quality (IAQ), due to faulty construction or defective design. 8
Simultaneous sound insulation and ventilation are essential, and the façade, as a multifunctional interface of the building, must guarantee both. However, balancing these two aspects is not an easy task: if increased porosity of the building fabric improves airflow rates, on the other hand, it is detrimental to its sound insulation.9–11 On the opposite, airtight buildings may present constructive pathologies associated with insufficient air change rates, such as moisture and mould development. In real-life situations, most of the time, these requirements are not considered by designers as part of the same context of sustainability and comfort, and the attention falls on one or the other aspect. In this sense, Baldinelli et al. 12 defend the use of an integrated and holistic approach as a way to optimise the building and its components, in view of a better energy performance and less environmental impact.
Compared to the sound insulation of a masonry wall, in a typical composite façade, the window and other ventilation openings are the weakest part, since noise is transferred more easily through these elements than through external walls.13,14 Thus, especially in areas with traffic noise levels above 65 dB, these elements must be improved so that they have higher transmission loss values, to guarantee the acoustic insulation of the façade and, therefore, the acceptable criteria of internal acoustic comfort.
For reasons of cost and time, nonetheless, in complex façades where these ventilation elements are present, it may be interesting to predict the transmission loss of the envelope, as did Caniato 15 In this study, the authors 15 used a combined approach based on the Transfer Matrix Method and 3D acoustic simulations.
There is an abundance of literature on improving the transmission loss from a closed window, such as the use of curved stiffeners to modify the natural resonant frequencies of the window in a frequency range of interest. 16 Lately, as we will soon see, research has been developed to also investigate noise reduction techniques in open windows, aiming at natural ventilation. 17
In the case of the ventilation apertures, regardless of the building’s ventilation system, externally generated noise tends to propagate more freely through the inlet and outlet openings towards the dwellings’ interior. As the overall acoustic insulation of the façade depends on the acoustic properties and dimensional characteristics of each of its components, the ventilation apertures will need passive, active or hybrid noise control techniques to meet the noise reduction requirements of the building envelope.
Oldham et al. 9 and De Salis et al. 10 carried out theoretical investigations on the transmission loss of a wall with an aperture and discussed various mitigation measures to reduce the traffic noise entry through the façade of a naturally ventilated building.
Figure 1 shows an arrangement of the different noise control treatments over the frequency range, according to the performance of each technique. 9
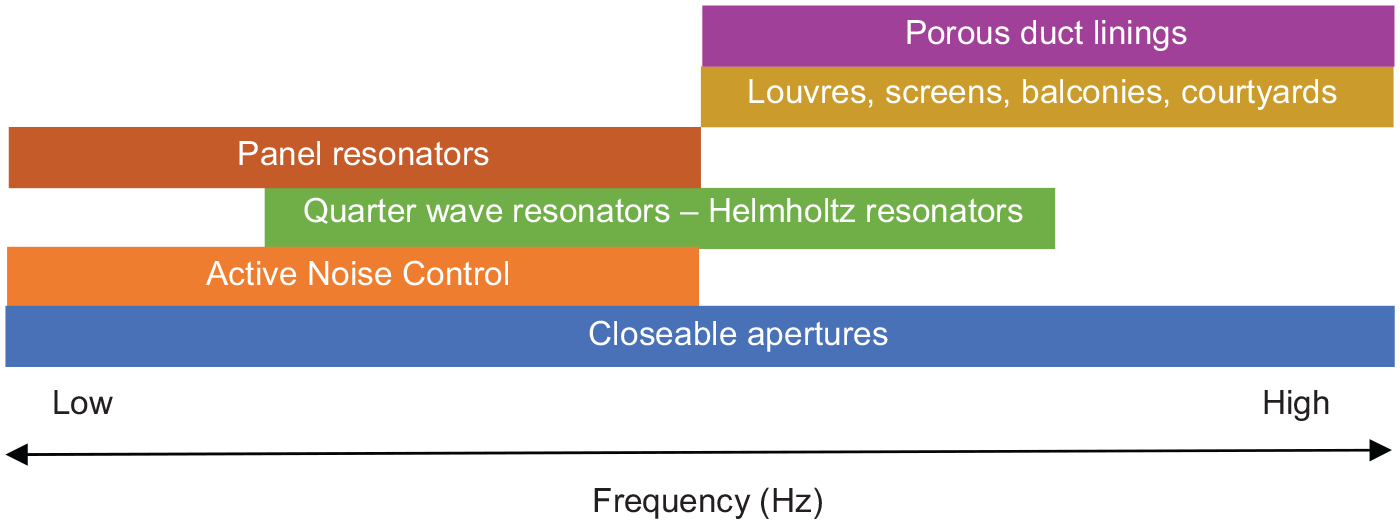
Noise control treatments for natural ventilation systems (adapted from Oldham et al. 9 ).
Oldham et al. 9 suggest the combined use of two or more treatments (hybrid approach) to attenuate noise in a broader frequency range, supplementing the typically poor performance in the low-frequency region of the conventional passive materials.
In recent years, environmental and energy guidelines for a more efficient and decarbonised building stock have increased interest for natural ventilation. 18 Plenum windows and Active Noise Control (ANC) windows are emerging examples of this context. The plenum window is a double window construction consisting of an external part, with an outer vent for fresh air intake, and an internal part with an inner vent.17,19 The ANC window consists in a set of electronic devices that receive and process the original signal (noise), using microphones and digital processors, generating an antiphase acoustic wave to cancel the received noise. 20
Søndergaard et al. 19 investigated the sound performance of Danish vertical supply air windows (plenum windows), comparing laboratory and field measurements. They found that a plenum window has 8 to 16 dB (Rw + Ctr) better performance than a regular window with the same opening area, depending on the characteristics and dimensions of the window. At the low frequencies (100–250 Hz), as measured by the authors, performance falls short. In a review on natural ventilation-enabling noise control devices for congested high-rise cities, Tang 21 highlights the use of plenum windows. According to Tang, 21 the traffic noise level differences of a plenum window varies between 19 and 23 dB and it’s less affected by the city’s reverberation. Tang 21 agrees with De Salis et al., 10 claiming that the combined use of plenum windows with other noise mitigating strategies improves the noise screening performance.
The ANC has been applied to partial and fully open windows to reduce the effects of external noise inside dwellings.20,22,23 Although noise reductions of up to 30 dB have been achieved when compared to a standard window, this technique is not often adopted in residential buildings due to its costs and integration constraints, as well as system complexity, maintenance issues and constant variation of the indoor and outdoor environments. 24
Locher et al. 25 investigated the internal noise level of residential buildings in which open windows were used for natural ventilation. They measured the internal and external sound levels of 102 Swiss residential buildings exposed to road traffic noise, considering open, tilted and closed windows, having found average outdoor–indoor sound level differences of 10, 16 and 28 dB, respectively.
Although natural ventilation is environmentally friendly, as it does not have mechanically generated noise and operate without the need for power, it has some pitfalls. The pressure differentials required to induce airflow rates are low (usually 3–6 ) and depend strongly on climatic conditions related to wind and buoyancy (stack effect).9–11 As a consequence, ventilation may result in intermittent or even unfeasible in areas where the air is stuffy for most of the year. Besides that, as the pressure differentials are low, the envelope will need to have ventilation openings large enough to provide adequate airflow rates. As stated by De Salis et al., 10 in order not to weaken the façade’s sound insulation, these apertures must be acoustically treated. This, in turn, increases resistance to the airflow passage and lowers the ventilation efficiency.
In terms of preserving the façade’s sound insulation, the centralised mechanical ventilation systems seem more controllable than natural ventilation. Since the air driven forces are produced by equipment, rather than by wind and stack effects, the building envelope results less permeable, which contributes to limit the transmission of external noise to the building. Nevertheless, ductwork problems, vibration and noise from fans may incur in an important restriction on the use of such systems.24,26 According to Harvie-Clark et al. 24 and Harvie-Clark and Siddall, 26 a large number of residents in Europe and North America, when faced with objectionable noise from their domestic ventilation equipment, prefer to lower fan speed to more tolerant noise levels or even turn it off, despite the adverse effects this will have on their health and wellbeing. Its use can also be affected by the space required for installation in existing buildings, as well as by high energy consumption. Novoselac and Srebric 27 refer that the energy consumption of fans in a centralised ventilation system is about five times that of a decentralised system.
Marini et al. 28 studied the effects of ventilation holes and punctual mechanical ventilation systems on the façade’s sound insulation, devising a graphic method to achieve minimum values for these parameters in the building design stage. Based on prediction models and experimental data measured in situ and in the laboratory, three different types of standard façades (from the Mediterranean region) were analysed for the influence of aeration holes on its acoustic insulation. Façades type 1, 2 and 3 were built with the following elements: layers of bricks and insulating sheets (type 1), load-bearing blocks system made of bricks cladded with natural stone (type 2) and multi-layer system plus an insulation layer (type 3). They found performance indexes of D2m,nT,w = 30 dB, D2m,nT,w = 33 dB and Rw = 26 dB for façades type 1, 2 and 3 (with opened holes) and D2m,nT,w = 42 dB, D2m,nT,w = 42 dB and Rw = 52 dB for the same façades, with closed holes.
In a mixed ventilation system, which replaces air using background ventilators and removes pollutants from wet rooms using intermittent mechanical exhaustion, the main acoustic concern is linked to the inadequate placement of the ventilation unit and excessive noise caused by poor ductwork. 24 Again, when the inlet and outlet openings are lined for quiet ventilation, there will be pressure drops and airflow restrictions in the system.
There are many devices and commercial products designed to tackle the problem of noise entering a façade’s ventilation aperture. Nonetheless, a significant amount of this occurred in the context of engineering consultancy, rather than academic research. 10 Also, many manufacturers do not provide enough acoustic data about their products (such as the sound insulation curves in 1/3-octave centre frequency band), which would benefit building designers.
This work aims to overcome the drawbacks aforementioned. More specifically, it investigates the noise reduction performance of a low energy decentralised mechanical ventilator for façades, revisiting the use of fibrous sound absorbers, multiple quarter-wave resonators and unperforated metal sheets to improve the ventilator’s sound insulation, while maintaining adequate ventilation rates with negligible energy consumption. Thus, it is expected to contribute to the acoustic comfort and ventilation of buildings.
Method
Ventilators are frequency-sensitive devices whose noise reduction performance depends on the correct sound materials used in their manufacture, given the acoustic properties of the noise affecting the building. In addition to road traffic noise, which is the primary source of noise in high-density cities, mechanical ventilators still have to deal with the noise produced by their fan blades and air’s turbulence. These premises were taken into account in this work, in which three prototypes A, B and C were developed and tested for their acoustic and ventilation properties.
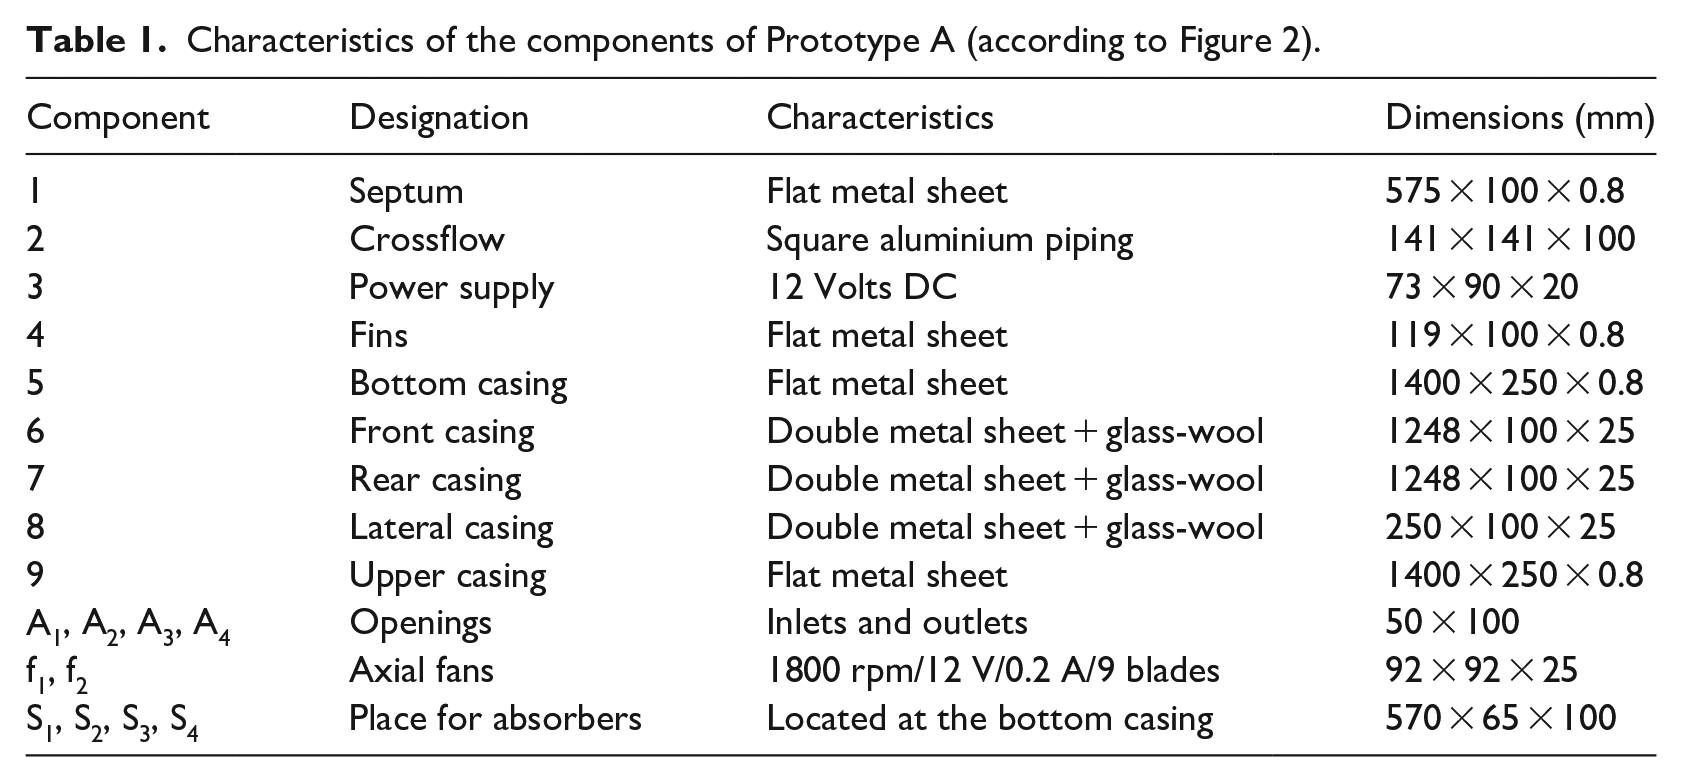
The prototypes have a common basic structure with optimised geometry, stemmed from Computational Fluid Dynamics (CFD) simulations, using Phoenics software, consisting of a typical x-shaped dual circuit with a central crossflow and a forced exhaust system near to the basic fan (see Figure 2). Prototypes are different from each other, depending on the noise reduction material installed inside.

Prototype A: schematic perspective view of components.
Prototype A, taken as reference element, does not have any specific noise reduction material, is the base for Prototypes B and C. Prototype B has a set of reactive sound absorbers formed by unperforated metal sheets placed in S2 and S3 and multiple quarter-wave resonators placed in S1 and S4 (see Figure 3).

Prototype B: (a) Schematic plan view. (b) Perspective view. (c and d) Schematic perspective of reactive absorbers (dimensions in mm).
Prototype C has resistive sound absorbers, composed by perforated metal sheet backed with coated glass-wool, positioned along both sides of the septum at places S1, S2, S3 and S4 (see Figure 4). A1, A2, A3 and A4 are the inlet and outlet openings, each with 5000 mm² of area. The percentage of free open area of the perforated metal sheet in S1 and S4 is 22%, while in S2 and S3 is 3%. Figure 2 shows a schematic perspective view of Prototype A, and Table 1 presents the characteristics of the elements used for its assembly.
Characteristics of the components of Prototype A (according to Figure 2).
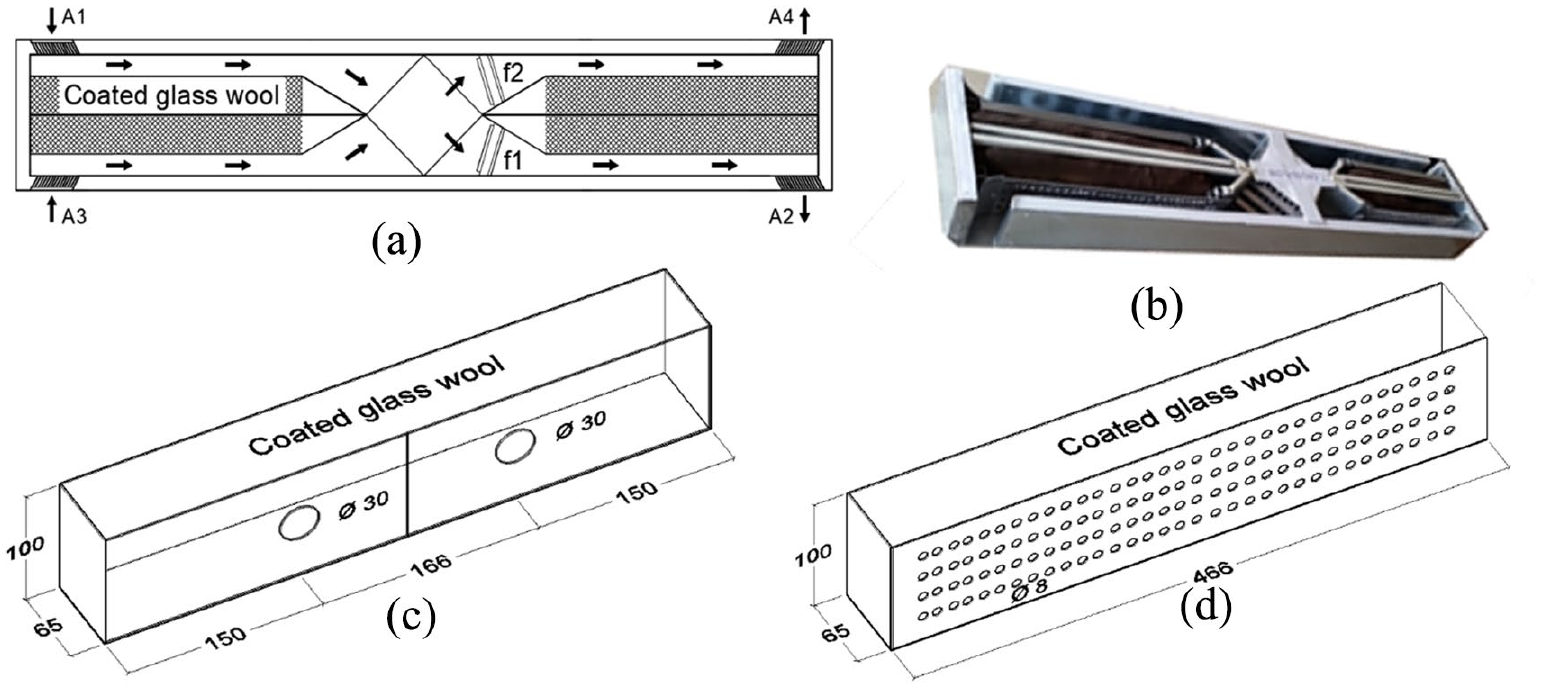
Prototype C: (a) Schematic plan view. (b) Perspective view. (c and d) Schematic perspective of reactive absorbers (dimensions in mm).
The resonant frequency of the multiple quarter-wave resonators in Prototype B is around 1307 Hz and was predicted by equation (1). 29

where c is the sound speed (340 m/s), n = 0,1,2,3 . . . and d is the depth of the cavity (0.065 m). The sound absorption of the perforated metal sheets baked with coated glass-wool in Prototype C depends on the free open area of the metal sheet. For the metal sheet with 22% of free open area, the absorption is controlled exclusively by the 50 mm layer of glass-wool placed back the perforated metal sheet (d = 30 kg/m³ and average sound absorption coefficient of 0.7 calculated from the octave bands from 250 to 2000 Hz 30 ). In the case of the other sound absorber in Prototype C (with 3% of free open area for the metal sheet), it is expected a resonance frequency in 210 Hz, which was calculated by equation (2). 31

where c is the sound speed (340 m/s), P is the percentage of the perforated metal sheet open area (3%), L is the depth of the cavity including the absorbent material thickness (0.065 m), t is the metal sheet thickness (0.0008 m), d is the perforations’ diameter (0.03 m) and q is the spacing between holes (0.166 m).
Laboratory acoustic experiments
The acoustic experiments took place at the acoustic chamber of Itecons, in Coimbra, as shown in Figure 5.

Schematic plan view of the acoustic chamber (dimensions in m).
The sound insulation of the prototypes was rated using the element-normalised level difference (Dn,e) and the weighted element-normalised level difference (Dn,e,w). A 10 m² double pane masonry wall (base wall), without openings, was first tested to quantify its weighted sound reduction index (Rw) according to ISO 10140-1, ISO 10140-2, ISO 10140-4 and ISO 717-1 standards.32–35 Then, Prototype A was installed in the base wall to measure its Dn,e according to ISO 10140-2 and ISO 10140-4 standards.33,34 The same procedure was used to test, individually, prototypes B and C. The Dn,e,w of each prototype was calculated according to ISO 717-1 standard. 35 To verify the influence of noise produced by prototype’s fans in the sound insulation results, a comparative acoustic insulation test of Prototype C was performed with its fans turned off.
Lastly, the Sound Pressure Level (SPL) produced by the axial fans of Prototype C was also measured. Figure 6 shows the experiments at the acoustic chamber.
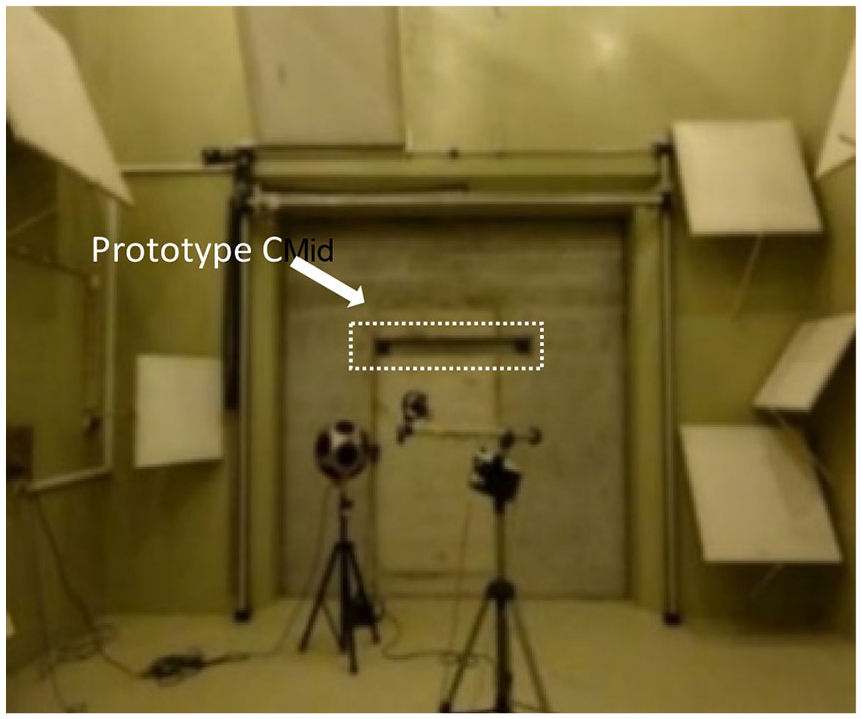
Acoustic experiment: base wall with Prototype C.
Laboratory ventilation tests
Airtightness tests allow assessing the air change rate of the building with the external environment and represents an indirect way of characterising whether an occupied zone has satisfactory IAQ, or not. The air leakage measurements in this work were performed using an automated blower door test (pressurisation method) and aimed to determine the air change rate (ACH) of Prototype C. The ventilation tests took place at the Building Physics and Construction Technology Laboratory at the University of Minho in Guimarães.
First, a Minneapolis blower door was mounted into the door frame of the test room, and all the equipment were set up. Then, the airflow rates of the test room, with and without Prototype C, were evaluated. The test procedures were performed according to the standard EN 13829: 2000 36 and consisted of making measurements of the airflow rate in a range of applied pressure differences from 20 to 60 Pa, in increments of 5 Pa.
The induced pressure gradients associated with the respective airflows were recorded and used by Tectite software to express the permeability results through a power law, according to equation (3).37,38

where C is the flow coefficient, ΔP is the pressure differential between inside and outside of the test room (Pa) and n is a flow exponent which characterises the laminar or turbulent airflow through prototype openings.
Figure 7(a) and (b) shows the plan view of the test room and the blower door installed on the room’s door frame (dimensions in m).

Ventilation test room: (a) Schematic plan view. (b) Blower door installed in the room’s door frame (dimensions in m).
Calculation of the annual energy consumed by prototypes
The power energy consumed by the two fans of the prototypes, in kWh per year, was calculated using equation (4).

where V is the fan’s voltage (Volts), i is the fan’s electric current (Ampères) and th is the average daily number of hours that prototype’s fans are on.
Results and discussion
Analysis and discussion of sound insulation results
The Weighted Sound Reduction Index (Rw) of the base wall and the Weighted Element-Normalised Level Difference (Dn,e,w) of the prototypes, calculated according to the method established in the ISO 717-1 Standard (2013), were used to express the sound insulation performance of the tested elements as a single-number (figure of merit) as shown in Table 2.
Sound insulation test results.

Among the prototypes, Prototype C presents consistently better sound insulation with Dn,e,w of 55 dB, while Prototype A stands out as the least insulating with Dn,e,w of 40 dB. Prototype B revealed an intermediate value, with Dn,e,w of 46 dB. Since sound absorbers are the only difference between prototypes, the increase of 6 and 15 dB in relation to the Dn,e,w value of Prototype A reflect the effect caused by the different sound absorption mechanisms existing in Prototypes B and C and may be attributed to the dissipation of acoustic energy in the reverberant field inside the ducts and cavities of Prototypes B and C, respectively.
In Prototype B, the sound waves vibrate the air inside the multiple quarter-wave resonators and the friction of the air molecules with the metal sheets, which form the resonant cavities, promotes sound dissipation in the frequency at which the resonators are tuned. The dissipation of acoustic energy also occurs, in Prototype B, due to the oscillatory movement of the flat metal sheets (positioned in S2 and S3) when they are excited by low-frequency sounds.
In the case of Prototype C, sound dissipation is caused by air friction within the glass-wool fibres, which is much more significant than that observed in the multiple quarter-wave resonators of Prototype B. This confirms why Prototype C has the better value of Dn,e,w. In addition, it is assumed that the increase in air pressure and air speed caused by the internal fans in the ventilation path of Prototype C may also contribute to improving the efficiency of the sound-dissipative mechanism, in the glass-wool.
However, the Weighted Element-Normalised Level Difference, as a single-number, is not enough to clarify the differences in the sound insulation characteristics of each prototype. A more comprehensive depiction of these differences is better evaluated by the Element-Normalised Level Difference in 1/3-octave centre frequency bands. Figure 8 presents the sound insulation of the base wall.

Sound insulation curve: (a) Prototypes A and B. (b) Prototypes A and C. (c) Prototypes B and C.
The noise reduction performance of Prototypes A and B are analysed in Figure 9(a). We can see two distinct regions where the curves are further apart from each other, due to the effect of the specific sound absorbers within Prototype B. From 100 to 630 Hz, the increase in noise reduction performance is linked to the vibration of the metal sheets. In contrast, the peak of the curve around 1250 Hz is related to the resonance frequency of multiple quarter-wave resonators.

Sound insulation curves of Prototypes A, B and C.
Figure 9(b) compares the noise reduction performance of Prototypes A and C. As can be seen in the plot, the sound insulation improvements in Prototype C are higher from 400 to 2500 Hz 1/3-octave centre frequency band. The absence of sound-absorbing materials in Prototype A, meaning less sound impedance and mass per unit area, facilitates sound transmission thought prototype’s components.
Figure 9(c) elucidates the contrast in sound insulation between Prototypes B and C, where the best performance of Prototype C is clearly seen across the spectrum, especially at medium and high frequencies.
Figure 10 presents a comparison of the noise reduction performance of Prototype C, considering fans turned On and Off.
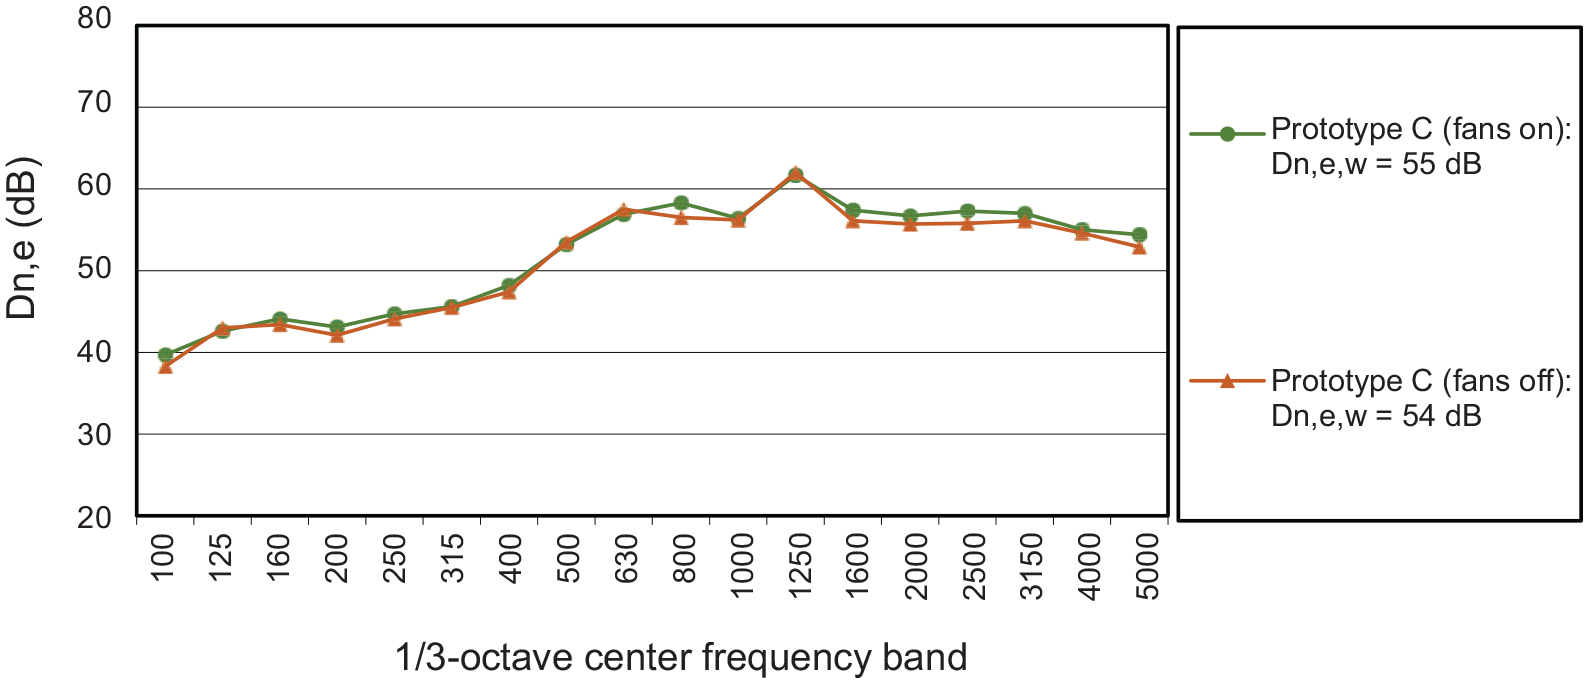
Sound insulation curves of Prototype C with fans On and Off.
The two curves are practically coincident, and the values of Dn,e,w for the situations considered (55 and 54 dB) are very close, showing that the noise generated by the axial fans did not interfere with the sound insulation results. The difference of 1 dB is due to the adjustments in the curve of reference values, according to standard ISO 717-1. Figure 11 shows the SPL, in dB(A), produced by the two fans within the ducts of Prototype C, measured in the sound receiving chamber.

Noise emitted by fans in Prototype C in dB(A).
The dotted line in Figure 11, at frequencies above 500 Hz, is associated with the measurement uncertainty factor due to the sensitivity and internal noise of the transducer, as well as the type of acoustic chamber used in the measurements (reverberant chamber). In Figure 11 it can be seen more sound energy from 100 to 400 Hz 1/3-octave centre frequency band, where the resistive absorber is less effective to reduce noise. On the contrary, in the frequency range from 500 to 2500 Hz, it’s clear the effect caused by the high sound absorption coefficient of the glass-wool with perforated metal sheet. 30
The maximum noise level emitted, 20.5 dB(A), occurs in the frequency band of 315 Hz and the equivalent continuous A-weighted noise level is lower than 25 dB(A) which is the recommended ambient sound level for a furnished unoccupied private house during the night. 39 Thus, it is expected that the level of annoyance originated by the noise emitted by the prototypes will be low.
Calls the attention, in the curve presented in Figure 10, two peaks of sound energy around the frequencies of 315 and 800 Hz. The tonal noise due to the fan inflow within the duct of a ventilator is predicted by equation (5). 40

where vn is the nth harmonic frequency (Hz), n = 1,2,3,. . ., k is the number of fan blades and N is the speed of the fan in revolutions per minute. In fact, from the characteristics of the fans used in the prototypes (see Table 1) and taking n = 1 for the fundamental and n = 3 for the second harmonic, results in v1 = 270 Hz and v3 = 810 Hz. The calculated resonant frequencies are very close to the two peaks in 315 and 800 Hz of Figure 10, indicating that noise related to these frequencies inherits tonal characteristics.
Although the geometry and operation of the prototypes are relatively simple, the role played by the mechanical interactions of their components, in the sound insulation performance, is highly complex and would be better understood by the finite element method - FEM, which is beyond the scope of this work.
Analysis and discussion of ventilation results
Figure 12 shows the permeability results obtained for the test room, with and without Prototype C.

Permeability results: test room with and without Prototype C.
The linear regression lines in Figure 12 comes from the analytical expression in equation (3) and show how the airflow rate (Q) varies with changes in pressure differentials. The upper right part of Figure 12 presents the values of the Equivalent Leakage Area (EqLA) for each ventilation test. As defined by the National Research Council of Canada, the EqLA is the area (in cm²) of a sharp-edged orifice that would leak the same amount of air, as the building does at a pressure of 10 Pa. 40
At an induced pressure difference of 10 Pa, the installation of Prototype C on the test room wall increased the permeability of the room envelope by 38%, due to the device's inlet and outlet openings (A1, A2, A3 and A4). This fact explains the higher value of the airflow for this test configuration (blue line).
Table 3 summarises the coefficients C and n for each ventilation test (according to equation (3)), as well as the metrics of Q50 and ACH50 at 50 Pa. It was considered the volume V50 = 28.54 m³, corresponding to the test room volume.
Values of C, n, ΔP, Q50 and ACH50.

The ACH50 in Table 3, was calculated according to equation (6). 41

where Q50 is the airflow rate at 50 Pa (m³ . h−1) and V50 is the test room volume (m³). The air change rate of Prototype C at 50 Pa (ACHPC) was obtained using the values of Table 3 in equation (7).

where ACHR + PC is the air change rate of test room with Prototype C (h−1), ACHR is the air change rate of test room without Prototype C (h−1) and n is the number of ducts in Prototype C (n = 2). It follows that ACHPC = 3.7 h−1 at 50 Pa.
The dimensionless flow exponent n, mentioned in equation (3), is a parameter that provides information relative to the resistance of the airflow passage through the openings. 40 The theoretical limit of the n value is within the range of 0.5 to 1. 40 In fully turbulent flow, n tends to approach 0.5 while in fully laminar flow, n approaches 1.
In the case of the ventilation test with Prototype C (see Table 3), n assumed an intermediate value of 0.678. This means that the airflow has adopted a turbulent character, of varying intensity, caused by the resistive sound absorbers and the tortuous ventilation path of the internal geometry in Prototype C, as expected. However, the airflow impedance was not enough to hamper the ventilatory performance of the device.
Pre-defined air change rates, as an input parameter in the building design stage, is an indirect way to ensure satisfactory IAQ in occupied zones. 38 At the international level, different countries have different regulations and standards about minimum air change rates. In the case of residential buildings, it usually varies from 0.4 to 0.7 h−1. Assuming the limit of the static pressure, for the fans used in Prototype C, is within the range 15 to 22 Pa and taking the values of the coefficients C and n in Table 3, it’s possible to calculate the ACH of Prototype C for this pressure range using equations (3) and (7). It follows that ACHPC at 15 and 22 Pa are 1.54 and 2.04 h−1, respectively.
Comparing these results with the average air change rates for residential buildings mentioned before (0.4–0.7 h−1), one can infer that Prototype C meets that range of ventilation requirements.
Permeability versus acoustic efficiency
Figure 13 shows the CFD simulation results (with Phoenics software) of the air velocity at central point in the cross-sectional area (see probe position) of the air intake duct of Prototypes A, B and C. For the CFD simulations, the fan’s speed was set at 5.65 m/s.

CFD simulations of air velocity: (a) Prototype A. (b) Prototype B. (c) Prototype C.
Based on the CFD simulation results, it was calculated the airflow rate of each prototype, as shown in Table 4. These calculations were carried out considering the volume of the airtightness test room (28.54 m³) and the cross-sectional area of the air intake duct at the probe position (0.0035 m²).
CFD simulation results of Prototypes A, B and C.
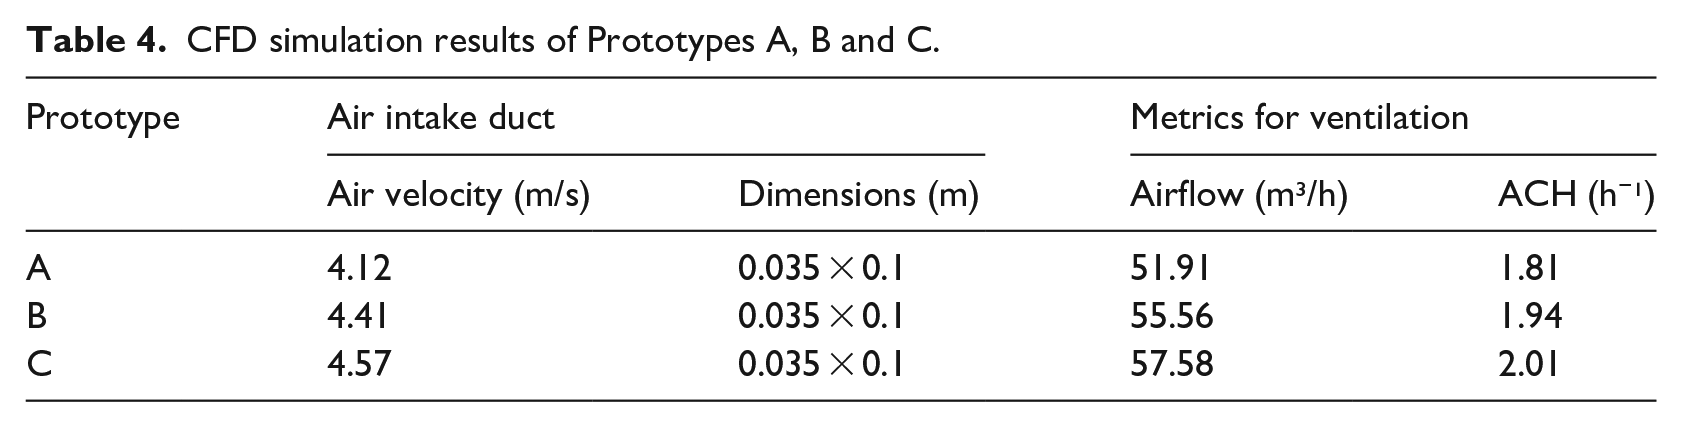
The results presented in Table 4 reveal that ACH values are close and meet the ventilation requirements. In addition, it is also verified a convergence between the simulated ACH of Prototype C and its measured value (1.54–2.04 h−1) obtained in section ‘Analysis and discussion of ventilation results’ for a pressure range of 15 of 22 Pa.
Table 5 shows an example of how the sound insulation and ventilation performance of a 47 dB lightweight steel-framed façade’s wall 42 vary when Prototypes A, B and C are installed, and then replaced by an opening for natural ventilation with the same average airflow rate as the prototypes (55.0 m³/h) and with Dn,e,w calculated according to ISO 12354-3, for unsilenced air inlets.
Base wall with and without prototypes.
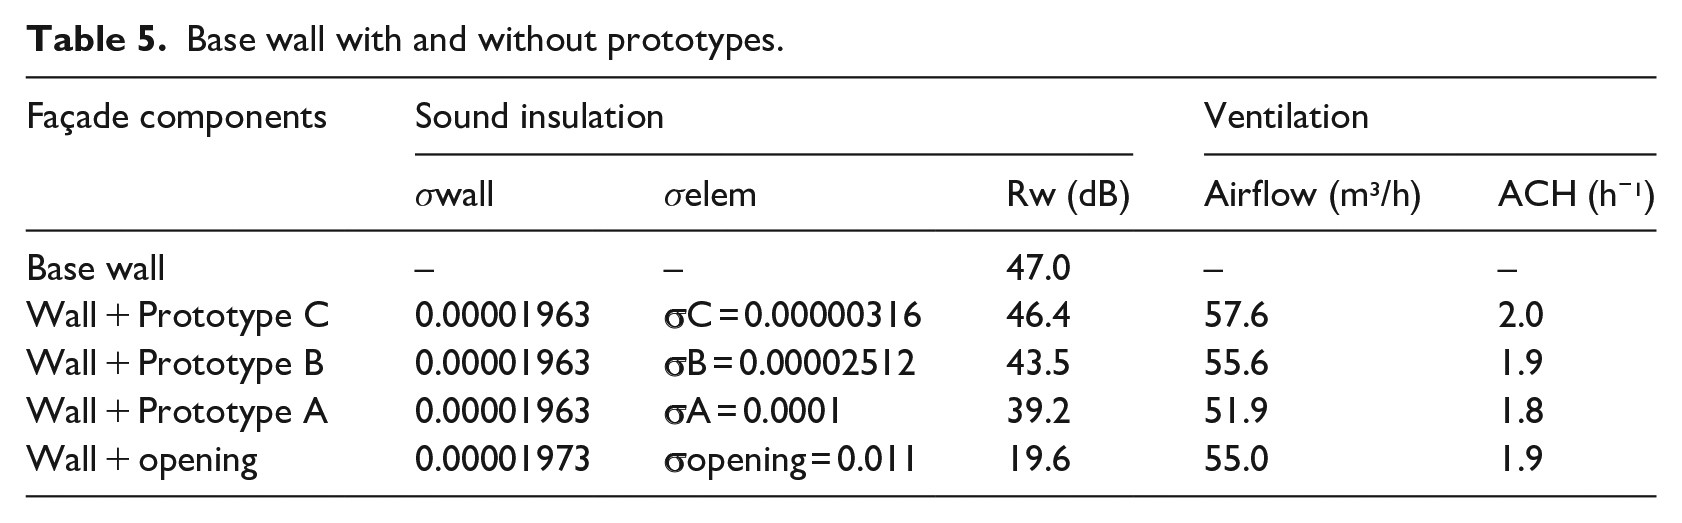
For the calculations in this example, it was used the ventilation results of Table 4 and the following boundary conditions: room volume = 28.54 m³ and incident air velocity for natural ventilation = 5.65 m/s.
For a natural ventilation opening to have the same average airflow rate as the prototypes (55 m³/h), its opening area must be 0.11 m². This calculation was performed according to equation (8), based on the concept of Ventilation Ratio, 43 which means the airflow rate brought into a naturally ventilated building across a ventilation opening.

where A is the effective area of the opening available for ventilation (m²), VR is the ventilation ration (m³/s) and V is the airflow velocity in the opening (m/s).
The sound insulation of the wall with and without prototypes, in Table 5, was calculated according to the procedures of ISO 12354-3 standard, as shown in equation (9) 44 :

where σe,i is the sound power ratio of radiated sound power by a façade element i due to direct transmission of incident sound on this element, relative to incident sound power on the entire façade. The eventual flanking transmissions for in situ applications are not taken into account in these calculations.
The sound power ratio of radiated sound power by the façade element, Prototypes A, B and C (small technical elements), was calculated using equation (10) (paragraph 4.2.2 of 44 ).

where A0 = 10 m², Dn,e,i is the element normalised sound level difference of each prototype (dB) and S is the total area of the façade as seen from the inside (i.e. the sum of the area of all elements) (m²).
The sound power ratio of radiated sound power by the wall element was calculated using equation (11) (paragraph 4.2.3 of ISO 12354-3:201744).

where Rwall is the sound reduction index of the wall (dB) and S is the area of the wall (m²).
The element normalised level difference of the natural ventilation opening was obtained using equation 12 (paragraph D.3 of ISO 12354-3:2017 44 ).

where Sopen is the area of the opening (m²) and A0 is the reference equivalent sound absorption area for dwellings, given as 10 m².
The results presented in Table 5 show that the use of the prototypes on the base wall of the previous example increases the wall’s permeability from zero to an average value of 1.9 h−¹. At the same time, the sound insulation of the wall (47 dB) decreases to an average value of 43 dB, since the sound insulation of the prototypes is high. On the contrary, when replacing the prototypes by an unsilenced opening for natural ventilation, with the same average airflow rate as the prototypes (55.0 m³/h) and the necessary opening area of 0.11 m², the overall sound insulation of the façade drops from an average value of 43 dB to only 19.6 dB.
Energy consumption and sustainability aspects
From the characteristics of the prototype’s fans presented in Table 1, and taking for instance th = 10 in equation (4), the annual energy consumed by the prototype will draw 17.52 kWh per year.
Considering that average household electricity prices in European Union are around EUR 0.20 per kWh, 45 results that the value of the electricity consumed by the device, in this example, is negligible (EUR 3.50 per year).
Conclusion
The primary goal of this work was to evaluate the effect of resistive and reactive passive sound absorbers on the noise reduction performance of a decentralised mechanical ventilator for façades. To that end, three prototypes were proposed and evaluated experimentally in acoustic chambers, for rating the element-normalised level difference (Dn,e) and the weighted element-normalised level difference (Dn,e,w). The results of the acoustic experiments revealed the following:
Overall, Prototype C, lined with resistive sound absorbers, shows the best noise reduction performance with Dn,e,w values of 55 dB and improvements of 15 and 9 dB over the performances of Prototype A, with no sound absorbers, and Prototype B, with reactive sound absorbers;
Broadband absorption using coated glass-wool and perforated metal sheets, in Prototype C, proved to be more effective in mitigating noise than multiple quarter-wave resonators and flat metal sheets in Prototype B, all over the 1/3-octave centre frequency band, and is linked to more dissipation of the acoustic energy in the reverberant field within the prototype’s ducts and cavities;
The peak in the sound insulation of Prototype B at 1250 Hz, next the resonance frequency predicted for the quarter-wave resonators in 1307 Hz, highlights the potential of this type of strategy to reduce tonal noise in ventilation ducts;
Ventilation noise of prototypes does not significantly interfere with the sound insulation results, and it is expected that does not compromise the acoustic comfort;
Different noise reduction performances, provided by Prototypes A, B and C, indicate the feasibility of using each ventilator according to different levels of exterior noise affecting the building;
Further study using finite elements method (FEM) would be necessary to understand, more precisely, the role played by the vibration of the prototype’s components in the sound insulation performance.
Regarding the airtightness tests with the blower door, it has been shown that Prototype C is capable of providing adequate air change rates, despite the airflow restrictions caused by the resistive sound absorbers and tortuous duct’s geometry. Power energy consumption related to the developed device can be considered irrelevant, when compared to other forms of ventilation in buildings, such as in the case of centralised ventilation systems.
CFD simulations allowed the following conclusions regarding the relationship between permeability and sound insulation of the prototypes:
Prototypes A, B and C have similar ventilation performance;
The use of the proposed devices in an airtight base wall with good sound insulation does not modify notably the sound insulation performance of the wall while improving its air change rates;
Compared to a natural ventilation system, with the same opening area and the same boundary conditions, the proposed devices provide better air change rates and higher sound insulation values.
The authors hope that this work can be useful to outline the construction of environments with higher quality and sustainability.
Footnotes
Appendix 1
Acknowledgements
The authors acknowledge Itecons, Coimbra, for conducting the acoustic laboratory measurements. The authors are also grateful for the support of Mr Peter Spalding of the CHAM company, UK, who kindly ceded the Phoenics-Flair software license for CFD simulations.
Declaration of conflicting interests
The author(s) declared no potential conflicts of interest with respect to the research, authorship, and/or publication of this article.
Funding
The author(s) received no financial support for the research, authorship, and/or publication of this article.
